
Modeling and Predicting the Cell Migration Properties from Scratch Wound Healing Assay on Cisplatin-Resistant Ovarian Cancer Cell Lines Using Artificial Neural Network


Abstract
:1. Introduction
2. Materials and Methods
2.1. Assembling Scratch Wound Healing Migration Assay Data for the ANN Model
2.1.1. Cell Culture
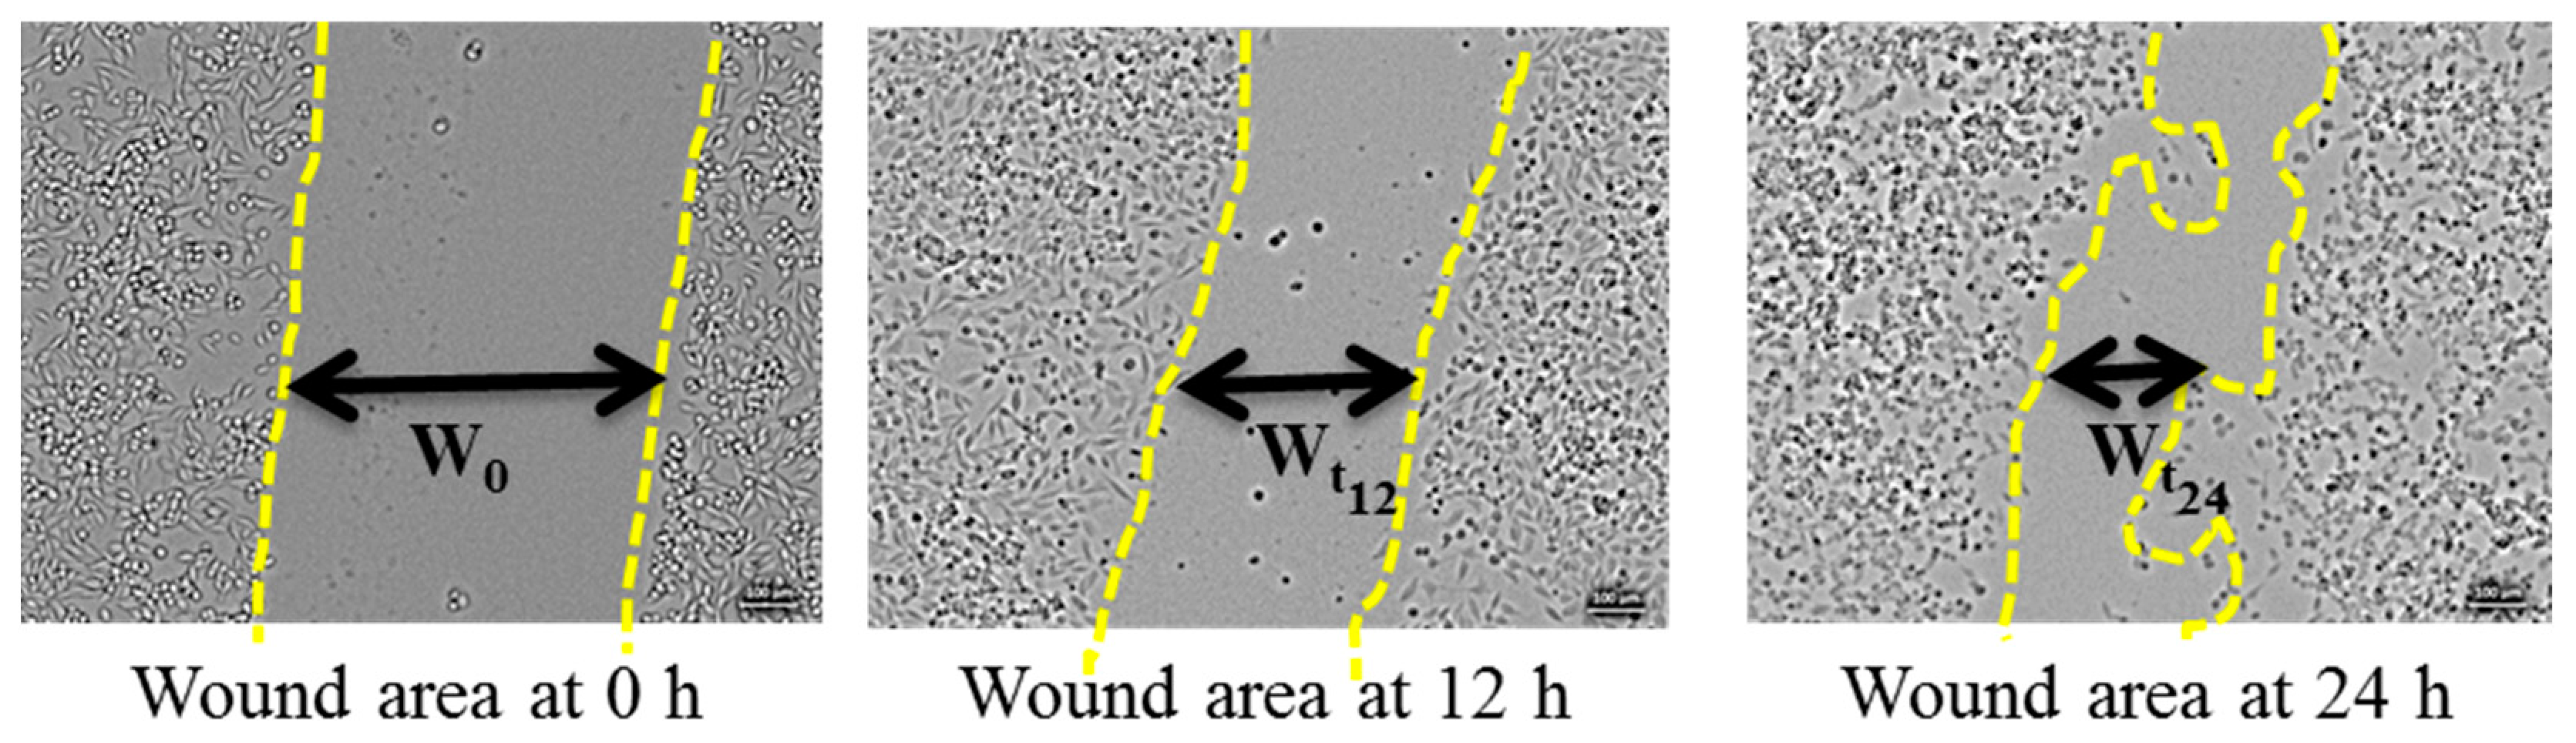
2.1.2. Scratch Wound Healing Migration Assay
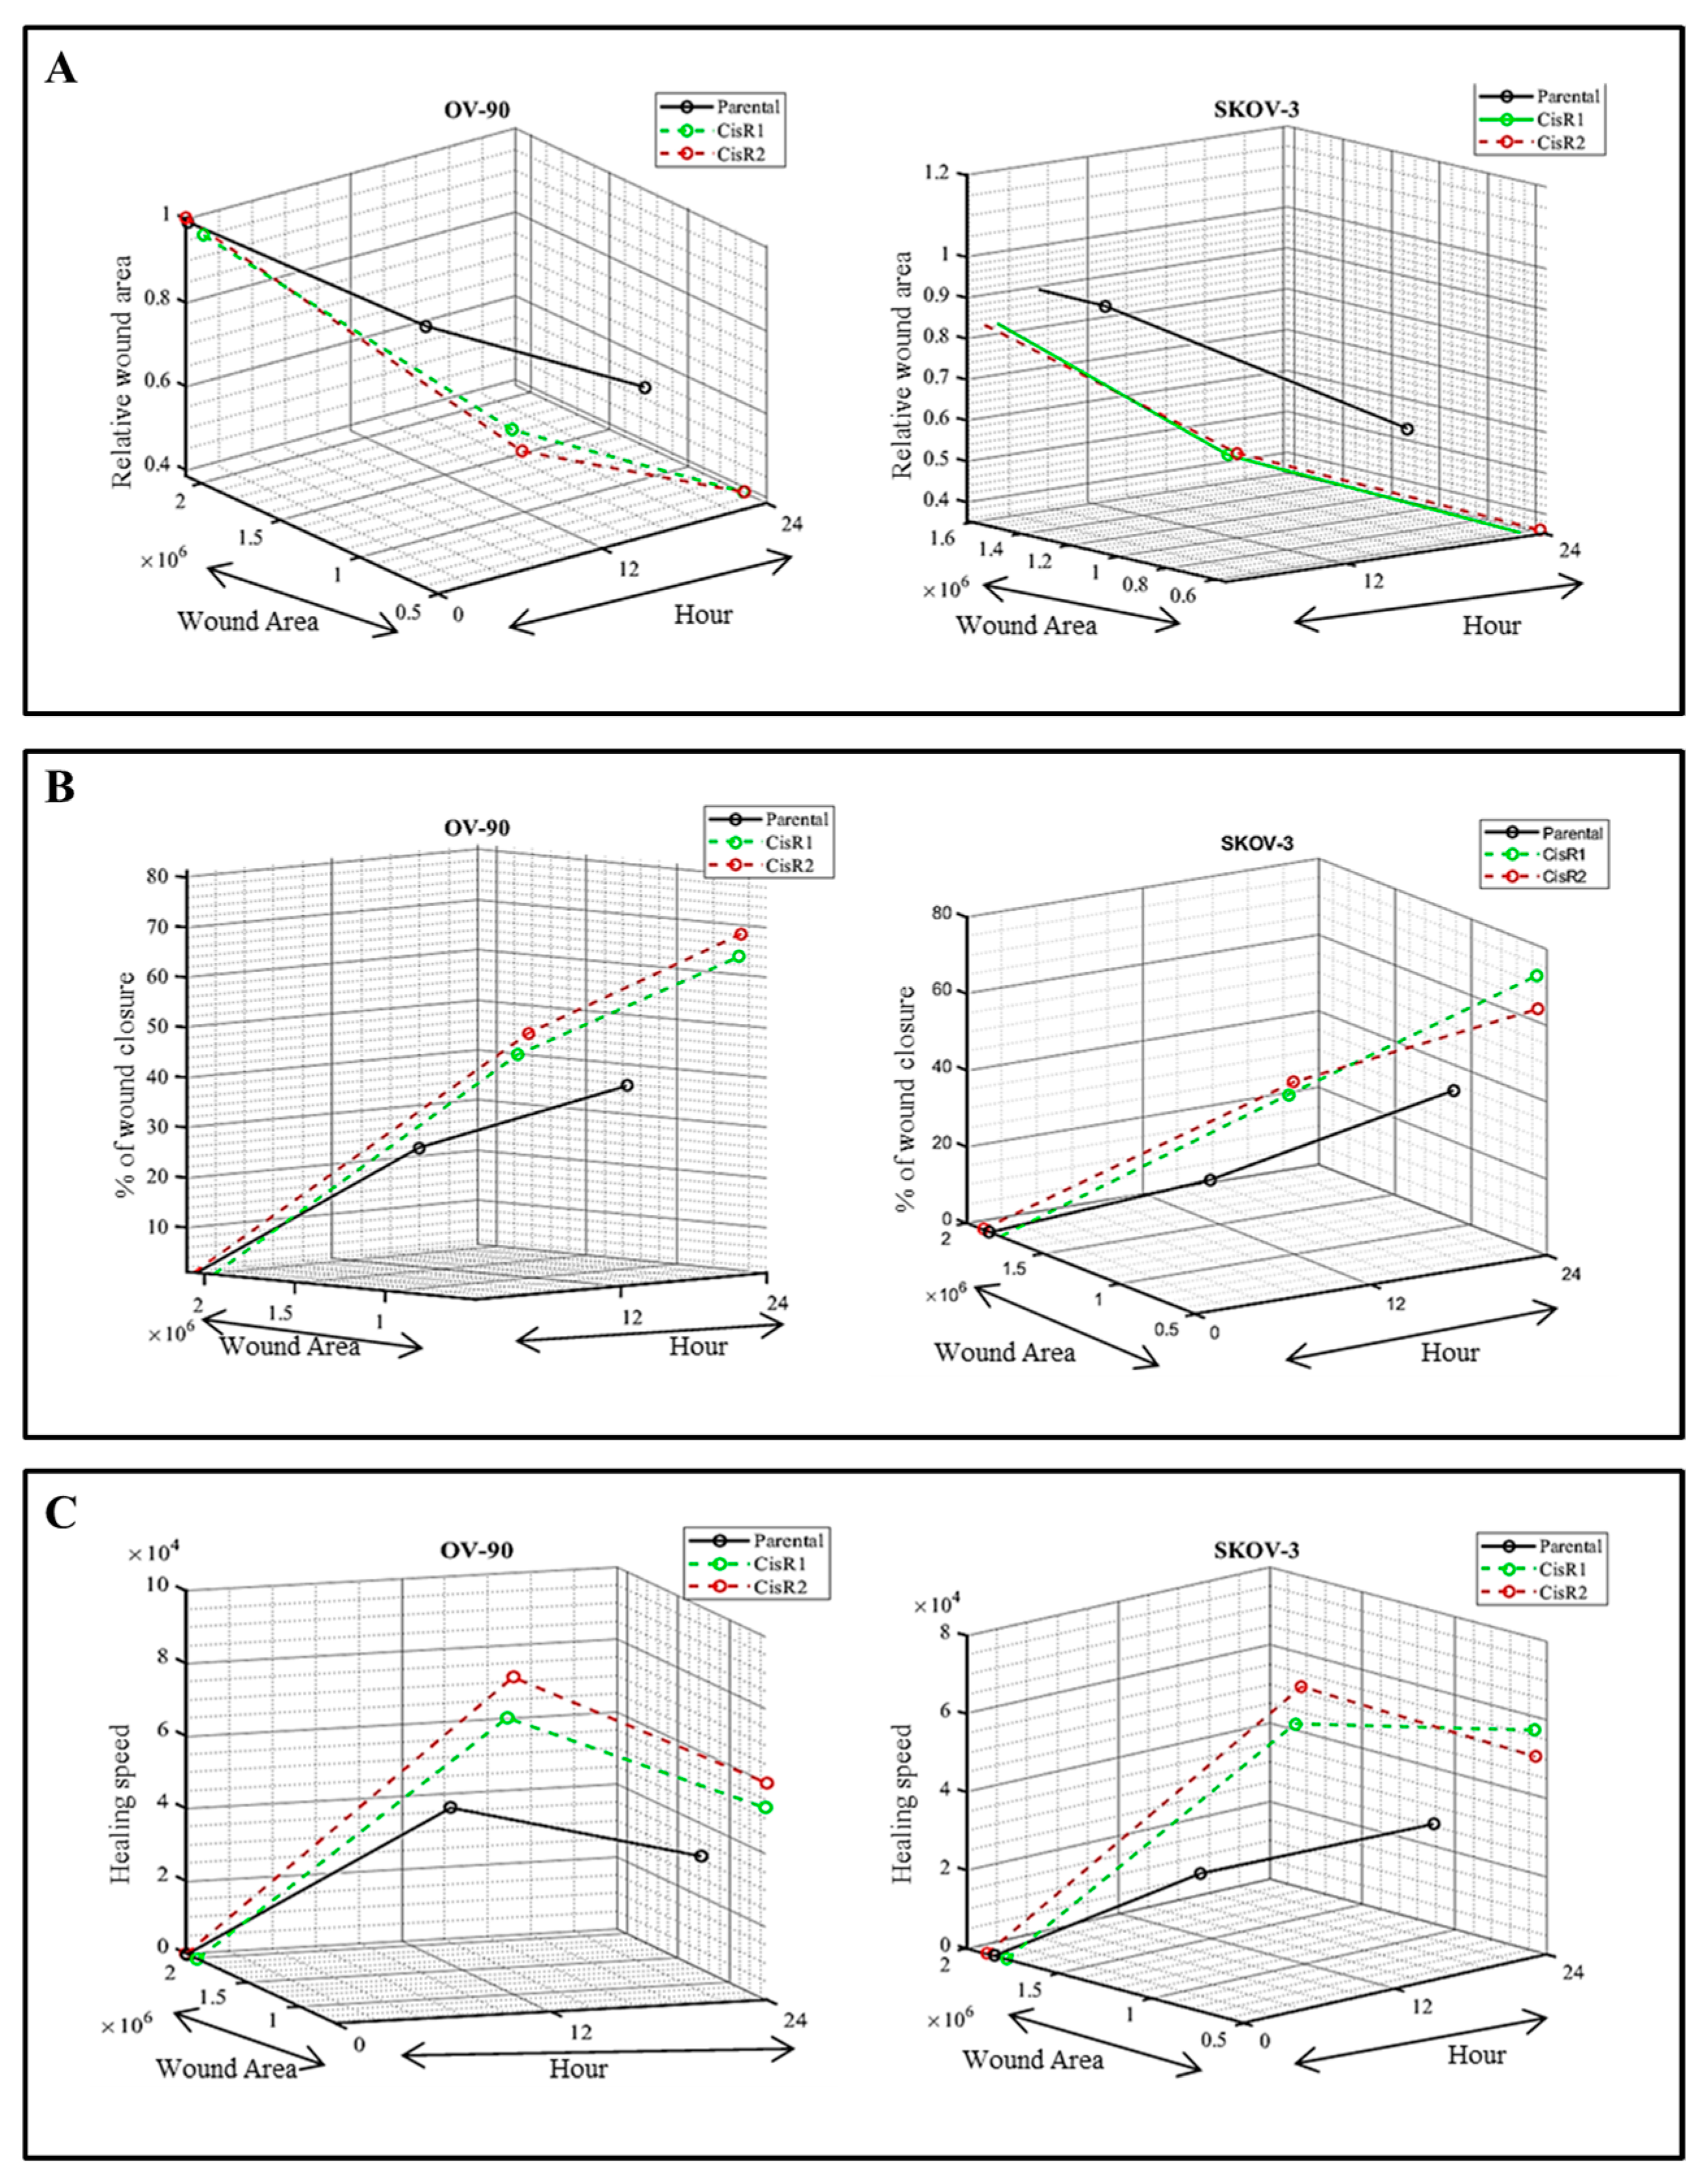
- W0 = Wound area at 0 h (µm2)
- Wt = Wound area at ∆h (µm2)
- ΔT = Duration of wound measured (h)
2.2. Modeling Approach
2.2.1. Automated Analysis by Machine Learning Toolbox
2.2.2. Support Vector Regression (SVR)
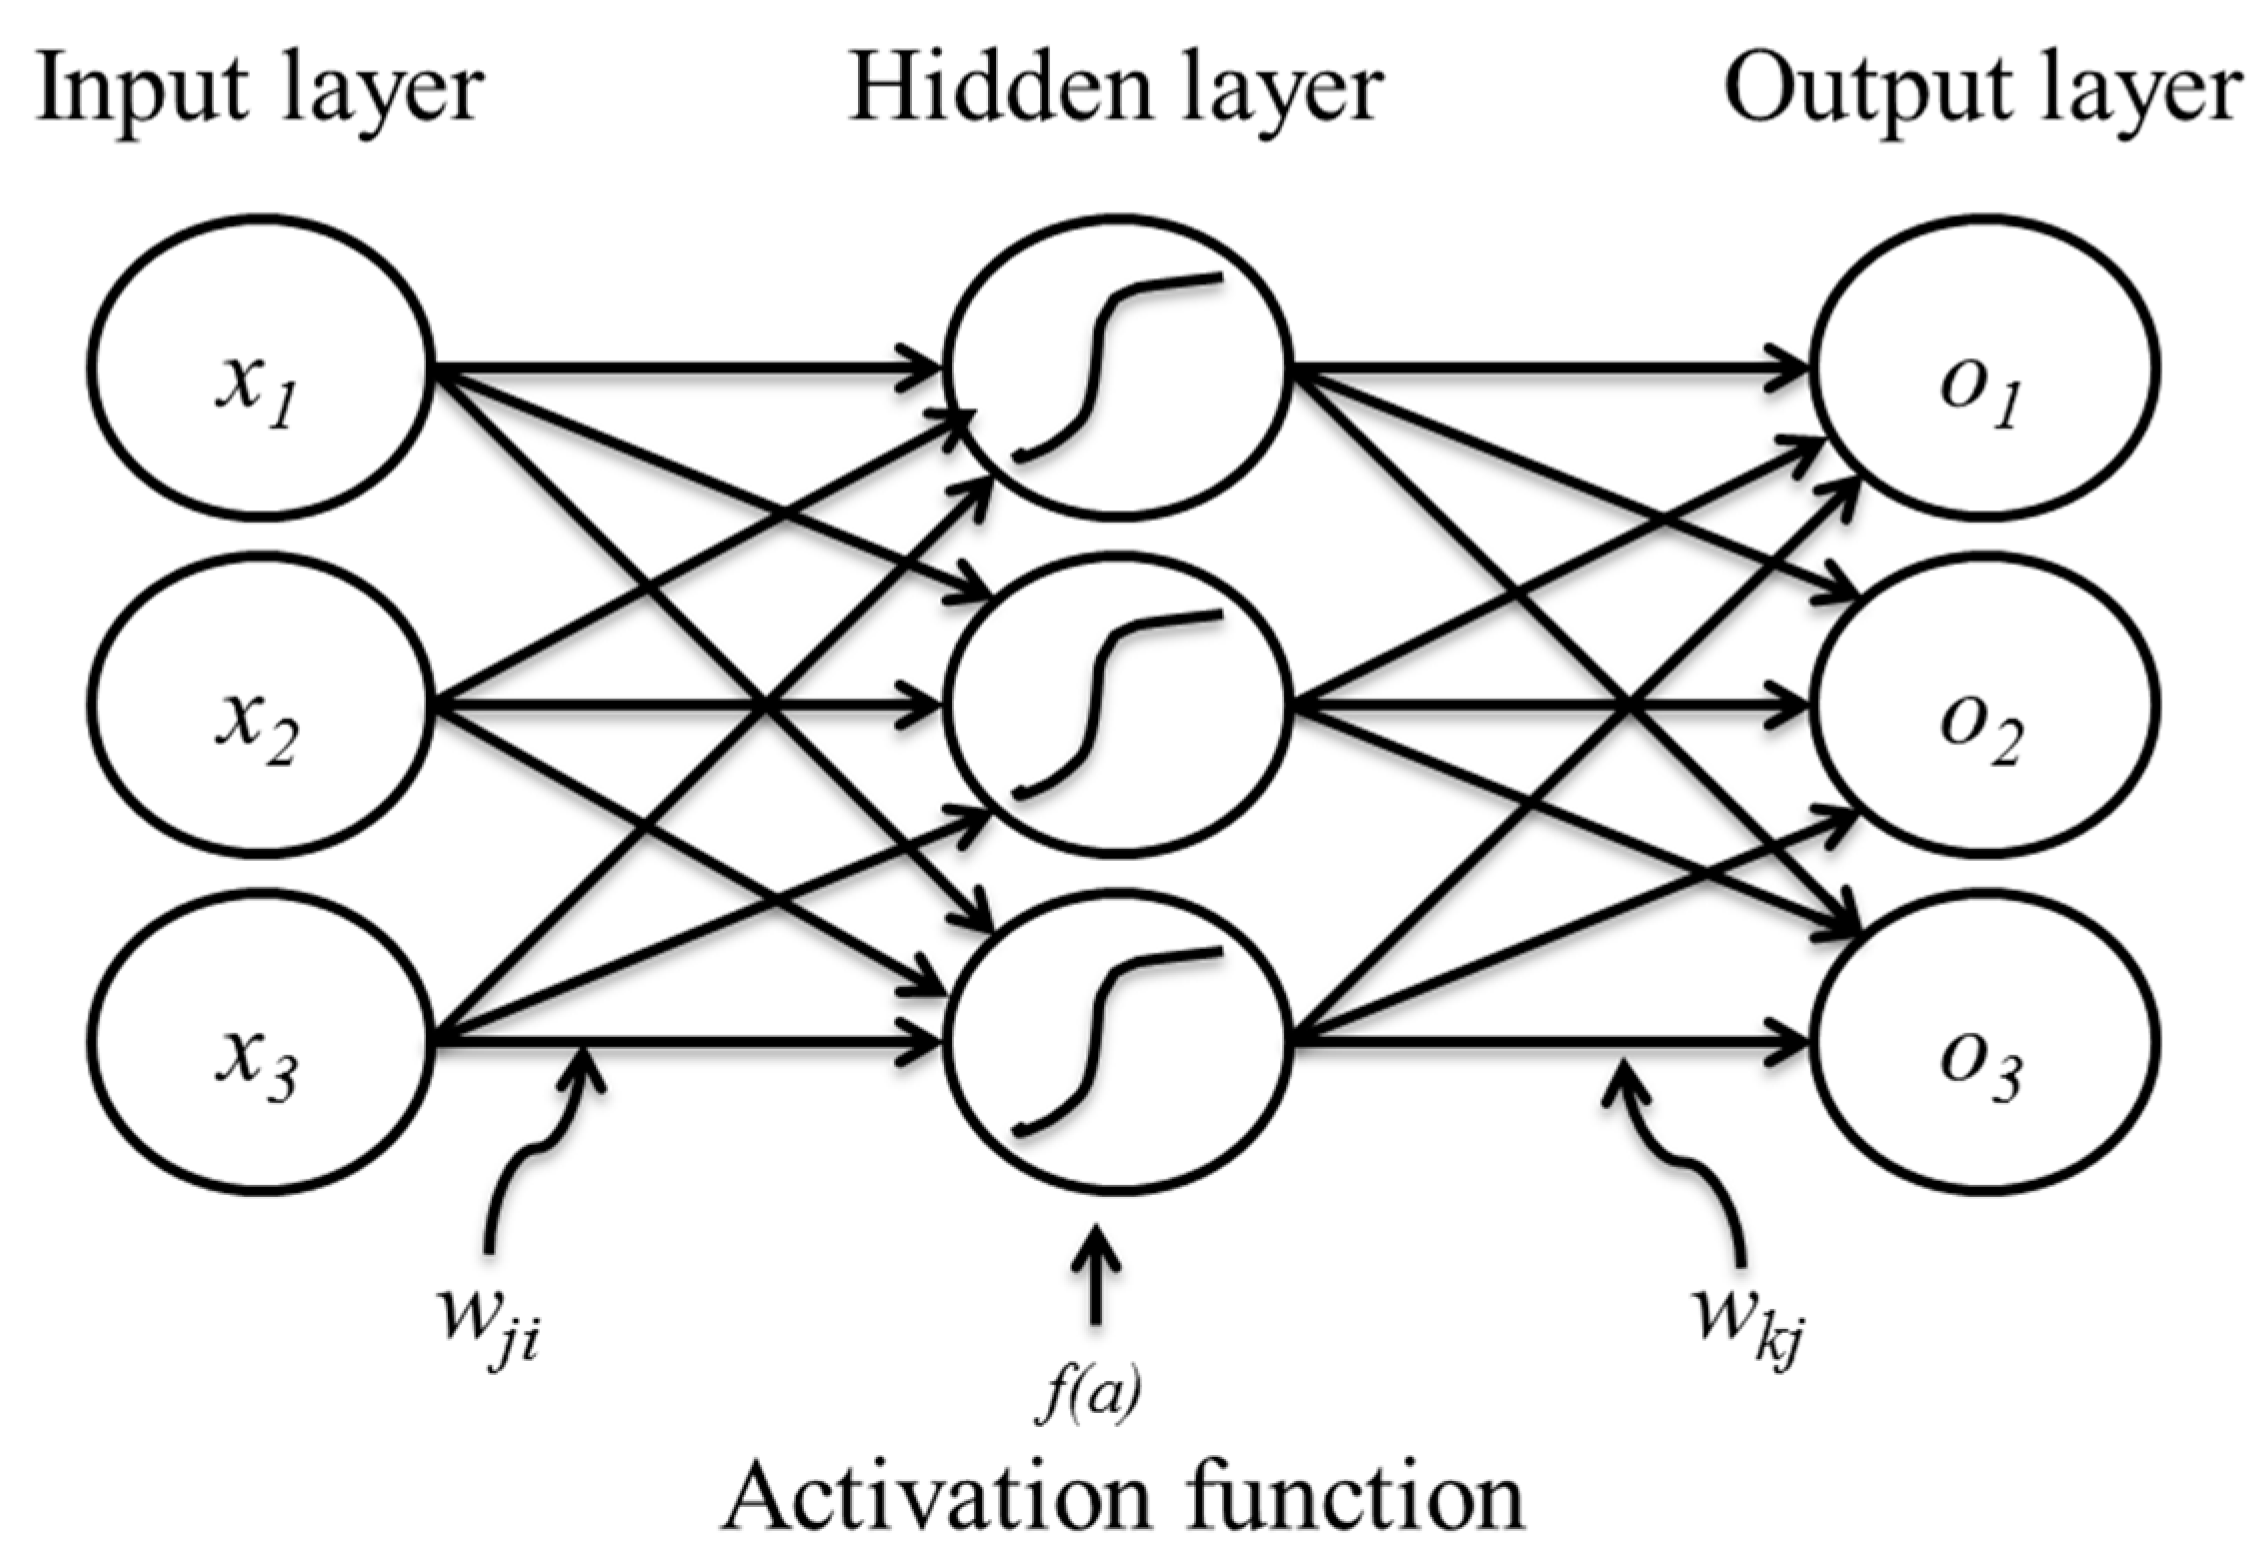
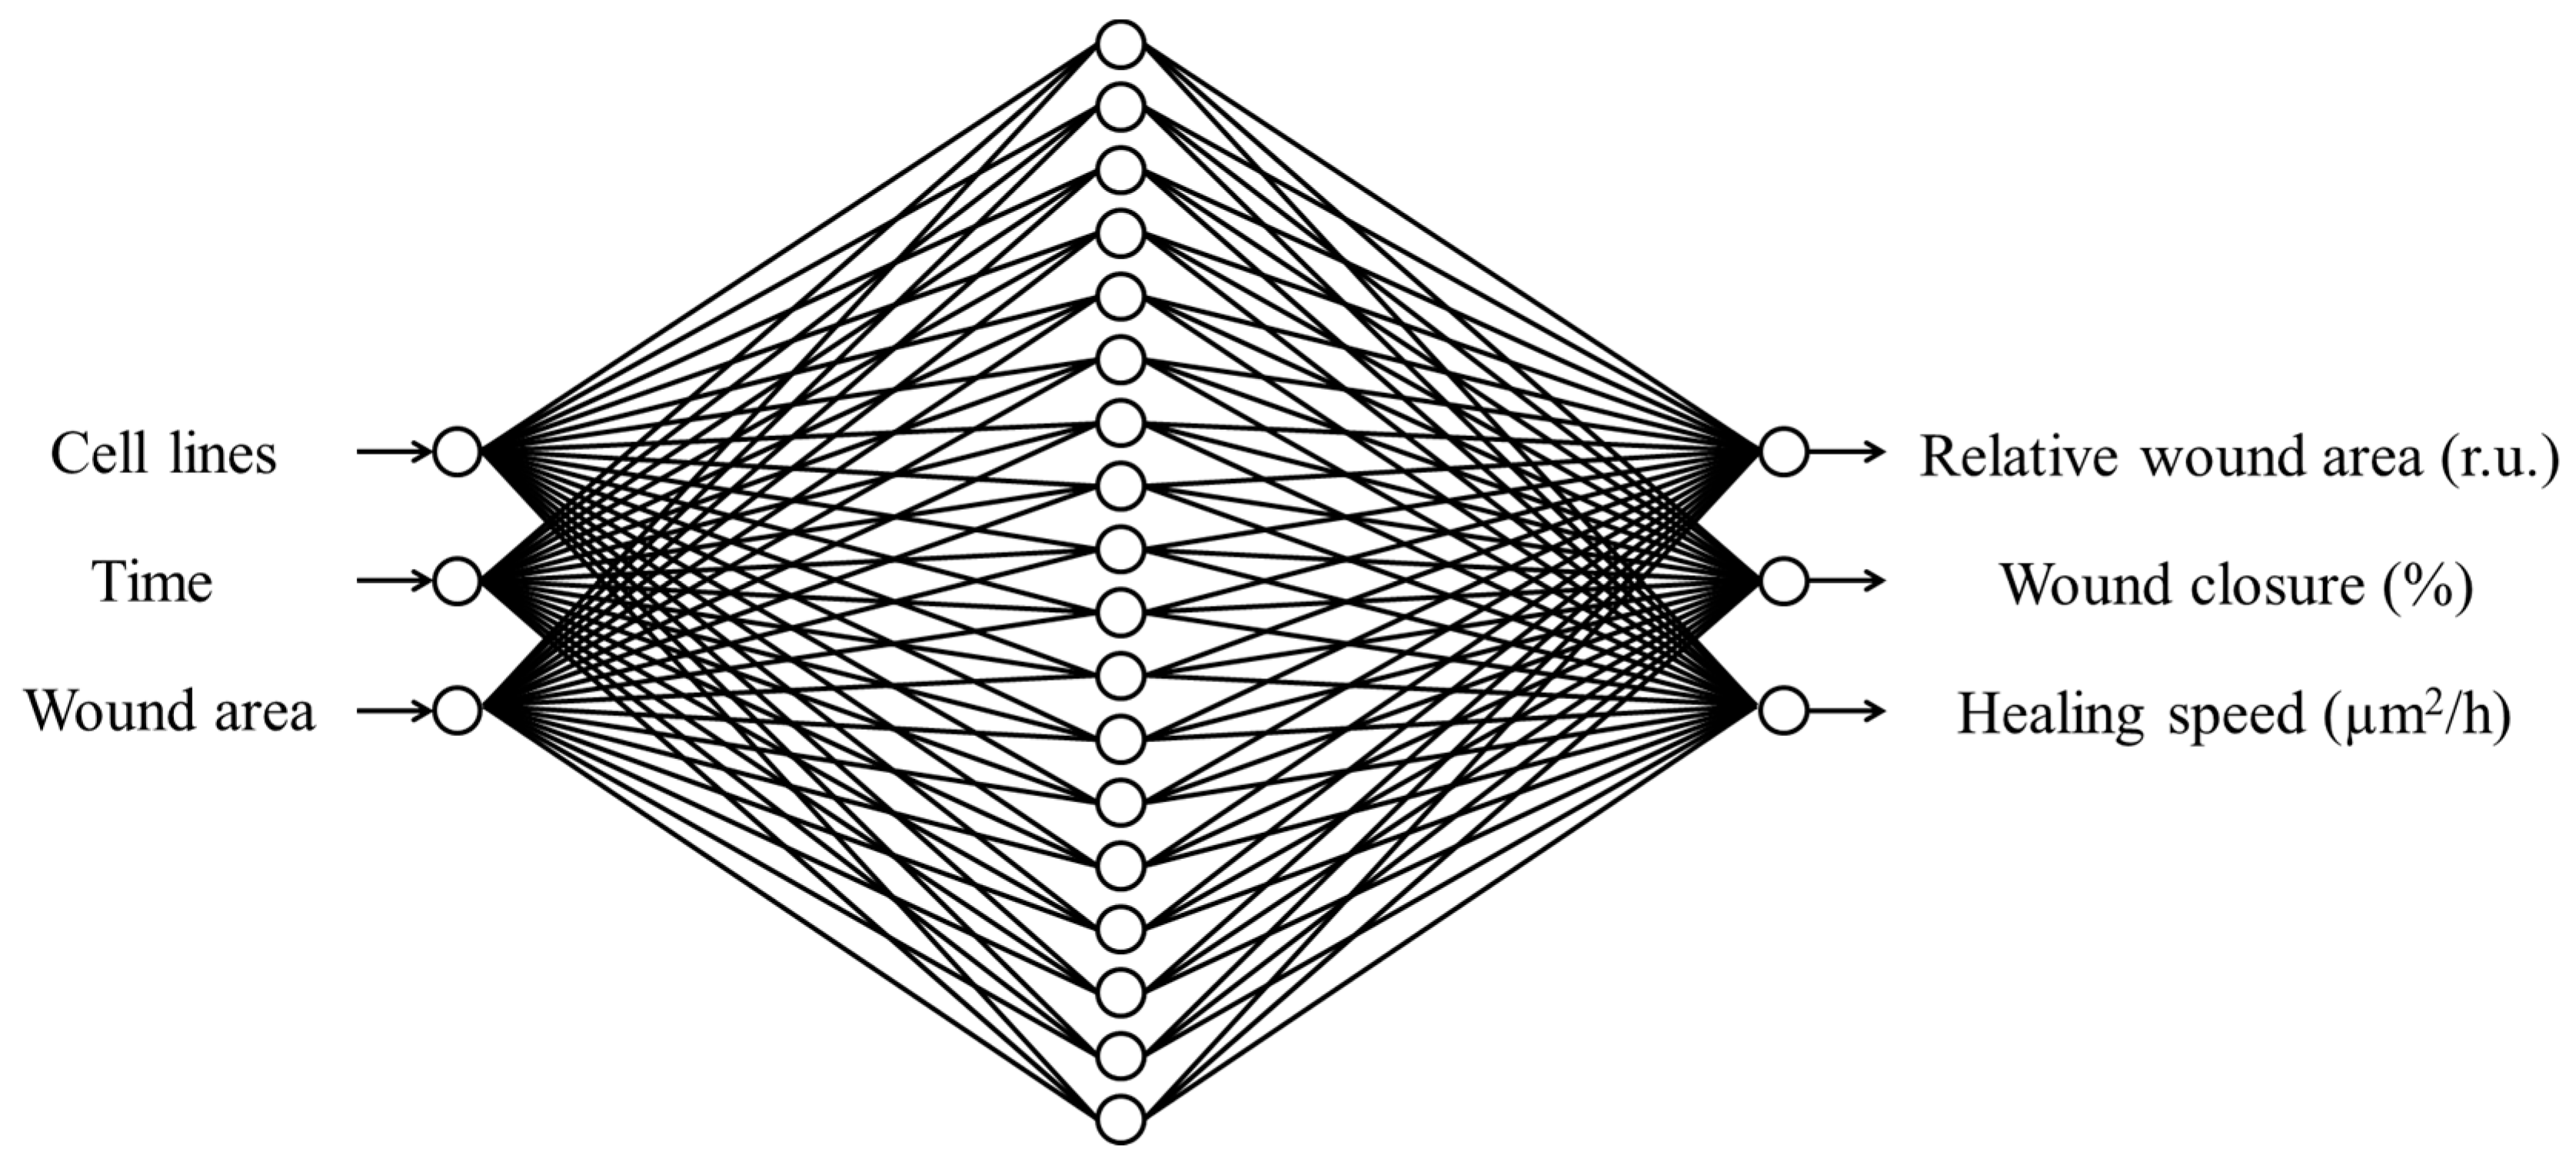
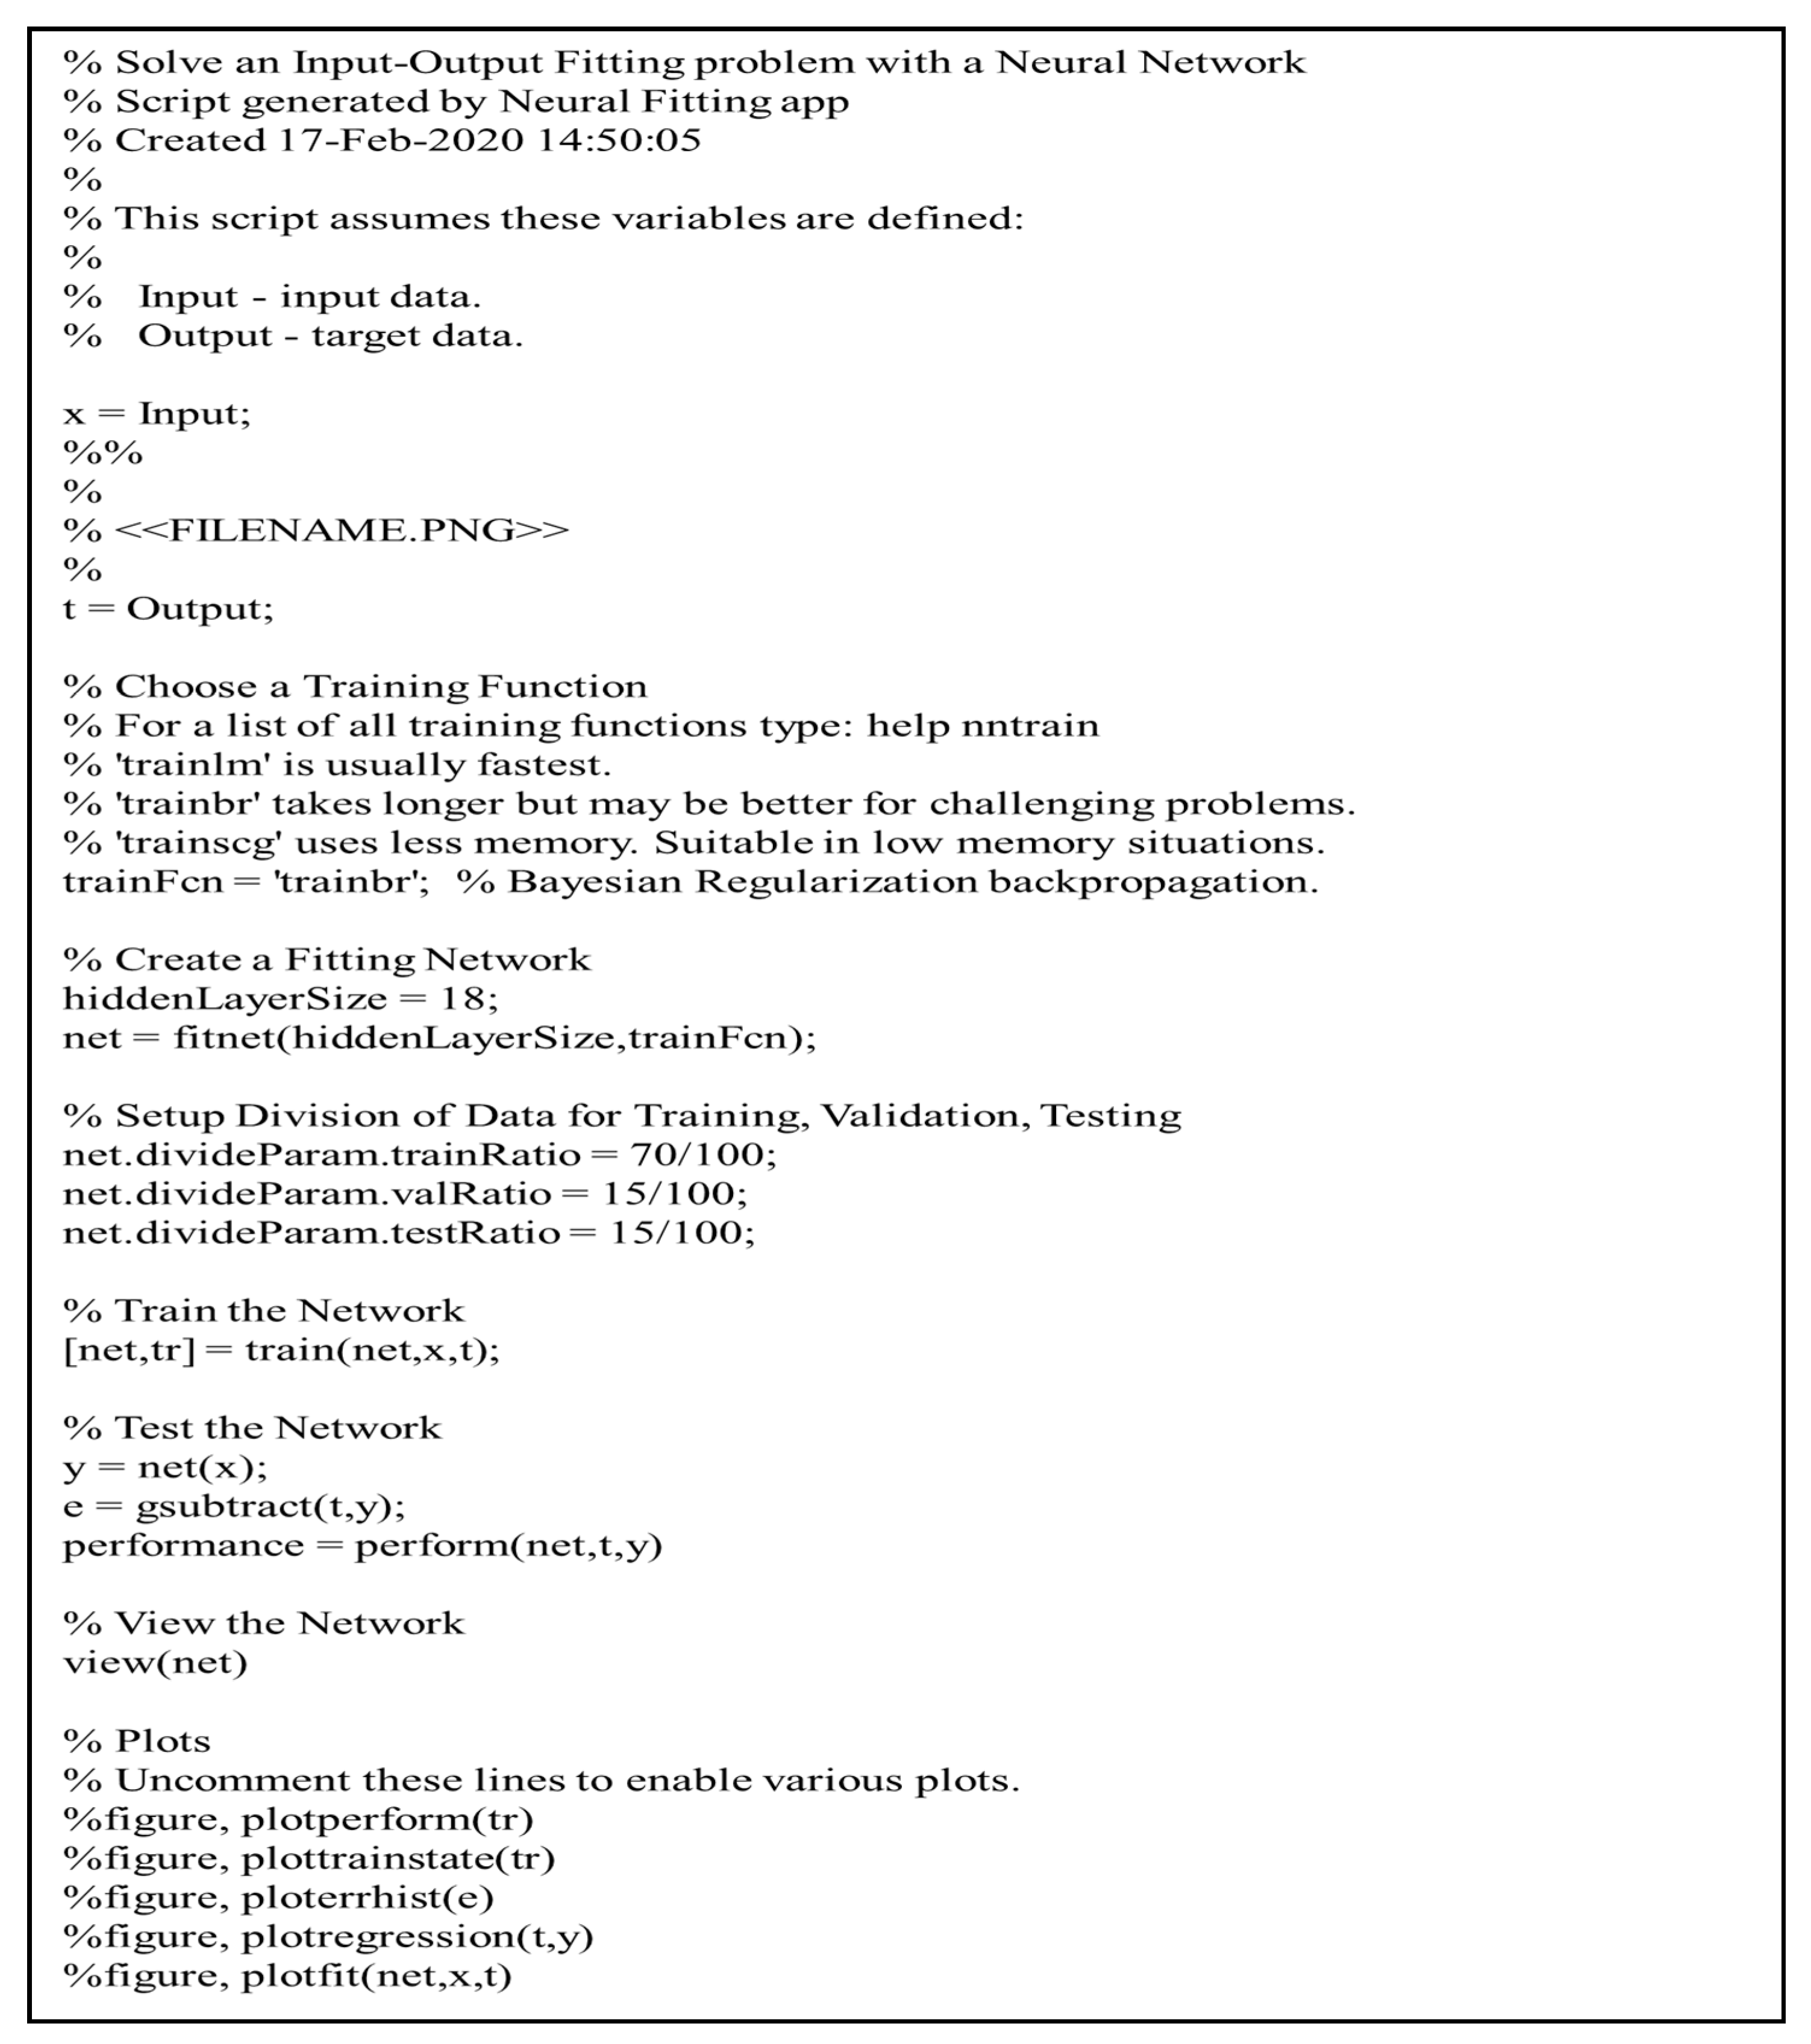
2.2.3. Multilayer Feedforward Neural Network (FNN)
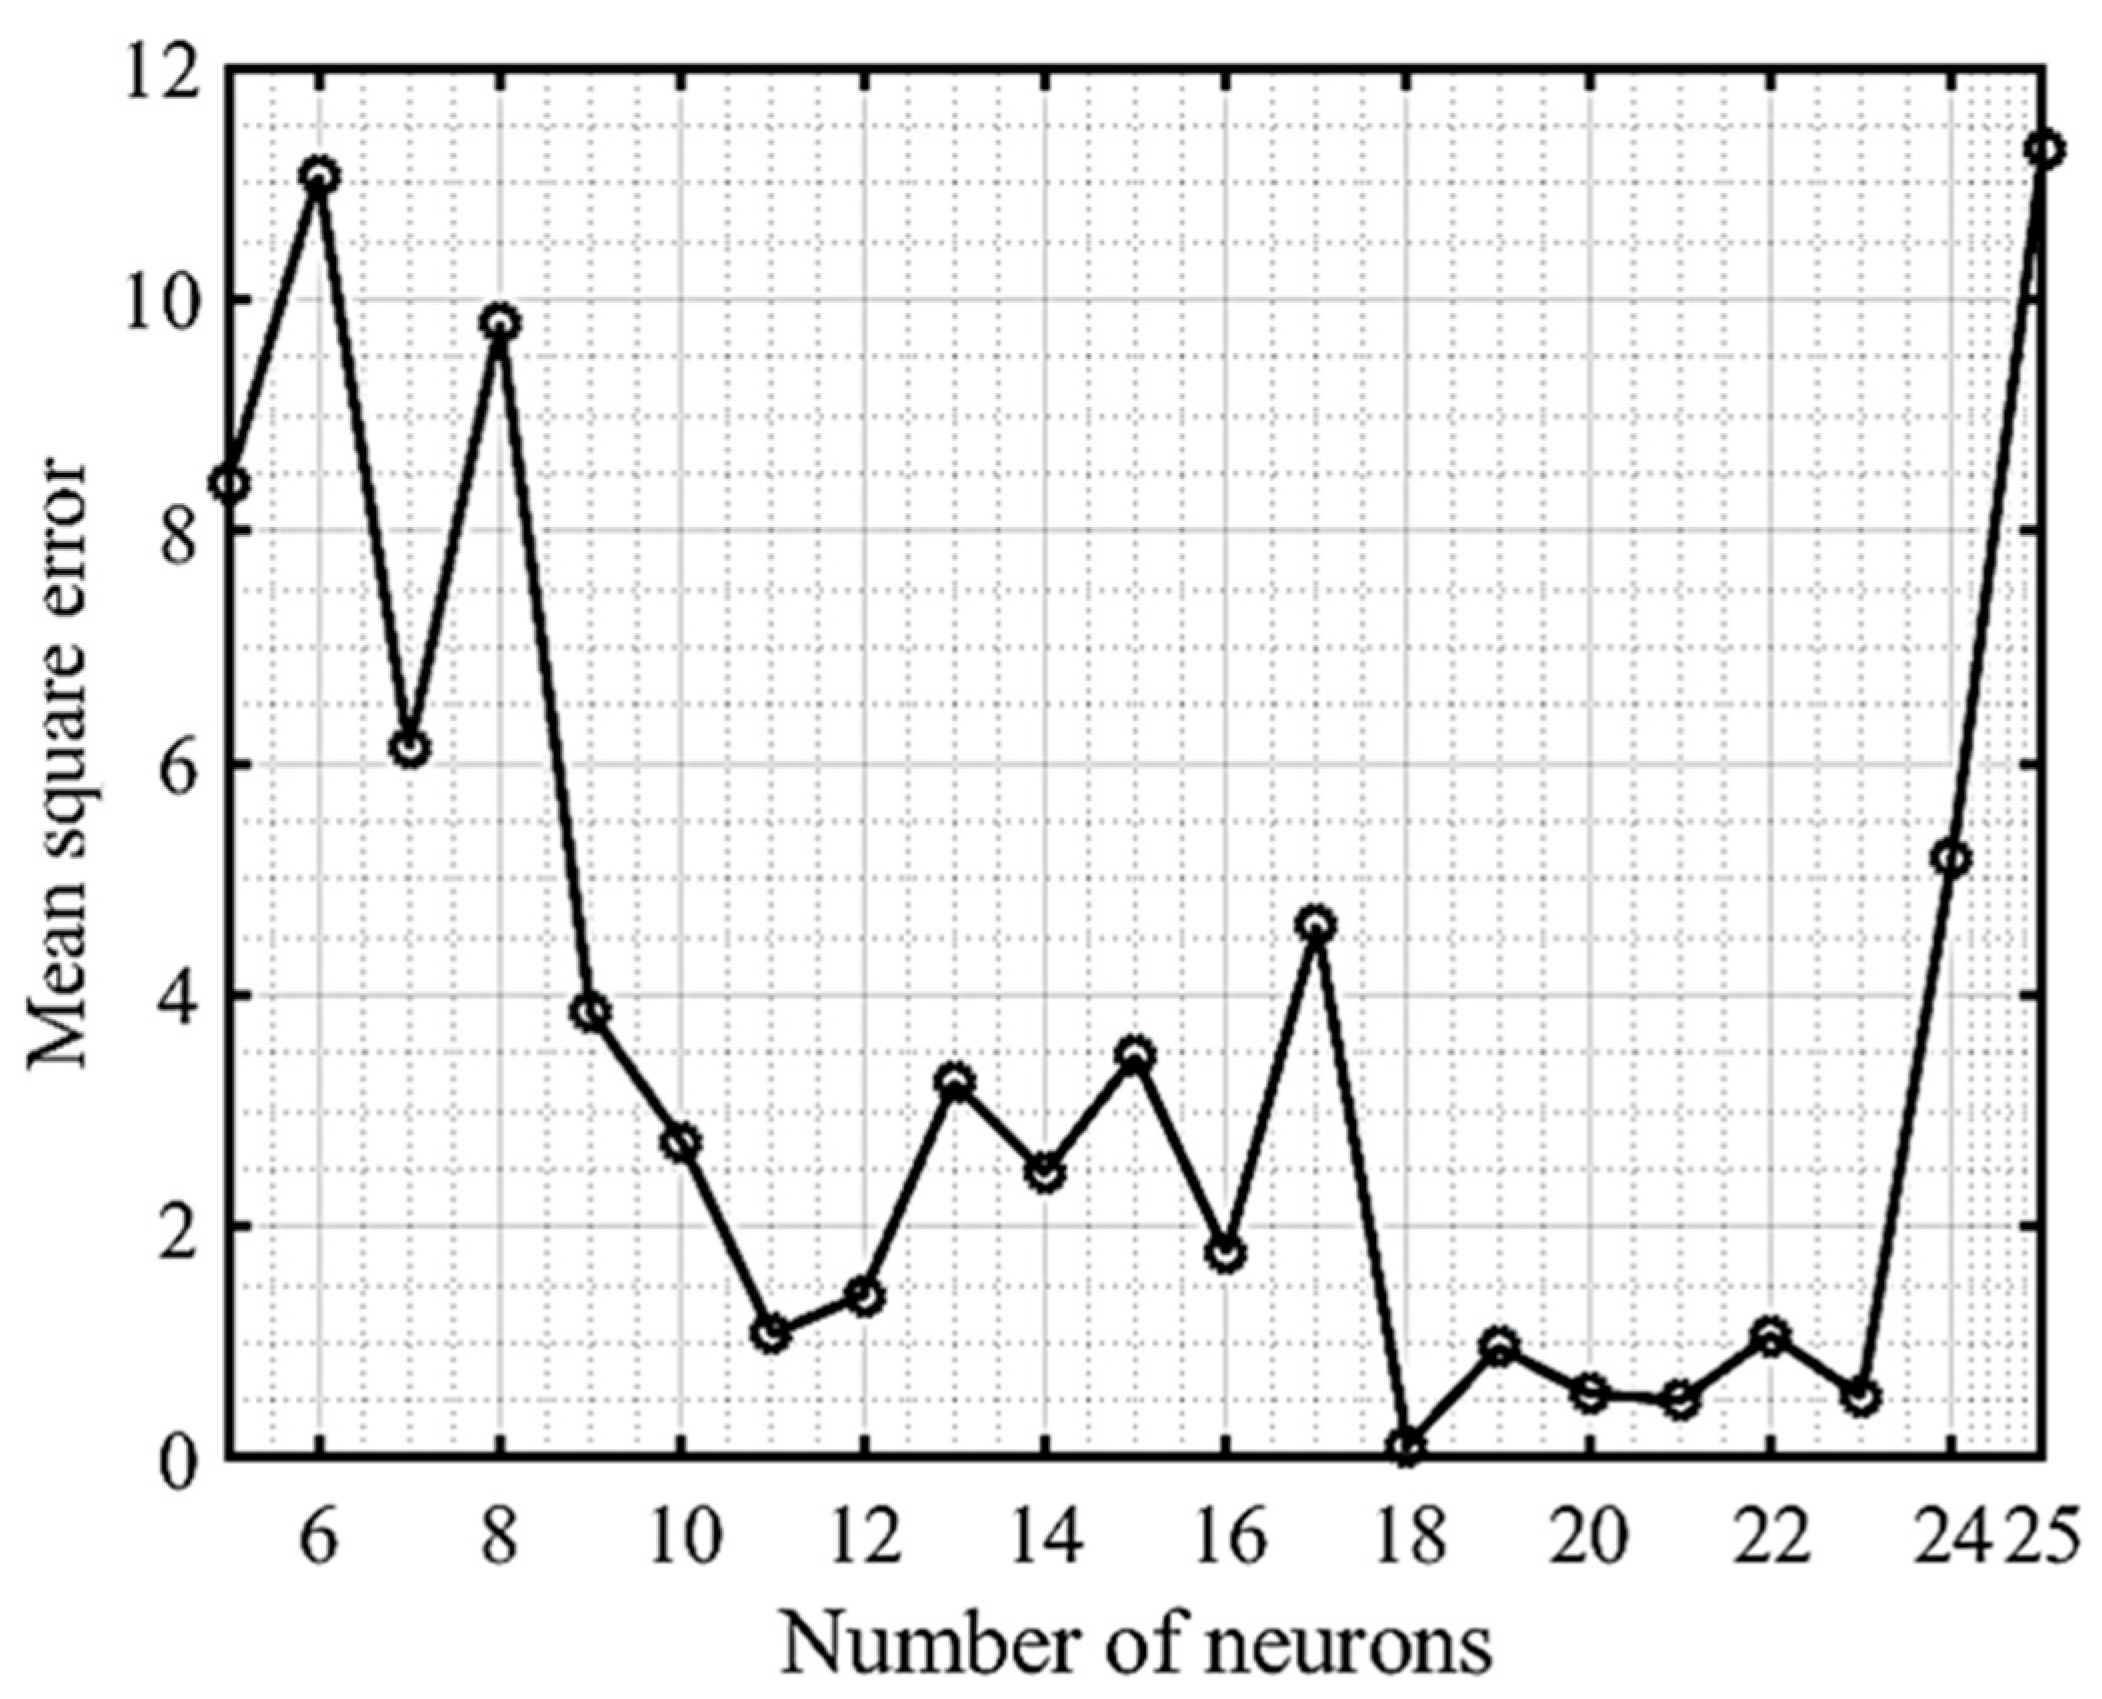
2.2.4. ANN Modeling via System Identification
3. Results
4. Discussion
5. State of the Art Comparison
6. Conclusions
Author Contributions
Funding
Institutional Review Board Statement
Informed Consent Statement
Data Availability Statement
Conflicts of Interest
Appendix A


References
- Boekhorst, V.T.; Preziosi, L.; Friedl, P. Plasticity of Cell Migration In Vivo and In Silico. Annu. Rev. Cell Dev. Biol. 2016, 32, 491–526. [Google Scholar] [CrossRef]
- Charras, G.; Sahai, E. Physical influences of the extracellular environment on cell migration. Nat. Rev. Mol. Cell Biol. 2014, 15, 813–824. [Google Scholar] [CrossRef] [PubMed]
- Mayor, R.; Etienne-Manneville, S. The front and rear of collective cell migration. Nat. Rev. Mol. Cell Biol. 2016, 17, 97–109. [Google Scholar] [CrossRef] [PubMed] [Green Version]
- van Helvert, S.; Storm, C.; Friedl, P. Mechanoreciprocity in cell migration. Nat. Cell Biol. 2018, 20, 8–20. [Google Scholar] [CrossRef]
- Palmer, T.D.; Ashby, W.J.; Lewis, J.D.; Zijlstra, A. Targeting tumor cell motility to prevent metastasis. Adv. Drug Deliv. Rev. 2011, 63, 568–581. [Google Scholar] [CrossRef] [PubMed] [Green Version]
- Martinotti, S.; Ranzato, E. Scratch Wound Healing Assay. Methods Mol. Biol. 2019, 2109, 225–229. [Google Scholar] [CrossRef]
- Ramesh, A.N.; Kambhampati, C.; Monson, J.R.T.; Drew, P.J. Artificial intelligence in medicine. Ann. R. Coll. Surg. Engl. 2004, 86, 334–338. [Google Scholar] [CrossRef] [Green Version]
- Lisboa, P. A review of evidence of health benefit from artificial neural networks in medical intervention. Neural Netw. 2002, 15, 11–39. [Google Scholar] [CrossRef]
- Brnabic, A.; Hess, L.M. Systematic literature review of machine learning methods used in the analysis of real-world data for patient-provider decision making. BMC Med Inform. Decis. Mak. 2021, 21, 1–19. [Google Scholar] [CrossRef]
- Shi, H.-Y.; Lee, K.-T.; Lee, H.-H.; Ho, W.-H.; Sun, D.-P.; Wang, J.-J.; Chiu, C.-C. Comparison of Artificial Neural Network and Logistic Regression Models for Predicting In-Hospital Mortality after Primary Liver Cancer Surgery. PLoS ONE 2012, 7, e35781. [Google Scholar] [CrossRef] [Green Version]
- Harrison, R.; Kennedy, R.L. Artificial Neural Network Models for Prediction of Acute Coronary Syndromes Using Clinical Data from the Time of Presentation. Ann. Emerg. Med. 2005, 46, 431–439. [Google Scholar] [CrossRef]
- Soetje, B.; Fuellekrug, J.; Haffner, D.; Ziegler, W.H. Application and Comparison of Supervised Learning Strategies to Classify Polarity of Epithelial Cell Spheroids in 3D Culture. Front. Genet. 2020, 11, 248. [Google Scholar] [CrossRef]
- Kourou, K.; Exarchos, T.P.; Exarchos, K.P.; Karamouzis, M.V.; Fotiadis, D.I. Machine learning applications in cancer prognosis and prediction. Comput. Struct. Biotechnol. J. 2015, 13, 8–17. [Google Scholar] [CrossRef] [Green Version]
- Hagan, M.; Menhaj, M. Training feedforward networks with the Marquardt algorithm. IEEE Trans. Neural Netw. 1994, 5, 989–993. [Google Scholar] [CrossRef] [PubMed]
- Gupta, T.K.; Raza, K. Optimizing Deep Feedforward Neural Network Architecture: A Tabu Search Based Approach. Neural Process. Lett. 2020, 51, 2855–2870. [Google Scholar] [CrossRef]
- Burke, H.B.; Goodman, P.H.; Rosen, D.B.; Henson, D.E.; Weinstein, J.N.; Harrell, F.E.; Marks, J.R.; Winchester, D.P.; Bostwick, D.G. Artificial neural networks improve the accuracy of cancer survival prediction. Cancer 1997, 79, 857–862. [Google Scholar] [CrossRef]
- Cabelof, D.C.; Guo, Z.; Raffoul, J.J.; Sobol, R.W.; Wilson, S.H.; Richardson, A.; Heydari, A.R. Base excision repair deficiency caused by polymerase beta haploinsufficiency: Accelerated DNA damage and increased mutational response to carcinogens. Cancer Res. 2003, 63, 5799–5807. [Google Scholar] [PubMed]
- Zhang, Z.; Chen, L.; Humphries, B.; Brien, R.; Wicha, M.S.; Luker, K.E.; Luker, G.D.; Chen, Y.-C.; Yoon, E. Morphology-based prediction of cancer cell migration using an artificial neural network and a random decision forest. Integr. Biol. 2018, 10, 758–767. [Google Scholar] [CrossRef] [PubMed]
- Bahar, E.; Kim, J.-Y.; Kim, H.-S.; Yoon, H. Establishment of Acquired Cisplatin Resistance in Ovarian Cancer Cell Lines Characterized by Enriched Metastatic Properties with Increased Twist Expression. Int. J. Mol. Sci. 2020, 21, 7613. [Google Scholar] [CrossRef]
- Huang, S.; Cai, N.; Pacheco, P.P.; Narrandes, S.; Wang, Y.; Xu, W. Applications of Support Vector Machine (SVM) Learning in Cancer Genomics. Cancer Genom. Proteom. 2018, 15, 41–51. [Google Scholar] [CrossRef] [Green Version]
- Rodríguez-Pérez, R.; Vogt, M.; Bajorath, J. Support Vector Machine Classification and Regression Prioritize Different Structural Features for Binary Compound Activity and Potency Value Prediction. ACS Omega 2017, 2, 6371–6379. [Google Scholar] [CrossRef] [PubMed] [Green Version]
- Yang, C.; Bahar, E.; Adhikari, S.P.; Kim, S.-J.; Kim, H.; Yoon, H. Precise Modeling of the Protective Effects of Quercetin against Mycotoxin via System Identification with Neural Networks. Int. J. Mol. Sci. 2019, 20, 1725. [Google Scholar] [CrossRef] [Green Version]
- Schmidt, A.; Creason, W.; Law, B. Estimating regional effects of climate change and altered land use on biosphere carbon fluxes using distributed time delay neural networks with Bayesian regularized learning. Neural Netw. 2018, 108, 97–113. [Google Scholar] [CrossRef] [PubMed]
- Waldmann, P. Approximate Bayesian neural networks in genomic prediction. Genet. Sel. Evol. 2018, 50, 1–9. [Google Scholar] [CrossRef] [PubMed] [Green Version]
- Winkler, D.A.; Burden, F.R. Nonlinear Predictive Modeling of MHC Class II-Peptide Binding Using Bayesian Neural Networks. Adv. Struct. Saf. Stud. 2007, 409, 365–377. [Google Scholar] [CrossRef]
- Yang, C.; Bahar, E.; Yoon, H.; Kim, H. Accurate Modeling of Complex Antitoxin Effect of Quercetin Based on Neural Networks. Int. J. Bifurc. Chaos 2019, 29, 1950013. [Google Scholar] [CrossRef]
- Park, S.; Han, W.; Kim, J.; Kim, M.K.; Lee, E.; Yoo, T.-K.; Lee, H.-B.; Kang, Y.J.; Kim, Y.-G.; Moon, H.-G.; et al. Risk Factors Associated with Distant Metastasis and Survival Outcomes in Breast Cancer Patients with Locoregional Recurrence. J. Breast Cancer 2015, 18, 160–166. [Google Scholar] [CrossRef] [Green Version]
- Liu, Q.; Zhang, H.; Jiang, X.; Qian, C.; Liu, Z.; Luo, D. Factors involved in cancer metastasis: A better understanding to “seed and soil” hypothesis. Mol. Cancer 2017, 16, 1–9. [Google Scholar] [CrossRef] [Green Version]
- Pepe, M.S.; Etzioni, R.; Feng, Z.; Potter, J.; Thompson, M.L.; Thornquist, M.D.; Winget, M.; Yasui, Y. Phases of Biomarker Development for Early Detection of Cancer. J. Natl. Cancer Inst. 2001, 93, 1054–1061. [Google Scholar] [CrossRef] [Green Version]
- Lee, S.C.; Lin, H.T.; Yang, T.Y. Artificial neural network analysis for reliability prediction of regional runoff utilization. Environ. Monit. Assess. 2009, 161, 315–326. [Google Scholar] [CrossRef]
- Dawson, C.W.; Brown, M.R.; Wilby, R.L. Inductive learning approaches to rainfall-runoff modelling. Int. J. Neural Syst. 2000, 10, 43–57. [Google Scholar] [CrossRef]
- Sommer, C.; Gerlich, D.W. Machine learning in cell biology – teaching computers to recognize phenotypes. J. Cell Sci. 2013, 126, 5529–5539. [Google Scholar] [CrossRef] [PubMed] [Green Version]
- Fröhlich, H.; Balling, R.; Beerenwinkel, N.; Kohlbacher, O.; Kumar, S.; Lengauer, T.; Maathuis, M.H.; Moreau, Y.; Murphy, S.A.; Przytycka, T.M.; et al. From hype to reality: Data science enabling personalized medicine. BMC Med. 2018, 16, 1–15. [Google Scholar] [CrossRef] [PubMed]


| Classifier | Accuracy (%) | Classifier | Accuracy (%) | Classifier | Accuracy (%) | |||
|---|---|---|---|---|---|---|---|---|
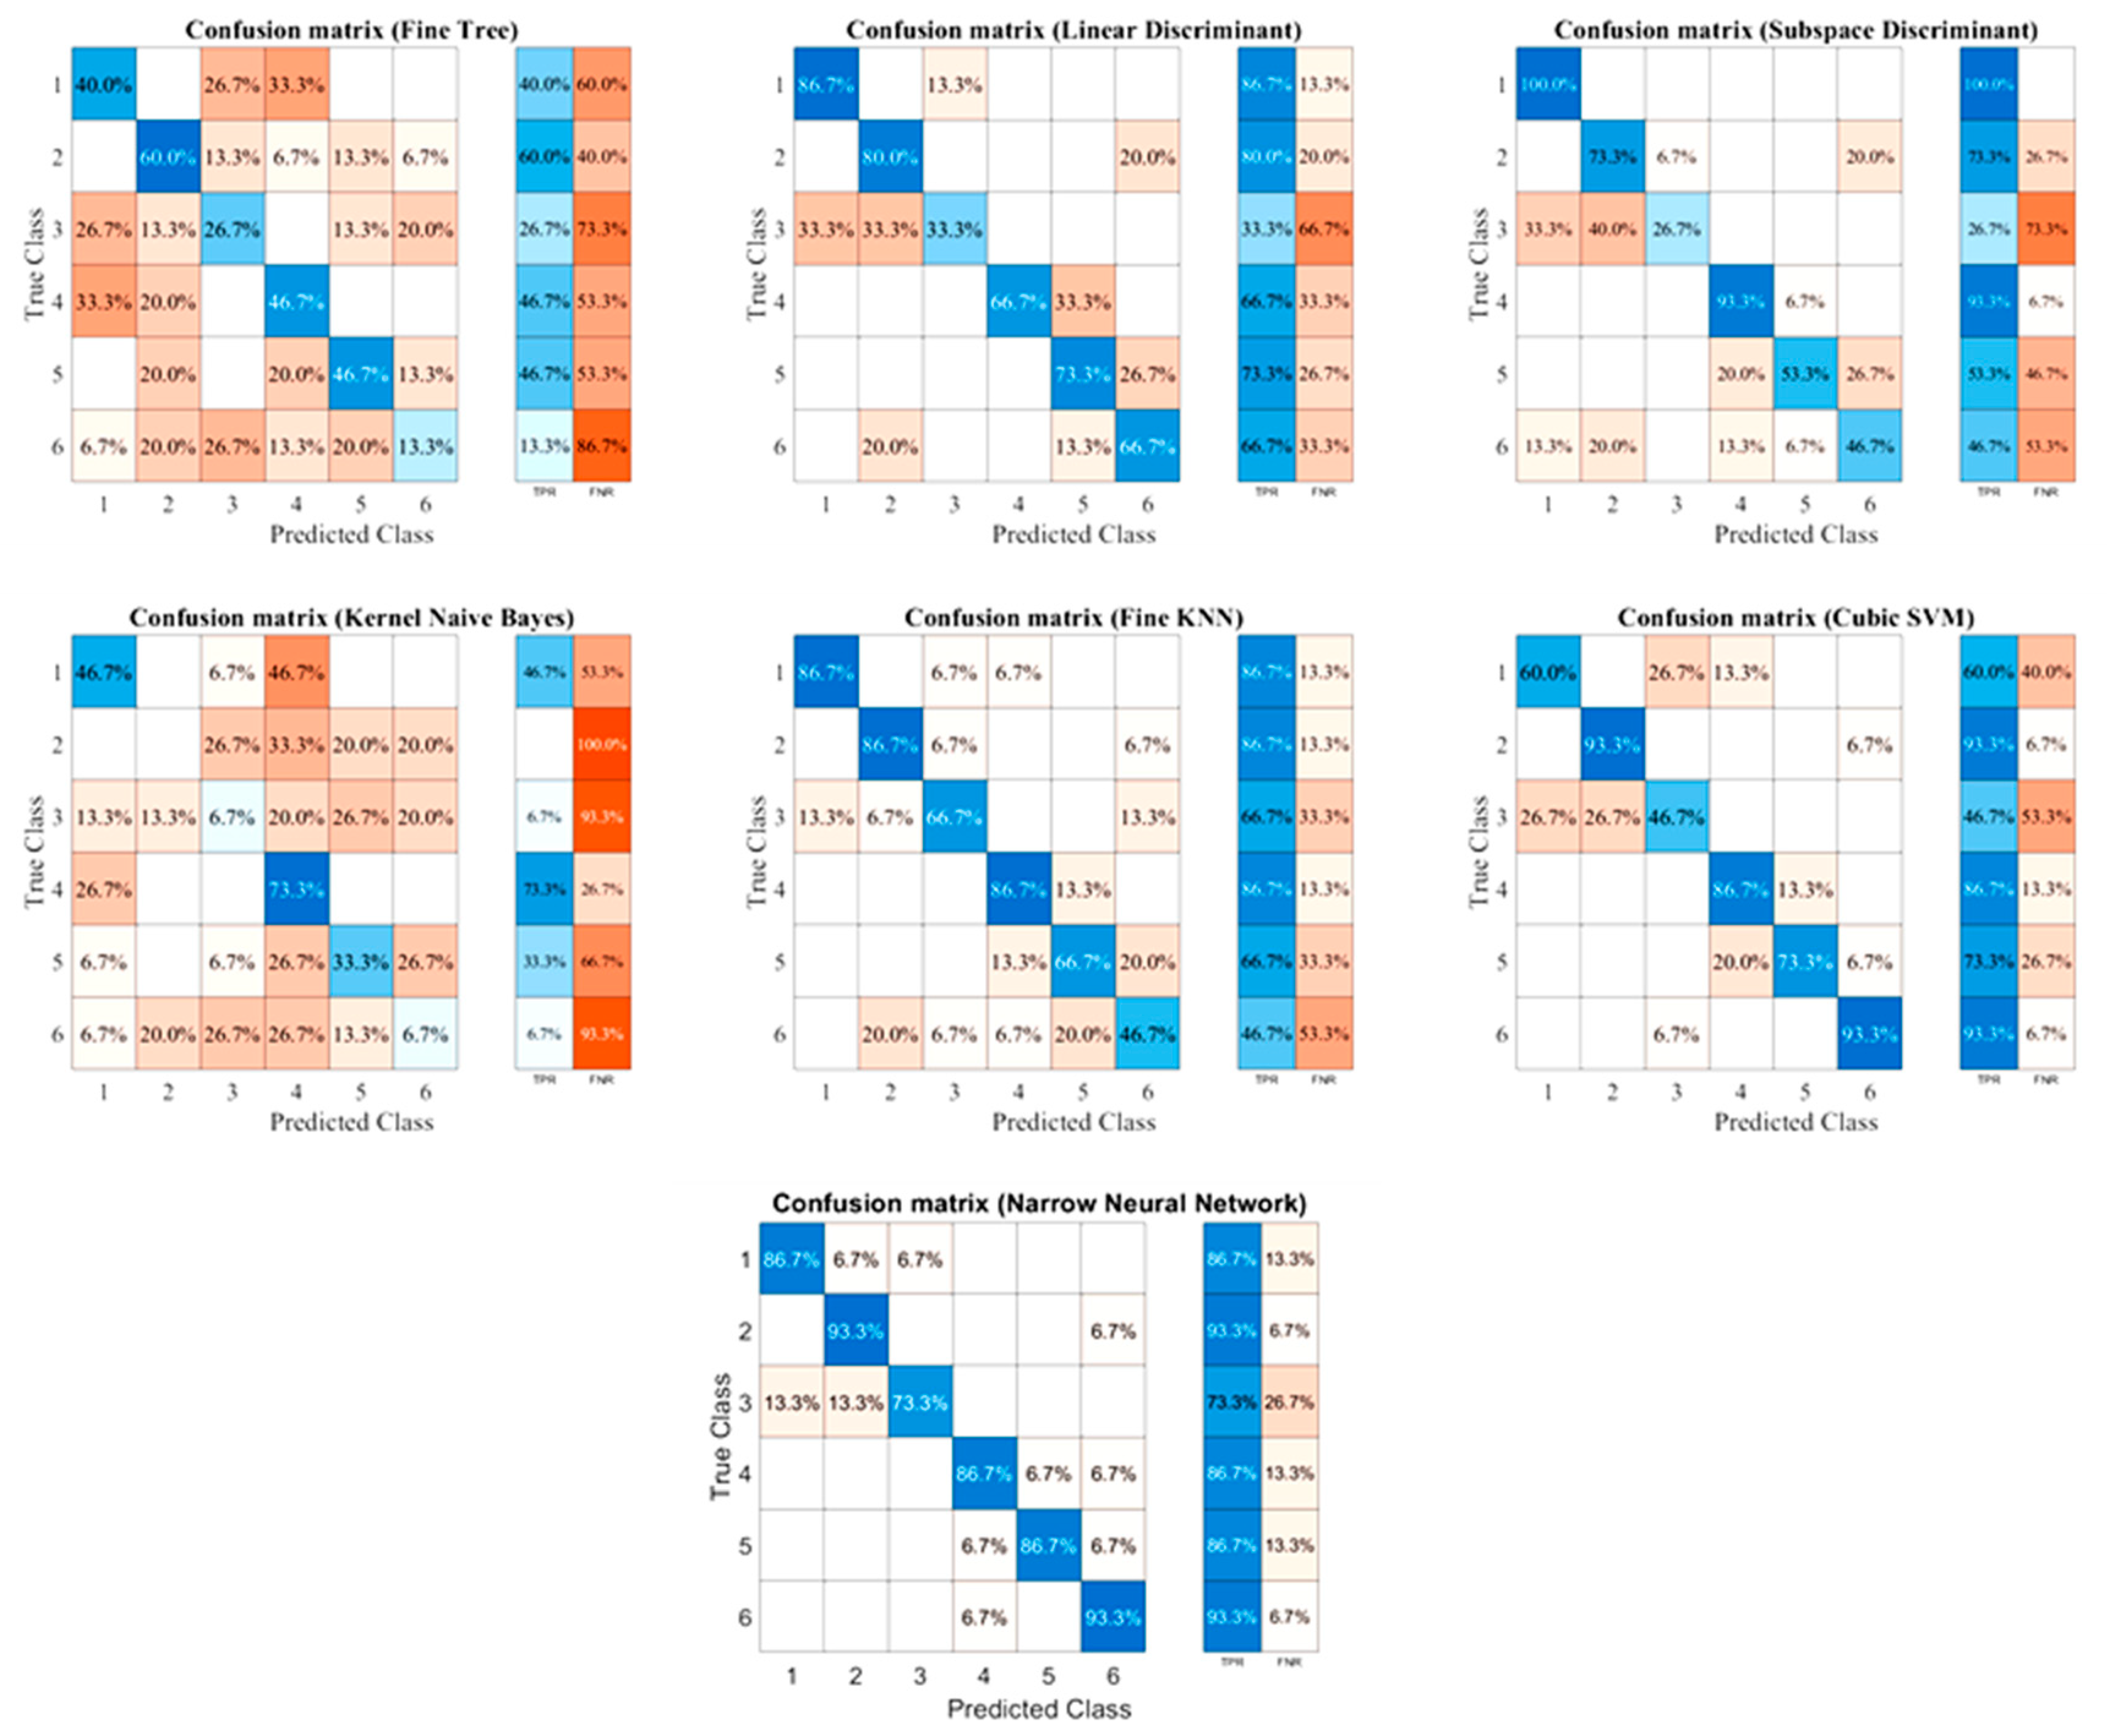
| Decision Tree | Fine Tree | 38.9 | Support Vector Machines (SVMs) | Linear SVM | 67.8 | Neural Network (NN) | Narrow NN | 86.7 |
| Medium Tree | 38.9 | Quadratic SVM | 70.0 | Medium NN | 85.6 | |||
| Coarse Tree | 24.4 | Fine Gaussian SVM | 75.6 | Wider NN | 83.3 | |||
| Discriminant Analysis | Linear Discriminant | 67.8 | Medium SVM | 70.0 | Bilayered NN | 82.2 | ||
| Quadratic Discriminant | Failed | Coarse SVM | 72.2 | Trilayered NN | 78.9 | |||
| Naive Bayes | Gaussian | 25.6 | ||||||
| Kernel | 27.8 | K-Nearest Neighbor (KNN) | Fine KNN | 73.3 | ||||
| Ensemble | Boosted Tree | 53.3 | Medium KNN | 28.9 | ||||
| Bagged Tree | 57.8 | Coarse KNN | 16.7 | |||||
| Subspace Discriminant | 65.6 | Cosine KNN | 30.0 | |||||
| Subspace KNN | 42.2 | Cubic KNN | 31.1 | |||||
| RUS Boosted Tree | 51.1 | Weighted KNN | 66.7 | |||||
| SVM Machines | Relative Wound Area | Wound Closure | Healing Speed | |||||||||
|---|---|---|---|---|---|---|---|---|---|---|---|---|
| Training | Testing | Training | Testing | Training | Testing | |||||||
| MAE | RSME | MAE | RSME | MAE | RSME | MAE | RSME | MAE | RSME | MAE | RSME | |
| Linear SVM | 0.028 | 0.033 | 0.028 | 0.033 | 3.830 | 5.495 | 4.204 | 6.564 | 12809 | 16937 | 1.1 × 10⁴ | 1.5 × 10⁴ |
| Quadratic SVM | 0.028 | 0.032 | 0.0278 | 0.031 | 3.068 | 3.586 | 3.04 | 4.089 | 6557.5 | 8227.3 | 5.7 × 10³ | 8.1 × 10³ |
| Cubic SVM | 0.000 | 0.030 | 0.0281 | 0.031 | 3.491 | 4.129 | 3.14 | 4.309 | 4052.6 | 4983 | 4.1 × 10³ | 4.7 × 10³ |
| Fine Gaussian SVM | 0.004 | 0.063 | 0.0293 | 0.033 | 5.208 | 7.628 | 1.536 | 2.553 | 5949.5 | 8136.3 | 4.2 × 10³ | 4.9 × 10³ |
| Medium Gaussian SVM | 0.027 | 0.034 | 0.0262 | 0.030 | 2.906 | 3.610 | 2.483 | 3.104 | 15488 | 4360.1 | 3.4 × 10³ | 3.7 × 10³ |
| Coarse Gaussian SVM | 0.037 | 0.044 | 0.0354 | 0.041 | 4.281 | 5.408 | 4.040 | 5.275 | 3676.7 | 17028 | 1.1 × 10⁴ | 1.4 × 10⁴ |
| ANN Structure | Performance (Average MSE) | ||
|---|---|---|---|
| Training Function Algorithm | |||
| TrainBR | TrainLIM | TrainRPROP | |
| 3-5-3 | 5.010 | 9.71 × 10⁴ | 1.158 × 10⁶ |
| 3-7-3 | 3.140 | 9.35 × 10⁸ | 2.01 × 10⁶ |
| 3-10-3 | 2.798 | 4.21 × 10⁸ | 3.23 × 10⁸ |
| 3-12-3 | 1.4089 | 1.75 × 10⁶ | 7.68 × 10⁸ |
| 3-15-3 | 3.472 | 8.21 × 10⁸ | 3.24 × 10⁶ |
| 3-18-3 | 0.058 | 7.00 × 10⁸ | 7.32 × 10⁶ |
| 3-20-3 | 0.561 | 1.82 × 10⁶ | 7.90 × 10⁸ |
| 3-21-3 | 0.4964 | 1.65 × 10⁶ | 7.54 × 10⁸ |
| 3-22-3 | 1.0627 | 1.25 × 10⁶ | 7.69 × 10⁸ |
| 3-24-3 | 5.1836 | 8.65 × 10⁴ | 1.02 × 10⁶ |
| 3-5-5-3 | 7.460 | 6.96 × 10⁴ | 3.21 × 10⁶ |
| 3-5-10-3 | 1.030 | 1.28 × 10⁹ | 6.43 × 10⁶ |
| 3-10-5-3 | 0.606 | 4.78 × 10³ | 1.88 × 10⁶ |
| 3-5-5-5-3 | 70.00 | 7.53 × 10⁴ | 7.13 × 10⁶ |
| 3-10-5-5-3 | 1.292 | 1.66 × 10⁵ | 2.18 × 10⁷ |
| 3-10-10-5-3 | 1.428 | 8.38 × 10⁴ | 6.06 × 10⁶ |
| ANN Structure | Performance (Average MSE) | |
|---|---|---|
| Training | Testing | |
| 3-18-3 | 0.058 | 0.012 |
| 3-18-2-3 | 0.460 | 0.262 |
| 3-18-4-3 | 0.306 | 0.174 |
| 3-18-6-3 | 0.635 | 0.345 |
| 3-18-8-3 | 0.752 | 0.428 |
| 3-18-10-3 | 0.292 | 0.183 |
| 3-18-12-3 | 1.321 | 0.752 |
| 3-18-15-3 | 1.024 | 0.266 |
| 3-18-18-3 | 0.428 | 0.243 |
| 3-18-20-3 | 0.792 | 0.451 |
| 3-18-22-3 | 1.428 | 0.813 |
| Neural Network | Adaption Learning Function | Training Function | Activation Function | Performance (MSE) | ||||||
|---|---|---|---|---|---|---|---|---|---|---|
| Training | Testing | |||||||||
| Average (All Outputs) | Relative Wound Area | Wound Closure (%) | Healing Speed (µm2/H) | Relative Wound Area | Wound Closure (%) | Healing Speed (µm2/H) | ||||
| 3-18-3 | LEARNGD | TrainBR | Logsig | 0.0670 | 0.0036 | 0.1544 | 0.4211 | 0.0029 | 0.2041 | 0.5308 |
| Transig | 0.1350 | 0.0029 | 0.6259 | 0.986 | 0.0041 | 0.8610 | 0.5417 | |||
| LEARNGDM | TrainBR | Logsig | 0.0335 | 0.0023 | 0.1113 | 0.8140 | 0.0036 | 0.4536 | 0.4182 | |
| Transig | 0.0319 | 0.0030 | 0.1161 | 0.3014 | 0.0037 | 0.6376 | 0.5299 | |||
| Output | MAE | RMSE | ||
|---|---|---|---|---|
| Training | Testing | Training | Testing | |
| Relative wound area | 0.0767 | 0.0528 | 0.0856 | 0.0609 |
| Wound closure (%) | 0.2090 | 0.0913 | 0.2920 | 0.1220 |
| Healing speed (µm2/h) | 0.1817 | 0.0797 | 0.1060 | 0.0724 |
| Experiment | ANN | ||||||
|---|---|---|---|---|---|---|---|
| Cell Lines | Hour | Relative Wound Area (r.u.) | Wound Closure (%) | Healing Speed (µm2/H) | Relative Wound Area (r.u.) | Wound Closure (%) | Healing Speed (µm2/H) |
| OV-90/Parental | 12 | 0.752 | 24.809 | 43,232.7 | 0.721 | 24.877 | 43,232.5 |
| 24 | 0.643 | 35.663 | 31,073.9 | 0.527 | 35.685 | 31,073.9 | |
| OV-90/CisR1 | 12 | 0.546 | 45.388 | 75,302.5 | 0.569 | 45.369 | 75,302.4 |
| 24 | 0.365 | 63.537 | 52,706.2 | 0.386 | 63.685 | 52,706.2 | |
| OV-90/CisR2 | 12 | 0.501 | 49.904 | 87,289.2 | 0.529 | 49.846 | 87,289.1 |
| 24 | 0.317 | 68.321 | 59,750.6 | 0.387 | 68.251 | 59,750.7 | |
| SKOV-3/Parental | 12 | 0.896 | 10.408 | 16,036.8 | 0.845 | 10.682 | 16,036.7 |
| 24 | 0.669 | 33.145 | 25,535.0 | 0.532 | 33.312 | 25,534.8 | |
| SKOV-3/CisR1 | 12 | 0.590 | 40.954 | 60,884.5 | 0.551 | 41.057 | 60,884.5 |
| 24 | 0.296 | 71.981 | 56,505.4 | 0.342 | 71.885 | 56,505.4 | |
| SKOV-3/CisR2 | 12 | 0.551 | 44.942 | 70,823.7 | 0.561 | 44.915 | 70,823.6 |
| 24 | 0.368 | 74.543 | 59,811.7 | 0.360 | 75.845 | 59,801.7 | |
Publisher’s Note: MDPI stays neutral with regard to jurisdictional claims in published maps and institutional affiliations. |
© 2021 by the authors. Licensee MDPI, Basel, Switzerland. This article is an open access article distributed under the terms and conditions of the Creative Commons Attribution (CC BY) license (https://creativecommons.org/licenses/by/4.0/).
Share and Cite
Bahar, E.; Yoon, H. Modeling and Predicting the Cell Migration Properties from Scratch Wound Healing Assay on Cisplatin-Resistant Ovarian Cancer Cell Lines Using Artificial Neural Network. Healthcare 2021, 9, 911. https://0-doi-org.brum.beds.ac.uk/10.3390/healthcare9070911
Bahar E, Yoon H. Modeling and Predicting the Cell Migration Properties from Scratch Wound Healing Assay on Cisplatin-Resistant Ovarian Cancer Cell Lines Using Artificial Neural Network. Healthcare. 2021; 9(7):911. https://0-doi-org.brum.beds.ac.uk/10.3390/healthcare9070911
Chicago/Turabian StyleBahar, Entaz, and Hyonok Yoon. 2021. "Modeling and Predicting the Cell Migration Properties from Scratch Wound Healing Assay on Cisplatin-Resistant Ovarian Cancer Cell Lines Using Artificial Neural Network" Healthcare 9, no. 7: 911. https://0-doi-org.brum.beds.ac.uk/10.3390/healthcare9070911