
A Fluorescence-Based Chemical Sensor for Detection of Melamine in Aqueous Solutions


Department of Biology, Chemistry and Environmental Sciences, American University of Sharjah, Sharjah 26666, United Arab Emirates
*
Author to whom correspondence should be addressed.
Chemosensors 2022, 10(1), 13; https://0-doi-org.brum.beds.ac.uk/10.3390/chemosensors10010013
Submission received: 28 November 2021
/
Revised: 23 December 2021
/
Accepted: 24 December 2021
/
Published: 30 December 2021
(This article belongs to the Special Issue Advanced Colorimetric and Fluorescent Sensors and Their Application in Detection)
Abstract
:Melamine, an industrial chemical, receives wide attention nowadays because of its unethical usage as a nitrogen enhancer in protein-rich foods and dairy products. Since most of the existing melamine detection methods are highly expensive and time-consuming, high sensitivity biosensor-based detection methods have arisen in the scientific literature as promising alternatives. This study reports the design, synthesis, and fluorescent investigations of a carbazole-based sensor (CB) for the detection of melamine in aqueous solutions. The titration studies and microplate experiments on a CB-cyanuric acid mixture (CB-CA) with melamine suggested that the novel sensor could detect melamine even at very low concentrations in both aqueous solutions and dairy samples.
1. Introduction
Melamine is a chemical primarily used in industry for the production of melamine resin. Since 2007, it has been detected as an adulterant in milk products and pet food [1]. Due to its high nitrogen content, melamine was added to food products in order to produce a false elevated protein content. This compound, however, has very serious health effects as it forms large crystals in the kidneys, leading to the formation of kidney stones and causing kidney failure in babies and pets [2,3].
The current detection methods for melamine in food samples include Raman spectroscopy, HPLC–MS and electrochemical techniques [4]. These techniques require expensive equipment in a lab setting with lubricous procedures [5,6]. Hence, several groups have reported on the development of colorimetric or fluorescent sensors for melamine that can be used in the field or with minimal use of lab equipment. Ai et al. [7] reported one of the early examples of colorimetric sensors; the detection was based on melamine-induced aggregation of gold nanoparticles that were conjugated to cyanuric acid groups, leading to a color change from red to black. The detection mechanism was based on strong H-bonding interaction between melamine and the cyanuric acid group, which has a complementary H-bonding motif to that of melamine. Since then, several other nanoparticle-based sensors have been reported with different mechanisms and concentration ranges of detection, based on metal nanoparticles, imprinted polymers, and aptamers [5,8,9,10,11,12]. While many of these techniques can detect melamine at very low concentrations (nano-and femtomolar), they still suffer from several limitations, such as high cost, unidentified detection mechanisms (and thus high level of interference) and/or complicated optimization mechanisms [9,13,14]. Therefore, there is still a demand for a specific, cost-effective, and quick test for the detection of melamine [15].
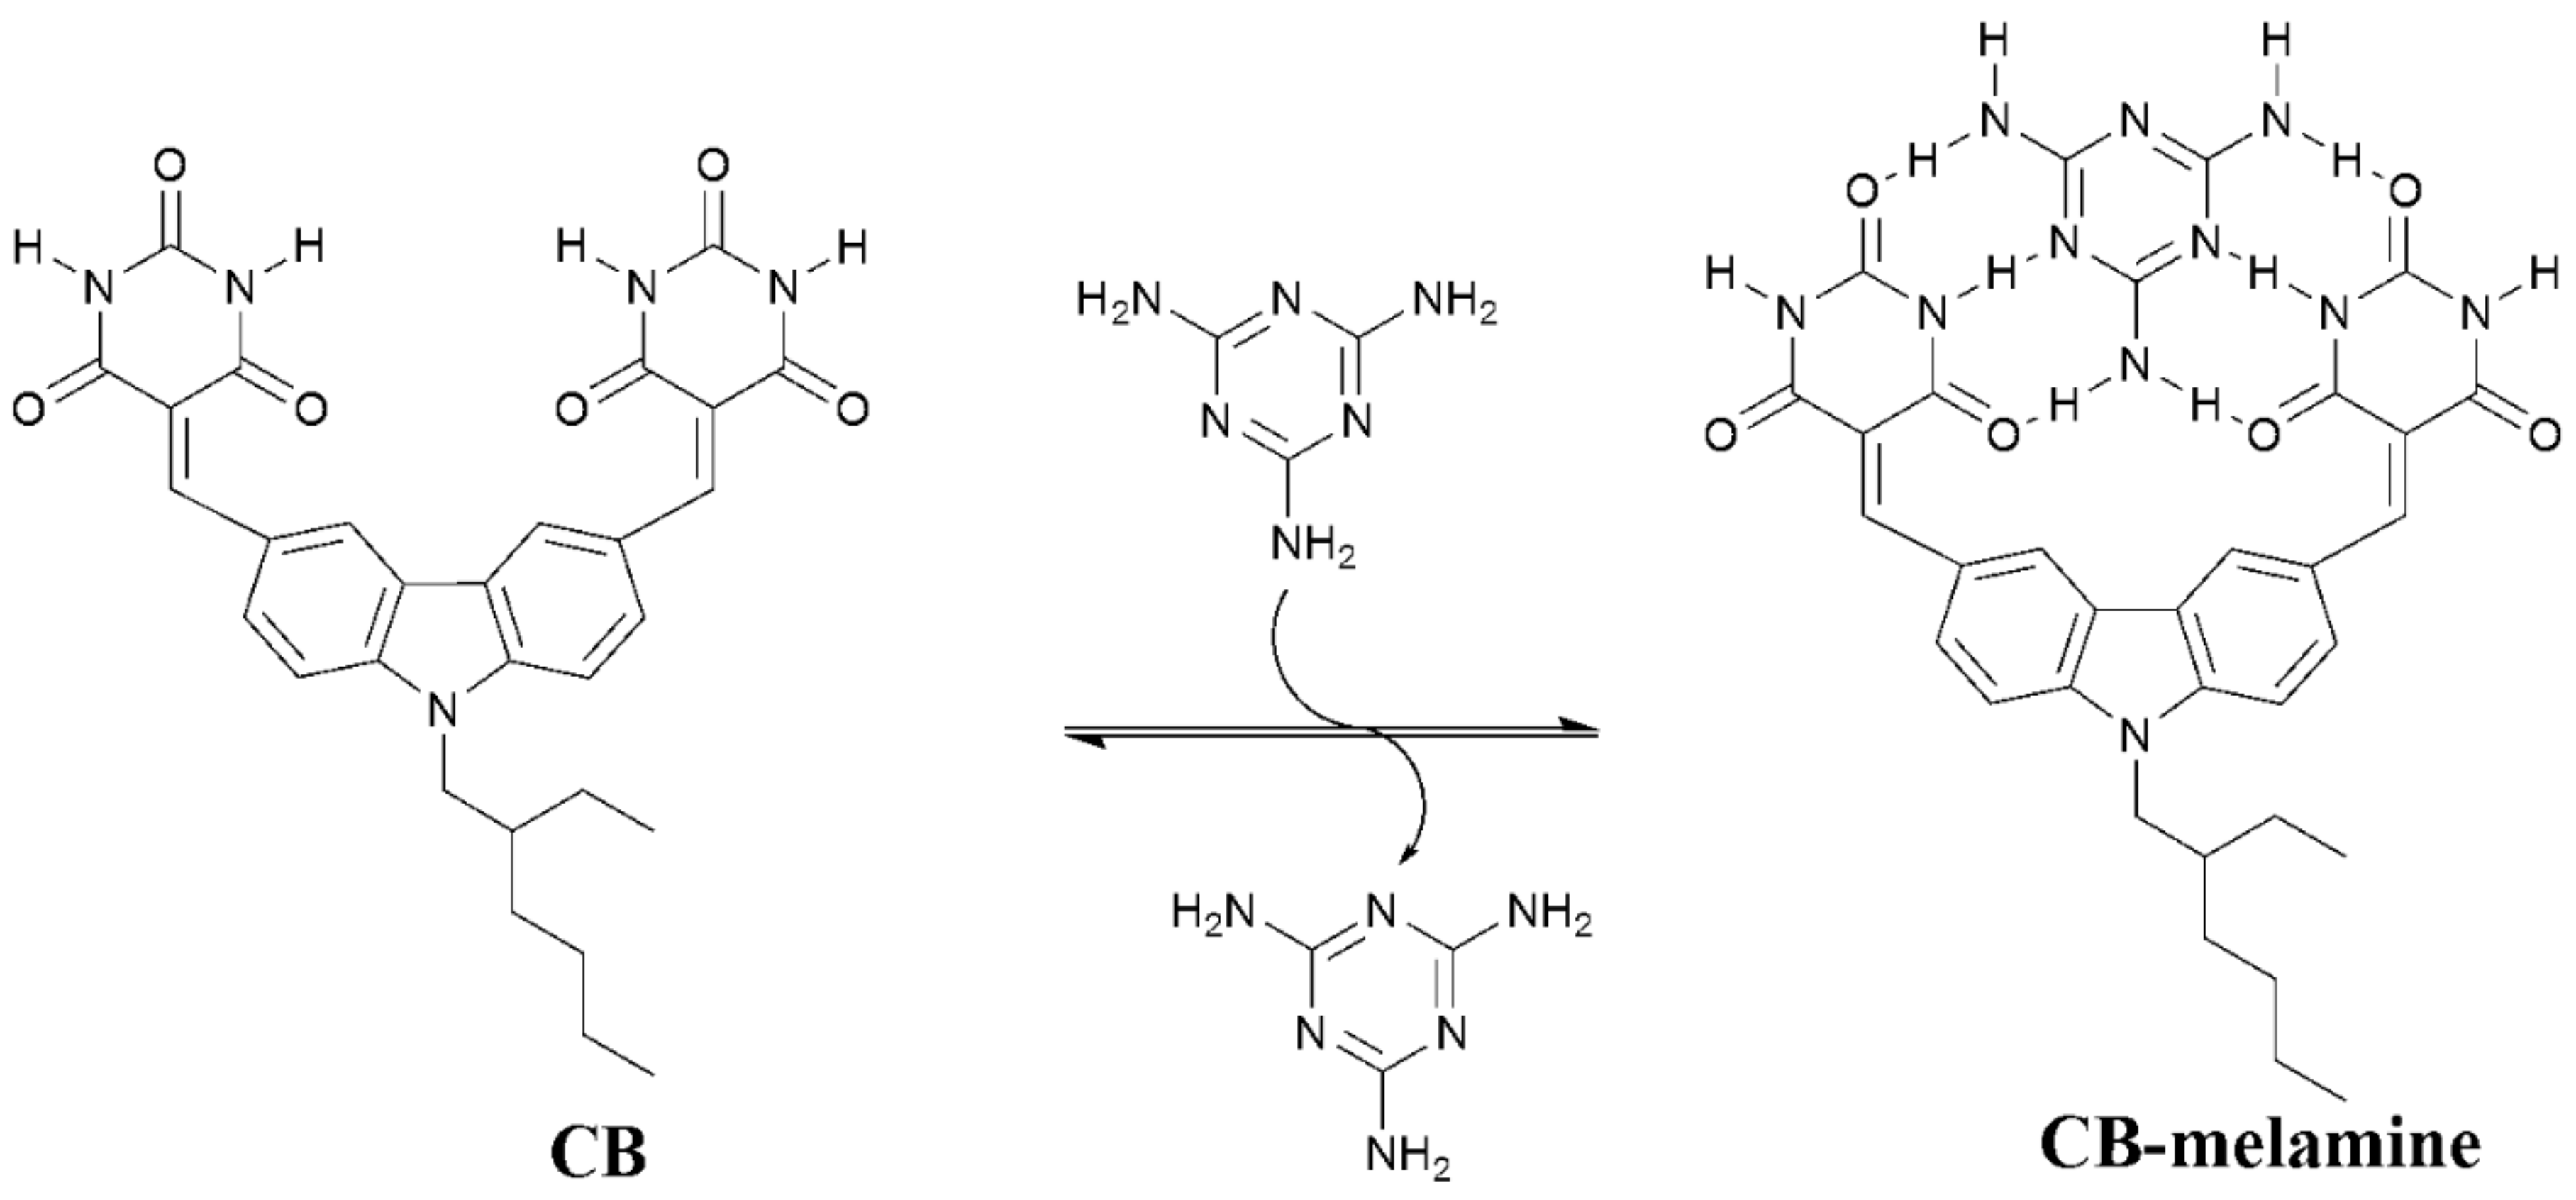
In this paper, we report the design, synthesis, and fluorescent investigations of a novel carbazole-based sensor (CB) for the detection of melamine in aqueous solutions. The sensor consisted of a carbazole fluorophore brandishing two barbituric acid units that are conjugated to the fluorophore through a carbon–carbon double bond. The barbiturate groups provide a binding cleft for melamine with complementary hydrogen bonding motifs that bind a molecule of melamine from two sides, as depicted in Scheme 1 [16,17,18]. We hypothesized that the binding of melamine by the barbiturates through six hydrogen bonds alters the electronic distribution within the molecule and the carbazole fluorophore, leading to observable and measurable changes in the emission profile of CB that reflect the concentration of melamine in the solution. Indeed, the results showed that the emission of CB was quenched upon an increase in the concentration of melamine in the solution. The results also showed that CB undergoes an aggregation-induced emission (AIE) enhancement in aqueous solutions. This AIE feature of CB provides another effective tool for detecting and measuring the concentration of melamine in aqueous solution and milk samples.
2. Materials and Methods
9-(2-Ethylhexyl) carbazole-3,6-dicarboxaldehyde, anhydrous cyanuric acid, and melamine (99%) were purchased from Sigma-Aldrich (Europe). All other chemicals used in the study were of the highest analytical grade and purchased from Sigma-Aldrich.
UV–visible (UV–vis) absorption spectra were collected with a UV-1800 UV–vis spectrophotometer (Shimadzu, Kyoto, Japan). Fluorescence spectra and analysis were recorded on an FLSP920 Series of Fluorescence spectrometer (Edinburgh Instruments Ltd., Livingston, UK). Dynamic light scattering experiments and particle size distribution data were collected with the help of a Dyanopro Nanostar laser photometer (WYATT, Santa Barbara, CA, USA). A FLUOstar Omega Plate reader from BMG LABTECH was used for 96-well microtiter plate fluorescence measurements. 1H NMR and 13C NMR spectra of CB were obtained using a Bruker-400 MHz NMR spectrometer and Fourier transfer infrared (FTIR) analysis was performed on a Perkin Elmer spectrometer.
2.1. Synthesis of CB
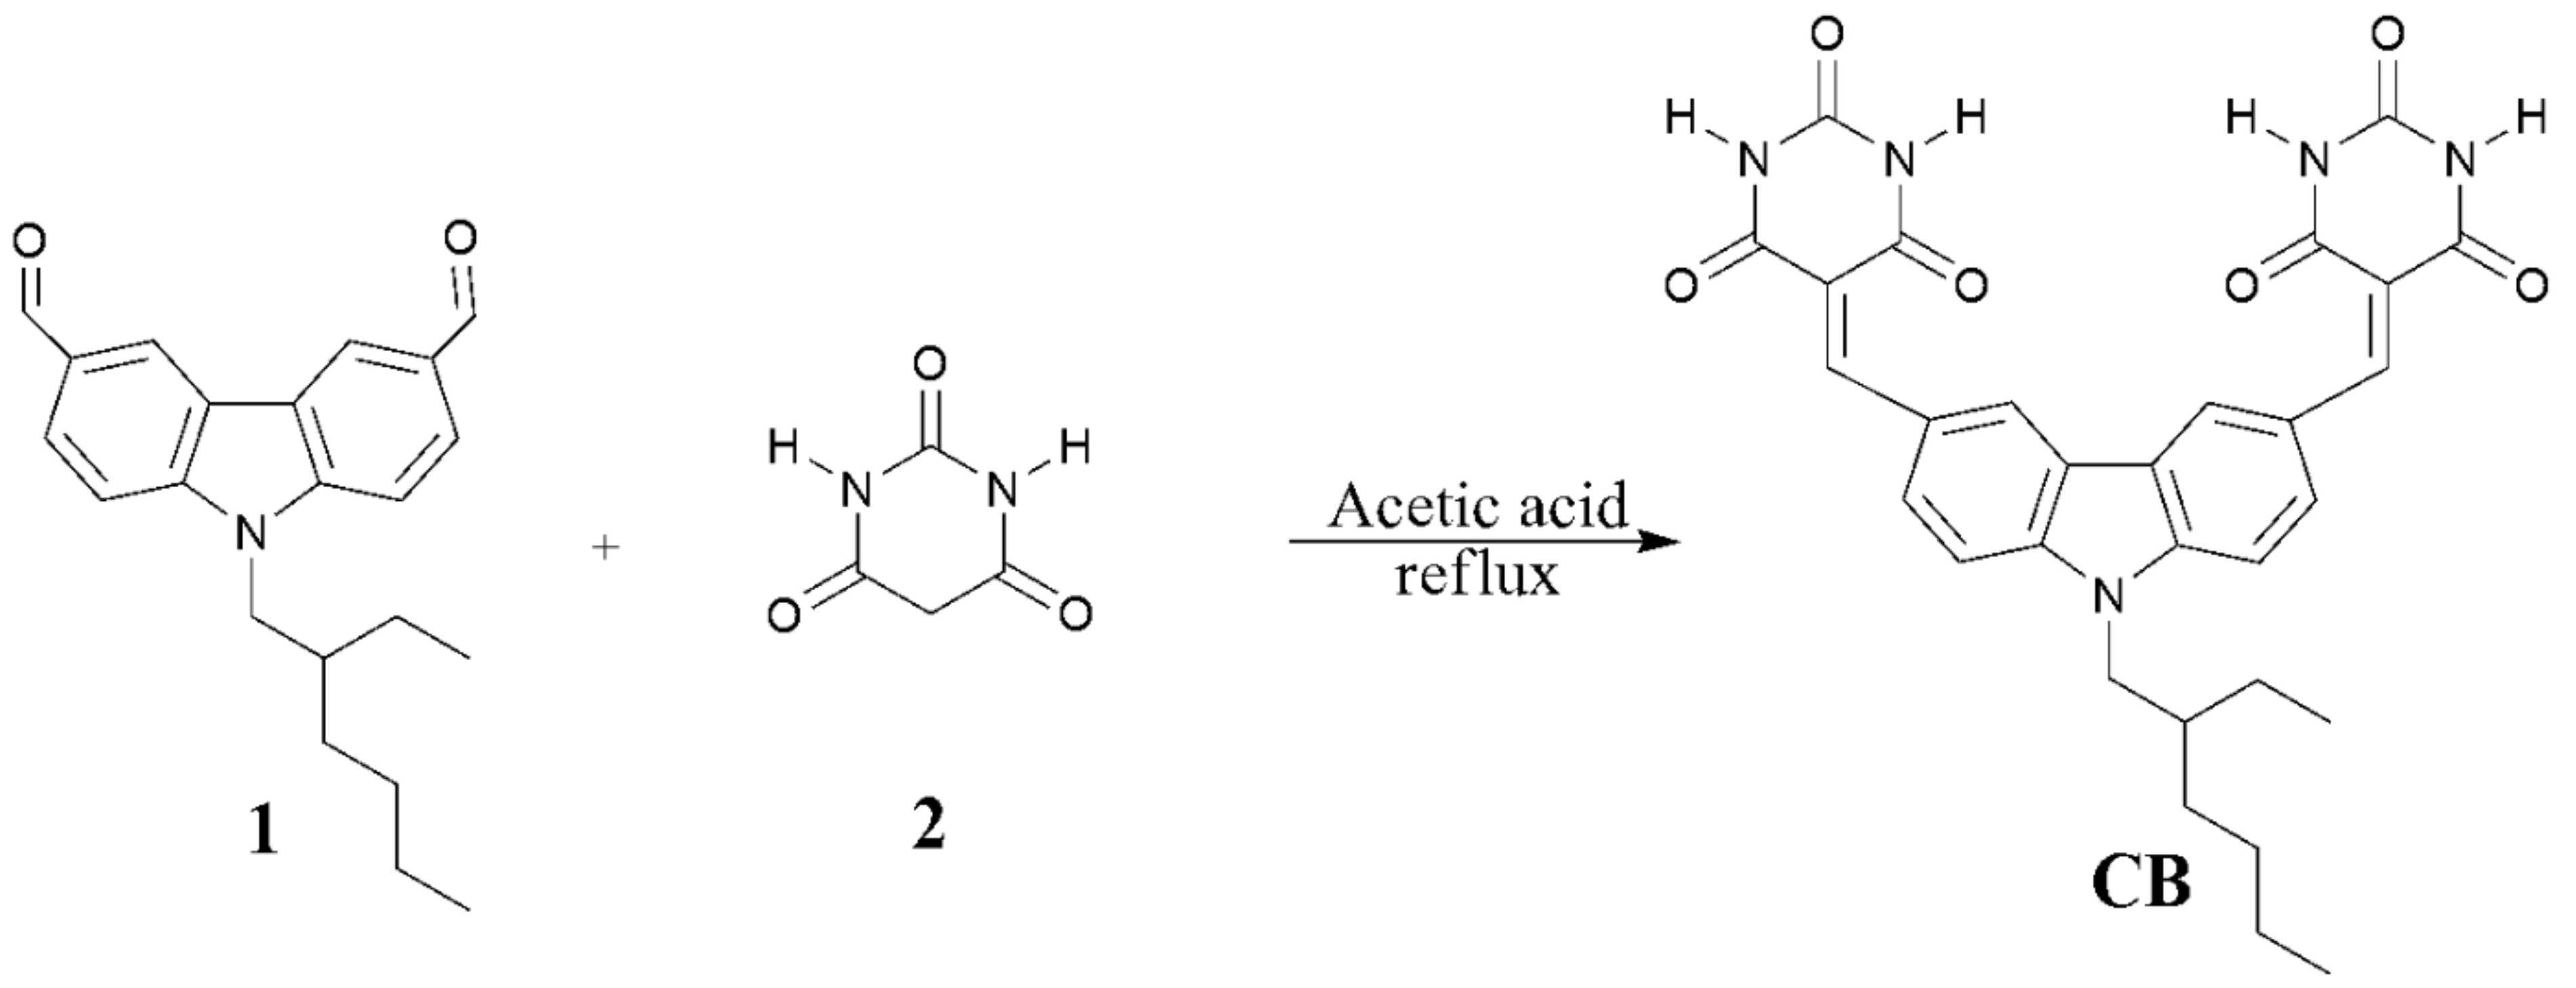
CB was synthesized as per previous literature [19,20]. Briefly, a mixture of 9-(2-Ethylhexyl) carbazole-3,6-dicarboxaldehyde (1.1 g, 3.3 mmol) and barbituric acid (0.85 g, 6.6 mmol) in acetic acid (30 mL) was heated at reflux for 2 h. The formed yellow precipitate was filtered while hot and washed with hot acetic acid (2 × 20 mL). The collected solid was dried in an oven at 90 °C for 3 h and then air-dried for 1 h [19,20]. Yield: 93%. FTIR (KBr): ν (cm−1) 3463.4, 3202.8, 3060.5, 2958.3, 2855.7, 1745.7, 1660.8, 1525.7, 1450.1, 1381.3, 1193.2, 1130.3, 795.24, 491.6; 1H NMR (400 MHz, d6-DMSO): δ (ppm) 11.35 (s, 2H), 11.25 (s, 2H), 9.39 (s, 2H), 8.50 (s, 2H), 8.49 (d, J = 9.2 Hz, 2H), 7.77 (d, J = 9.2 Hz, 2H), 4.41 (d, J = 7.2 Hz, 2H), 2.02 (m, 1H), 1.40–1.12 (m, 8H), 0.87 (t, J = 7.2 Hz, 3H), 0.78 (t, J = 7.2 Hz, 3H); 13C NMR (100.5 MHz, d6-DMSO): δ (ppm) 164.5, 162.8, 156.7, 150.8, 144.5, 134.8, 128.7, 125.2, 122.8, 115.9, 110.7, 47.6, 30.5, 28.4, 24.0, 22.9, 14.2, 11.1. MS m/z 556.37 [M + H]+, calculated for C30H30N5O6 556.22.
2.2. Preparation of CB Aggregates and Study of Absorption/Emission Profiles
A stock solution of CB (1 mM) was prepared in organic solvent dimethyl sulfoxide (DMSO). Aliquots of CB stock solution were transferred to glass tubes containing appropriate volume fractions of DMSO and water (fw values of 0–99%), maintaining 10 µM sensor concentration. The fluorescence emission from each solution was recorded immediately after vigorous mixing at a scanning excitation wavelength of 465 nm and an emission wavelength range of 485–800 nm. To study the absorption properties of CB, UV absorption spectra of CB (10 µM in DMSO) were taken in a wavelength range of 250–600 nm.
2.3. Binding Studies
The binding interaction of the prepared molecules with melamine was studied first in an organic solvent to establish the mode of interaction. The fluorescence of the molecules was monitored for different levels of melamine.
2.3.1. Fluorescence Titrations
A solution of the sensor (10 μM, 2 mL) in the appropriate solvent system (fw = 0, 50 and 99%) placed into a 1-cm × 1-cm cuvette was titrated with a solution of melamine ranging from 0–1000 µM (0, 5, 10, 17.5, 22, 37, 50, 74, 98, 122, 146, 192, 238, 348, 455, 652, 1000 µM) containing the sensor (10 μM) in the same solvent. Aliquots of the melamine solution were added to the cuvette via transfer pipettes until a total of 100 molar equivalents of the anion had been added. The UV–vis and emission spectra (λex = 465 nm) were recorded after each addition.
2.3.2. Measurements Using 96-Well Plates
To analyze the efficacy of CB to detect melamine in an aqueous environment, the binding reactions of the sensor molecule with melamine and CA (in distilled water) were tested in a 96-well microtiter plate. A stock mixture containing 1 µM CB (prepared in DMSO) and 5 mM CA in distilled water was prepared. Aliquots of 25 µL of the mixture were transferred to microtiter plate wells, after which 25 µL of melamine solution (0–600 ppm) was added and mixed well. The plate underwent proper shaking for 30–60 s to achieve uniform mixing. After 30 min of incubation, the fluorescence emission from each well was measured at an emission wavelength of 520 nm and excitation wavelength of 490 nm via microplate reader. The experiments were repeated for three different batches in triplicate trials.
2.3.3. Analysis of Dairy Products
To study the effect of CB on dairy products, the 96-well plate experiment described in Section 2.3.2 was repeated replacing the melamine solution with baby food milk (100 mg/mL) spiked with different levels of melamine (0–600 ppm). The experiments were repeated for three different batches in triplicate trials.
3. Results and Discussion
3.1. Design and Synthesis of CB
The fluorescent sensor was prepared in a one-step reaction (Scheme 2) of 9-(2-ethylhexyl) carbazole-3,6-dicarboxaldehyde (1) and barbituric acid (2) in acetic acid with excellent yield [19,20].
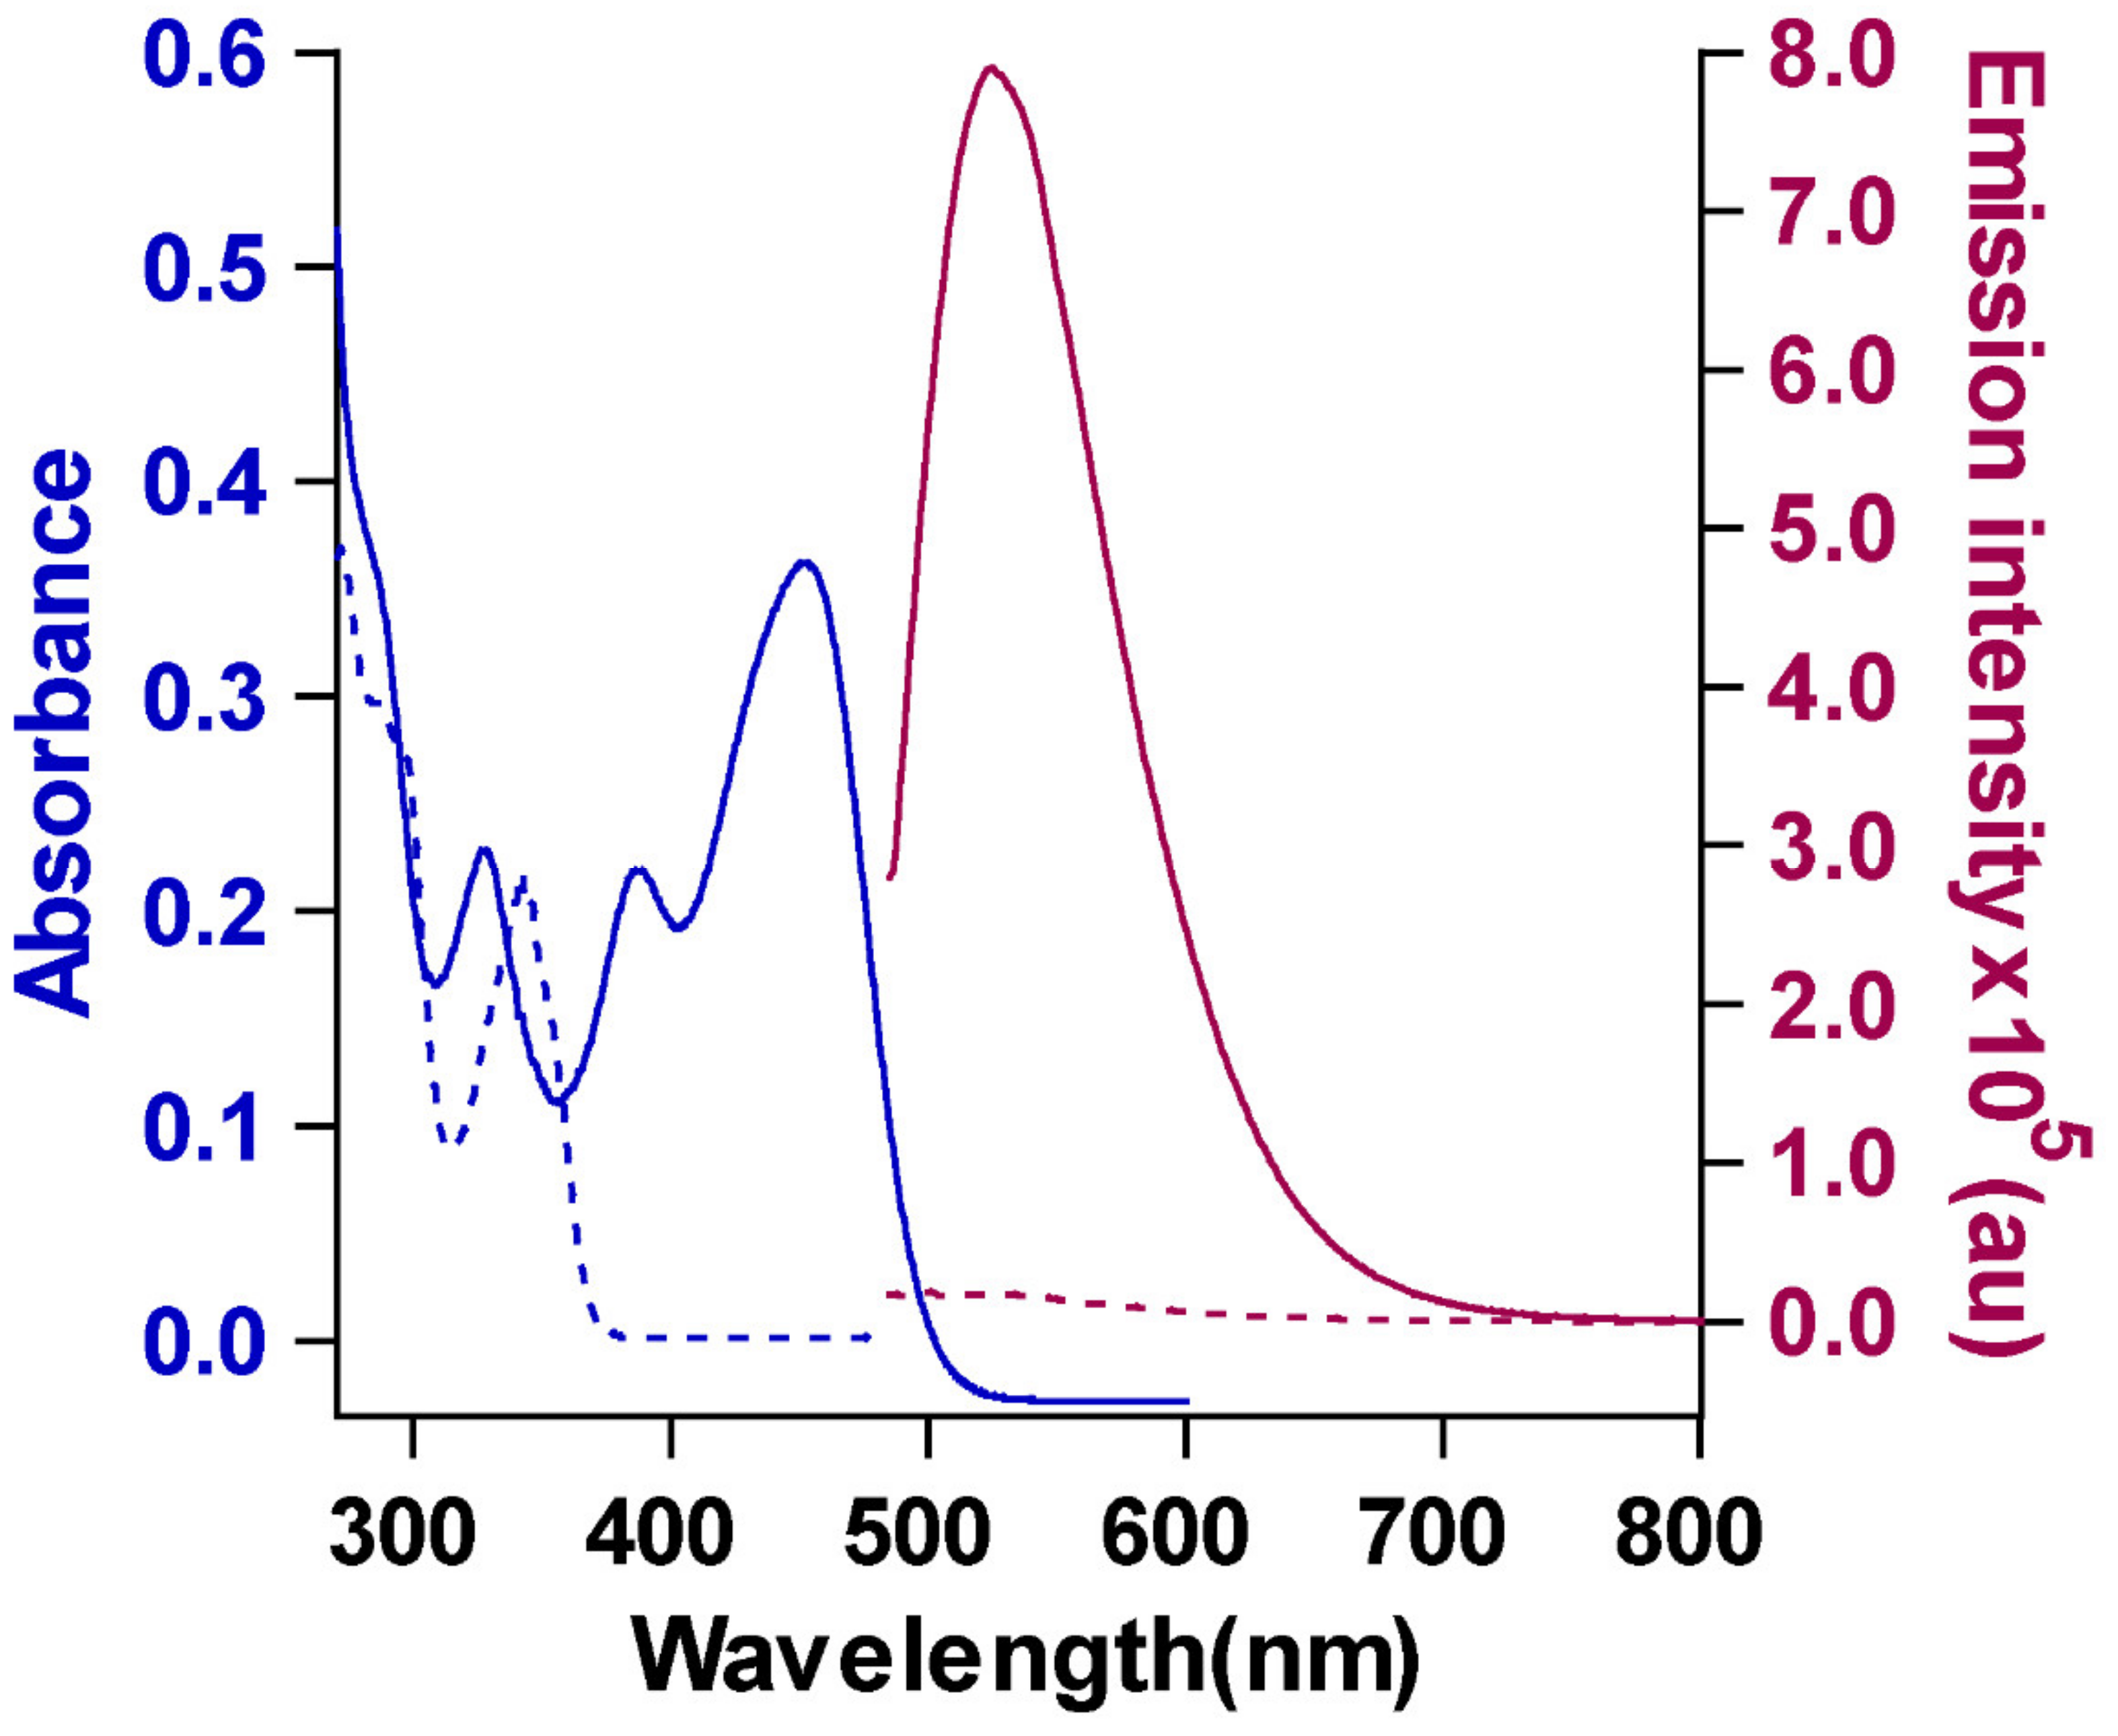
The absorption and emission spectra of CB showed the characteristic peaks of carbazole fluorophore at 284, 327, 386, and 453 nm in the UV spectrum and an emission peak at 520 nm upon excitation at 465 nm. The absorption peak at 450 nm indicates the presence of the extended conjugation of the fluorophore with the two barbiturate groups, which leads to absorption at a higher wavelength [19]. The emission peak was also shifted to a higher wavelength compared to that of the starting material (1) (Figure 1), but at a much lower intensity; these observations were most likely due to the extended conjugation.
3.2. Binding Studies of CB to Melamine
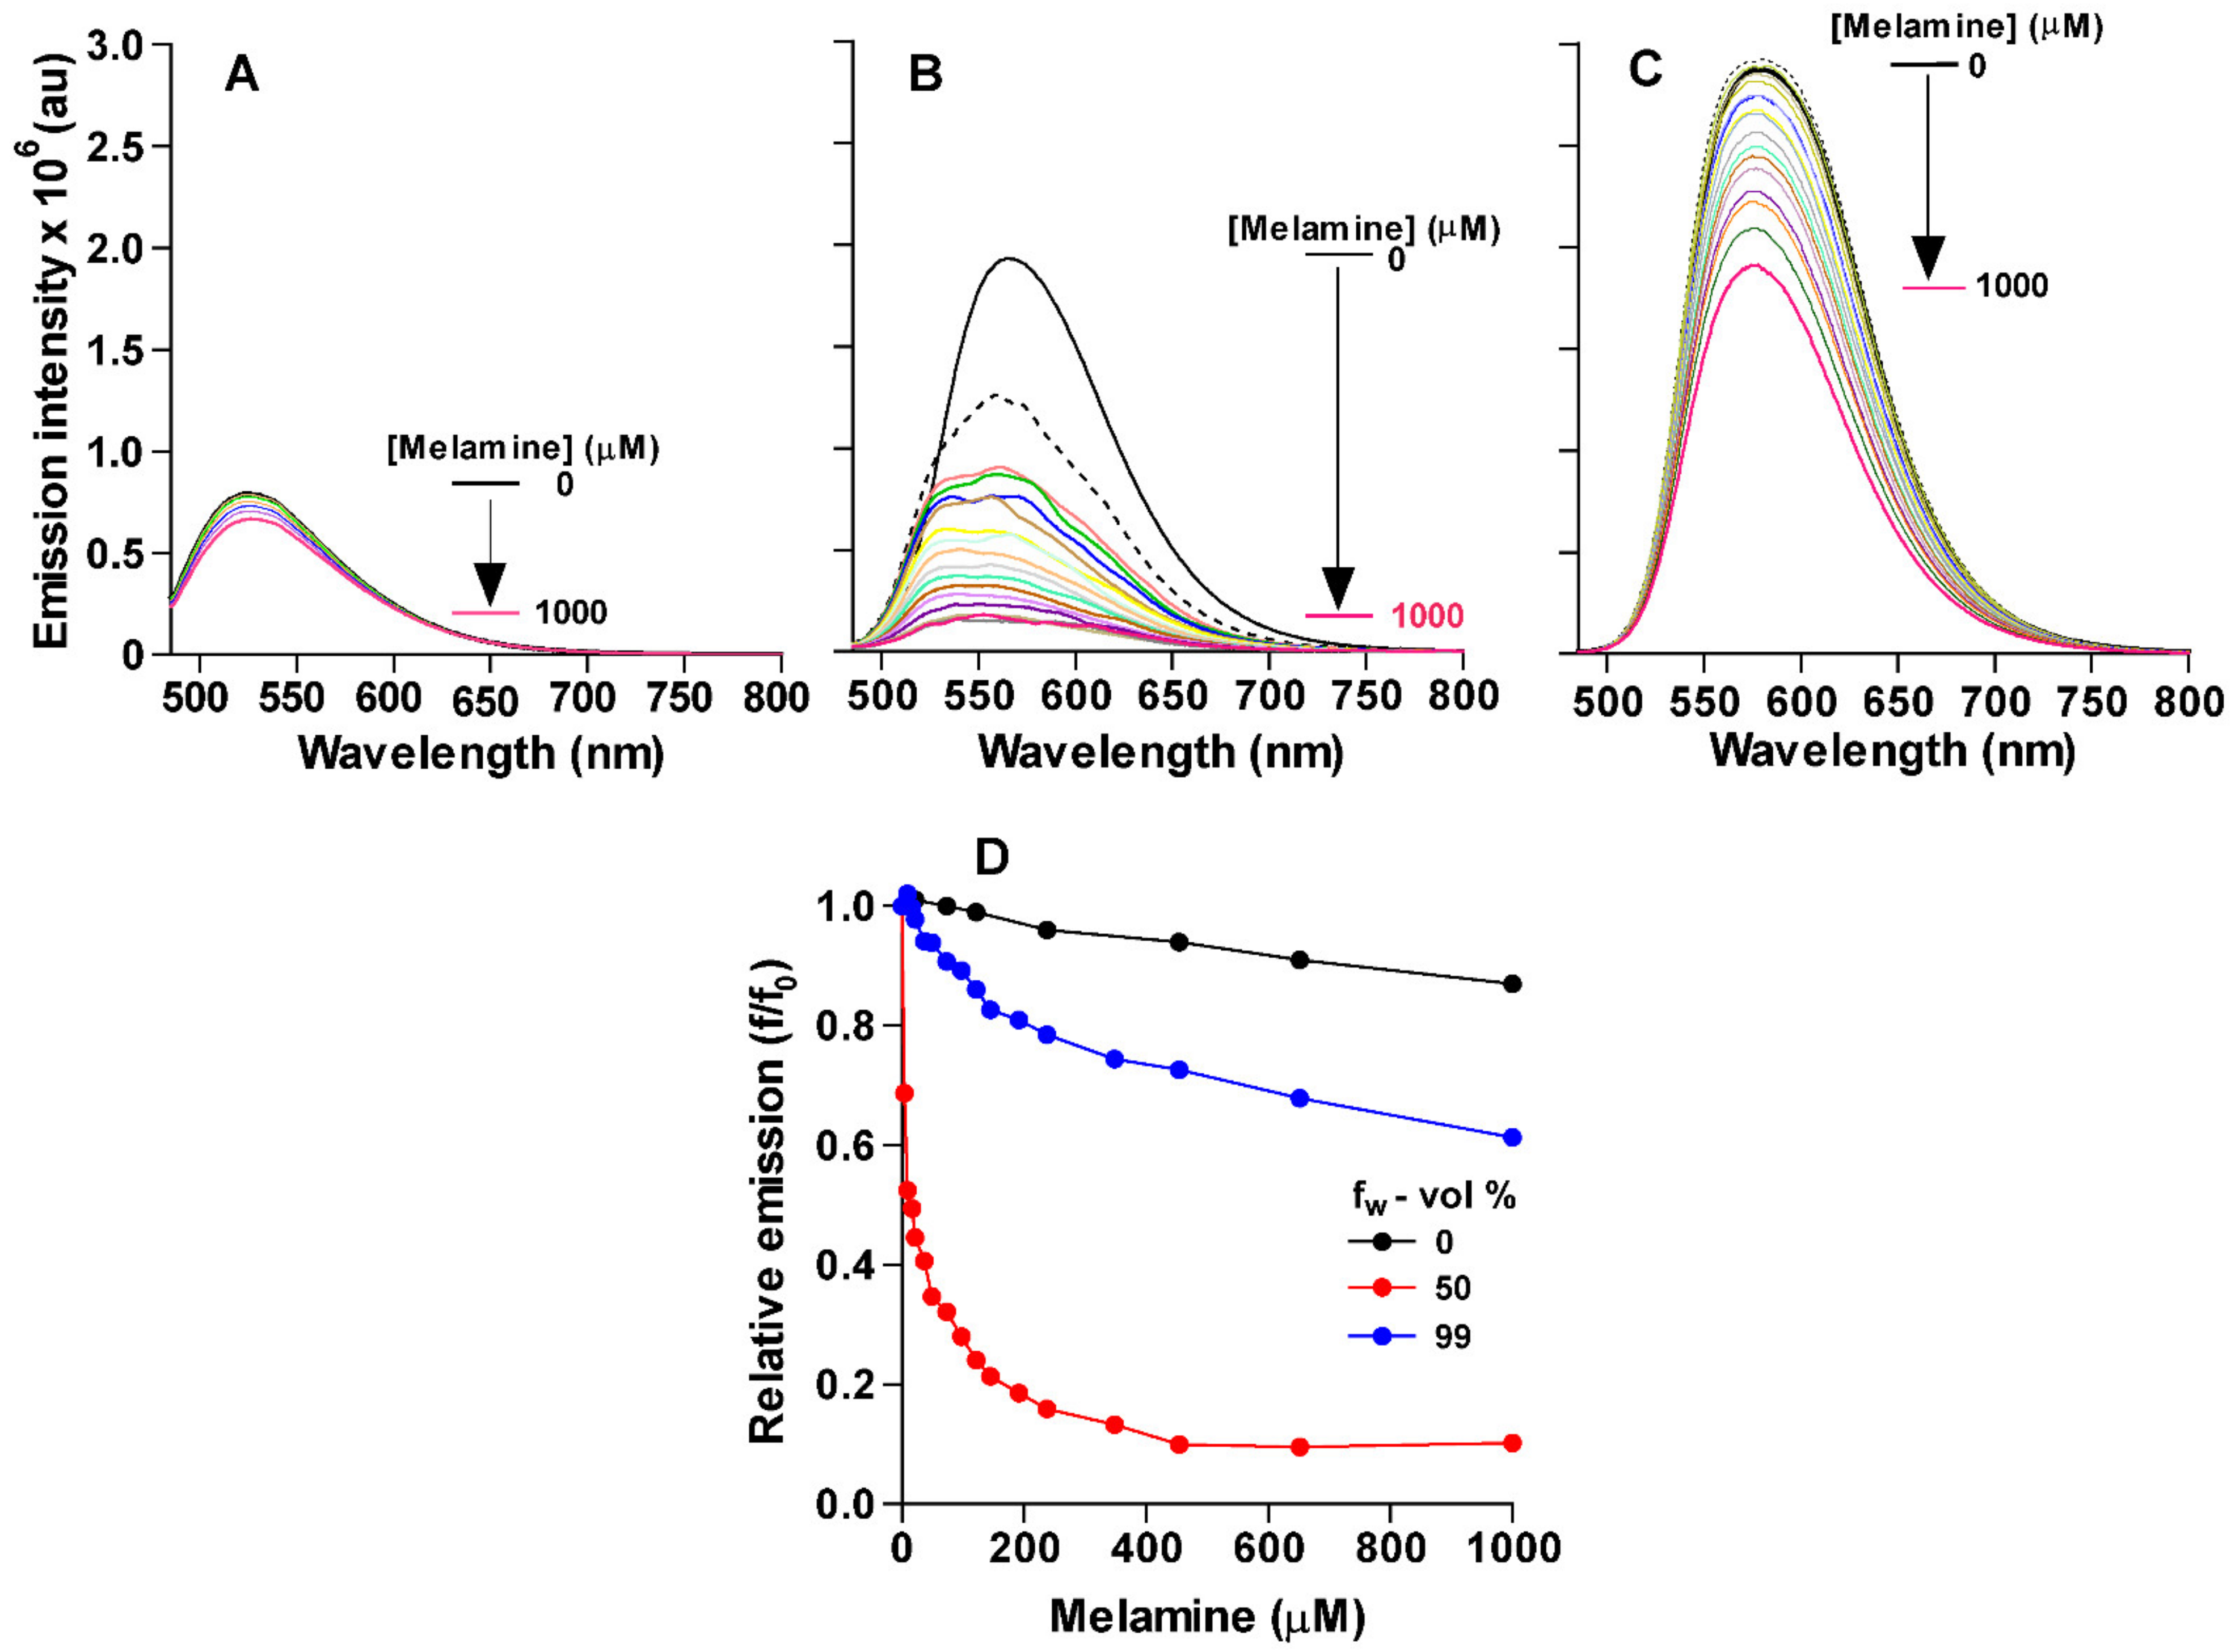
To evaluate the ability of CB as a fluorescent sensor for melamine, the fluorescence of CB was monitored as the melamine concentration increased in the solution. Figure 2A shows the emission spectra of CB (10 µM) upon titrating with aliquots of melamine solution (0–1000 µM) in DMSO. The total emission of CB decreased as the concentration of melamine increased from 10 to 1000 µM. This change in emission was minor but noticeable (it decreased by approximately 10% at 1000 µM of melamine) and can be attributed to the interaction of melamine with the barbiturate groups through hydrogen bonding.
In order for CB to be an effective sensor for melamine in food samples, we needed to test its ability to detect melamine in an aqueous environment. Hence, we monitored the emission spectra of CB at different concentrations of melamine in 50% aqueous solution (1:1 volume ratio of DMSO and H2O) and in 99% aqueous solution (1:99 volume ratio of DMSO and H2O). The obtained spectra (Figure 2B,C) showed that there was a significant decrease in the emission intensity of CB upon the increase in the concentration of melamine for both solutions, but to different extents. The results in 50% aqueous solutions showed that the emission decreased by 80% as the concentration of melamine increased to 200 µM or higher. However, the decrease in the 99% aqueous solution was to a much lower extent, reaching approximately 30% after 100 molar equivalents of melamine were added (at 1000 µM). This stronger effect of melamine on emissions in aqueous solutions as compared to DMSO was interesting, since H-bonding interactions between the sensor and melamine usually weaken in aqueous solutions. Another interesting observation from these titrations was the enhanced initial emission of CB as the concentration of water increased in the solution. The emission peak also shifted to higher wavelengths as the concentration of water in the solution increased. Thus, we further investigated the effect of water fraction (fw in the solution on the total emission of CB.
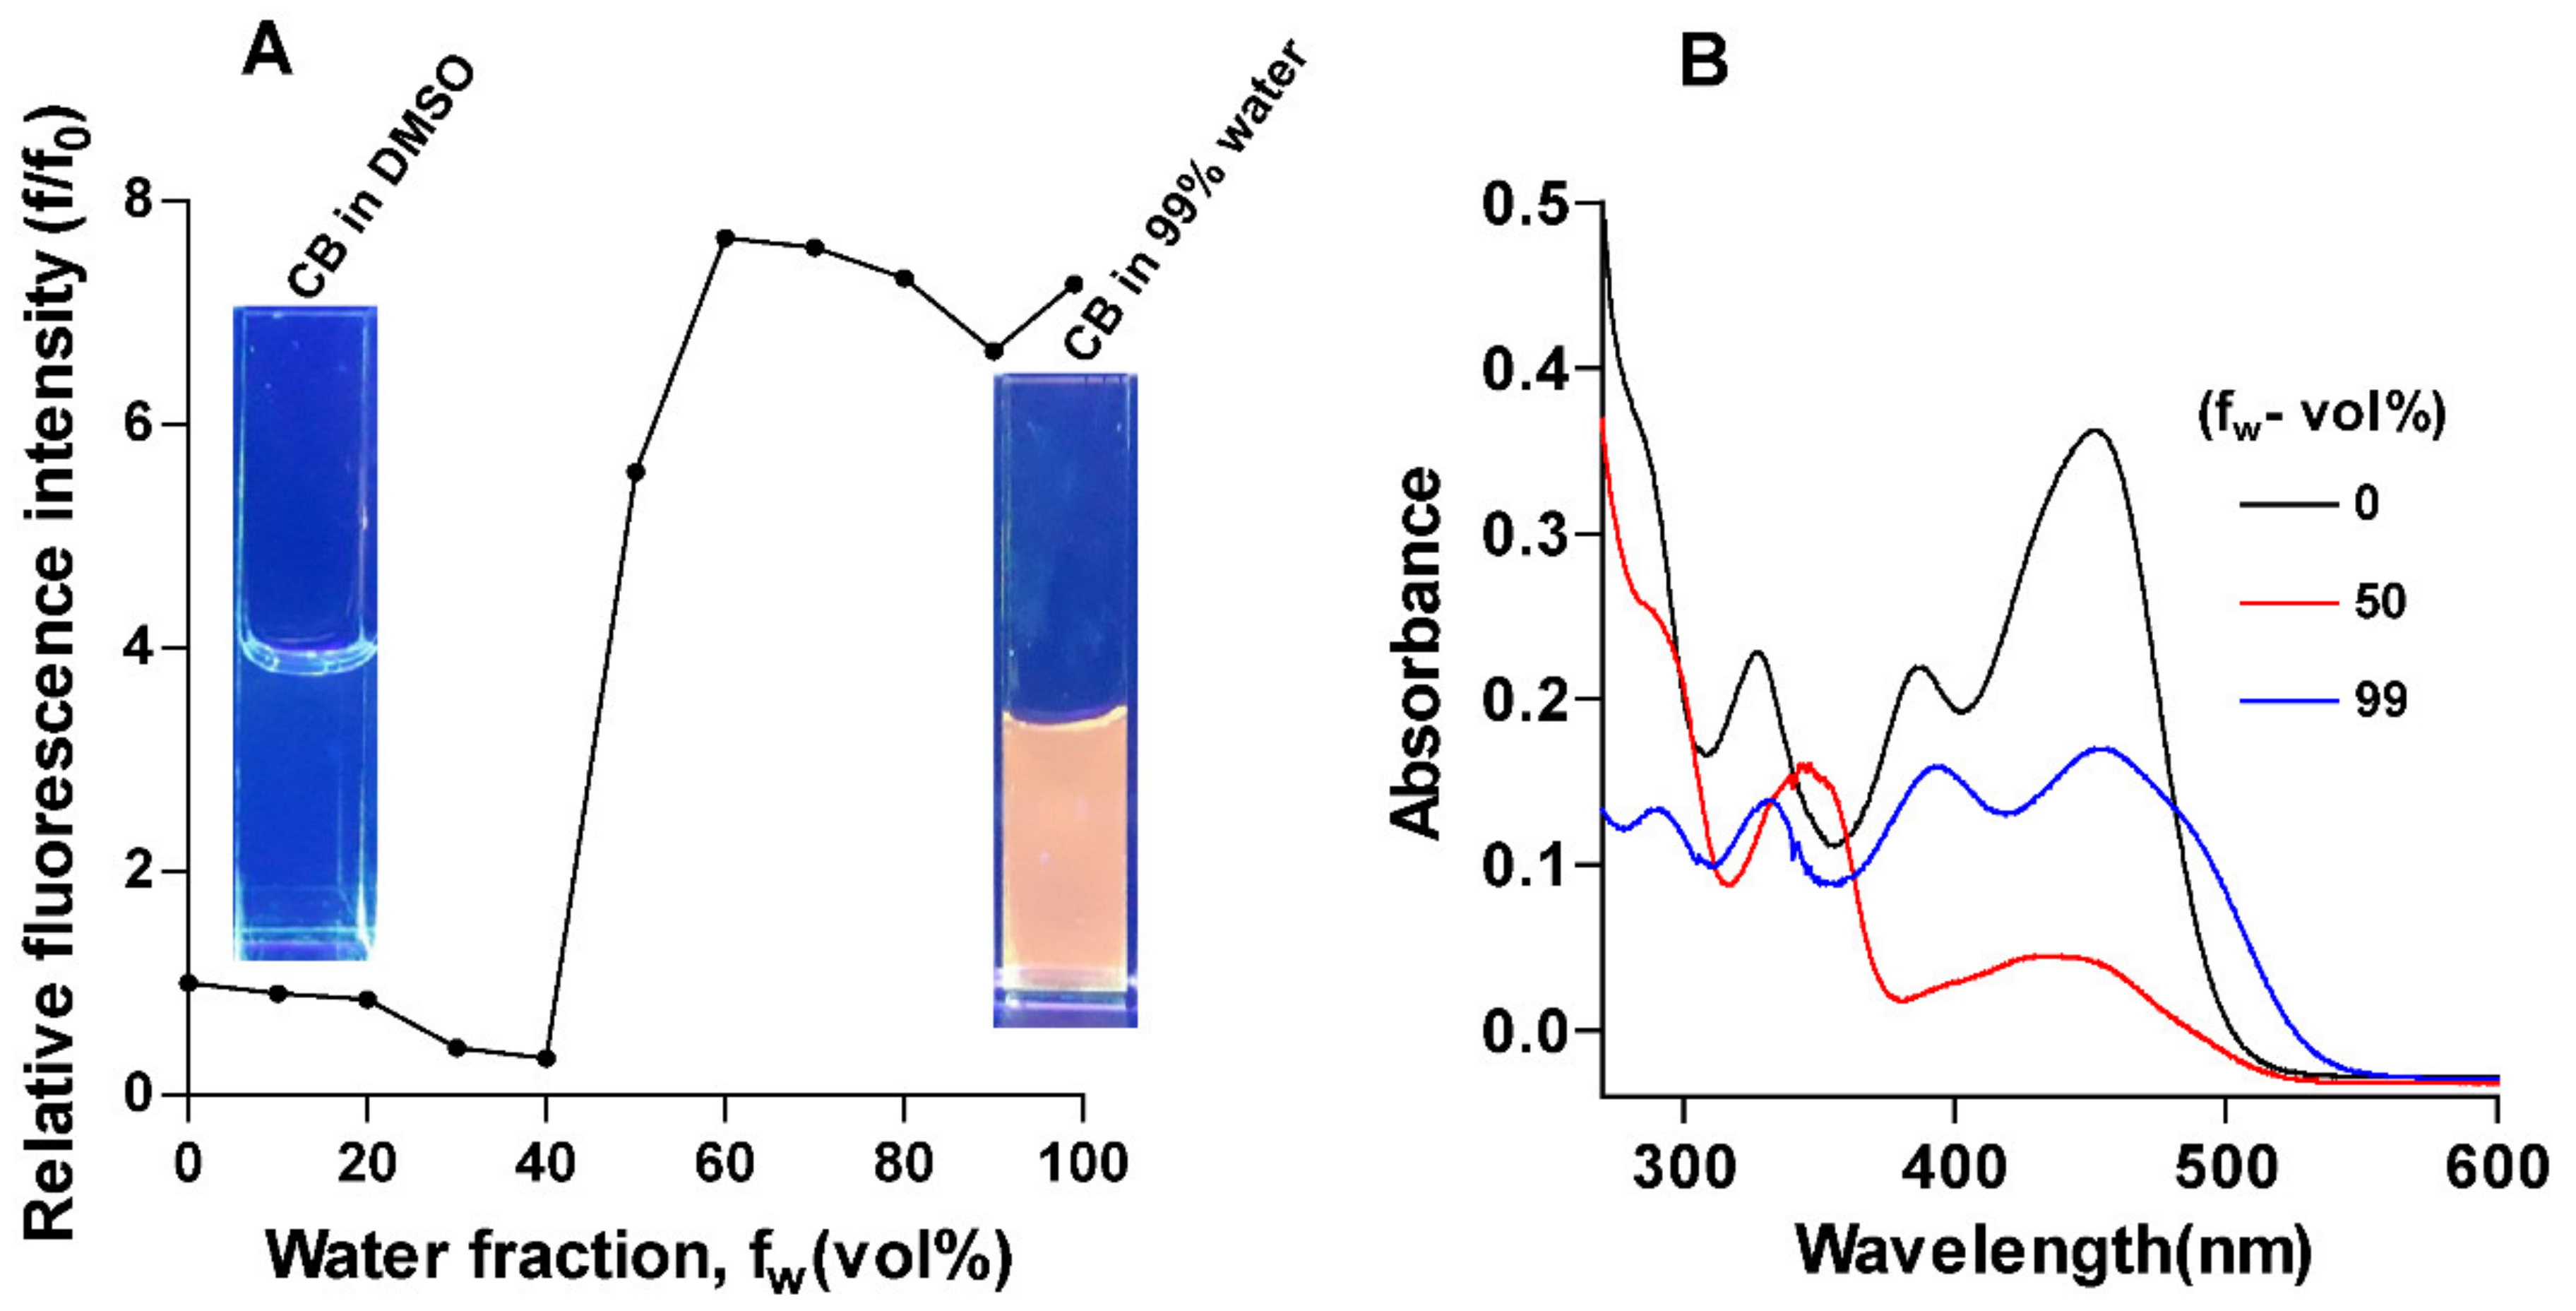
Figure 3 shows the change in the total emission of CB with a systematic increase in the concentration of water in DMSO. As water fraction (fw) in the CB solution increased, the total fluorescence emission of the sensor enhanced significantly (Figure 3A). Initially, as the water fraction increased from 0 to 40%, the total emission of CB slightly decreased (Figure 3A). However, with further increase of the water fraction to 60%, the emission increased by approximately 800% concomitant with a slight shift of emission peak to a higher wavelength; the emission did not show any significant further change as fw increased up to 99% water. The fluorescence enhancement of CB solution was visually observed under UV light illumination of the solution (Figure 3A insets).
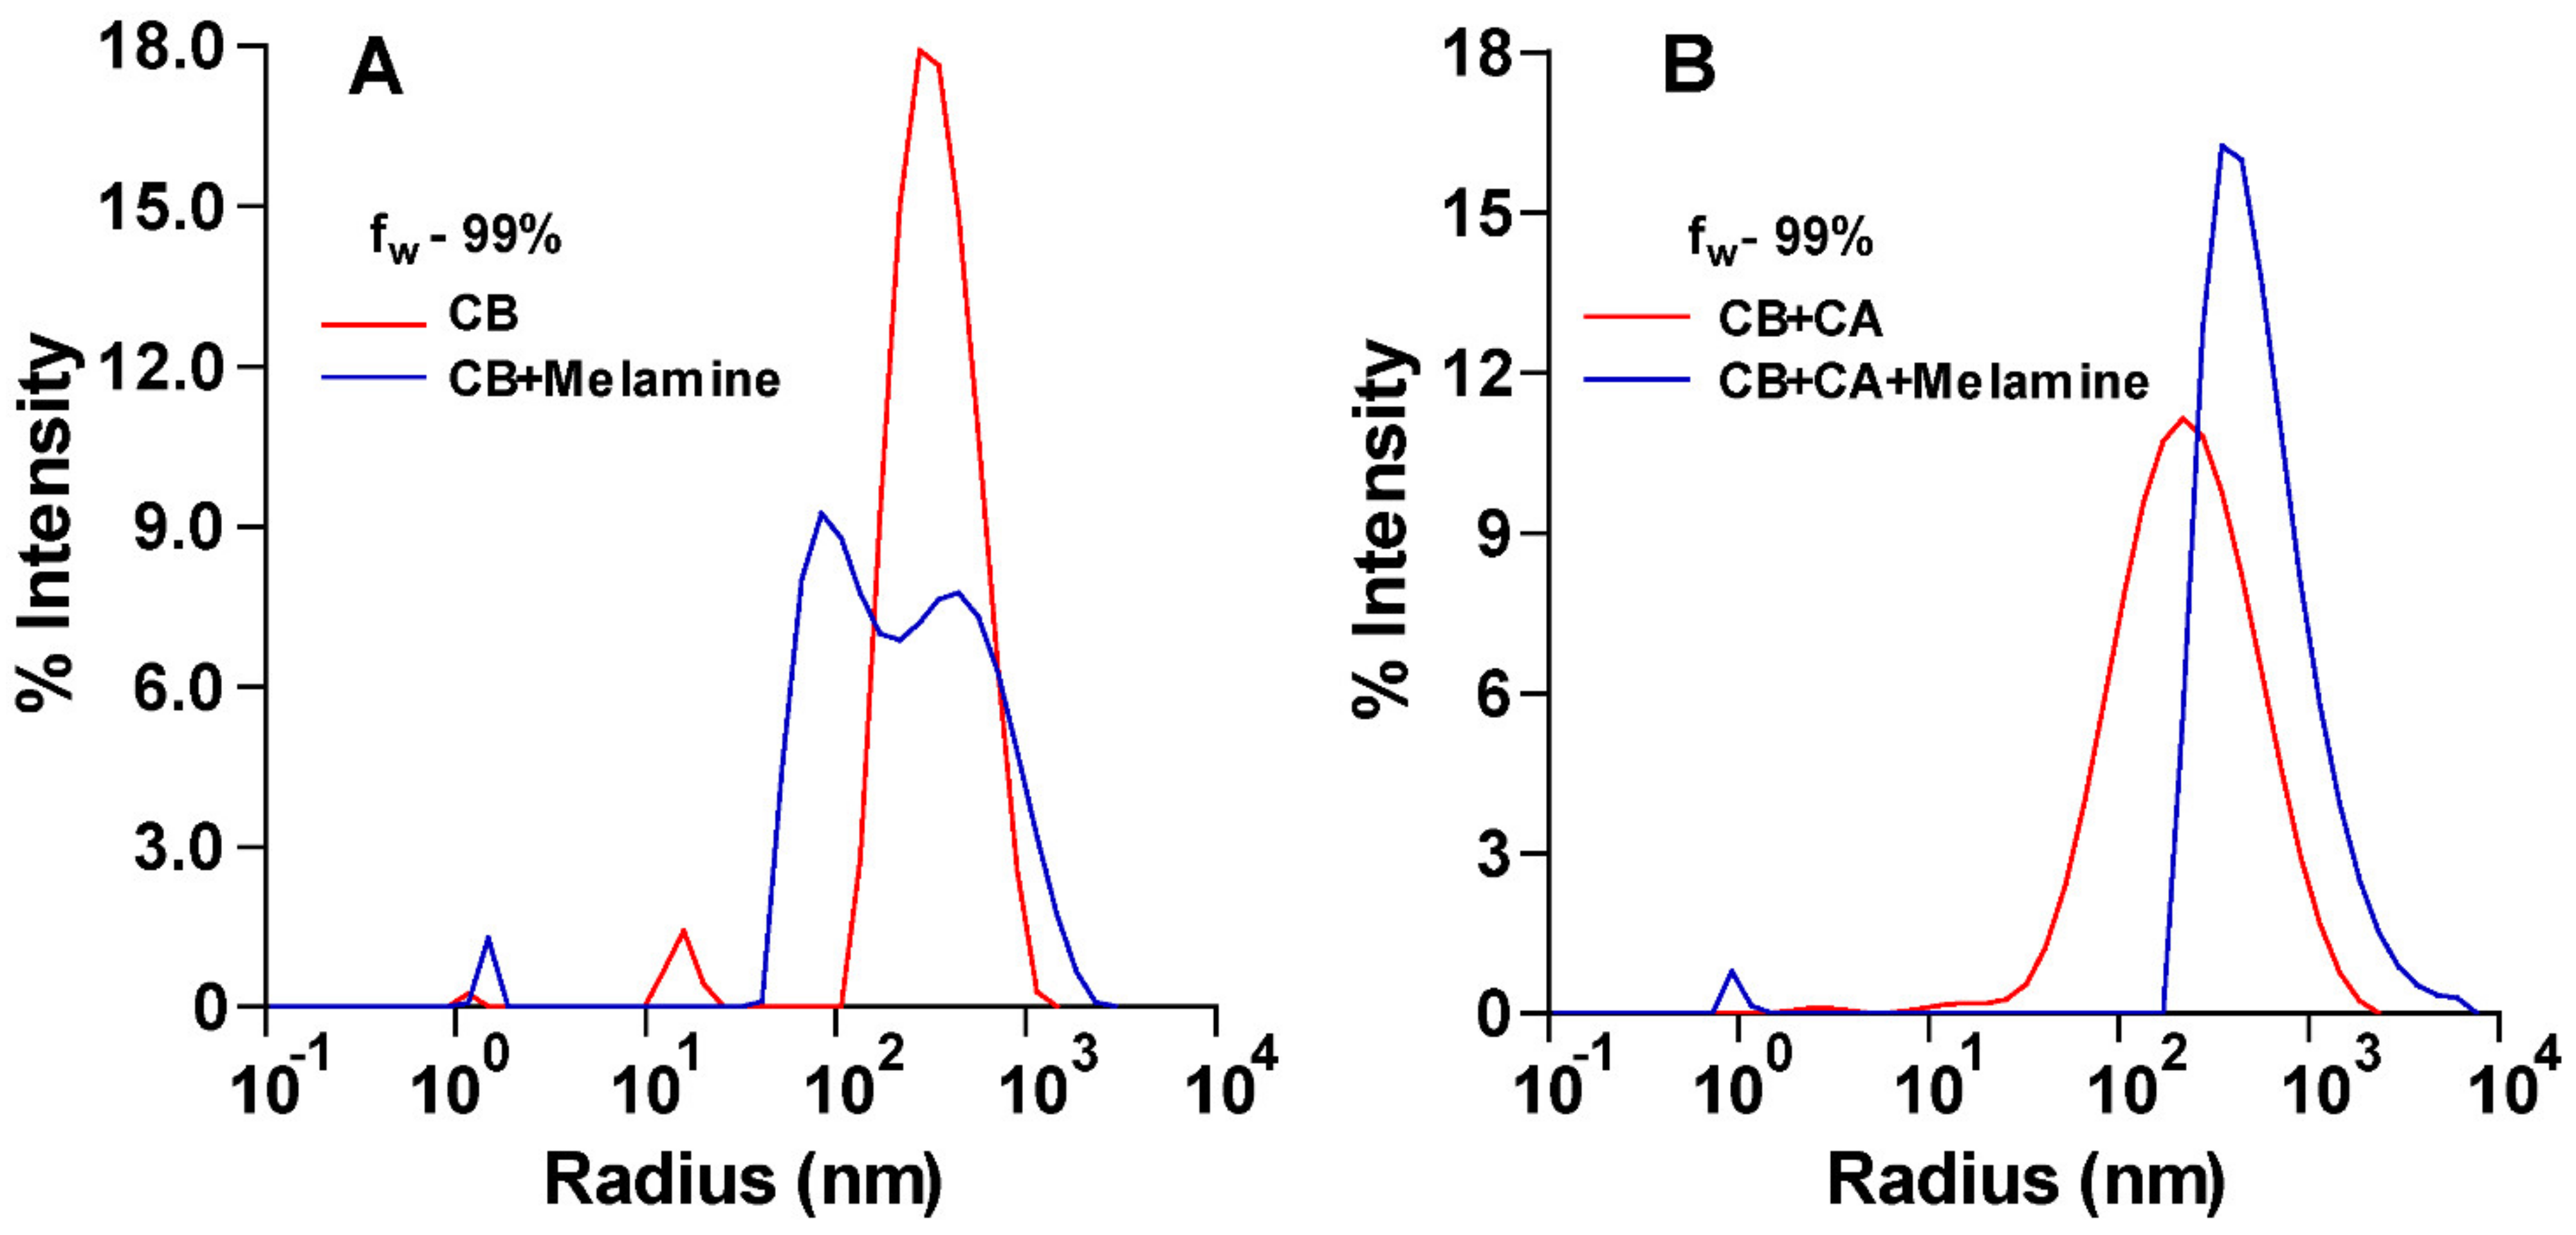
We attributed this enhancement of the emission to aggregation of the hydrophobic sensor as the water content of the solvent increased; such aggregation-induced emission (AIE) of similar barbiturate systems was reported previously [20,21]. To further support this explanation, we ran dynamic light scattering (DLS) measurements on the CB solution at fw = 99% which showed the presence of aggregates with a mean radius size of ~313 nm and a polydispersity range (Pd) of 25.8%. In addition, the UV spectra of CB at different water fractions (Figure 3B) showed that the relative intensity of the peak at 450 nm decreased as fw increased. The decrease in the intensity of this low-energy absorption suggests that as aggregation increases, the extended conjugation of the carbazole fluorophore with the barbiturate group becomes more restricted. Thus, the AIE of CB can be attributed to the restricted rotation around the bond connecting the barbiturate with the carbazole upon aggregation [20,21]. This restricted rotation prevents the conjugation between the two units and suppresses the non-radiative relaxation channels. On the other hand, DLS measurements (Figure 4) conducted on CB solutions (fw = 99%) before and after the addition of melamine showed that the size distribution of the aggregates shifted towards smaller radii. These results suggest that the decrease in the emission of CB in aqueous solution upon addition of melamine can be attributed to the interaction of melamine with the sensor, which led to a decrease in aggregation.
3.3. Design and Studies of AIE Assay for Detection of Melamine
Thus, since the experiments above indicated that aggregation of CB leads to enhancement of its emission, we designed an assay such that melamine presence enhances aggregation, which in turn enhances the emission of CB. It is well established in the literature that melamine binds strongly to cyanuric acid in an aqueous solution, leading to the formation of aggregates and precipitates [22,23,24]. Hence, we hypothesized that the presence of cyanuric acid (CA) in CB solution would lead to the formation of aggregates upon the addition of melamine; the formation of these aggregates would further enhance the aggregation of CB as the CA-melamine aggregates provide an adsorption surface for CB aggregation, facilitated by the formation of strong H-bonding interaction with melamine. The addition of CA alone to a CB solution has no significant effect on the emission of CB.
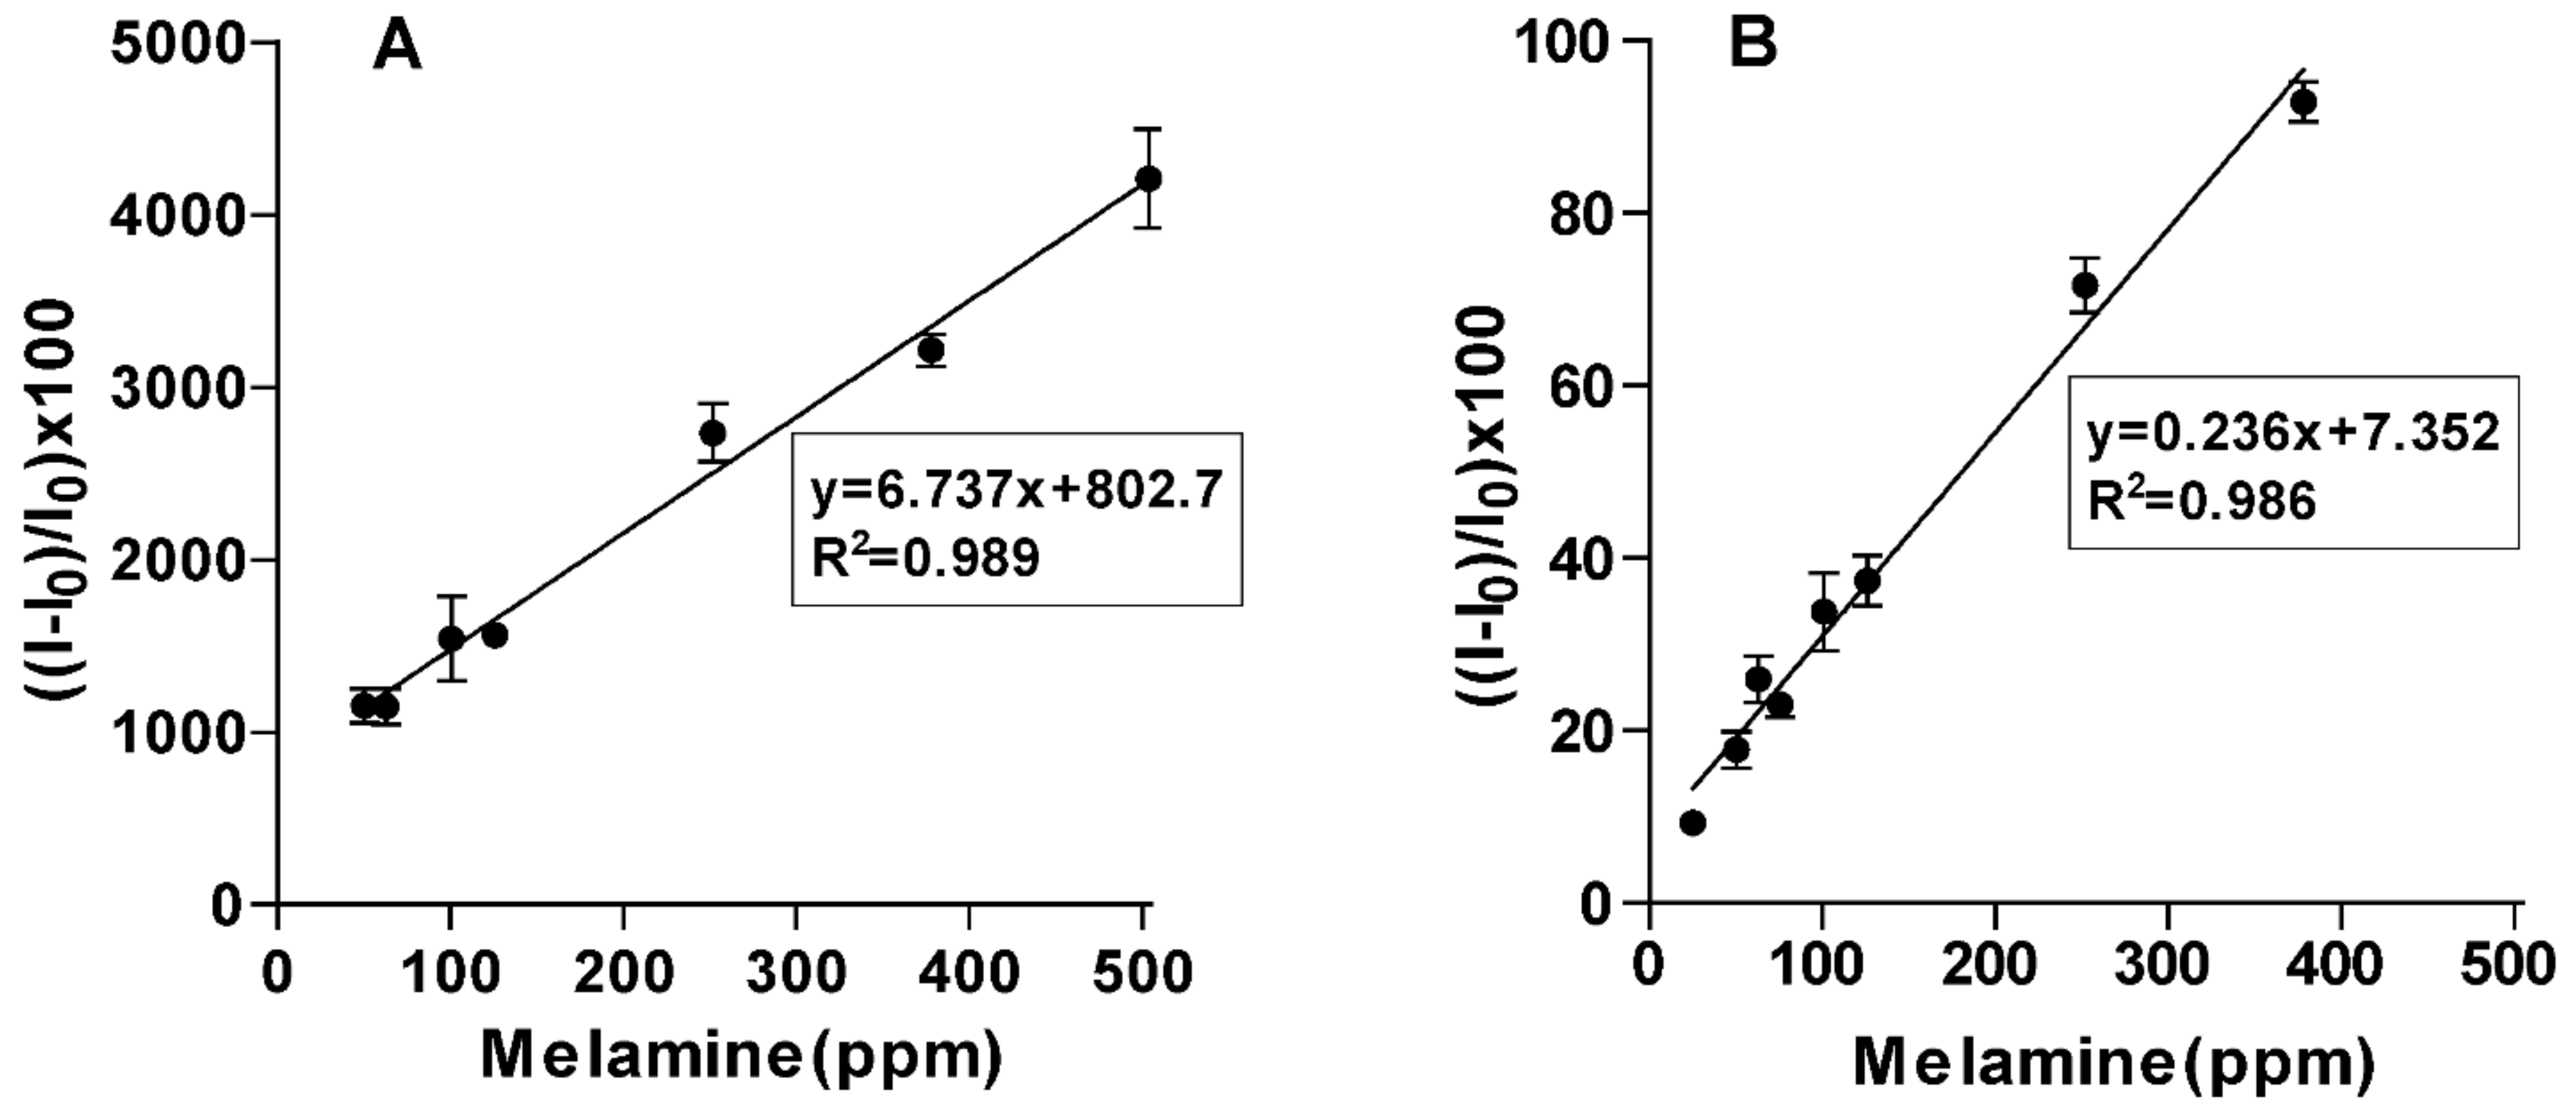
In order to test our hypothesis, first, DLS measurements (Figure 4B) were conducted for a solution of CB (1.0 µM) and CA (5 mM) before and after the addition of melamine at 0.78 mM (100 ppm). The results (Figure 4B) showed that the aggregate size distribution shifted to larger sizes upon the addition of melamine, supporting the idea that the presence of melamine increases aggregation. Second, we measured the effect of melamine concentration on the fluorescence of a solution mixture of CB (1.0 µM) and CA (5 mM). The fluorescence measurements (λem = 520 nm and λex = 490 nm) were conducted using a 96-well plate with each well containing a solution (fw = 99%) mixture of CB (1.0 µM), CA (5 mM) and melamine at different concentrations (0–600 ppm). The results showed that as the concentration of melamine in the solution increased from 0 to 4.7 mM (0–600 ppm), the relative change in emission intensity of the CB–CA solution versus its initial emission increased by over 40-fold. This change was linearly correlated with the concentration of melamine in the range 50–500 ppm (Figure 5A).
Then, we tested the applicability of this method for determining the concentration of melamine in powder milk. Samples of powder milk were spiked with different concentrations of melamine and the samples were introduced to CB–CA solutions in a 96-well plate. The results showed that the relative change in CB–CA fluorescence increased by approximately 120% as the concentration of melamine increased to 600 ppm. The relative change in fluorescence was linearly correlated with the concentration of melamine in the milk at the range of 25–380 ppm (exhibited in Figure 5B) with a limit of detection of 15.4 ppm. This is slightly above the acceptable concentration of melamine in food products, and lower than the LOD of recently reported methods (Table S1, Supplementary Materials) [25,26,27,28,29,30,31,32,33,34]. However, this process is simple and quick and can provide a quick screening method for dairy samples.
4. Conclusions
We reported here the design and binding investigations of a novel fluorescent sensor for melamine. The results showed that the fluorescence of the sensor CB responded to the presence of melamine in both DMSO and aqueous solutions. CB was shown to be an AIE sensor, where the increase in water fraction in the solution enhanced its aggregation and hence emission. In addition, the interaction of melamine with cyanuric acid in aqueous solutions enhanced the fluorescence of CB due to the enhancement of aggregation between melamine and CA. Therefore, a CB–CA mixture solution may be employed to measure melamine concentration in contaminated dairy samples at concentrations at or above the acceptable limits.
Supplementary Materials
The following supporting information can be downloaded at: https://0-www-mdpi-com.brum.beds.ac.uk/article/10.3390/chemosensors10010013/s1, Figure S1: Proton NMR spectrum of CB in DMSO-d6; Figure S2: Absorbance and fluorescence spectra of CB. (A) Emission spectra of CB (10 μM) for different fw (0–99%). (B) UV-vis absorption spectra of CB (10 μM) for fw (0–99%); Figure S3: Effect of melamine concentration in (A) distilled water and (B) milk aqueous system on the fluorescence intensity of CB-CA solution (λem = 520 nm, λex = 490 nm). For the microplate experiment, ‘I’ represents the emission intensity (au) obtained from well solutions having different melamine levels and I0 corresponds to the emission intensity of wells that are free of melamine. The error bars indicate the standard deviation values for the triplicate readings for the three different set of experiments; Table S1: Comparison of reported detection methods for melamine.
Author Contributions
M.H.A.-S. and R.R. contributed to the idea, data collection and analysis, and manuscript preparation. R.F.V. contributed to data collection and analysis. All authors have read and agreed to the published version of the manuscript.
Funding
Funding was provided by the American University of Sharjah, UAE (grant #FRG16-R-01 and #BBRI18-CAS-05) and, in part, by the Open Access Program at the American University of Sharjah, UAE (grant # OAPCAS-1110-C00017).
Institutional Review Board Statement
Not applicable.
Informed Consent Statement
Not applicable.
Data Availability Statement
Not applicable.
Acknowledgments
The authors acknowledge the technical and logistics support of the BCE Department, the Drug Delivery Lab, the Office of Research, at the American University of Sharjah, UAE and RISE lab at University of Sharjah, UAE.
Conflicts of Interest
The authors declare that there are no known conflicts of interest associated with the study.
Disclaimer
This paper represents the opinions of the authors and does not mean to represent the position or opinions of the American University of Sharjah.
References
- Tyan, Y.-C.; Yang, M.-H.; Jong, S.-B.; Wang, C.-K.; Shiea, J. Melamine Contamination. Anal. Bioanal. Chem. 2009, 395, 729–735. [Google Scholar] [CrossRef] [PubMed]
- Singh, P.; Gandhi, N. Milk Preservatives and Adulterants: Processing, Regulatory and Safety Issues. Food Rev. Int. 2015, 31, 236–261. [Google Scholar] [CrossRef]
- World Health Organization & Food and Agriculture Organization of United Nations. Toxicological and Health Aspects of Melamine and Cyanuric Acid: Report of a WHO Expert Meeting in Collaboration with FAO, Supported by Health Canada, Ottawa, Canada, 1–4 December 2008; World Health Organization: Geneva, Switzerland, 2009. [Google Scholar]
- Neng, J.; Tan, J.; Jia, K.; Sun, P. A Fast and Cost-Effective Detection of Melamine by Surface Enhanced Raman Spectroscopy Using a Novel Hydrogen Bonding-Assisted Supramolecular Matrix and Gold-Coated Magnetic Nanoparticles. Appl. Sci. 2017, 7, 475. [Google Scholar] [CrossRef] [Green Version]
- Rovina, K.; Siddiquee, S. A Review of Recent Advances in Melamine Detection Techniques. J. Food Compos. Anal. 2015, 43, 25–38. [Google Scholar] [CrossRef]
- Li, Y.; Xu, J.; Sun, C. Chemical Sensors and Biosensors for the Detection of Melamine. RSC Adv. 2015, 5, 1125–1147. [Google Scholar] [CrossRef]
- Ai, K.; Liu, Y.; Lu, L. Hydrogen-Bonding Recognition-Induced Color Change of Gold Nanoparticles for Visual Detection of Melamine in Raw Milk and Infant Formula. J. Am. Chem. Soc. 2009, 131, 9496–9497. [Google Scholar] [CrossRef]
- Wu, Z.; Zhao, H.; Xue, Y.; He, Y.; Li, X.; Yuan, Z. Colorimetric Determination of Melamine by Pyridine-3-Boronic Acid Modified Gold Nanoparticles. J. Nanosci. Nanotechnol. 2012, 12, 2412–2416. [Google Scholar] [CrossRef]
- Shellaiah, M.; Sun, K. Review on Nanomaterial-Based Melamine Detection. Chemosensors 2019, 7, 9. [Google Scholar] [CrossRef] [Green Version]
- Siddiquee, S.; Saallah, S.; Bohari, N.A.; Ringgit, G.; Roslan, J.; Naher, L.; Hasan Nudin, N.F. Visual and Optical Absorbance Detection of Melamine in Milk by Melamine-Induced Aggregation of Gold Nanoparticles. Nanomaterials 2021, 11, 1142. [Google Scholar] [CrossRef]
- Aberkane, F.; Abdou, I.; Zine, N.; Jaffrezic-Renault, N.; Elaissari, A.; Errachid, A. Sensor Based on a Poly[2-(Dimethylamino)Ethyl Methacrylate-Co-Styrene], Gold Nanoparticles, and Methylene Blue-Modified Glassy Carbon Electrode for Melamine Detection. Sensors 2021, 21, 2850. [Google Scholar] [CrossRef]
- Oh, S.; Lee, M.; Heo, N.; Kim, S.; Oh, J.; Lee, Y.; Jeon, E.; Moon, H.; Kim, H.; Park, T.; et al. Cuvette-Type LSPR Sensor for Highly Sensitive Detection of Melamine in Infant Formulas. Sensors 2019, 19, 3839. [Google Scholar] [CrossRef] [Green Version]
- Ritota, M.; Manzi, P. Melamine Detection in Milk and Dairy Products: Traditional Analytical Methods and Recent Developments. Food Anal. Methods 2018, 11, 128–147. [Google Scholar] [CrossRef]
- Zeilinger, M.; Sussitz, H.; Cuypers, W.; Jungmann, C.; Lieberzeit, P. Mass-Sensitive Sensing of Melamine in Dairy Products with Molecularly Imprinted Polymers: Matrix Challenges. Sensors 2019, 19, 2366. [Google Scholar] [CrossRef] [Green Version]
- Hilding-Ohlsson, A.; Fauerbach, J.A.; Sacco, N.J.; Bonetto, M.C.; Cortón, E. Voltamperometric Discrimination of Urea and Melamine Adulterated Skimmed Milk Powder. Sensors 2012, 12, 12220–12234. [Google Scholar] [CrossRef] [Green Version]
- Yagai, S.; Higashi, M.; Karatsu, T.; Kitamura, A. Binary Supramolecular Gels Based on Bismelamine·Cyanurate/Barbiturate Noncovalent Polymers. Chem. Mater. 2004, 16, 3582–3585. [Google Scholar] [CrossRef]
- Yagai, S. Supramolecularly Engineered Functional π-Assemblies Based on Complementary Hydrogen-Bonding Interactions. Bull. Chem. Soc. Jpn. 2015, 88, 28–58. [Google Scholar] [CrossRef]
- Kong, X.; Du, X. In Situ IRRAS Studies of Molecular Recognition of Barbituric Acid Lipids to Melamine at the Air–Water Interface. J. Phys. Chem. B 2011, 115, 13191–13198. [Google Scholar] [CrossRef]
- Salimi Beni, A.; Zarandi, M.; Madram, A.R.; Bayat, Y.; Najafi Chermahini, A.; Ghahary, R. Synthesis and Characterization of Organic Dyes Bearing New Electron-Withdrawing Group for Dye-Sensitized Solar Cells. Electrochim. Acta 2015, 186, 504–511. [Google Scholar] [CrossRef]
- Zou, Q.; Tao, F.; Wu, H.; Yu, W.W.; Li, T.; Cui, Y. A New Carbazole-Based Colorimetric and Fluorescent Sensor with Aggregation Induced Emission for Detection of Cyanide Anion. Dyes. Pigment. 2019, 164, 165–173. [Google Scholar] [CrossRef]
- Yin, G.; Ma, Y.; Xiong, Y.; Cao, X.; Li, Y.; Chen, L. Enhanced AIE and Different Stimuli-Responses in Red Fluorescent (1,3-Dimethyl)Barbituric Acid-Functionalized Anthracenes. J. Mater. Chem. C 2016, 4, 751–757. [Google Scholar] [CrossRef]
- Kappi, F.A.; Tsogas, G.Z.; Giokas, D.L.; Christodouleas, D.C.; Vlessidis, A.G. Colorimetric and Visual Read-out Determination of Cyanuric Acid Exploiting the Interaction between Melamine and Silver Nanoparticles. Microchim. Acta 2014, 181, 623–629. [Google Scholar] [CrossRef]
- Wei, F.; Lam, R.; Cheng, S.; Lu, S.; Ho, D.; Li, N. Rapid Detection of Melamine in Whole Milk Mediated by Unmodified Gold Nanoparticles. Appl. Phys. Lett. 2010, 96, 133702. [Google Scholar] [CrossRef] [Green Version]
- Simanek, E.E.; Li, X.; Choi, I.S.; Whitesides, G.M. Cyanuric Acid and Melamine: A Platform for the Construction of Soluble Aggregates and Crystalline Materials. In Templating, Self-Assembly and Self-Organization; Sauvage, J.-P., Hosseini, M.W., Eds.; Elsevier Science: Oxford, UK, 1996; pp. 595–621. [Google Scholar]
- Sun, F.; Liu, L.; Kuang, H.; Xu, C. Development of ELISA for Melamine Detection in Milk Powder. Food Agric. Immunol. 2013, 24, 79–86. [Google Scholar] [CrossRef]
- Tsoi, T.-H.; Wong, W.-T. A Simple, Highly Sensitive, High Throughput and Organic Solvent-Free Screening Method for Melamine by Microsphere-Based Flow Cytometry Immunoassay. Anal. Methods 2015, 7, 5989–5995. [Google Scholar] [CrossRef]
- Wang, T.-T.; Xuan, R.-R.; Ma, J.-F.; Tan, Y.; Jin, Z.-F.; Chen, Y.-H.; Zhang, L.-H.; Zhang, Y.-K. Using Activated Attapulgite as Sorbent for Solid-Phase Extraction of Melamine in Milk Formula Samples. Anal. Bioanal. Chem. 2016, 408, 6671–6677. [Google Scholar] [CrossRef]
- Yun, W.; Li, H.; Chen, S.; Tu, D.; Xie, W.; Huang, Y. Aptamer-Based Rapid Visual Biosensing of Melamine in Whole Milk. Eur. Food Res. Technol. 2014, 238, 989–995. [Google Scholar] [CrossRef]
- Rajapandiyan, P.; Tang, W.-L.; Yang, J. Rapid Detection of Melamine in Milk Liquid and Powder by Surface-Enhanced Raman Scattering Substrate Array. Food Control 2015, 56, 155–160. [Google Scholar] [CrossRef]
- Miao, H.; Fan, S.; Wu, Y.-N.; Zhang, L.; Zhou, P.-P.; Chen, H.-J.; Zhao, Y.-F.; Li, J.-G. Simultaneous Determination of Melamine, Ammelide, Ammeline, and Cyanuric Acid in Milk and Milk Products by Gas Chromatography-Tandem Mass Spectrometry. Biomed. Environ. Sci. 2009, 22, 87–94. [Google Scholar] [CrossRef]
- Ma, P.; Liang, F.; Sun, Y.; Jin, Y.; Chen, Y.; Wang, X.; Zhang, H.; Gao, D.; Song, D. Rapid Determination of Melamine in Milk and Milk Powder by Surface-Enhanced Raman Spectroscopy and Using Cyclodextrin-Decorated Silver Nanoparticles. Microchim. Acta 2013, 180, 1173–1180. [Google Scholar] [CrossRef]
- Daizy, M.; Tarafder, C.; Al-Mamun, M.R.; Liu, X.; Aly Saad Aly, M.; Khan, M.Z.H. Electrochemical Detection of Melamine by Using Reduced Graphene Oxide–Copper Nanoflowers Modified Glassy Carbon Electrode. ACS Omega 2019, 4, 20324–20329. [Google Scholar] [CrossRef] [PubMed] [Green Version]
- Shrivastav, A.M.; Mishra, S.K.; Gupta, B.D. Fiber Optic SPR Sensor for the Detection of Melamine Using Molecular Imprinting. Sens. Actuators B Chem. 2015, 212, 404–410. [Google Scholar] [CrossRef]
- Yilmaz, Ü.T.; Yazar, Z. Determination of Melamine by Differential Pulse Polarography/Application to Milk and Milk Powder. Food Anal. Methods 2012, 5, 119–125. [Google Scholar] [CrossRef]
Scheme 1.
The binding process of melamine to the binding site of CB.

Scheme 2.
The synthetic scheme for the preparation of CB.

Figure 1.
Absorption and emission profiles of (1) (10 µM) and CB (10 µM) in DMSO (λex = 465 nm). The dotted lines correspond to the absorption and emission spectra of starting material (1) and the continuous lines correspond to that of CB. The absorption spectra showed a peak shift from 343 nm (starting material) to 450 nm (CB) while the emission λmax shifted from 499 nm for the starting material to 524 nm for CB.

Figure 2.
Titration of CB with melamine at varying w levels (A) fw 0%; (B) fw = 50% (C) fw 99%. (D) Plot showing the variation in relative emission of CB (f/f0) with respect to melamine concentration (0–1000 µM) for different fw (0, 50 and 100%) [f represents the total fluorescence emission of CB-aggregates at each melamine levels and f0 is the total emission at zero -melamine level].

Figure 3.
Absorbance and fluorescence properties of CB. (A) Plot showing the variation in relative fluorescence intensity (f/f0) with respect to water fraction, fw (vol %), for Figure 2B. f represents the total fluorescence calculated for each fw fraction and f0 is the value that of fw corresponds to 0%. (A) Photographs of CB (10 µM) in water–DMSO (left corner fw = 0% and right corner fw = 99%) visualized under UV irradiation. (B) UV–vis absorption spectra of CB (10 µM) for fw = 0, 50, and 99%.

Figure 4.
DLS measurements of (A) CB solution (10 μM) in the absence and presence of melamine (1000 µM); a shift of aggregate size distribution to smaller sizes was observed upon addition of melamine. (B) CB-CA solution in the absence and in the presence of melamine (100 ppm); a shift of aggregate size distribution to larger sizes was observed upon addition of melamine.

Figure 5.
Effect of melamine concentration in (A) distilled water and (B) milk aqueous system on the fluorescence intensity of CB-CA solution (λem = 520 nm, λex = 490 nm). For the microplate experiment, ‘I’ represents the emission intensity (au) obtained from well solutions having different melamine levels and I0 corresponds to the emission intensity of wells that are free of melamine. The error bars indicate the standard deviation values from triplicate readings for the three different sets of experiments.

Publisher’s Note: MDPI stays neutral with regard to jurisdictional claims in published maps and institutional affiliations. |
© 2021 by the authors. Licensee MDPI, Basel, Switzerland. This article is an open access article distributed under the terms and conditions of the Creative Commons Attribution (CC BY) license (https://creativecommons.org/licenses/by/4.0/).
Share and Cite
MDPI and ACS Style
Radha, R.; Vitor, R.F.; Al-Sayah, M.H. A Fluorescence-Based Chemical Sensor for Detection of Melamine in Aqueous Solutions. Chemosensors 2022, 10, 13. https://0-doi-org.brum.beds.ac.uk/10.3390/chemosensors10010013
AMA Style
Radha R, Vitor RF, Al-Sayah MH. A Fluorescence-Based Chemical Sensor for Detection of Melamine in Aqueous Solutions. Chemosensors. 2022; 10(1):13. https://0-doi-org.brum.beds.ac.uk/10.3390/chemosensors10010013
Chicago/Turabian StyleRadha, Remya, Rute F. Vitor, and Mohammad Hussein Al-Sayah. 2022. "A Fluorescence-Based Chemical Sensor for Detection of Melamine in Aqueous Solutions" Chemosensors 10, no. 1: 13. https://0-doi-org.brum.beds.ac.uk/10.3390/chemosensors10010013
Note that from the first issue of 2016, this journal uses article numbers instead of page numbers. See further details here.