Article

Impact of the Covering Vegetable Oil on the Sensory Profile of Canned Tuna of Katsuwonus pelamis Species and Tuna’s Taste Evaluation Using an Electronic Tongue

1
Centro de Investigação de Montanha (CIMO), Instituto Politécnico de Bragança, Campus Santa Apolónia, 5300-253 Bragança, Portugal
2
Instituto Politécnico de Coimbra, ISEC, DEQB, Rua Pedro Nunes, Quinta da Nora, 3030-199 Coimbra, Portugal
3
CEB—Centre of Biological Engineering, University of Minho, Campus de Gualtar, 4710-057 Braga, Portugal
4
Cofisa, S.A., Terrapleno do Porto de Pesca—Gala, 3090-735 Figueira da Foz, Portugal
*
Author to whom correspondence should be addressed.
Submission received: 24 November 2021 / Revised: 28 December 2021 / Accepted: 29 December 2021 / Published: 3 January 2022

Abstract

:
The impact of the covering vegetable oil (sunflower oil, refined olive oil and extra virgin olive oil, EVOO) on the physicochemical and sensory profiles of canned tuna (Katsuwonus pelamis species) was evaluated, using analytical techniques and a sensory panel. The results showed that canned tuna covered with EVOO possesses a higher content of total phenols and an enhanced antioxidant capacity. This covering medium also increased the appreciated redness-yellowness color of the canned tuna, which showed a higher chromatic and intense color. Olfactory and kinesthetic sensations were significantly dependent on the type of oil used as covering medium. Tuna succulence and adhesiveness were promoted by the use of EVOO, which also contributed to decreasing the tuna-related aroma sensations. The tuna sensory data could be successfully used to identify the type of vegetable oil used. Moreover, a potentiometric electronic tongue allowed discriminating between the canned tuna samples according to the vegetable oil used (mean sensitivity of 96 ± 8%; repeated K-fold cross-validation) and the fruity intensity of the EVOO (mean sensitivity of 100%; repeated K-fold cross-validation). Thus, the taste sensor device could be a practical tool to verify the authenticity of the declared covering medium in canned tuna and to perceive the differences in consumers’ taste.

1. Introduction

Fish has a high nutritional value, and so it is essential in the human diet. However, it is also highly perishable, and its quality can drop very quickly soon after its capture, leading to undesirable odors and flavors resulting from enzymatic and bacterial reactions [1]. Thus, canning can be a strategy to overcome this problem, being considered one of the most important fish preservation techniques, allowing increased access to fish without the need for cold chains during storage [2]. This type of food also meets the consumer demand for ready-to-eat food at a low cost, so the consumption of canned fish (e.g., canned tuna) has increased over recent decades [2]. Among the different types of canned fish that can be found in the markets, canned tuna is one of the most popular and with a high commercial value. Tuna is rich in protein, fat, micronutrients, and fat-soluble vitamins, being an exceptional source of essential omega-3 fatty acids [3]. In recent years, the main concern of producers, consumers, and regulators has been related to the authenticity, traceability, and safety of canned tuna, aiming to reduce fraud [3]. Overall, mislabeling is still an important problem, partially due to the “tuna” umbrella term, which is very popular among consumers and is quite prone to ambiguity [4]. Several simple, fast, accurate, and cost-effective techniques, which may be implemented in situ, at the industrial facilities, have been developed to identify tuna species. Among them, spectroscopy techniques have played a key role in the accomplishment of this objective. Mid-infrared spectroscopy and front-face fluorescence spectroscopy have been applied as authentication tools, based on the analysis of the composition of the vegetable oil used as tuna’s covering medium [5] or the analysis of the tuna itself [3,6,7]. Other techniques have also been developed for this same aim, including polymerase chain reaction [8,9,10,11] and loop-mediated isothermal amplification [12] assays.
On the other hand, less attention has been devoted to the possible impact of the covering liquid medium on the taste and quality of the canned tuna when consumed. In fact, to the authors’ best knowledge, no study has been performed with that aim, although nowadays several vegetable oils are being used as covering medium of canned tuna, the most common ones being sunflower oil and olive oil. Use of different olive oils, such as extra virgin olive oil (EVOO) with different flavors and intensities, can be part of a commercial strategy of adding value to canned tuna, increasing the retail price. In fact, canned tuna is usually sold at different prices depending on the oil used, with higher prices being associated with samples conserved in EVOO, which can be related to consumer awareness regarding the health benefits of olive oil as well as to its unique flavor, which is appreciated worldwide. By using different EVOOs as the covering medium, differentiated canned tuna products could be obtained. A trend observed worldwide is that canned tuna consumers, commonly seen as low-income consumers, now include brand-conscious consumers who are willing to pay a higher price for quality, showing a brand attitude-quality-value concern [13]. Hence, this study aims to evaluate the expected relationship between the type of oil used as covering medium and the taste perception of consumers when the canned tuna is consumed, as a possible way of evaluating the awareness of consumers regarding the related taste differences due to the vegetable oil used in canning. The assessment of the taste sensations may be performed by sensory panels or using artificial taste sensor devices. However, for qualitative and quantitative evaluations, the former present known drawbacks, including the intrinsic subjectivity of human assessment, problems of human fatigue, and the limited daily number of samples that can be assessed [14,15]. Regarding the sensor-based approach, it is known that, for example, potentiometric electronic tongues (E-tongue) with lipid membranes can interact with polar compounds present in the food matrices, through electrostatic/hydrophobic interactions, which are responsible for different sensory attributes, including the basic tastes [16,17,18,19,20,21,22,23,24]. The lipid membrane sensor’s sensitivity depends on the concentration of the charged lipids inside the membrane, its selectivity being dependent on the surface hydrophobicity, which in turn depends on the relative composition and type of lipids and plasticizers used [25]. Electronic tongues have been successfully applied to establish flavor fingerprints of different fishes (e.g., black carp, salmon, fugu bimaculatus, rainbow trout), which in turn were used to assess changes in taste-freshness during storage [26], fish geographical origin [27], changes in flavor substances during fish degradation [28], or flavor differences according to the fish size [29]. Regarding tuna, only one study reported the use of a commercial E-tongue (ASTREE, from Alpha M.O.S, France) to assess the freshness of samples, being able to discriminate between tuna steaks stored during different time-periods (between 0 and 8 days), at 4 °C [30].
In this study, tuna cans, from the same tuna species (Katsuwonus pelamis), were obtained from a Portuguese cannery factory, which produces canned tuna with different covering vegetable oils, including sunflower oil, refined olive oil and, for premium cans, EVOOs with different flavor intensities. Samples were analyzed by a sensory panel aiming to assess the impact of the covering medium on the taste of the canned tuna. Furthermore, an electronic tongue was used as a taste sensor device to evaluate the feasibility of discriminating between the canned tuna samples according to the type of vegetable oil used, which could be further used as an authenticity tool to detect possible fraud regarding the type of covering medium as well as a complementary sensory tool to evaluate the expected taste differences of the canned tuna.

2. Materials and Methods

2.1. Covering Vegetable Oil Samples and Analysis

2.1.1. Oil Samples

The EVOOs were obtained from a local producer in the region of Mirandela (Northeast Portugal), with different intensities of fruitiness, namely ripe fruity, greenly light fruity, and greenly intense fruity sensations, which were evaluated by a sensory panel for confirming the label information. The selection of the EVOO was based on the information provided by the producer regarding the fruitiness intensity, which was then confirmed by the evaluation of the sensory panel. According to the producer, all EVOO were blended olive oils extracted in a two-phase extraction system, from olives belonging mainly to the olive varieties of Cobrançosa, Madural and Verdeal Transmontana. The sunflower oil and refined oil were those usually used by the cannery industry (COFISA Conservas de Peixe, S.A., Figueira da Foz, Portugal) as the conventional covering oils.

2.1.2. Physicochemical and Sensory Evaluation of the Vegetable Oils

Free acidity (FA, in % oleic acid), peroxide value (PV, in mEq O2/kg), and the specific coefficients of extinction at 232 nm and 268 nm (K232, and K268) were determined following the relevant European Union Regulation [31]. Total phenolic contents (TPC) and the radical scavenging activity(2,2-diphenyl-1-picrylhydrazyl) (DPPH) were determined as described by Cherif et al. [32]. Quantification (in mg of Gallic acid equivalents (GAE) per kg of oil) was carried out using external standard calibration in methanolic solution 80% (R2 ≥ 0.9999). The DPPH radical scavenging was expressed as the percentage of reduction of DPPH activity.
The gustatory basic taste sensations of the vegetable oils used as well as the gustatory fruity intensity perception were evaluated by the trained sensory panel of the School of Agriculture of the Polytechnic Institute of Bragança (Portugal), according to the European Union standard methods [31]. The intensity of the perceived sensations was scored according to an unstructured continuous intensity scale ranging from 0 (no sensory sensation perceived) to 10 (maximum intensity of the sensory sensation perceived) [33].

2.2. Canned Tuna and Analysis

2.2.1. Tuna Samples

The tuna used in this study was provided by the cannery industry (COFISA Conservas de Peixe, S.A., Figueira da Foz, Portugal). It belonged to the K. pelamis species and originated from the Republic of Equator. The tuna cans were produced following the standards procedures of COFISA company (Figueira da Foz, Portugal). In total, 120 aluminum varnished cans with easy opening were produced (24 for each of the five covering vegetable oils). The filled cans (tuna plus covering medium) were sealed and sterilized for 45 min to ensure the usual commercial sterility of the product, required for storage during long time periods at room temperature. The cans were stored at room temperature (20–25 °C) and analyzed 30 days after filling.

2.2.2. Physicochemical Analysis of Canned Tuna Samples

The physicochemical assays were performed a month after production. Before analysis, all cans were opened, and the covering medium was drained for 2 min. Each assay was made in triplicate for each sample under study.
The pH determination followed the methodology described by Atitallah et al. [34]. Thus, 10 g of each canned drained tuna was mixed with 90 mL of distilled water and homogenized, using a magnetic stirrer (Velp Cientific Arex Digital, Usmate, Italy), for 5 min at 500 rpm. The pH of the homogenized mixture was measured using a pH meter (model HI 99163, from Hanna Instruments, Póvoa de Varzim, Portugal), previously adjusted, at room temperature, using commercial buffer (pH = 7.01 and pH = 4.01).
The moisture content was determined following the AOAC method [35]. The weight loss, during drying, of approximately 5 g of the drained canned tuna was assessed, the assays being carried out using an oven (Memmert UNB 100–500, Schwabach, Germany), at 100 ± 2 °C, until a constant weight was achieved.
The ash content was obtained from the weight of the inorganic residue that remains after incineration. According to the AOAC method [36], 5 g of drained canned tuna were placed in a muffle (Lenton Thermal designs 3552, Hope, UK), at 550 ± 15 °C, until a constant weight was obtained. The ash content was then calculated as the mass percentage regarding the initial tuna mass used.
The total phenols content (TPC) determination required a preliminary extraction step, which followed the methodology described by Bersuder et al. [37], with some modifications. Briefly, 0.5 g of drained tuna was mixed with 5 mL of an aqueous methanolic solution (MeOH:H2O, 80:20 v/v), homogenized for 2 min in a vortex (VWR International) and centrifuged (Centurion Scientific K240R, Fenton, USA) for 5 min at 6000 rpm, the supernatant then being removed. Subsequently, a solution was prepared with 1.5 mL of distilled water, 0.1 mL of the extract and 0.1 mL of reagent Folin-Ciocalteu (PanReac AppliChem, Castellar del Vallès, Spain). The solution was vortexed for 3 secs and allowed to react for 3 min, in the dark. Then, 0.3 mL of a sodium carbonate solution (20%, w/v) was added, vortexed for 3 s, and allowed to react for 60 min in the dark and at room temperature (20–22 °C). This final solution was analyzed on a spectrophotometer (UV-VIS/UV-1280 from Shimadzu, Kyoto, Japan) at 765 nm. The TPC were expressed in gallic acid equivalents (mg GAE kg−1).

2.2.3. Color Assessment

To determine the color, a CR-400 Chroma Meter (Konica Minolta, Osaka, Japan) was used. The results were expressed using the CIELAB color scale, according to the coordinates L*, a*, b*, C* and h. L* corresponds to brightness, a* to the red-green axis, b* to yellow-blue axis, C* to the color intensity (chroma axis), and h to the hue angle. To determine the color of the drained tuna, which was canned with different covering vegetable oils, the specific accessory for solid samples was used. The device was previously adjusted using a white reference standard (Calibrate plate No. 18033029, Konica Minolta, Osaka, Japan).

2.2.4. Sensory Analysis

The sensory panel that performed the sensory evaluation of both tuna and vegetable oils was not certified but included panelists trained for olive oil analysis. They were trained according to the methods described in the European regulation [31] and by the International Olive Oil Council guidelines [33]. All panelists possessed knowledge of sensory analysis according to the ISO 4121:2003 [38], ISO 13299: 2016 [39], and ISO 11036:2020 [40]. The sensory analysis of the drained tuna samples was performed by five trained tasters plus the leader of the panel. Each taster was served with approximately 20 g of each tuna sample in a coded dish. The attributes evaluated by the panelists followed the guidelines of the International Organization for Standardization (ISO) [38,39,40], with some adaptations. The different attributes were scored according to a continuous unstructured scale, ranging from 0 (attribute not perceived) to 10 (maximum perceived intensity). Visual parameters were evaluated, namely the consistency of the tuna slices, appearance, color, brightness, and the intensity of strange spots. Olfactory parameters were also evaluated, including tuna aroma, rancidity, intensity and pleasantness of aroma, complexity, persistence as well as the presence of other aromas. In the kinesthetic sensations, succulence, chewiness, hardness, and adhesiveness were evaluated. Finally, gustatory parameters such as tuna taste, fat sensation, taste intensity and pleasantness, salty, bitter, sweet and pungent basic tastes, complexity, flavor persistence, and others tastes, were also evaluated. Anchors were used as standards for certain parameters, namely: succulence (0—dry biscuit; 5—cucumber; 10—orange), chewiness (0—cream cheese; 5—gum; 10—pork rind), hardness (0—cheese cream; 5—sausage cocktail; 10—caramel), adhesiveness (0—marshmallow; 5—overcooked rice; 10—caramel) and persistence (0—less than 3 s; 5—between 10 to 15 s; 10—more than 30 s).

2.2.5. Electronic Tongue Apparatus and Tuna Samples Analysis

The E-tongue used in this study was built by the research team and previously described in [41]. Briefly, the device had two cylindrical arrays (diameter of 1.5 cm and height of 6.5 cm), each with 20 lipid sensor membranes (composition is listed in Table 1) plus an Ag/AgCl reference electrode (Crison, model 5241, Barcelona, Spain). The potentiometric signals gathered by the E-tongue sensors were recorded using an Agilent Data Acquisition unit (model 34970A, Keysight Technologies, Santa Rosa, CA, USA) controlled by an Agilent BenchLink Data Logger software. The type of lipid membranes used and the compositions were set based on previous studies by the research team [42]. The potentiometric analysis of the canned tuna required a previous aqueous methanolic extraction, and so the extract previously obtained for the TPC was also used for the E-tongue assays. Then, 20 mL of the referred polar extract were diluted with 80 mL of deionized water, before the potentiometric analysis. The signals were recorded during 5 min; they resulted from the electrostatic and/or hydrophobic interactions established between the lipid sensor membranes and the polar compounds [16] extracted from the drained canned tuna samples. The potential difference was measured against an Ag/AgCl double-junction glass electrode (Crison, 5241), used as the reference electrode. To preserve the integrity of the E-tongue sensors, the device was stored using an HCl cleaning solution (0.01 mol/L) at room temperature.

2.3. Statistical Analysis

The one-way ANOVA followed by the Tukey’s post-hoc multi-comparison test was used to evaluate the existence of statistically significant differences among the physicochemical and sensory characteristics among the different vegetable oils used as covering media or of the canned tuna according to the covering medium used (sunflower oil, refined olive oil, and EVOO with different fruity sensations (i.e., ripely fruity, greenly light fruity and greenly intense fruity)). When only two groups were compared, the t-Student test was applied. Principal component analysis (PCA) and linear discriminant analysis (LDA) coupled with the meta-heuristic simulated annealing (SA) variable selection algorithm [43,44,45] were used to evaluate the unsupervised and supervised classification performances based on the sensory or the E-tongue profiles, respectively. PCA allows reducing the number of independent variables under study to a small number of principal components (PCs), enabling extraction of specific patterns from the dataset, which are easily identified from multidimensional plots. LDA establishes linear models, based on the classification scores, by maximizing the ratio of the between-class variance to the pooled within-class variance, which in turns allows discriminating between pre-defined groups. The best sub-sets of independent non-redundant variables were identified by the SA selection algorithm [23]. The algorithm implements an interactive search to find a global minimum for a subset of k variables (k ⊆ K, i.e., the total number of variables in this study were the 40 sensors). The results of the current and the new subsets of k variables were compared, using the ccr12 quality criterion as a measure of the goodness of fit. This criterion computes the first squared canonical correlation for a multivariate linear hypothesis (i.e., maximizing this criterion is similar to maximizing the Roy first root). The possible new solution is randomly chosen in the neighborhood of the current solution, being selected if a better result is achieved. The number of attempts was fixed at 10,000, which usually ensures the selection of the best subset of variables (best model), starting the process of selecting the best subsets of variables on each trial, thus guaranteeing a greater confidence in finding a true optimal solution [43]. The leave-one-out CV (LOO-CV) and the repeated K-fold-CV (4 folds and 10 repeats) were used to evaluate the LDA predictive capability, by means of the sensitivity values (i.e., the percentage of samples correctly classified according to the pre-defined groups) and specificity values (i.e., the capability of the model to predict true negatives for each category/group under study). To further evaluate the significance of the variables selected by the SA algorithm, the subsets of independent variables were further subjected to a multivariate analysis of variance (MANOVA) using general linear model procedures with one fixed factor (type of vegetable oil used as covering medium or type of EVOO used as covering medium). Four tests were used for evaluating the significance of the effect under study, namely the Wilks’ Lambda test, the Lawley–Hotelling trace test, the Roy’s largest root test and the Pillai trace test. The three first tests are usually more powerful than Pillai’s trace test when the degrees of freedom are greater than one (which is the case of the present study) and if one dimension accounts for most of the separation among groups. On the other hand, Pillai’s trace test is more robust to violations of the MANOVA’s assumptions. The PCA and LDA results were presented in the form of 2D and/or 3D plots. For PCA, the 2D or 3D plots, based on the first two or three principal components (PCs) were used to visualize the differentiation patterns. The confidence ellipses around the individuals of each category were computed and plotted assuming a normal probability distribution (with a confidence interval level set at 0.95). For the LDA, the class membership ellipses were established using the posterior probabilities, computed using the Bayes’ theorem [46]. Variable scaling and centering procedures were implemented as data pre-processing procedures. All statistical analyzes were performed using the open-source statistical program R (version 3.6.2. The following R libraries were used: reshape2, agricolae, ggplot2, devtools, FactoMineR, factoextra, MASS, Caret and Subselect.

3. Results and Discussion

3.1. Physicochemical and Sensory Analysis of the Different Vegetable Oils Used as Covering Media

The five vegetable oils used as covering media (i.e., sunflower oils, refined olive oil, and the three types of EVOO) were evaluated aiming to assess their physicochemical quality, the antioxidant capacity as well as the TPC. Moreover, the oils were evaluated from a sensory point of view. The results are shown in Table 2.
As can be seen (Table 2) the physicochemical quality parameters differ significantly according to the type of vegetable oil studied, although all EVOO fulfilled the legal thresholds for being classified as EVOO (FA < 0.8%, PV < 20 mEq O2/kg; K232 < 2.50 and K268 < 0.22) [31]. It was found that all EVOO had a significantly greater TPC compared to sunflower or refined olive oil, showing also an increasing radical scavenging activity (higher DPPH percentages). Moreover, among the three EVOOs, there was a significant decreasing trend of the TPC and DPPH in the following order: greenly intense fruity olive oils > greenly light fruity olive oils > ripely fruity olive oils. Thus, it would be expected that the use of differentiated EVOOs could influence the canned tuna richness in total phenols as well as the antioxidant capacity. Furthermore, from a sensory point of view, the data allowed confirmation of the label information regarding the EVOO classification as ripely or greenly light/intense fruity. The existence of significant differences at the basic tastes level was also observed. Indeed, ripely fruity EVOOs were significantly more sweet and less pungent compared to the greenly fruity EVOOs used. For these latter olive oils, the rise of the greenly intensity could be related with a decrease of the sweetness and an increase of the pungency of the oils. Thus, the use of the different covering oils could affect the taste perception of the canned tuna, namely when using tuna from the same species.

3.2. Physicochemical and Sensory Analysis of Canned Tuna in Different Vegetable Oils

The impact of the different covering vegetable oils on the physicochemical characteristics and sensory profiles of canned tuna (K. pelamis) was evaluated. As previously described, five different oils were used, the usual sunflower and refined oils, as well as three EVOOs with different fruity intensities, namely ripely fruity, greenly light fruity, and greenly intense fruity sensations. The results are shown in Table 3 and Table 4 for the physicochemical and sensory data, respectively.
Among the evaluated physicochemical parameters, the antioxidant capacity (assessed based on the DPPH assay) and the TPC of the drained canned tuna samples were significantly affected by the type of vegetable oils used. Indeed, the differences observed can be attributed to the covering medium since, in all cans, the tuna used was from the same species (K. pelamis). The DPPH was clearly increased when sunflower oil was changed to any type of olive oil, the rise being more evident when EVOO was used as the covering medium, which could be due to the highest DPPH values in the EVOOs used (as shown in Table 2). Thus, the use of EVOO seemed to enhance the antioxidant properties of canned tuna, which is of major relevance for the consumer interested in canned tuna’s nutritional value. A similar trend was also observed regarding the TPC, the higher amounts being found in canned tuna with EVOO. Once again, this finding is in line with the greater richness in TPC of the EVOOs compared to the other two vegetable oils used as covering media (Table 2). Indeed, since no phenols were detected in the sunflower oil or in the refined oil (Table 2), it can be assumed that the amounts found on the drained canned tuna with those two oils were derived from the tuna itself (~274 mg GAE/kg). Thus, the addition of EVOO promoted the migration of phenols from the olive oil towards the tuna (an increase of 6% and 24%). This is also of great importance since foods rich in phenolics have been related to several health benefits. Regarding the color assessment, the data also showed that, in general, the use of EVOO, notably the greenly light or intense fruity oils, increased the a*, b*, C* and h* values, and so enhanced the appreciated redness-yellowness color of the tuna. The use of EVOO results in a more chromatic and saturated/intense color.
Once again, the differences observed in some sensory sensations (Table 4), depending on the type of vegetable oil, could be attributed to the impact of the covering medium since the tuna used in all assays was, as previously described, from the same species, namely K. pelamis. The sensory analysis showed that, with few exceptions (e.g., tuna aroma related sensations), the sensory attributes evaluated were perceived at low intensities (in general, intensities lower than 4–5 in a 0–10 continuous scale). Furthermore, only the olfactory and kinesthetic sensations were significantly influenced by the type of covering medium used among the four types of sensations assessed. Overall, the use of greenly light or intense fruity EVOOs promoted a decrease of the aroma-related intensities, compared to the other vegetable oils used as covering media, which could be tentatively attributed to the higher pungency of the EVOOs used that could have contributed to masking the tuna aroma. These results are in line with the findings reported for tuna canned with EVOO, olive oil or refined seed oil [47]. As regards the kinesthetic sensations, the hardness was not significantly affected by the type of vegetable oil used, which was expected since this descriptor is mainly correlated to the quality of the raw material used in the manufacturing of canned tuna [47], that was from the same species in this study. On the other hand, the use of EVOO as cover medium seemed to enhance the canned tuna’s succulence and its adhesiveness. Concerning the gustatory sensations, no significant differences were detected by the tasters, with the exception of pungency and tuna taste intensity. The former gustatory sensation was only detected in drained tuna samples covered with greenly intense fruity EVOOs. The latter gustatory attribute seemed to be masked (less intense) when refined olive oil or greenly light/intense fruity EVOOs were used as the covering medium. The results are in agreement with those reported by Caponio et al. [47], which, for example, did not detect significant differences in the basic tastes (salty, sweet, and bitter) of canned tuna, with different types of oils (EVOO, olive oil and refined seed oil) used as liquid medium. Moreover, the range of the perceived intensities was also similar in both studies. Regarding the visual evaluation of the canned tuna samples, it could be inferred that the covering medium only influenced the perception of the brightness and consistency, although it was not possible to establish a relationship between the use or not of EVOOs as the covering medium.
Nevertheless, the sensory data were further used to verify if the drained canned tuna samples could be naturally distinguished according to the type of vegetable oils used as the covering medium. As can be seen from Figure 1 and Figure 2, the sensory analysis of the drained tuna (K. pelamis) samples could be used as a reliable tool to recognize the type of vegetable oil used as the covering medium. This fact strengthens the impact of the oil used on the sensory attributes of the canned tuna after being stored for at least one month. Indeed, it was possible to differentiate the drained tuna depending on whether sunflower oil, refined olive oil, or EVOOs were used (Figure 1). Moreover, among the three studied EVOOs, the sensory profiles established by the panelists allowed a full differentiation of the canned tuna according to the EVOO used, namely between oils classified as greenly intense fruity, greenly light fruity, or ripely fruity (Figure 2). However, it should be emphasized that sensory analysis presents several recognized limitations, including high cost (taking into account the training process of the panelists), scarcity of trained panels, limited number of samples that can be evaluated in a daily basis, as well as human fatigue and subjectivity [14,15,48]. Therefore, other cost-effective and fast techniques are envisaged as routine analytical tools, such as emerging sensor-based techniques (e.g., E-tongues).

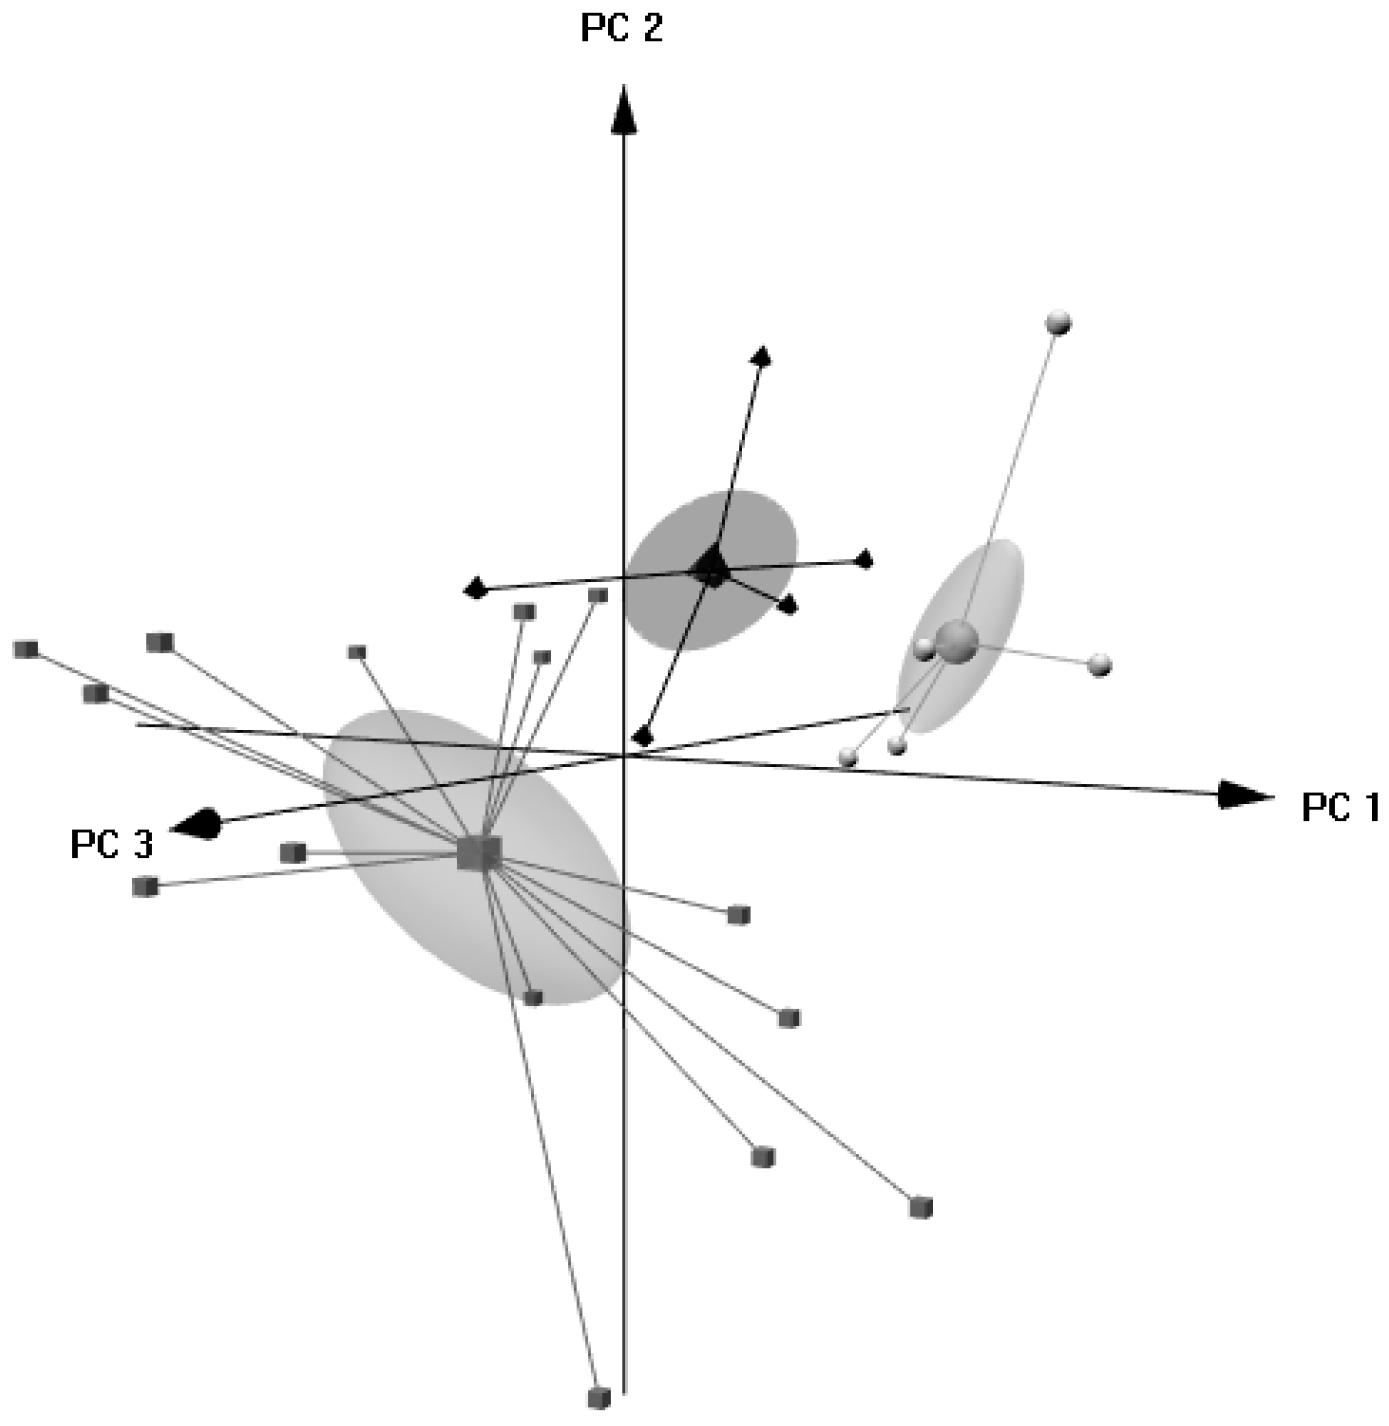
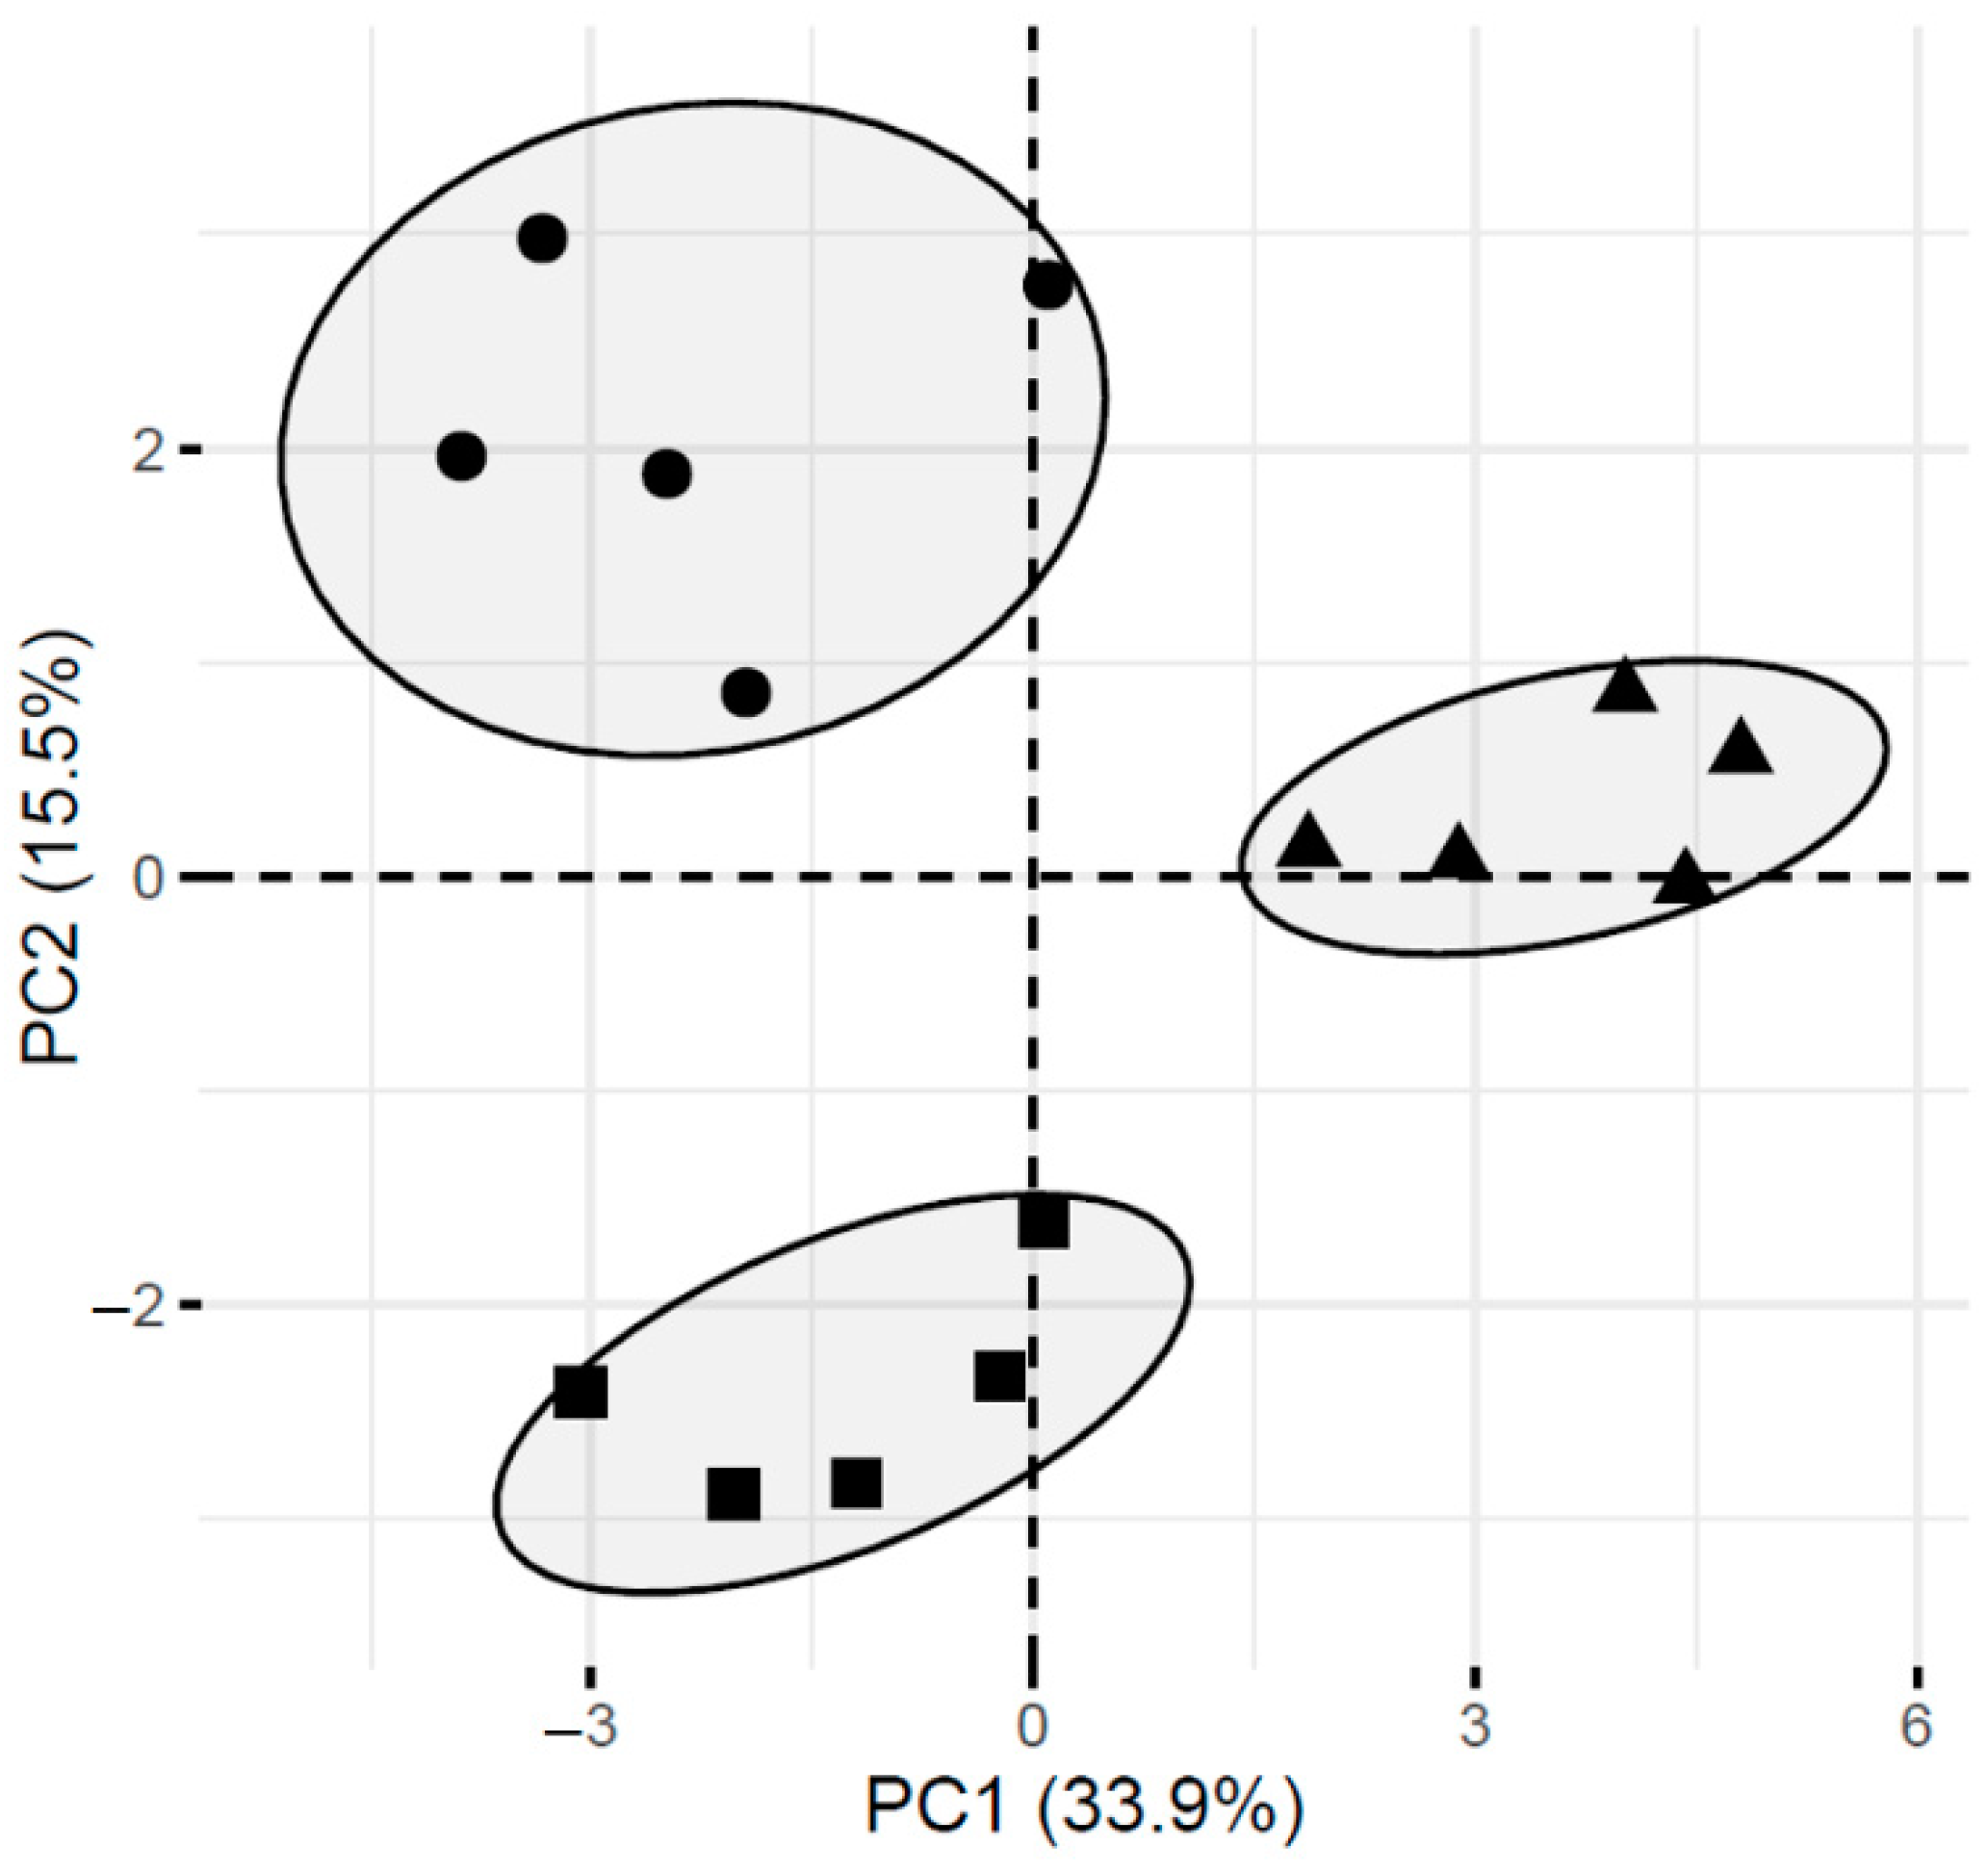
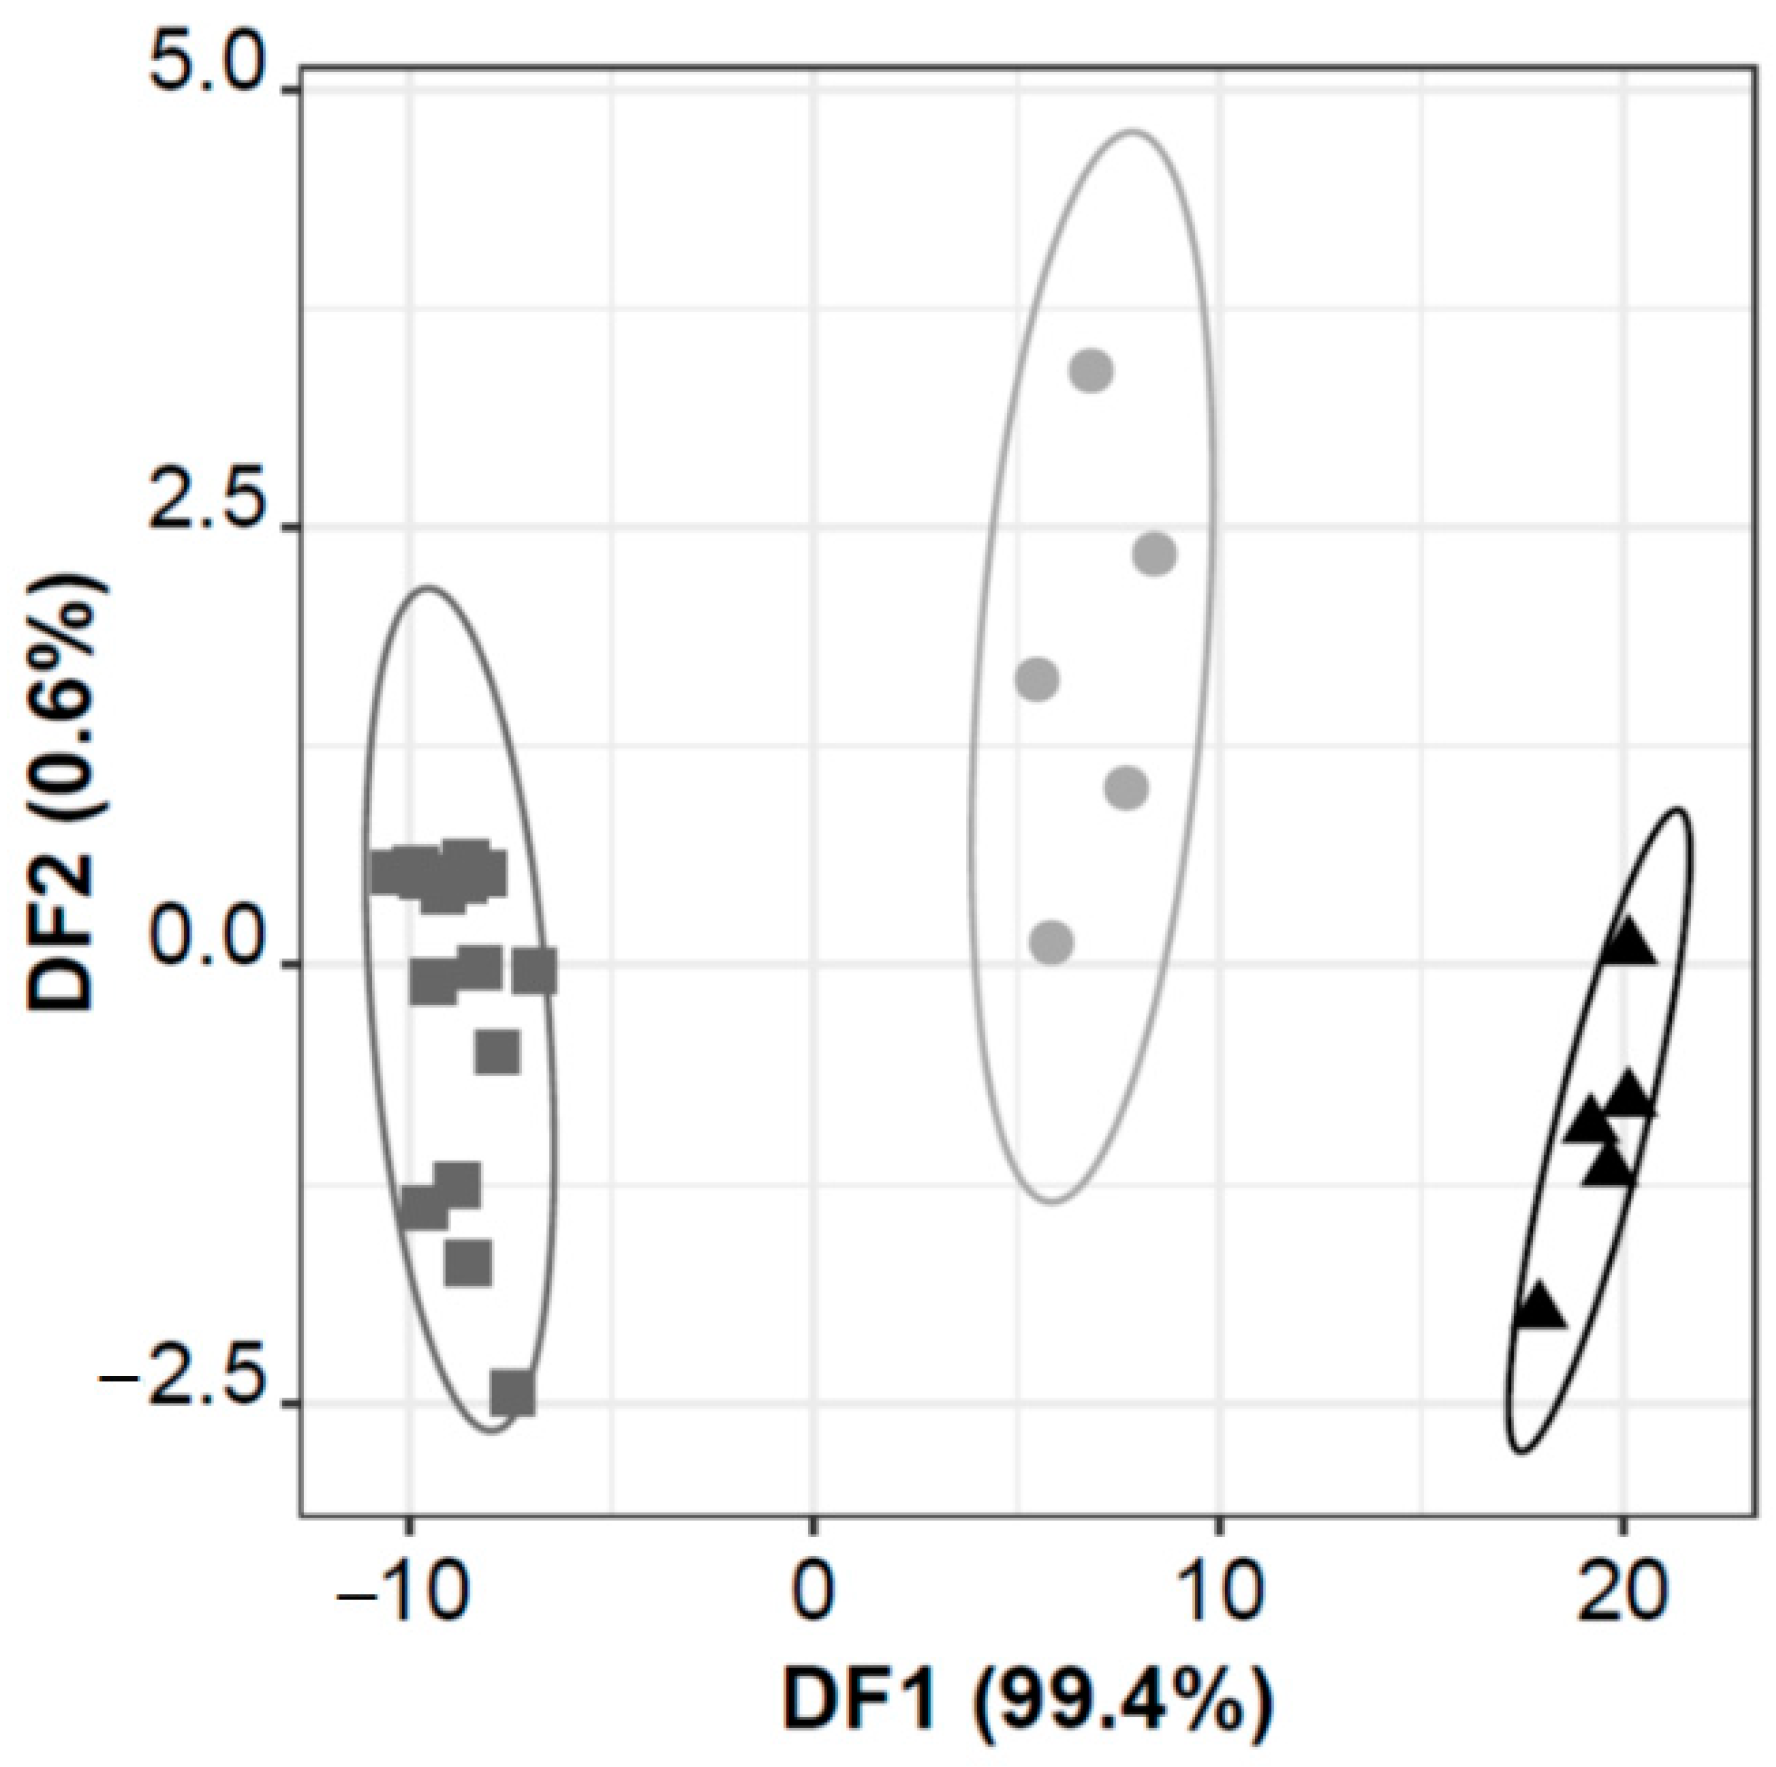
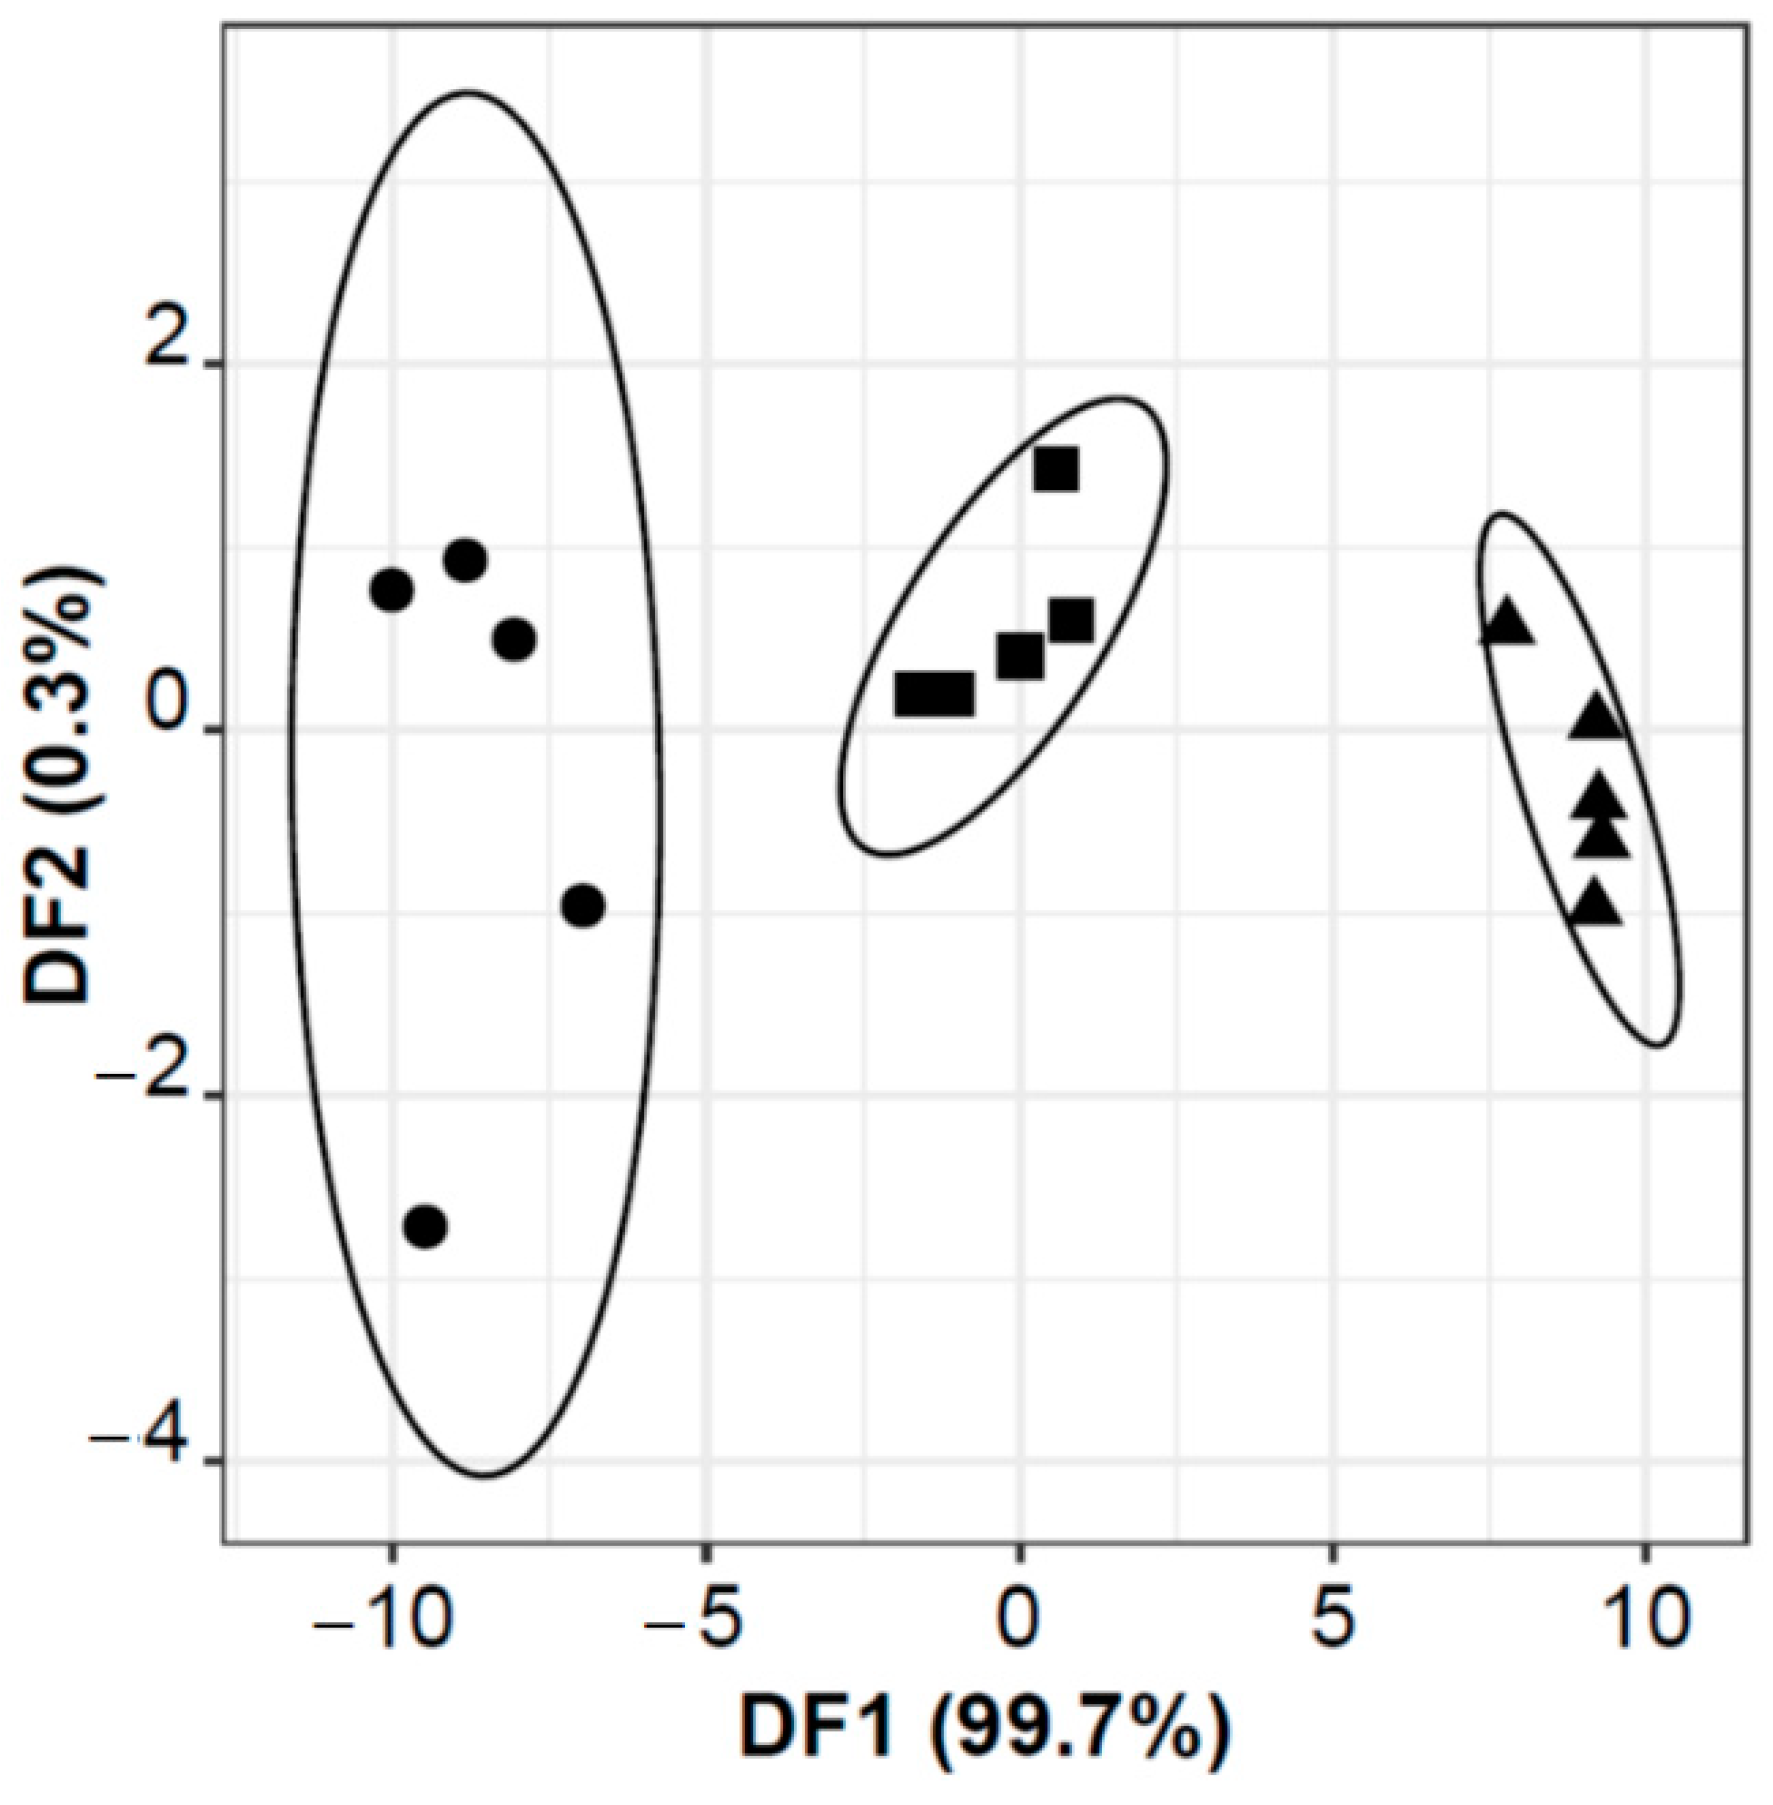
3.3. Electronic Tongue

As previously discussed, the covering medium significantly influenced the sensory attributes of the canned tuna (Table 4). Thus, a lab-made electronic tongue, with the 40 lipid sensor membranes, was applied to evaluate its potential use as a tool to differentiate the sensory profile, namely the taste sensations, of tuna canned with different vegetable oils, used as covering media. The signals recorded by the E-tongue sensors ranged, globally, from 50 to 350 mV, for all the studied drained tuna samples, with similar potentiometric profiles, some slight differences being observed, depending on the covering medium and the type of lipid sensor membrane.
The results showed that the taste sensor device coupled with LDA-SA technique allowed discriminating between tuna canned with sunflower oil, refined olive oil or EVOO with different green-fruity sensations/intensities. An E-tongue-LDA-SA model with two DFs (which explained 97.4 and 0.6% of the data variability), based on the potentiometric signals recorded by 13 lipid sensor membranes, correctly classified 100% of the original grouped data (Figure 3), showing 100% of sensitivity and specificity for LOO-CV internal validation variant. Moreover, the model showed a global mean sensitivity of 97 ± 7% and an overall mean specificity of 96 ± 8% for the repeated K-fold-CV procedure. Each internal validation run, of a total of 40, comprised at least five samples randomly selected for validation purposes, 100% of them being correctly classified for 33 repeated sampling subsets and between 80 and 86% for the other seven subsets (misclassifications observed between EVOO and sunflower oil or between sunflower oil and refined oil). Indeed, the mean sensitivities per group were 93 ± 10%, 98 ± 7%, and 99 ± 3% for canned tuna with sunflower oil, refined oil or EVOO, respectively; corresponding to mean specificities of 95 ± 10%, 94 ± 8% and 100%. These results clearly show that canned tuna samples with EVOO are more correctly identified by the electronic device, while no canned tuna with sunflower or refined oil was misclassified as canned tuna with EVOO.
To evaluate if the potentiometric signal profiles of the selected 13 E-tongue lipid sensor membranes were all influenced by the canned tuna covered with sunflower oil, refined olive oil or EVOO, a MANOVA was further applied. The multivariate test was significant (p-value = 0.0234 for the Pillai’s trace test and p-value < 0.0001 for the other three tests), allowing inference that the effect under study (covering medium) was significant and, thus, confirming the output of the LDA (Figure 3).
Furthermore, the taste sensor device was further applied to evaluate its performance to discriminate between the taste sensations of the canned tuna using EVOO with different green-fruity intensities. Again, an E-tongue-LDA-SA model, based on only six lipid sensor membranes (S1:1; S1:7; S2:1; S2:4; S2:12; and S2:19), allowed the correct classification of 100% of the samples for the original grouped data (Figure 4), LOO-CV and repeated K-fold-CV procedures. Thus, the taste sensor showed sensitivities and specificities of 100% for the training and the two internal validation variants, which clearly pointed out the capacity of the device to recognize and discriminate canned tuna covered with EVOO with different sensory intensities. It should be noticed that the majority of the lipid sensor membranes selected contained the plasticizer bis(1-butylpentyl) adipate, and equally three additives, namely octadecylamine, methyltrioctylammonium chloride and oleic acid, probably due to their higher sensibility towards the type and composition of polar compounds extracted from the drained canned tuna samples. The abovementioned satisfactory classification performance could be tentatively related to the different taste perceptions of the drained canned tuna (Table 4), of the K. pelamis species, due to the different EVOOs used as covering medium, namely the higher perception of saltiness, pungency, and sweetness of canned tuna with intense EVOO as well as the higher bitterness and tuna taste intensity of the samples stored in ripe EVOO. In fact, in the 2D dimensional space (Figure 4), the three groups (and the respective centroids of the DF1) are located in a specific order (EVOO greenly light fruity > EVOO greenly intense fruity > EVOO ripely fruity), which can be correlated with gustatory sensations (Table 4), namely with: (i) the increase of the tuna taste (R-Pearson = +0.9890); (ii) the increases of the fat taste (R-Pearson = +0.9485); (iii) the slight increase of the bitter sensation (R-Pearson = +0.9221); and (iv), the slight decrease of the sweet sensation (R-Pearson = −0.9239).
Similarly, the potentiometric signal profiles of the 6 E-tongue lipid sensor membranes selected by the SA algorithm were further subjected to a MANOVA aiming to infer if all of them were simultaneously influenced by the differences of the canned tuna covered with EVOO with three different fruity sensations (greenly light fruity sensation, greenly intense fruity sensation, and ripely fruity sensation). The multivariate test was significant (p-value ≤ 0.0001 for the Wilks’ Lambda test, the Lawley–Hotelling trace test, and the Roy’s largest root test; but p-value = 0.1327 for the Pillai’s trace test), allowing the inference that the effect under study (fruity intensity of the EVOO covering medium) was significant, thereby confirming the output of the LDA (Figure 4).
Thus, globally, the E-tongue data showed that the taste perception of the canned tuna of the K. pelamis species was affected by the covering media. The use of EVOOs with different fruity intensities, as well as by the common covering media, i.e., sunflower oil or refined olive oil, allows the development of differentiated products at the sensory level, which could meet the expectations of differentiated target consumers.

4. Conclusions

The study indicates that the use of different vegetable oils, notably extra virgin olive oils possessing different fruity intensities, has led to the production of differentiated canned tunas, with different physicochemical and sensory characteristics. Overall, it was shown that the use of extra virgin olive oils, especially those with a greenly intense fruity sensation, as the covering medium, increased the canned tuna richness in total phenols as well as the antioxidant capacity. This fact could be seen as a possible marketing advantage, in line with the expectations of the emerging brand-conscious consumers who are willing to pay a higher price for higher quality and healthy products. Moreover, the use of extra virgin olive oil although causing a decrease in the intensity of the tuna aroma-related sensations clearly enhances the product succulence and its adhesiveness. Finally, it was also demonstrated the feasibility of applying a potentiometric electronic tongue as a taste sensor device, which allowed the recognition and discrimination between the drained tuna samples according to the covering vegetable oil, in line with the canned tuna’s taste differences perceived by the trained panelists. This capability allowed anticipation of the possible use of this sensor device as an authentication tool regarding the type of vegetable oil used by the cannery industries. Sensory differences of the canned tuna could be assessed, helping in the production of canned tuna with differentiated tastes, fulfilling the increasing demands, at sensory level, of the consumers.

Author Contributions

Conceptualization, N.R., A.C.A.V., J.A.P. and A.M.P.; methodology, N.F., N.R., C.F. and H.P.; formal analysis, N.R., A.C.A.V., J.AP. and A.M.P.; resources, N.R., C.F., H.P. and J.A.P.; data curation, N.F., N.R., A.C.A.V., J.A.P. and A.M.P.; writing—original draft preparation, N.F., N.R. and A.M.P.; writing—review and editing, N.F., N.R., A.C.A.V., C.F., H.P., J.A.P. and A.M.P.; supervision, N.R., J.A.P. and A.M.P.; funding acquisition, H.P., A.C.A.V., J.A.P. and A.M.P. All authors have read and agreed to the published version of the manuscript.

Funding

This research was funded by the Foundation for Science and Technology (FCT, Portugal) through the national funds FCT/MCTES to CIMO (UIDB/00690/2020) and to CEB (UIDB/04469/2020) units, to the Associate Laboratory SusTEC (LA/P/0007/2020), as well as by the European Regional Development Fund under the scope of Norte2020 - Programa Operacional Regional do Norte to BioTecNorte operation (NORTE-01-0145-FEDER-000004). Nuno Rodrigues thanks the National funding by FCT- Foundation for Science and Technology, P.I., through the Institutional scientific employment program-contract.

Institutional Review Board Statement

Not applicable.

Informed Consent Statement

Not applicable.

Data Availability Statement

The data presented in this study are available on request from the corresponding author.

Conflicts of Interest

The authors declare no conflict of interest.

References

  1. Pataca, J.K.G.; Porto-Figueira, P.; Pereira, J.A.M.; Caldeira, H.; Câmara, J.S. Profiling the occurrence of biogenic amines in different types of tuna samples using an improved analytical approach. LWT 2021, 139, 110804. [Google Scholar] [CrossRef]
  2. Dantas, N.M.; de Oliveira, V.S.; Sampaio, G.R.; Chrysostomo, Y.S.K.; Chávez, D.W.H.; Gamallo, O.D.; Sawaya, A.C.H.F.; Torres, E.A.F.D.S.; Saldanha, T. Lipid profile and high contents of cholesterol oxidation products (COPs) in different commercial brands of canned tuna. Food Chem. 2021, 352, 129334. [Google Scholar] [CrossRef] [PubMed]
  3. Boughattas, F.; Karoui, R. Mid infrared spectroscopy combined with chemometric tools for the identification of canned tuna species in brine. J. Food Composit. Anal. 2021, 96, 103717. [Google Scholar] [CrossRef]
  4. Sotelo, C.G.; Velasco, A.; Perez-Martin, R.I.; Kappel, K.; Schröder, U.; Verrez-Bagnis, V.; Jérôme, M.; Mendes, R.; Silva, H.; Mariani, S.; et al. Tuna labels matter in Europe: Mislabelling rates in different tuna products. PLoS ONE 2018, 13, e0196641. [Google Scholar] [CrossRef]
  5. Dominguez-Vidal, A.; Pantoja-De La Rosa, J.; Cuadros-Rodríguez, L.; Ayora-Cañada, M.J. Authentication of canned fish packing oils by means of Fourier transform infrared spectroscopy. Food Chem. 2016, 190, 122–127. [Google Scholar] [CrossRef]
  6. Boughattas, F.; Le Fur, B.; Karoui, R. Mid infrared spectroscopy coupled with chemometric tools for qualitative analysis of canned tuna with sunflower medium. J. Food Compost. Anal. 2020, 91, 103519. [Google Scholar] [CrossRef]
  7. Boughattas, F.; Le Fur, B.; Karoui, R. Identification and quantification of tuna species in canned tunas with sunflower medium by means of a technique based on front face fluorescence spectroscopy (FFFS). Food Cont. 2019, 101, 17–23. [Google Scholar] [CrossRef]
  8. Mata, W.; Chanmalee, T.; Punyasuk, N.; Thitamadee, S. Simple PCR-RFLP detection method for genus- and species-authentication of four types of tuna used in canned tuna industry. Food Cont. 2020, 108, 106842. [Google Scholar] [CrossRef]
  9. Krcmar, P.; Piskata, Z.; Servusova, E. Identification of tuna species thunnus albacares and katsuwonus pelamis in canned products by real-time PCR method. Acta Vet. Brno 2019, 88, 323–328. [Google Scholar] [CrossRef]
  10. Abdullah, A.; Rehbein, H. The differentiation of tuna (family: Scombridae) products through the PCR-based analysis of the cytochrome b gene and parvalbumin introns. J. Sci. Food Agric. 2016, 96, 456–464. [Google Scholar] [CrossRef]
  11. Liu, S.; Xu, K.; Wu, Z.; Xie, X.; Feng, J. Identification of five highly priced tuna species by quantitative real-time polymerase chain reaction. Mitochondrial DNA 2016, 27, 3270–3279. [Google Scholar] [CrossRef] [PubMed]
  12. Xiong, X.; Xu, W.; Guo, L.; An, J.; Huang, L.; Qian, H.; Cui, X.; Li, Y.; Cao, M.; Xiong, X.; et al. Development of loop-mediated isothermal amplification (LAMP) assay for rapid screening of skipjack tuna (Katsuwonus pelamis) in processed fish products. J. Food Composit. Anal. 2021, 102, 104038. [Google Scholar] [CrossRef]
  13. Chuenban, P.; Sornsaruht, P.; Pimdee, P. How brand attitude, brand quality, and brand value affect Thai canned tuna consumer brand loyalty. Heliyon 2021, 7, e06301. [Google Scholar] [CrossRef] [PubMed]
  14. Cecchi, L.; Migliorini, M.; Mulinacci, N. Virgin olive oil volatile compounds: Composition, sensory characteristics, analytical approaches, quality control, and authentication. J. Agric. Food Chem. 2021, 69, 2013–2040. [Google Scholar] [CrossRef]
  15. Marone, E.; Masi, E.; Taiti, C.; Pandolfi, C.; Bazihizina, N.; Azzarello, E.; Fiorino, P.; Mancuso, S. Sensory, spectrometric (PTR–ToF–MS) and chemometric analyses to distinguish extra virgin from virgin olive oils. J. Food Sci. Technol. 2017, 54, 1368–1376. [Google Scholar] [CrossRef] [PubMed] [Green Version]
  16. Kobayashi, Y.; Habara, M.; Ikezazki, H.; Chen, R.; Naito, Y.; Toko, K. Advanced taste sensors based on artificial lipids with global selectivity to basic taste qualities and high correlation to sensory scores. Sensors 2010, 10, 3411–3443. [Google Scholar] [CrossRef] [Green Version]
  17. Kostritskii, A.Y.; Kondinskaia, D.A.; Nesterenko, A.M.; Gurtovenko, A.A. Adsorption of Synthetic Cationic Polymers on Model Phospholipid Membranes: Insight from Atomic-Scale Molecular Dynamics Simulations. Langmuir 2016, 32, 10402–10414. [Google Scholar] [CrossRef]
  18. Arca, V.C.; Peres, A.M.; Machado, A.A.S.C.; Bona, E.; Dias, L.G. Sugars’ quantifications using a potentiometric electronic tongue with cross-selective sensors: Influence of an ionic background. Chemosensors 2019, 7, 43. [Google Scholar] [CrossRef] [Green Version]
  19. Jeong, H.-M.; Kwon, H.C.; Xu, B.; Hang, M.; Kwon, D.H.; Kang, S.W. Taste sensor based on the floating gate structure of a lateral double-diffused metal-oxide semiconductor. Sens. Actuators B Chem. 2020, 308, 127661. [Google Scholar] [CrossRef]
  20. Sharma, G.; Kumar, S.; Kumar, A.; Sharma, A.; Kumar, R.; Kaur, R.; Bhondekar, A.P. Development of Lipid Membrane Based Taste Sensors for Electronic Tongue. Procedia Comput. Sci. 2015, 70, 146–152. [Google Scholar] [CrossRef] [Green Version]
  21. Slim, S.; Rodrigues, N.; Dias, L.G.; Veloso, A.C.A.; Pereira, J.A.; Oueslati, S.; Peres, A.M. Application of an electronic tongue for Tunisian olive oils’ classification according to olive cultivar or physicochemical parameters. Eur. Food Res. Technol. 2017, 243, 1459–1470. [Google Scholar] [CrossRef]
  22. Toko, K.; Hara, D.; Tahara, Y.; Yasura, M.; Ikezaki, H. Relationship between the amount of bitter substances adsorbed onto lipid/polymer membrane and the electric response of taste sensors. Sensors 2014, 14, 16274–16286. [Google Scholar] [CrossRef] [PubMed]
  23. Veloso, A.C.A.; Dias, L.G.; Rodrigues, N.; Pereira, J.A.; Peres, A.M. Sensory intensity assessment of olive oils using an electronic tongue. Talanta 2016, 146, 585–593. [Google Scholar] [CrossRef] [PubMed] [Green Version]
  24. Wu, X.; Miyake, K.; Tahara, Y.; Fujimoto, H.; Iwai, K.; Narita, Y.; Hanzawa, T.; Kobayashi, T.; Kakiuchi, M.; Ariki, S.; et al. Quantification of bitterness of coffee in the presence of high-potency sweeteners using taste sensors. Sens. Actuators B Chem. 2020, 309, 127784. [Google Scholar] [CrossRef]
  25. Wu, X.; Tahara, Y.; Yatabe, R.; Toko, K. Taste sensor: Electronic tongue with lipid membranes. Anal. Sci. 2020, 36, 147–159. [Google Scholar] [CrossRef] [Green Version]
  26. Jia, Z.; Chen, X.-T.; Pan, N.; Cai, S.-L.; Zhang, Y.; Liu, Z.-Y. The Freshness of Frozen Fugu bimaculatus Detected by Electronic Tongue. Mod. Food Sci. Technol. 2021, 37, 220–229. [Google Scholar]
  27. Duan, Z.; Dong, S.; Dong, Y.; Gao, Q. Geographical origin identification of two salmonid species via flavor compound analysis using headspace-gas chromatography-ion mobility spectrometry combined with electronic nose and tongue. Food Res. Int. 2021, 145, 110385. [Google Scholar] [CrossRef]
  28. Wang, Y.; Wu, H.; Shi, W.; Huang, H.; Shen, S.; Yang, F.; Chen, S. Changes of the flavor substances and protein degradation of black carp (Mylopharyngodon piceus) pickled products during steaming. J. Sci. Food Agric. 2021, 101, 4033–4041. [Google Scholar] [CrossRef]
  29. Duan, Z.; Zhou, Y.; Liu, W.; Shi, C.C.; Li, L.; Dong, Y.; Gao, Q.; Dong, S. Variations in flavor according to fish size in rainbow trout (Oncorhynchus mykiss). Aquaculture 2020, 526, 735398. [Google Scholar] [CrossRef]
  30. Miao, H.; Liu, Q.; Bao, H.; Wang, X.; Miao, S. Effects of different freshness on the quality of cooked tuna steak. Innov. Food Sci. Emerg. Technol. 2017, 44, 67–73. [Google Scholar] [CrossRef] [Green Version]
  31. The European Commission. Commission Delegated Regulation (EU) 2015/1830 of 8th July 2015: Amending Regulation (EEC) No 2568/91 on the characteristics of olive oil and olive-residue oil and on the relevant methods of analysis. Off. J. Eur. Union 2015, L266, 9–13. [Google Scholar]
  32. Cherif, M.; Rodrigues, N.; Veloso, A.C.A.; Pereira, J.A.; Peres, A.M. Kinetic study of the microwave-induced thermal degradation of cv. Arbequina olive oils flavored with lemon verbena essential oil. JAOCS 2021, 98, 1021–1032. [Google Scholar] [CrossRef]
  33. IOC (International Olive Council). Sensory Analysis of Olive Oil—Method for the Organoleptic Assessment of Virgin Olive Oil Applying to Use a Designation of Origin; COI/T.20/Doc. no. 22; IOC (International Olive Council): Madrid, Spain, 2005; p. 29. [Google Scholar]
  34. Atitallah, A.B.; Barkallah, M.; Hentati, F.; Dammak, M.; Hlima, H.B.; Fendri, I.; Attia, H.; Michaud, P.; Abdelkafi, S. Physicochemical, textural, antioxidant and sensory characteristics of microalgae-fortified canned fish burgers prepared from minced flesh of common barbel (Barbus barbus). Food Biosci. 2019, 30, 100417. [Google Scholar] [CrossRef]
  35. AOAC 925.40. Official Methods of Analysis, 16th ed.; Association of Official Analytical Chemists: Arlington, VA, USA, 1995. [Google Scholar]
  36. AOAC 940.26. Official Methods of Analysis of AOAC International, 17th ed.; Horwitz, W., Ed.; AOAC: Arlington, VA, USA, 2000; Volume II, pp. 1–3. [Google Scholar]
  37. Bersuder, P.; Hole, M.; Smith, G. Antioxidants from a heated histidine glucose model system I: Investigation of the antioxidant role of histidine and isolation of antioxidants by high performance liquid chromatography. J. Am. Oil Chem. Soc. 1998, 75, 181–187. [Google Scholar] [CrossRef]
  38. ISO 4121:2003. Sensory Analysis—Guidelines for the Use of Quantitative Response Scales, 2nd ed.; International Organization for Standardization: Geneva, Switzerland, 2003; p. 9. [Google Scholar]
  39. ISO 13299: 2016. Sensory Analysis—Methodology—General Guidance for Establishing a Sensory Profile, 2nd ed.; International Organization for Standardization: Geneva, Switzerland, 2016; p. 41. [Google Scholar]
  40. ISO 11036:2020. Sensory Analysis—Methodology—Texture Profile, 2nd ed.; International Organization for Standardization: Geneva, Switzerland, 2020; p. 17. [Google Scholar]
  41. Ghrissi, H.; Veloso, A.C.A.; Marx, Í.M.G.; Dias, T.; Peres, A.M. A potentiometric electronic tongue as a discrimination tool of water-food indicator/contamination bacteria. Chemosensors 2021, 9, 143. [Google Scholar] [CrossRef]
  42. Dias, L.A.; Peres, A.M.; Veloso, A.C.A.; Reis, F.S.; Vilas-Boas, M.; Machado, A.A.S.C. An electronic tongue taste evaluation: Identification of goat milk adulteration with bovine milk. Sens. Actuators B Chem. 2009, 136, 209–217. [Google Scholar] [CrossRef]
  43. Bertsimas, D.; Tsitsiklis, J. Simulated annealing. Stat. Sci. 1993, 8, 10–15. [Google Scholar] [CrossRef]
  44. Cadima, J.; Cerdeira, J.O.; Minhoto, M. Computational aspects of algorithms for variable selection in the context of principal components. Comput. Stat. Data Anal. 2004, 47, 225–236. [Google Scholar] [CrossRef]
  45. Kirkpatrick, S.; Gelatt, C.D.; Vecchi, M.P. Optimization by simulated annealing. Science 1983, 220, 671–680. [Google Scholar] [CrossRef] [PubMed]
  46. Bishop, C.M. Pattern Recognition and Machine Learning, 1st ed.; Springer: New York, NY, USA, 2006. [Google Scholar]
  47. Caponio, F.; Bilancia, M.T.; Summo, C.; Gomes, T.; Pasqualone, A. A survey of in-oil canned tuna quality by sensory analysis and the determination of the oxidative degradation of the liquid medium. Int. J. Food Prop. 2010, 13, 672–681. [Google Scholar] [CrossRef]
  48. Gerhardt, N.; Schwolow, S.; Rohn, S.; Pérez-Cacho, P.R.; Galán-Soldevilla, H.; Arce, L.; Weller, P. Quality assessment of olive oils based on temperature-ramped HS-GC-IMS and sensory evaluation: Comparison of different processing approaches by LDA, KNN, and SVM. Food Chem. 2019, 278, 720–728. [Google Scholar] [CrossRef] [PubMed]
Figure 1. Canned tuna samples covered with different vegetable oils: sunflower oil; EVOOs with different fruity intensities (ripely fruity, greenly light fruity, and greenly intense fruity); and, ▲ refined olive oil. PCA plot (principal components—PC1: 21.6%; PC2: 19.4%; and, PC3: 12.0%) based on the sensory profiles and intensities assessed by trained panelists (visual, olfactory, kinesthetic, and gustatory attributes).
Chemosensors 10 00018 g001
Figure 2. Canned tuna samples covered with EVOO with different green-fruity intensities: ● greenly light fruity sensation; ■ greenly intense fruity sensation; and, ▲ ripely fruity sensation. PCA plot based on the sensory profiles and intensities assessed by trained panelists (visual, olfactory, kinesthetic, and gustatory attributes).
Chemosensors 10 00018 g002
Figure 3. E-tongue-LDA discrimination of canned tuna according to the covering oil used: sunflower oil; EVOOs with different fruity intensities (ripely fruity, greenly light fruity, and greenly intense fruity); and, ▲ refined olive oil. 2D-plot of the first two discriminant functions (DFs) based on the potentiometric signals recorded by 13 lipid sensor membranes (S1:5; S1:6; S1:8; S1:14; S1:16; S1:18; S2:1; S2:2; S2:4; S2:11; S2:12; S2:16; and, S2:19), selected by the SA algorithm.
Chemosensors 10 00018 g003
Figure 4. E-tongue-LDA discrimination of canned tuna according to the EVOO used: ● greenly light fruity sensation; ■ greenly intense fruity sensation; and, ▲ ripely fruity sensation 2D-plot of the first two discriminant functions (DFs) based on the potentiometric signals recorded by six lipid sensor membranes (S1:1; S1:7; S2:1; S2:4; S2:12; and S2:19), selected by the SA algorithm.
Chemosensors 10 00018 g004
Table 1. Lipid sensor membranes of the lab-made E-tongue: codes and composition.
Sensor’s CodeComposition 1
1st Array2nd Array
S1:1S2:1 65% PVC + 32 % P1 + 3% A1
S1:2S2:2 65% PVC + 32 % P1 + 3% A2
S1:3S2:3 65% PVC + 32 % P1 + 3% A3
S1:4S2:4 65% PVC + 32 % P1 + 3% A4
S1:5S2:5 65% PVC + 32 % P2 + 3% A1
S1:6S2:6 65% PVC + 32 % P2 + 3% A2
S1:7S2:7 65% PVC + 32 % P2 + 3% A3
S1:8S2:8 65% PVC + 32 % P2 + 3% A4
S1:9S2:9 65% PVC + 32 % P3 + 3% A1
S1:10S2:10 65% PVC + 32 % P3 + 3% A2
S1:11S2:11 65% PVC + 32 % P3 + 3% A3
S1:12S2:12 65% PVC + 32 % P3 + 3% A4
S1:13S2:13 65% PVC + 32 % P4 + 3% A1
S1:14S2:14 65% PVC + 32 % P4 + 3% A2
S1:15S2:15 65% PVC + 32 % P4 + 3% A3
S1:16S2:16 65% PVC + 32 % P4 + 3% A4
S1:17S2:17 65% PVC + 32 % P5 + 3% A1
S1:18S2:18 65% PVC + 32 % P5 + 3% A2
S1:19S2:19 65% PVC + 32 % P5 + 3% A3
S1:20S2:20 65% PVC + 32 % P5 + 3% A4
1 PVC: high molecular weight polyvinyl chloride. Plasticizers: bis(1-butylpentyl) adipate (P1); dibutyl sebacate (P2); 2-nitrophenyl-octyl ether (P3); tris(2-ethylhexyl) phosphate (P4); and, dioctyl phenylphosphonate (P5). Additives: octadecylamine (A1); oleyl alcohol (A2); methyltrioctylammonium chloride (A3); and, oleic acid (A4).
Table 2. Mean values (±standard deviation) of physicochemical (free acidity, FA; peroxide values, PV; extinction coefficients at 232 and 268 nm, K232 and K268; antioxidant activity, DPPH; and, total phenols contents, TPC) and gustatory sensory attributes (ripely fruity, greenly fruity, sweet, bitter and pungent attributes) of oils used as covering media (n = 5 bottles × 3 assays).
ParametersSunflower OilRefined Olive OilExtra Virgin Olive Oilp-Value 2
Ripely FruityGreenly Light FruityGreenly Intense Fruity
Physicochemical
FA (% oleic acid)0.17 ± 0.00c0.17 ± 0.00c0.28 ± 0.00a0.23 ± 0.00b0.23 ± 0.00b<0.0001
PV (mEq O2/kg)0.83 ± 0.00c0.83 ± 0.00c5.81 ± 0.59a5.65 ± 0.37a3.32 ± 0.01b<0.0001
K2323.28 ± 0.14a2.46 ± 0.03b1.76 ± 0.05c1.73 ± 0.01c1.85 ± 0.04c<0.0001
K2682.32 ± 0.06a0.33 ± 0.02b0.14 ± 0.01c0.16 ±0.01c0.17 ± 0.01c<0.0001
DPPH (%)2.09 ± 0.08d3.75 ± 0.30d20.22 ± 1.02c44.87 ± 1.55b66.97 ± 1.82a<0.0001
TPC (mg GAE/kg)NDND114 ± 18c282 ± 21b476 ± 20a<0.0001
Gustatory sensory evaluation 1
Ripely fruityNDND7.38 ± 0.15NDND----
Greenly fruityNDNDND4.49 ± 0.07b6.90 ± 0.01a<0.0001
SweetNDND6.95 ± 0.04a4.50 ± 0.01b1.19 ± 0.07c<0.0001
BitterNDND3.35 ± 1.02a2.96 ± 0.44a3.65 ± 0.37a0.3090
PungentNDND0.88 ± 0.18c2.14 ± 0.30b4.64 ± 0.11a<0.0001
1 Intensity scale: from 0 (absence of attribute: not perceived, ND, by the panelists) to 10 (maximum attribute intensity). 2 p-values for the one-way ANOVA or t-Student test. Different letters in the same row show statistically differences at a 5% significance level.
Table 3. Mean values (±standard deviation) of pH, moisture (%), ash (%), DPPH (%), total phenols contents (TPC mg GAE/kg), and color of canned tuna covered with different oil media (n = 5 cans × 3 assays).
Parameters 1Canned Tuna Covered with Different Mediap-Value 2
Sunflower OilRefined Olive OilExtra Virgin Olive Oil
Ripely FruityGreenly Light FruityGreenly Intense Fruity
Physicochemical
pH5.64 ± 0.02a5.53 ± 0.02b5.57 ± 0.01b5.62 ± 0.05a5.62 ± 0.00a<0.0001
Moisture (%)60.5 ± 1.5a61.5 ± 1.3a60.1 ± 1.8a61.6 ± 3.0a58.6 ± 4.2a0.3760
Ash (%)1.28 ± 0.01ab1.32 ± 0.04a1.25 ± 0.01b1.29 ± 0.02ab1.34 ± 0.07a0.0097
DPPH (%)3.5 ± 1.7e9.2 ± 0.5d12.1 ± 0.8c15.2 ± 0.7b20.4 ± 0.9a<0.0001
TPC (mg GAE/kg)264 ± 19c284 ± 6bc340 ± 11a330 ± 14a293 ± 4b<0.0001
CIELAB color scale
L*59.9 ± 2.0a58.7 ± 2.1a57.5 ± 1.3a57.3 ± 2.0a58.1 ± 1.7a0.2120
a*4.5 ± 0.2c4.6 ± 0.1bc6.3 ± 0.5a4.7 ± 0.3bc5.3 ± 0.6b<0.0001
b*16.7 ± 1.3b19.8 ± 1.3a22.1 ± 2.1a22.3 ± 1.3a21.7 ± 1.6a<0.0001
C*17.3 ± 1.3b20.4 ± 1.3a23.0 ± 1.9a22.7 ± 1.3a22.3 ± 1.6a<0.0001
h*74.8 ± 1.2b76.9 ± 0.7ab73.9 ± 2.6b78.1 ± 0.976.3 ± 1.9ab0.0043
1 TPC: total phenols content. 2 p-values for the one-way ANOVA. Different letters in the same row show statistically differences at a 5% significance level.
Table 4. Intensities of sensory sensations, including visual, olfactory, kinesthetic, and gustatory attributes, perceived by the trained sensory panelists (mean ± standard deviation; n = 5 cans).
Sensory Attributes 1Canned Tuna Covered with Different Mediap-Value 2
Sunflower OilRefined Olive OilExtra Virgin Olive Oil
Ripely FruityGreenly Light FruityGreenly Intense Fruity
Visual sensations
Consistency4.7 ± 0.4ab5.2 ± 0.3a3.9 ± 0.5b5.7 ± 0.7a3.7 ± 1.0b0.0002
Appearance6.8 ± 1.4a5.9 ± 1.0a5.8 ± 1.6a6.0 ± 1.0a5.8 ± 1.0a0.6500
Color uniformity2.6 ± 0.5a4.0 ± 0.7a3.7 ± 1.3a3.8 ± 0.3a3.5 ± 0.4a0.0633
Brightness3.6 ± 0.4abc2.7 ± 0.3c4.3 ± 0.8a3.0 ± 0.4bc3.6 ± 0.3ab0.0002
Strange spotsNDNDNDNDND----
Olfactory sensations
Tuna aroma7.2 ± 0.5a6.8 ± 0.2a6.9 ± 0.4a3.8 ± 1.4b4.3 ± 0.9b<0.0001
Aroma intensity5.7 ± 0.9a6.4 ± 0.3a5.7 ± 0.2a3.8 ± 0.5b4.7 ± 0.0b<0.0001
Aroma pleasantness6.0 ± 0.7ab6.4 ± 1.1a6.5 ± 0.3a5.2 ± 0.8ab4.8 ± 0.2b0.0032
Other aromaNDND3.3 ± 0.6a2.4 ± 0.9a3.1 ± 0.3a0.1098
Off-flavor (rancid)NDNDNDNDND----
Complexity2.9 ± 0.5b3.1 ± 0.7b4.8 ± 0.2a3.5 ± 0.5b2.9 ± 0.5b<0.0001
Persistence3.2 ± 0.6b3.4 ± 0.4b5.0 ± 0.2a3.8 ± 0.4b3.3 ± 1.0b0.0008
Kinesthetic sensations
Succulence2.5 ± 0.5c2.9 ± 0.5bc3.1 ± 1.0bc5.1 ± 0.4a3.7 ± 0.6b<0.0001
Chewiness2.9 ± 0.9ab3.8 ± 0.5a3.8 ± 1.0a1.9 ± 0.8b3.5 ± 0.7a0.0075
Hardness3.0 ± 0.8a2.9 ± 0.6a4.1 ± 0.8a3.2 ± 0.4a3.3 ± 0.6a0.0489
Adhesiveness1.7 ± 0.8c3.8 ± 0.4a3.2 ± 0.8ab2.3 ± 0.5bc4.0 ± 0.5a<0.0001
Gustatory sensations
Tuna taste4.8 ± 0.7a4.9 ± 0.2a4.6 ± 0.6a3.0 ± 1.2a4.0 ± 1.7a0.0438
Fat taste1.5 ± 0.8a1.2 ± 0.4a2.0 ± 0.5a1.1 ± 0.6a1.3 ± 0.3a0.1390
Taste intensity5.1 ± 0.2a3.5 ± 0.7b5.0 ± 0.2a3.9 ± 0.5b3.2 ± 0.5b<0.0001
Taste pleasantness5.5 ± 1.2a4.6 ± 0.4a5.1 ± 0.3a4.9 ± 0.3a4.9 ± 0.5a0.3130
Saltiness1.5 ± 0.5a1.3 ± 0.4a1.5 ± 0.4a1.4 ± 0.2a1.4 ± 0.3a0.9500
Bitterness0.7 ± 0.1a0.8 ± 0.7a1.3 ± 0.8a0.7 ± 0.2a0.8 ± 0.3a0.3534
Sweetness2.7 ± 0.6a2.7 ± 0.5a2.4 ± 0.8a2.9 ± 0.4a2.8 ± 0.7a0.7100
PungencyNDNDNDND0.6 ± 0.1----
Other tastesNDNDNDNDND----
Complexity3.0 ± 1.2a2.3 ± 0.2a3.2 ± 0.5a3.2 ± 0.7a2.8 ± 0.4a0.2150
Persistence3.2 ± 0.7a3.0 ± 0.3a3.5 ± 0.2a3.4 ± 0.7a3.3 ± 0.7a0.6460
1 Quantitative descriptive analysis: intensities ranging from 0 (not perceived; ND) to 10 (maximum intensity). 2 p-values for the one-way ANOVA. Different letters in the same row show statistically differences at a 5% significance level.
Publisher’s Note: MDPI stays neutral with regard to jurisdictional claims in published maps and institutional affiliations.

