Article

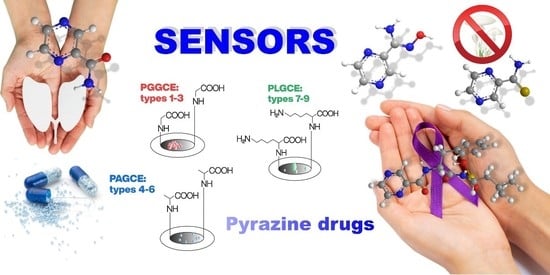
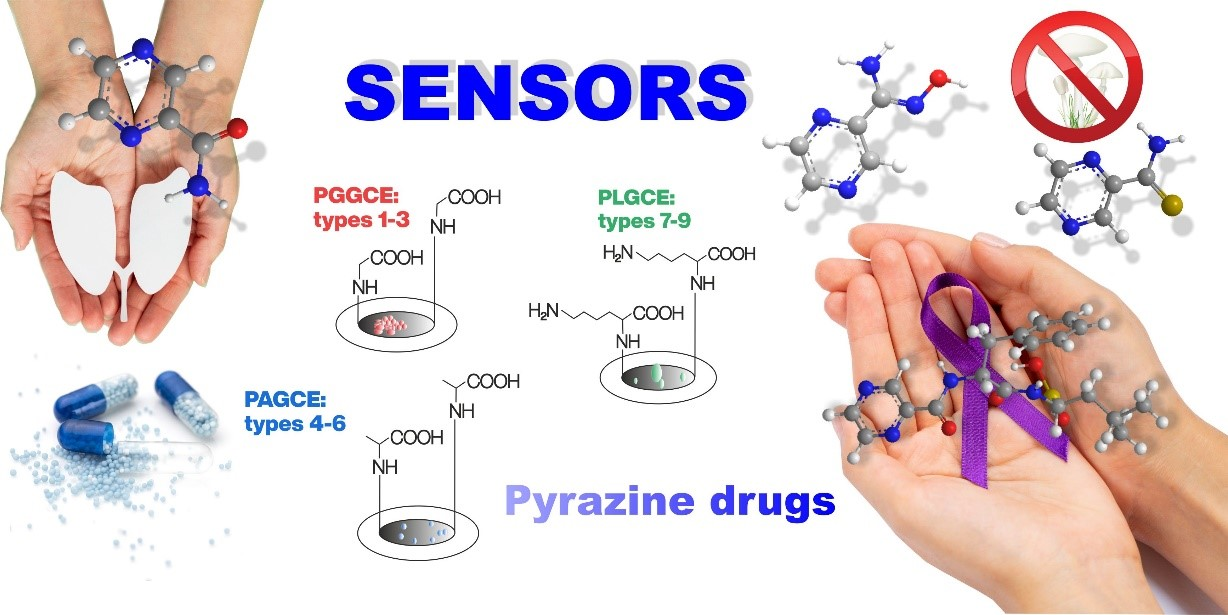
Sensors to the Diagnostic Assessment of Anticancer and Antimicrobial Therapies Effectiveness by Drugs a with Pyrazine Scaffold

by
Marta Domżalska
1,
Aleksandra M. Dąbrowska
1,
Dawid Chojnowski
2,
Mariusz Makowski
1,* and
Agnieszka Chylewska
1,*
1
Department of Bioinorganic Chemistry, Faculty of Chemistry, University of Gdańsk, Wita Stwosza 63, 80-308 Gdansk, Poland
2
Keyence International, Irysowa 1, Bielany Wroclawskie, 55-040 Kobierzyce, Poland
*
Authors to whom correspondence should be addressed.
Submission received: 11 December 2021 / Revised: 3 January 2022 / Accepted: 4 January 2022 / Published: 7 January 2022
(This article belongs to the Special Issue Peptides and Their Derivatives as Chemical Sensors)

Abstract

:
Treatment with pyrazine derivatives—antituberculosis pyrazinamide (PZA), anticancer bortezomib (BZM), and antifungal pyrazine-2-amidoxime (PAOX) and pyrazine-2-thiocarboxamide (PTCA)—is associated with side effects, as observed in the case of other therapeutic drugs. To prevent the side effects of pyrazine derivatives, researchers are working to develop a universal method that will detect these compounds in body fluids. There is a lack of literature data about voltammetric measurements with poly-L-amino acid-modified GCEs surfaces. The available reports describe the application of various modifications of these electrodes for the detection of different active substances of drugs; however, they do not indicate one particular method for the detection of drugs with a pyrazine skeleton. This research aimed to prepare three types of glassy carbon electrodes (GCEs) with modified surfaces by electropolymerization using 1, 10, and 100 mM solutions of L-glycine (Gly), L-alanine (Ala), L-lysine (Lys), respectively. The poly-amino acid coatings applied on GCE surfaces were analyzed in detail under a three-dimensional (3D) microscope and were used as chemosensors of four pyrazine drugs in stoichiometric tests. The results were compared with the measurements made on an unmodified GCE. To obtain reliable results, the linearity of measurements was also verified in the concentration gradient and appropriate scanning speed was chosen to achieve the most accurate measurements.

Graphical Abstract

1. Introduction

The studied pyrazine derivatives (Figure 1) have found many applications in clinical and biological practice. Pyrazinamide (PZA) is used as an antituberculosis drug [1,2,3], pyrazine-2-thiocarboxamide (PTCA) and pyrazine-2-amidoxime (PAOX) have been found to have antimycotic potential against Candida albicans [4,5,6,7,8], and bortezomib (BZM) is the only proteasome inhibitor used in the treatment of multiple myeloma [9,10,11]. However, the clinical use of these substances is limited mainly due to their side effects, which include rhabdomyolysis, skin eruptions, neutropenia, intestinal obstruction, or renal failure in patients undergoing treatment with PZA and BZM [12,13,14] or other reactions resulting from inappropriate preparation in the case of PAOX and PTCA [4].
In addition, therapeutic doses of drugs also cause side effects, and the therapeutic dose of BZM is 1.3 mg/m². It is lowered, especially when neuropathy occurs. In the event of a threat to life, the administration of BZM is abandoned. Pyrazinamide used in the four-drug regimen is the most common cause of drug-induced hepatitis, but the morbidity has significantly decreased due to dose reduction to 12–30 mg/kg body weight per day (previously 40–70 mg). The frequencies of hepatotoxicity were 0.042 (CI, 0.026 to 0.067) for 30 mg/kg of body weight, 0.055 (CI, 0.031 to 0.094) at 40 mg/kg, and 0.098 (CI, 0.047 to 0.193) at 60 mg/kg of pyrazinamide [15,16,17,18]. Therefore, there is a need for quick, reproducible, and accurate methods for determining active substances in drugs to monitor the effectiveness of treatment and to determine the correct dose of an active substance to limit the occurrence of side effects during therapy.
Electrochemical techniques are popularly used for quantification and allow a reversible analysis of samples at a wider range of concentrations compared to chromatographic or spectrophotometric techniques [19,20,21,22]. One of the most frequently used electrochemical methods is voltammetry with modified GCEs (unmodified electrodes are not preferred as they are characterized by a smaller range of linearity, lower limits of detection, and quantitation and a large overpotential). Numerous studies have shown that modification of electrodes with poly-L-amino, acid coatings, and/or coatings containing carbon nanoparticles improve their performance [23,24,25,26].
One of the methods used to modify the electrodes is electropolymerization. This is a coating procedure in which a conductive polymer is formed and deposited from a monomer solution onto the electrode surface. This is the usual method for modifying relatively small areas. Care should be taken when selecting the electropolymerization conditions, especially relating to the applied potential and current. The applied potential should be high enough to oxidize and polymerize the monomer, but also low enough not to alter the surface structure of the clean electrode. One of the electrolyzers deposited on the GCE is poly-L-amino acids. The general multi-step mechanism of the polymer formation has been presented in Figure 2. In the first step of the reaction, the hydride radical is cleaved from the amino group. The L-amino acid radical then attaches to the electrode surface. In the last step, additional L-amino acid molecules are joined and multiplied. The result is a sensor with very high sensitivity, a wide range of linearity, low limit of detection, repeatable and reproducible. These sensor properties have been proven in the literature [27,28,29].
L-amino acid duplicated biosensors have also found application in the detection of drugs with a pyrazine motif. Research has been performed using differential impulse voltammetry on a sensor containing poly-L-methionine and electrochemically reduced graphene oxide/GCE to detect PZA in urine, plasma, and pharmaceuticals [24]. Similar studies were carried out to estimate the content of PZA in serum using graphene oxide—or poly-L-arginine—modified GCE [30] and to determine PZA in pharmaceuticals, urine, and serum using tyrosine-modified GCE [31]. The reproducibility and selectivity of poly-L-arginine-modified GCE for PZA were considered acceptable; however, the linear ranges and detection limits of PZA were not as desired. The sensor obtained with L-glycine electropolymerization on GCE was successfully used to determine trace amounts of PZA using square-wave voltammetry (SWV). Initial studies based on this method proved the electrocatalytic activity of poly-L-Gly/GCE in the PZA redox system (pH 7.5), which is a diffusion-controlled process, and optimization of the method resulted in a linear response (R = 0.998) at a PZA concentration of 0.47–6.15 μM, with a drug detection limit of 0.035 μM and a quantitative limit of 0.12 μM. Moreover, the matrix of actual samples was not found to interfere with the voltammetric reaction of PZA, and hence this assay was considered highly selective, fast, and cheap compared to other analytical procedures. In addition, measurements with this technique involved minimal loss of samples, which allowed for its multiple uses in analyses [32].
The present work aimed to obtain nine electrocatalytic sensors (Figure 3) for the determination of biologically active medicinal substances with a pyrazine ring in their structure. Sensors for cyclic voltammetry (CV) were prepared through surface modification of a glassy carbon electrode (GCE) by electropolymerization of amino acids to poly-(L-lysine)/(L-alanine)/(L-glycine). The study analyzed the influence of L-amino acid concentrations on the structure of the obtained coatings and evaluated various concentrations of PZA, BZM, PAOX, and PTCA to test the sensitivity and selectivity of the newly obtained sensors. The main goal of the study was to obtain a universal biosensor for the analysis of PZA analogs with potential clinical applications. The research focused primarily on specifying the universal biosensor and did not include analyses of samples from the human body. First of all, we wanted to investigate the relationship between the type and concentration of the modifier and the changes on the electrode surface. These were pioneering studies, as no research group has yet analyzed the entire electrode surface in terms of the structure of the modified electrode surface.

2. Materials and Methods

2.1. Chemicals

PZA (500 mg; ≥98% HPLC) tablets and BZM powder (4 sachets, 30 mg each; ≥98% HPLC) were purchased from a commercial source (Bioanalytic) and stored in a closed polystyrene container in a refrigerator (4 °C) until use. PTCA (97% HPLC) and PAOX (97% HPLC) were purchased from Sigma-Aldrich and Merck, respectively. Both mentioned PTCA and PAOX were used after further purification by crystallization in acetonitrile and a mixture of acetonitrile and tetrahydropyran (1/1, v/v), respectively. Double-distilled water (Hydrolab-Reference purified) was used for preparing solutions and cleaning the electrodes.

2.2. Electrochemical Measurements

CV measurements were obtained in an Autolab PGSTAT204 potentiostat/galvanostat (Metrohm Autolab B.V., Utrecht, The Netherlands), controlled by Nova software. In the three-electrode system, a GCE or modified electrodes (PGGCE, PAGCE, PLGCE) served as the working (polarizable) electrode, an Ag/AgCl electrode as the reference electrode (non-polarizable), and a platinum wire (about 7.0 cm long) as the counter electrode. The GCEs were custom-made (Mineral). They were cleaned before use with 0.2 µM Al2O3 before the analysis. Water solutions of the drugs with a volume of 5 cm3 (PZA, PAOX, PTCA: 0.50–2.00 mM concentration; BZM: 1.00–1.50 mM concentration) were used for measurements. We used low concentrations of BZM due to its low-water solubility (76 mg/L at 25 °C) [33]. Only solutions containing a sample of one compound were used in the analyses. It would be useless to use a mixture in this case since these compounds are not used simultaneously. All samples were added with the electrolyte—sodium perchlorate (0.1 M). CV measurements were performed at room temperature (25 °C). Each of the analyzed solutions (Figure S1 included in Supplementary Material—SM) were purged with ultrapure argon for approximately 7–12 min before the measurements. Limiting the access of oxygen is important because it can interact with the test solution and can cause the formation of competitive peaks [34], Equations (1)–(4):
in an acidic environment
O2 + 2H + + 2e → H2O2
H2O2 + 2H + + 2e → 2 H2O
and in alkaline or neutral environment:
O2 + 2 H2O + 2e → H2O2
H2O2 + 2e → 2 OH

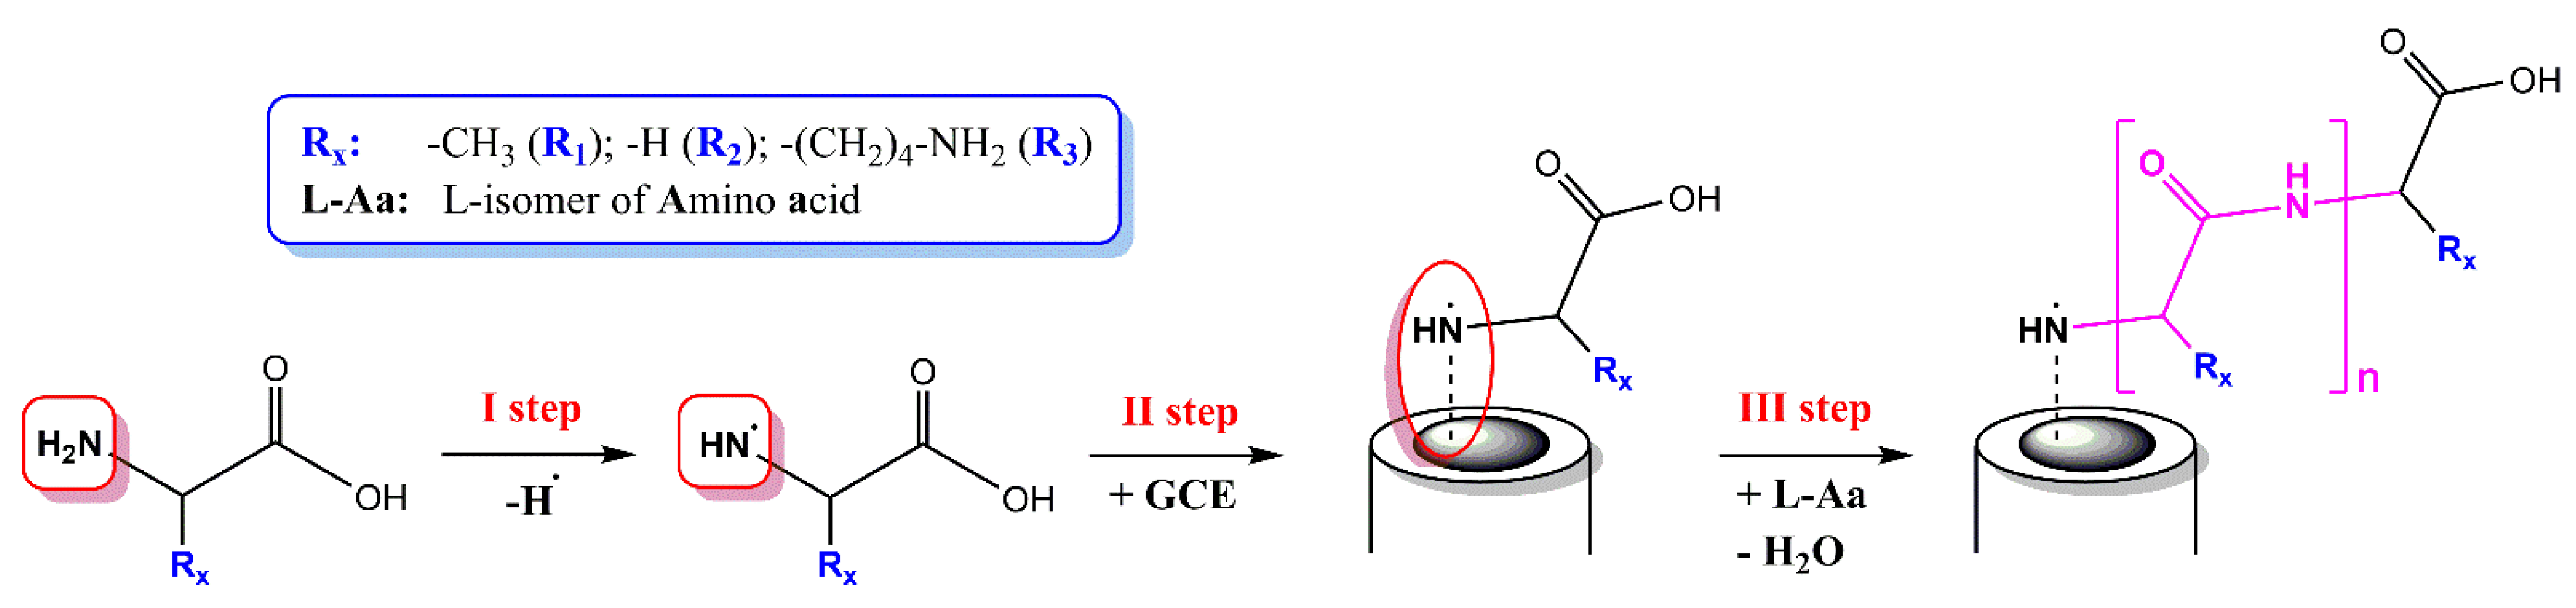
2.3. Electroplolymerization of GCE and Poly-L-Glycine Glassy Carbon Electrodes (PGGCE) Preparing

The procedure used for the electropolymerization of L-glycine (Merck, ACS reagent, ≥ 98.5%) on the GCE surface was adopted from the literature [35,36]. Briefly, the GCE was polished with an aqueous solution of 0.2 μm Al2O3 and washed with distilled water. Its surface was completely electropolymerized for 20 cycles to yield the PGGCE sensors (1.0 mM < [Gly] < 100 mM aqueous solutions together with 0.1 M NaClO4; scan rate: 100 mV·s−1; scan window from −0.5 to 1.8 V). In the literature, a total of 10 electropolymerization cycles is suggested, but this number was increased to 20 to allow complete reaction (cathode peak at −0.35 V; Figure S2 of Supplementary Materials).

2.4. Poly-L-Alanine Glassy Carbon Electrodes (PAGCE) Formatting

An analogous modification procedure was adopted for the modification of electrodes with L-alanine (Merck, ≥99%). A specific electropolymerization technique for this amino acid is not proposed in the literature; however, because alanine is a glycine homolog, it was considered that the same modification technique would be successful, see Supplementary Materials and Figure S3.

2.5. Poly-L-Lysine Glassy Carbon Electrodes (PLGCE) Receiving

Electrode modification with L-lysine (Merck, ≥98% HPLC) was performed using a similar method as that suggested in the literature [37]. Briefly, L-lysine solutions with a volume of 5 cm3 were prepared with the addition of 0.1 M NaClO4 in phosphate buffer (pH 7.8). Electropolymerization was carried out in 10 cycles with potentials from −1.0 to 2.1 V and at a scanning speed of 100 mV·s−1. The applied measurement window and the number of measurement cycles enabled complete electropolymerization and allowed for more accurate observation of changes (cathode peak at −0.7 V, anode peak at 1.2 V; Figure S4 of Supplementary Materials).

2.6. Cleaning and Re-Modification of Electrodes

To carry out detailed analyzes of the selected electrodes, it was necessary to modify them again. The previously used electrodes were cleaned by repeated polishing and placing in concentrated NaOH (0.2 M performed from anhydrous pellets as reagent grade, ≥98%) and HCl (0.2 M obtained from ACS reagent, 37%) solutions alternately and freshly prepared.

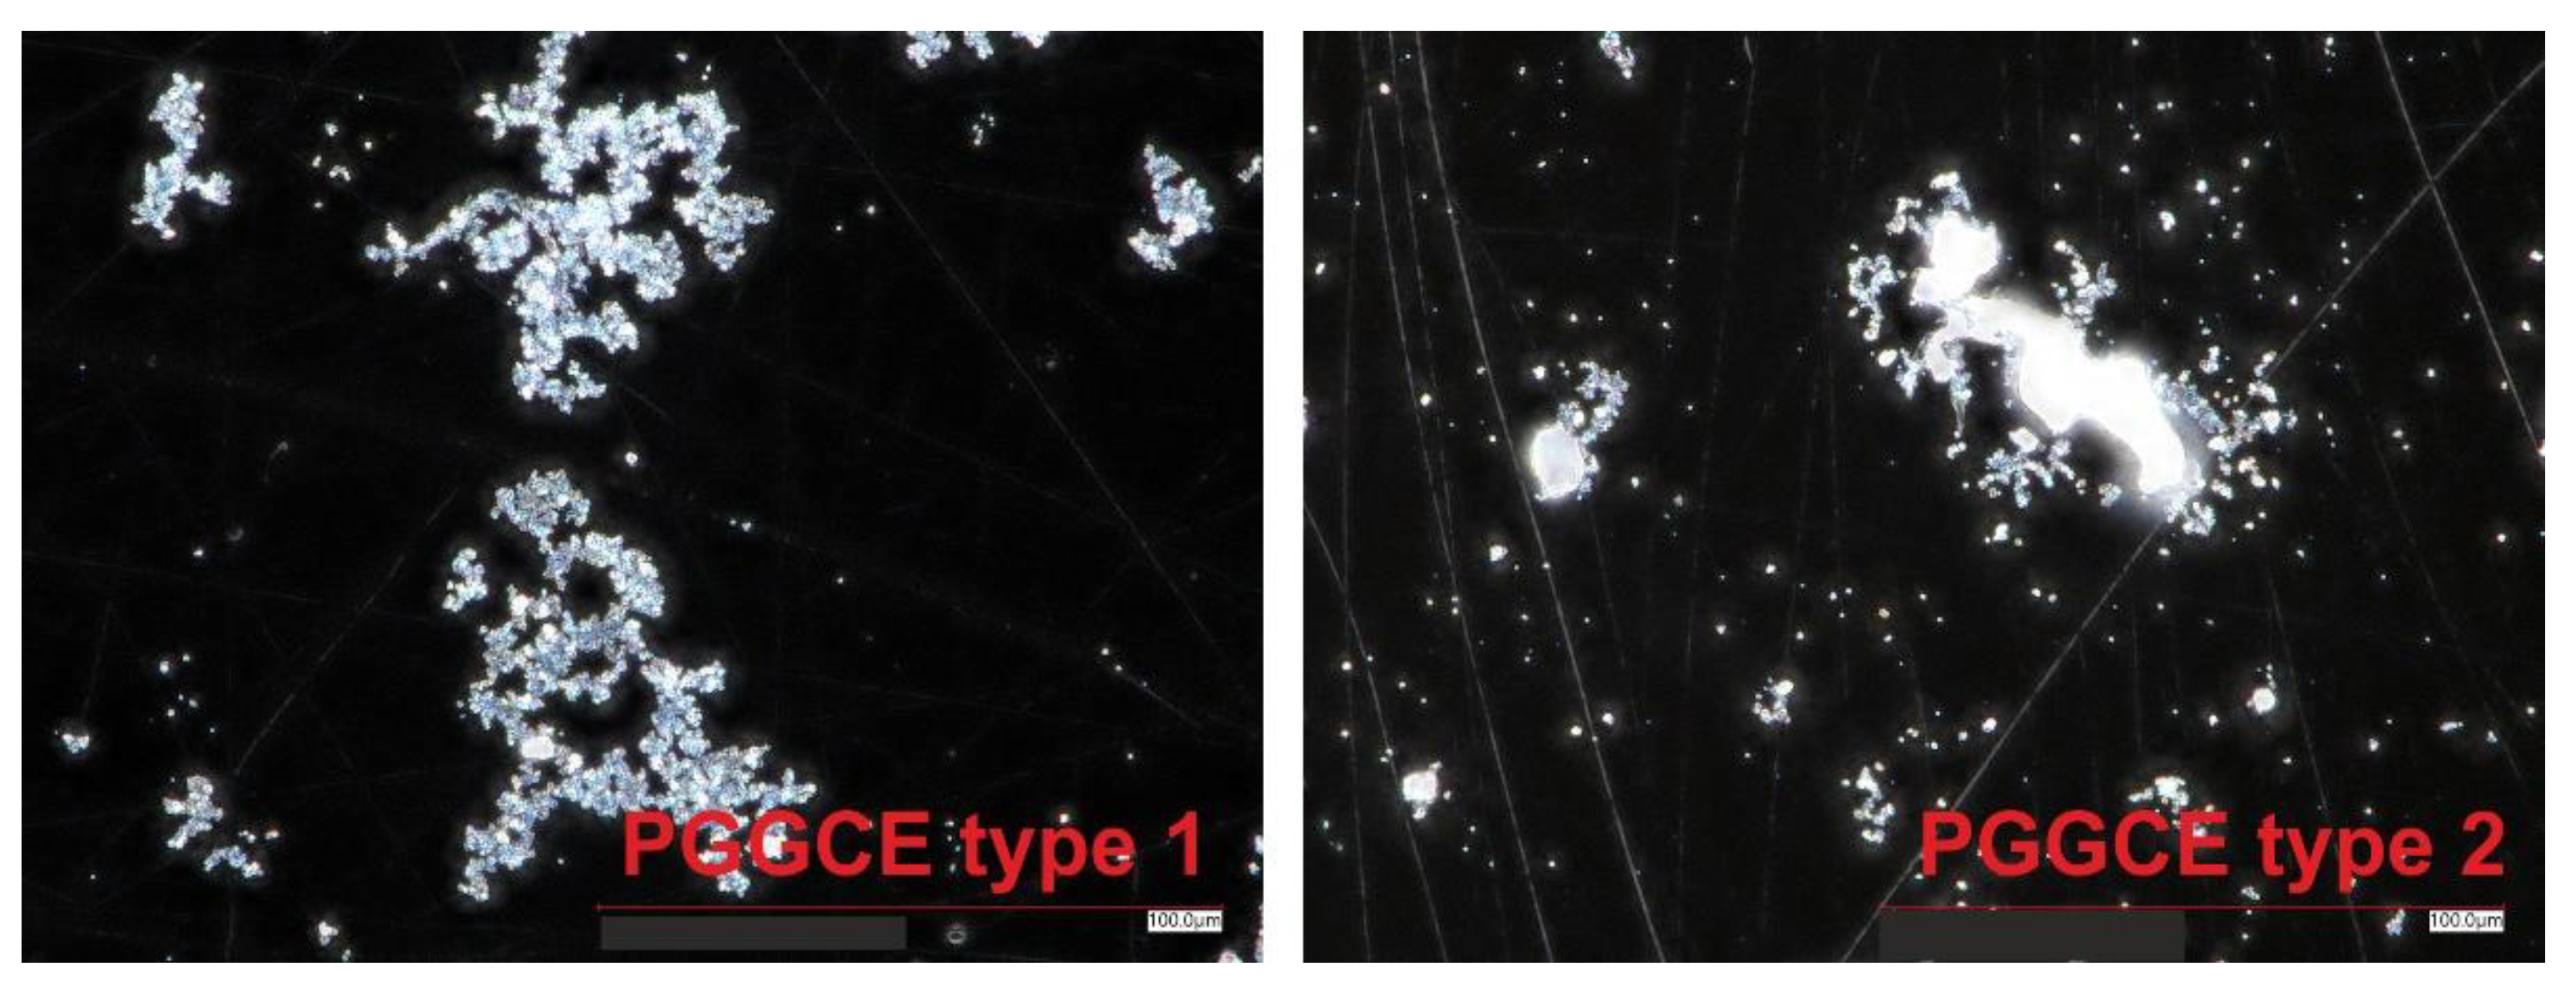
2.7. Microscopic Imaging

To find out the specifications of the newly developed sensors, the surface of the sensors absorbed by the polyforms and the thickness of the resulting poly-amino acid layer was measured. These measurements were made using photos taken with a VHX 3D spatial imaging microscope (Keyence). The photos were obtained at a magnification of ×100, ×1500, ×4000 under bright (coaxial) and dark-field (ring light) illumination. The 3D modeling was a performer with the “depth composition” scan of the photo using an algorithm with sharp pixels. Information about the Z-axis measurement was obtained from a motor with a resolution of up to 100 nm.

3. Results and Discussion

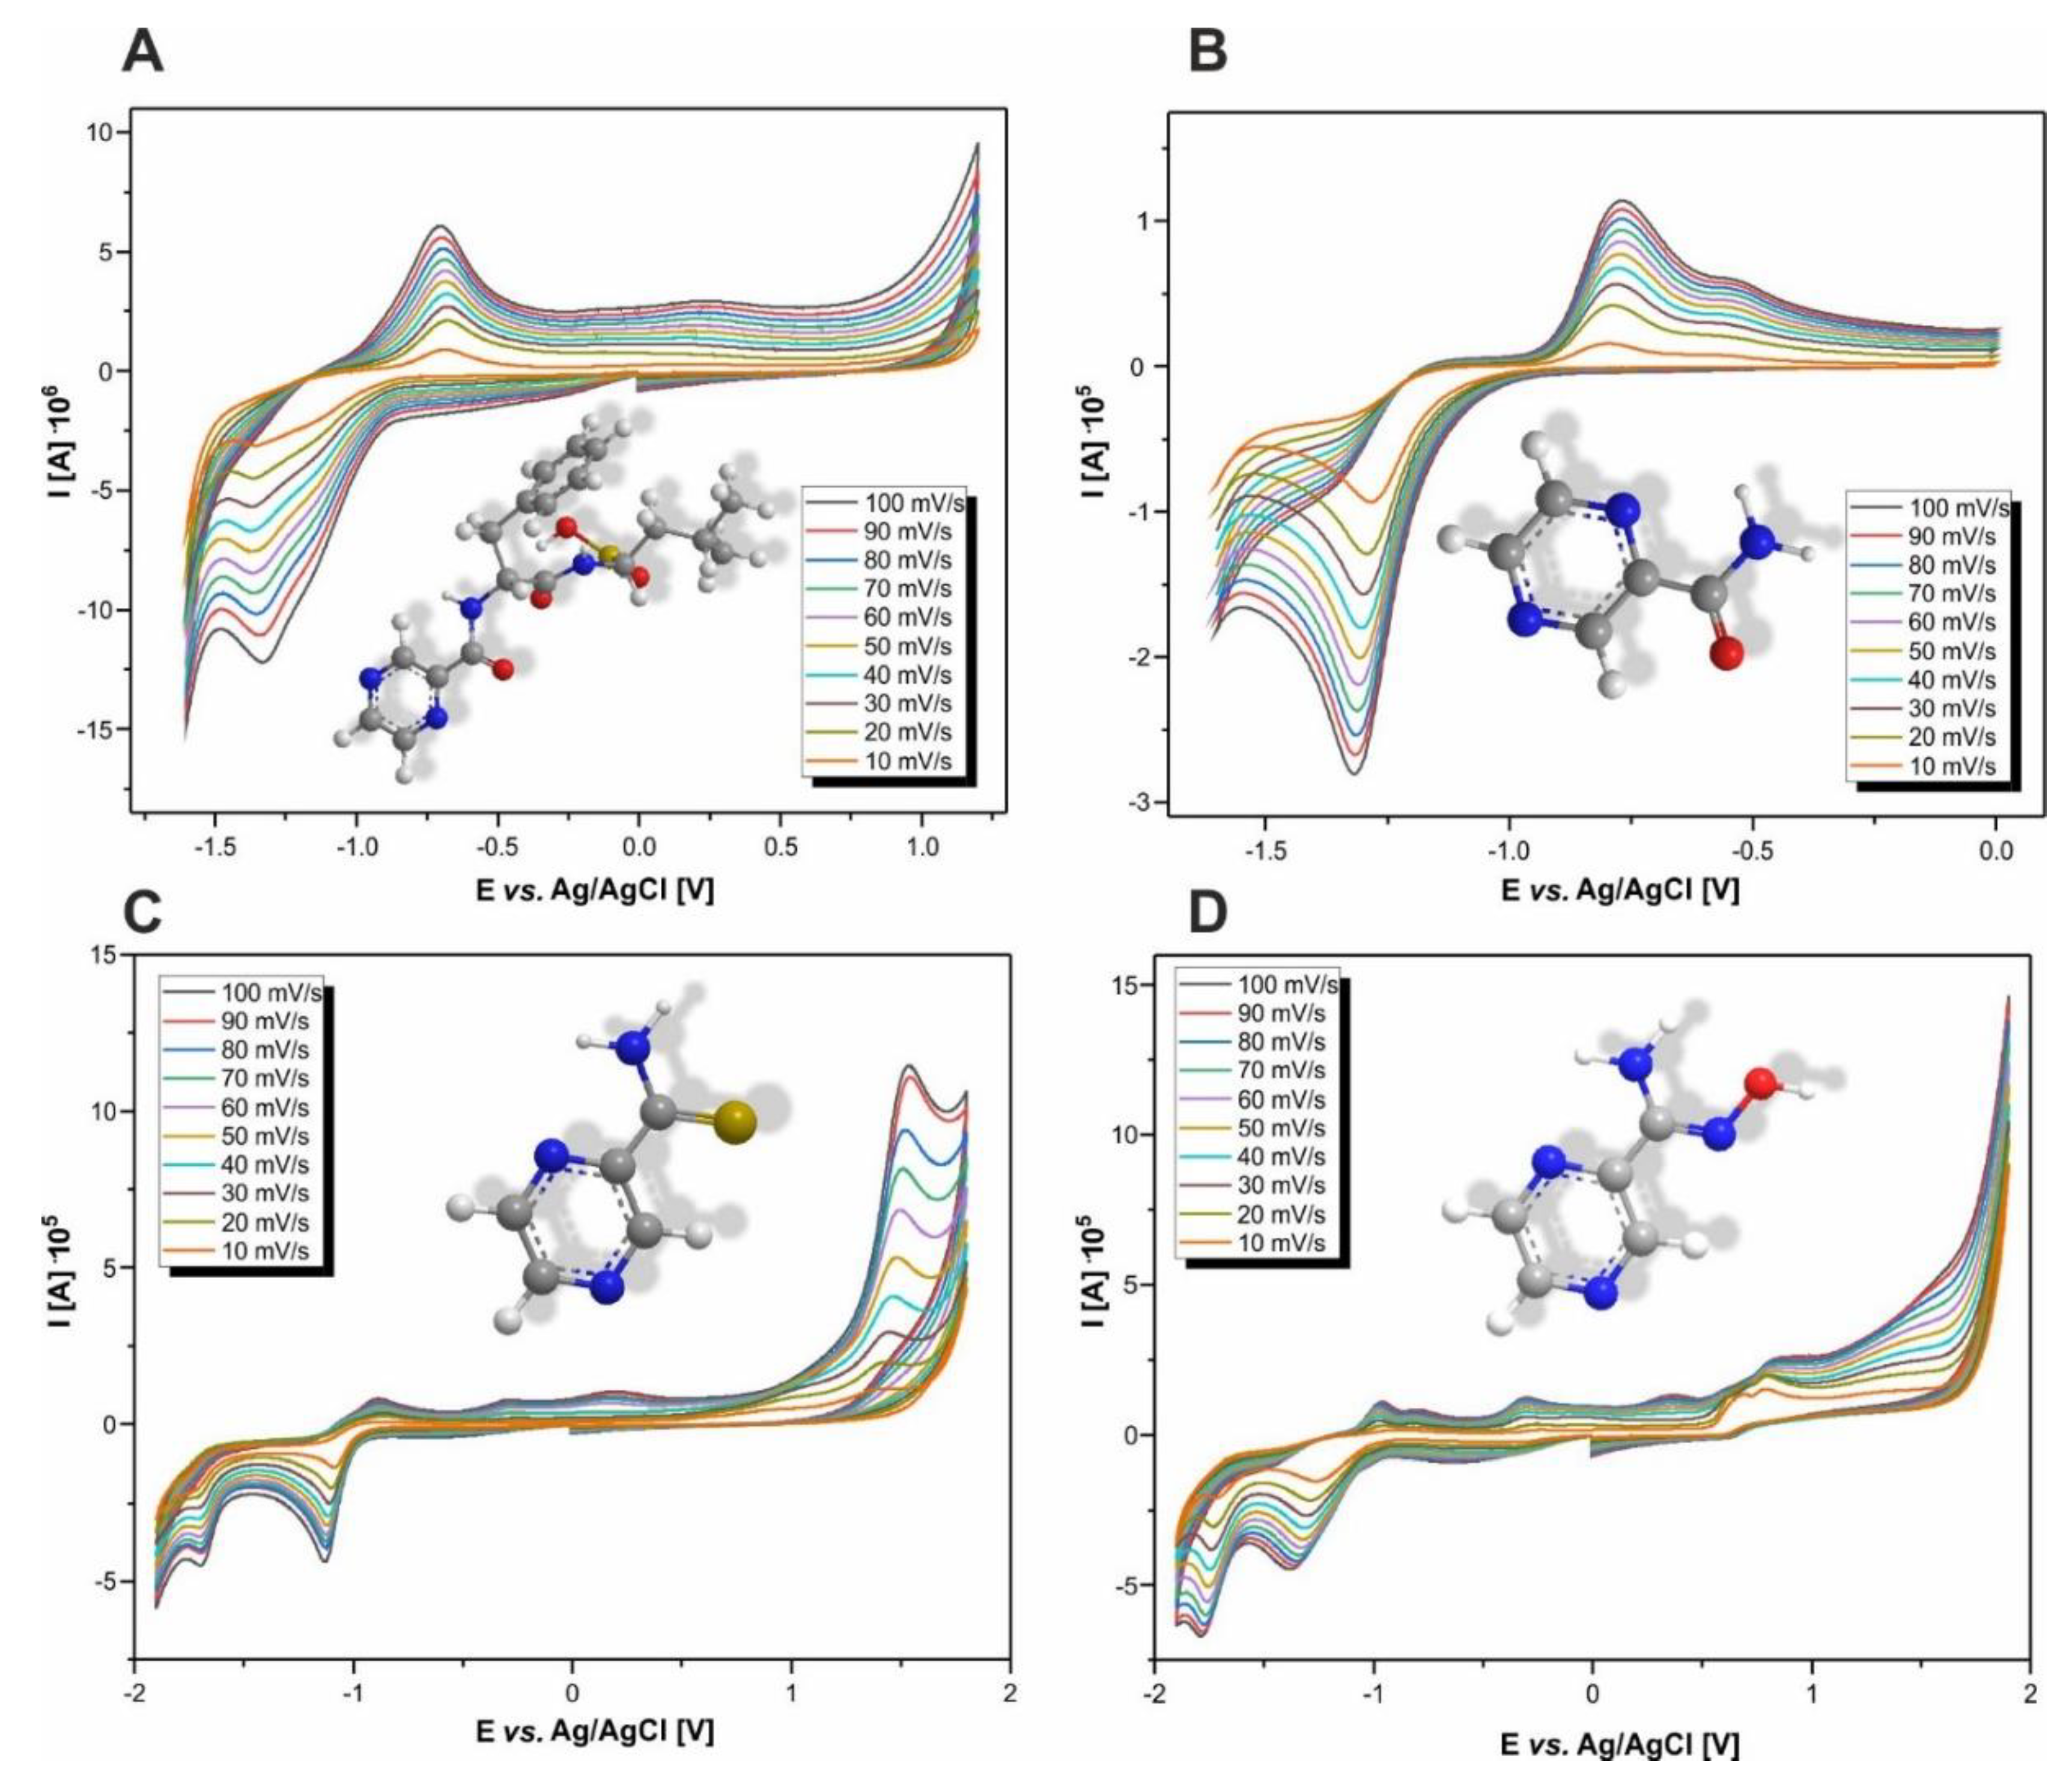
3.1. Determining the Range of Potentials

For PZA measurement, the range of potentials was chosen based on the literature data [16]. For BZM, PAOX, and PTCA, the measurement parameters were gradually modified until characteristic electrochemical responses appeared in the form of the cathode and anode current peaks. The ranges of the measuring potentials and the potential values at which the characteristic peaks appeared are presented in Table 1.
The data presented in Table 1 and Figure 4 prove that voltammograms of all 1,4-diazine derivatives show the cathode peak (±1.25 V) and anode peak (±0.25 V) responses. These data allow for the conclusion that these peaks may also be characteristic of other pyrazine derivatives, being an important aspect in further research on this group of compounds, both in qualitative and quantitative analysis, e.g., in the analysis of the content of substances in body fluids.

3.2. Scan Speed Optimization

To determine the optimal scan rate for PZA, BZM, PTCA, and PAOX, CV measurements were carried out in the range of 10–100 mV·s−1, in increments of 10 mV·s−1 (Figure 4). The optimal scanning speed which was used in the subsequent CV method and GCE electropolymerization was determined as 100 mV·s−1. At a given rate, the most intense values of cathode and anode current peaks were obtained. This is due to the fact that carrying out measurements at lower rates and lower concentrations would give much less intense, negligible responses on the voltammogram, making the detection of a given substance impossible. This value is also the most frequently suggested in the literature [37].
The effect of the scan rate on the peak current of each pyrazine derivative (BZM, PZA, PTCA as well as PAOX) was investigated by CV (Figure S5 of Supplementary Materials). It indicated that the current oxidation peak was directly linear to the square root of the scan rate over the range of 10 to 100 mV/s. This indicates that the oxidation of objects tested on the poly-L-aminoacid-GC modified electrode is a diffusion-controlled process. All correlation coefficients obtained are close to one (r BZM = 0.99376; r PZA = 0.99976; r PTCA = 0.99664; r BZM = 0.98738), which proves the correctness of the above statement.

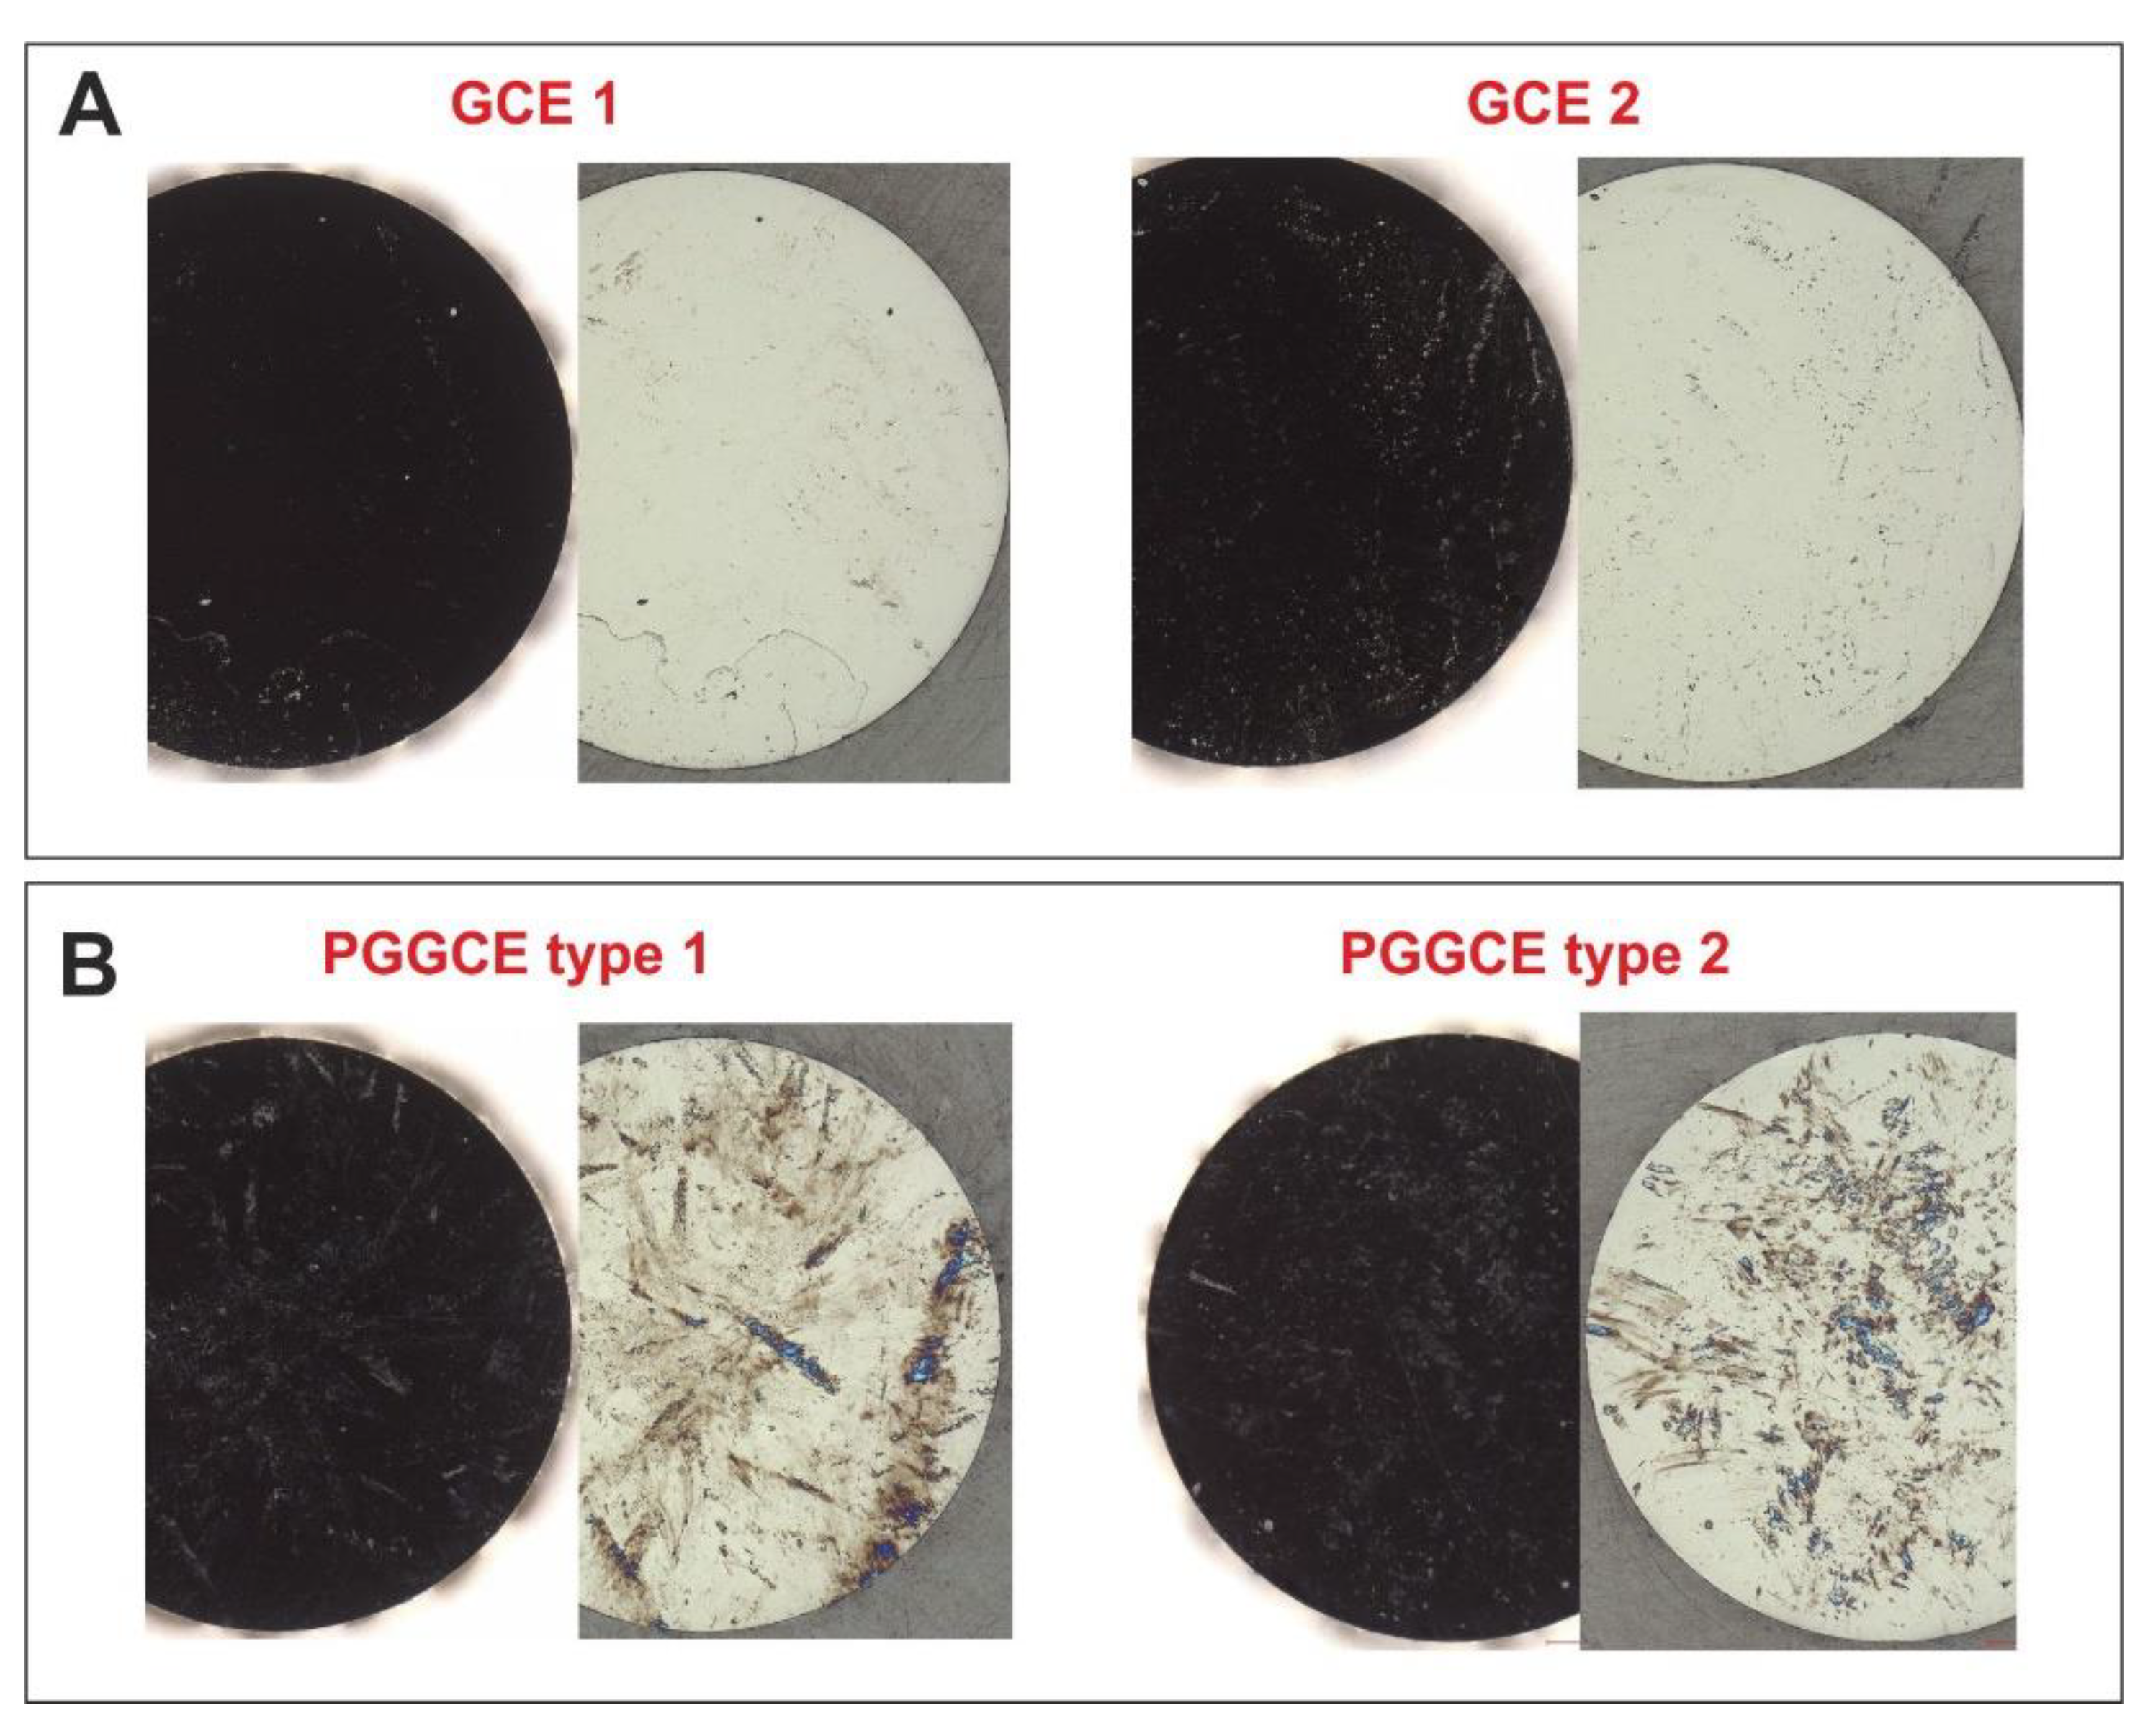
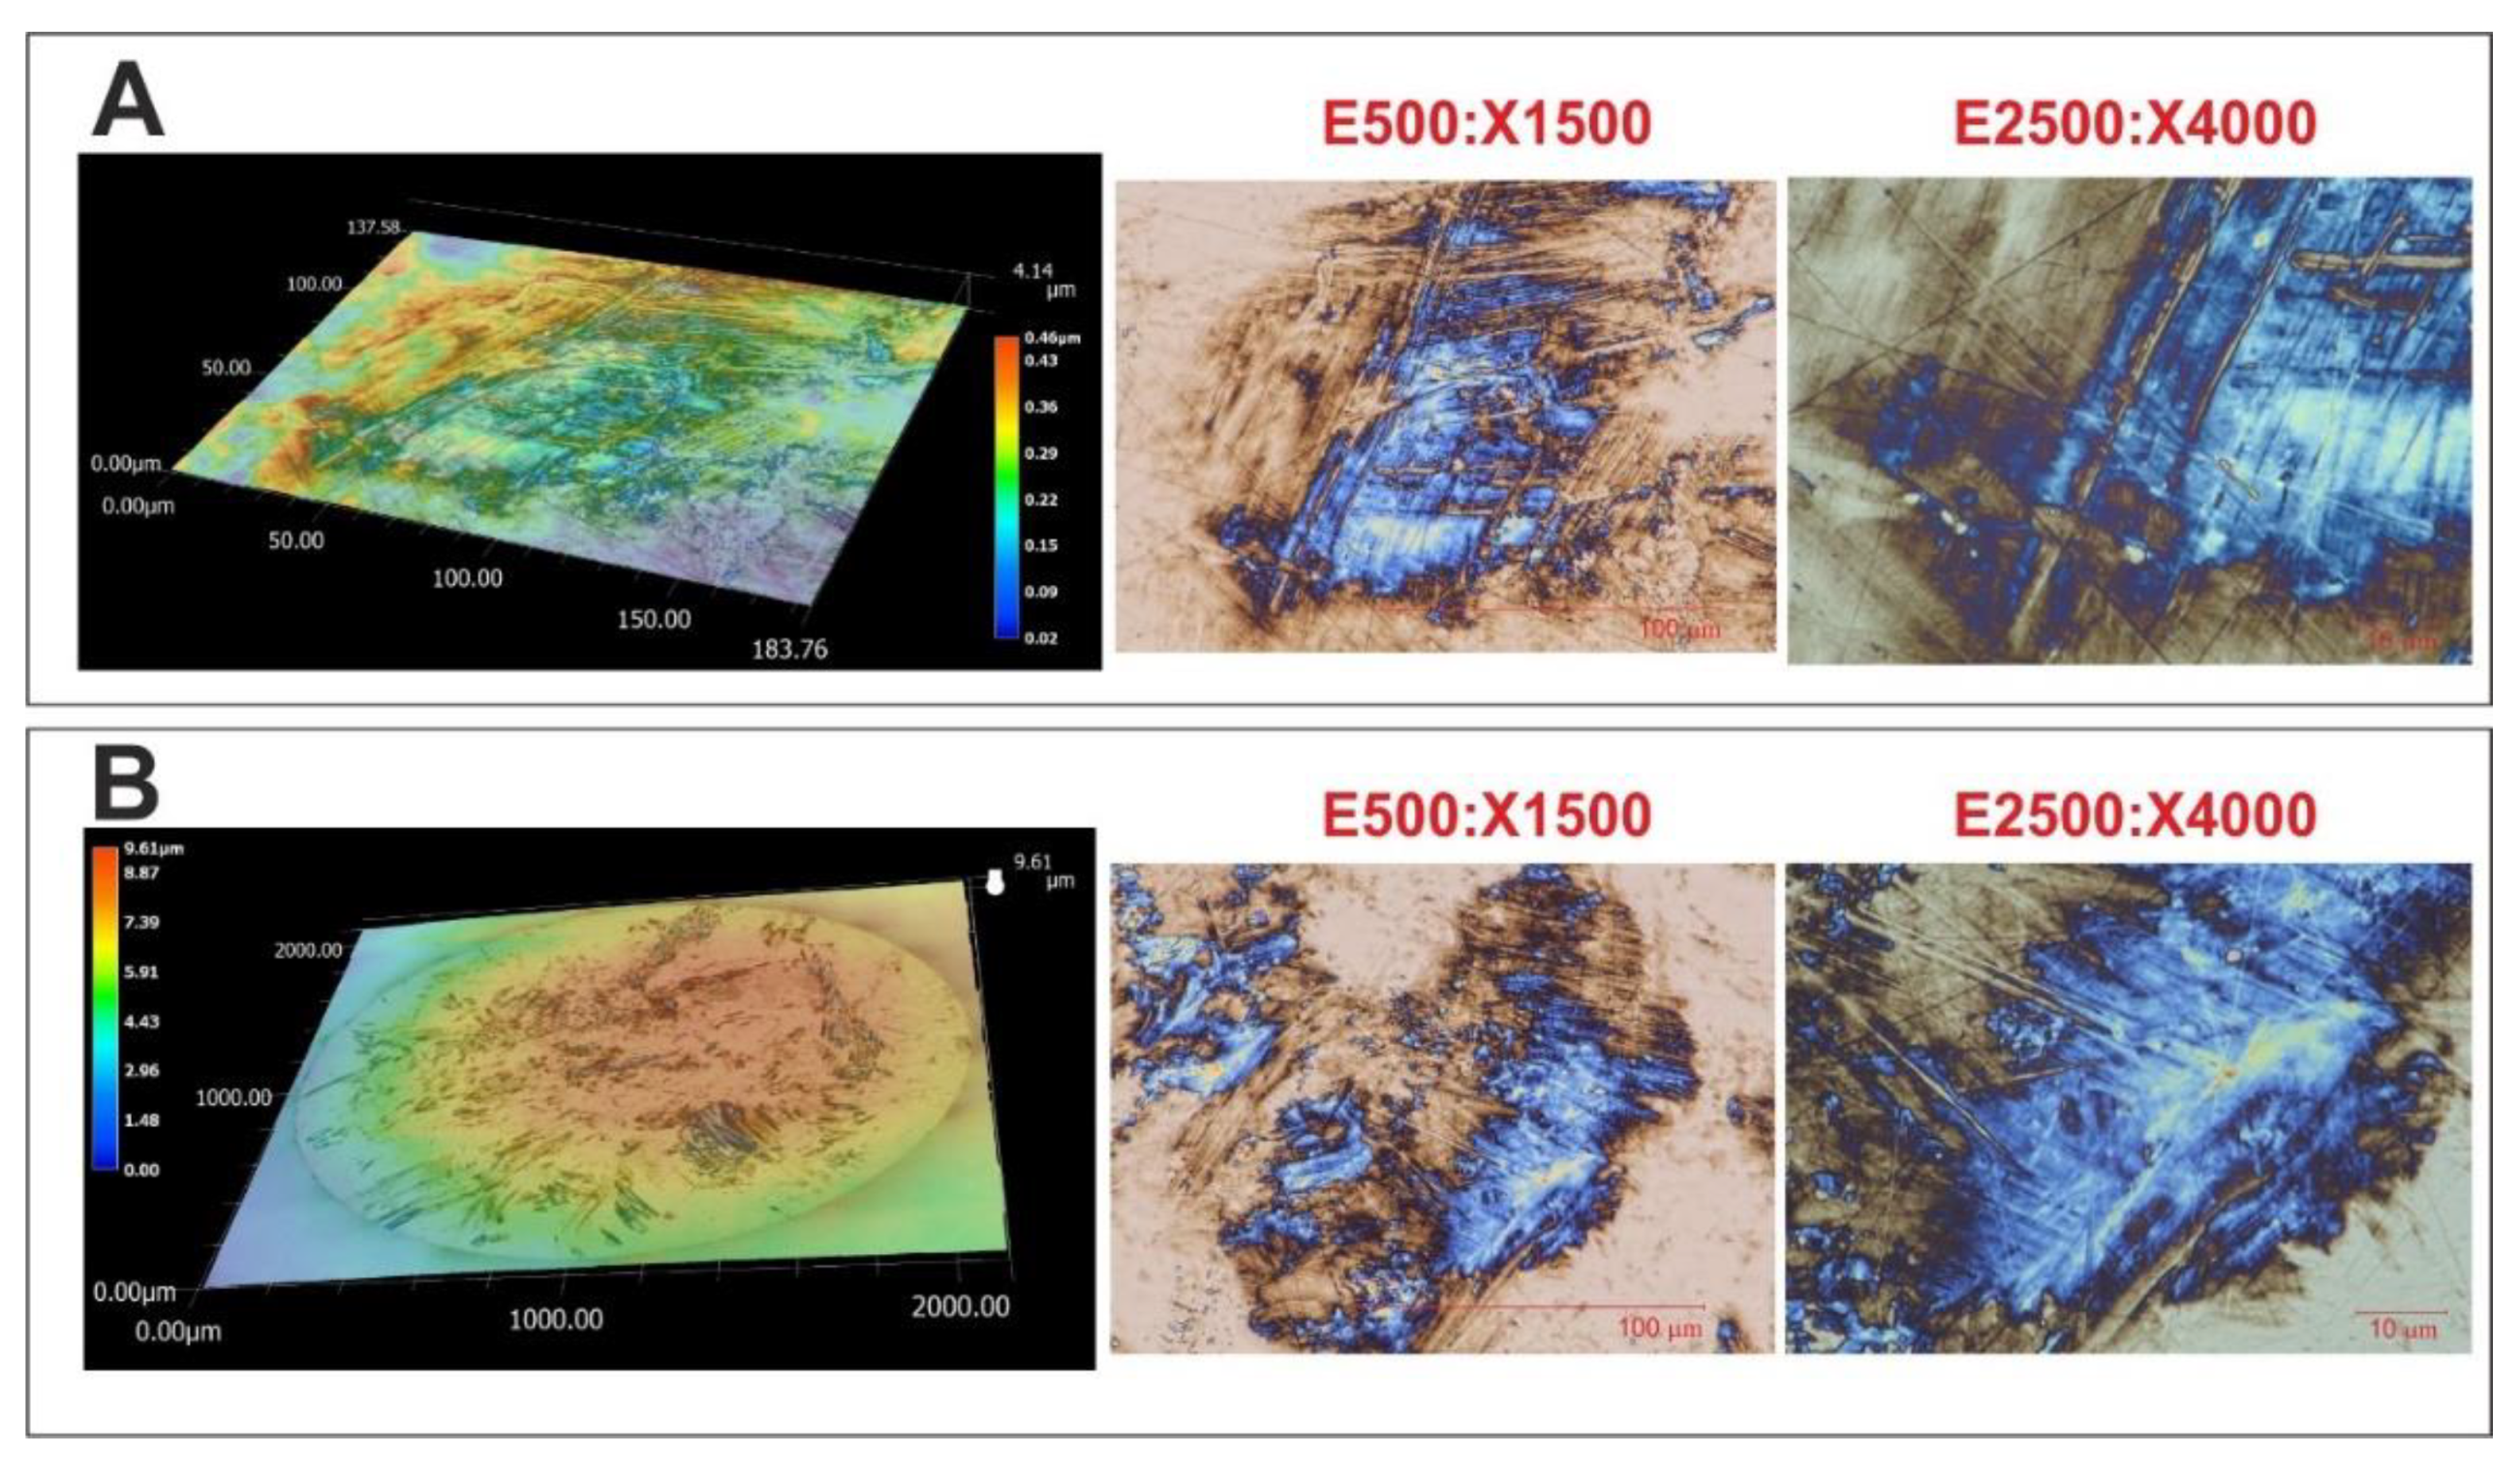
3.3. Structural Studies of Modified Electrodes

For complete characterization of the newly developed sensors, the thickness of the poly-amino acid layer deposited on each system was determined (surface changes were measured in the fixed and unchanged parts of the sensor in comparison to pure GCE at critical points; (Figure 5)). Thus, the morphological changes of the GCE surface were determined before and after electropolymerization of the selected type.
In the course of electropolymerization L-Gly observed in the voltammogram, a characteristic cathode peak (−0.3 V) was noticed, based on which it was possible to evaluate the course of modification, and thus the formation of the poly-L-glycine coating. In the initial phase, the potential increased its intensity, and then the graphs gradually overlapped each other. It should be noted that the overlapping of successive plots occurred at the latest when the GCE was modified with a 10 mM L-glycine solution. It can be concluded that, in the case of this electrode, the electrochemical polymerization process was the most effective, which was confirmed by photos taken with a 3D microscope.
The graphs for the electropolymerization of L-Alanine suggest that the modification of GCE by L-Ala should be conducted in the same way as for L-glycine (structural similarity). Unfortunately, studies using 3D microscopy do not reflect this fact. The changes to the electrode surface are slight.
The graph for electropolymerization with the L-Lys modifier shows two characteristic values of the cathode peak (−0.75 V), especially intense for PLGCE types 8 and 9, and anode peak (1.25 V). Photographs taken with the microscope show a slight modification of the electrode with 1 mM L-lysine solution. Much larger GCE areas were modified as a result of using 10 or 100 mM L-lysine solutions.
The obtained measurements showed that the formation of poly-L-amino acid coatings on the GCE occurred with the highest quantitative efficiency about the produced poly-forms on PGGCE-type electrodes. It was observed that PAGCEs and PLGCEs had a much smaller area covered by the coatings (Figures S6–S8 of Supplementary Materials).
The analysis of the electropolymerization results, which are presented in Table 2, clearly showed that the greatest surface changes occurred in GCE-poly-L-glycine systems (see Figure S9 of Supplementary Materials).
The data obtained by spatial imaging were much more reliable and provided more information on the modified GCEs, because they concerned the entire electrode, and not just selected points (Figure 6), and was carried out on electrodes that are practically not used so far in measurements. It should be noted that, in each of the electrodes, the area defined as “pure GCE” is on a different level—this may suggest that there was also a poly-L-amino acid film in this area. Therefore, it was decided to modify the analysis method by 3D imaging the entire electrode surface before making measurements on pyrazine derivatives—it was used for the measurements of universal electrodes, which will be discussed later.

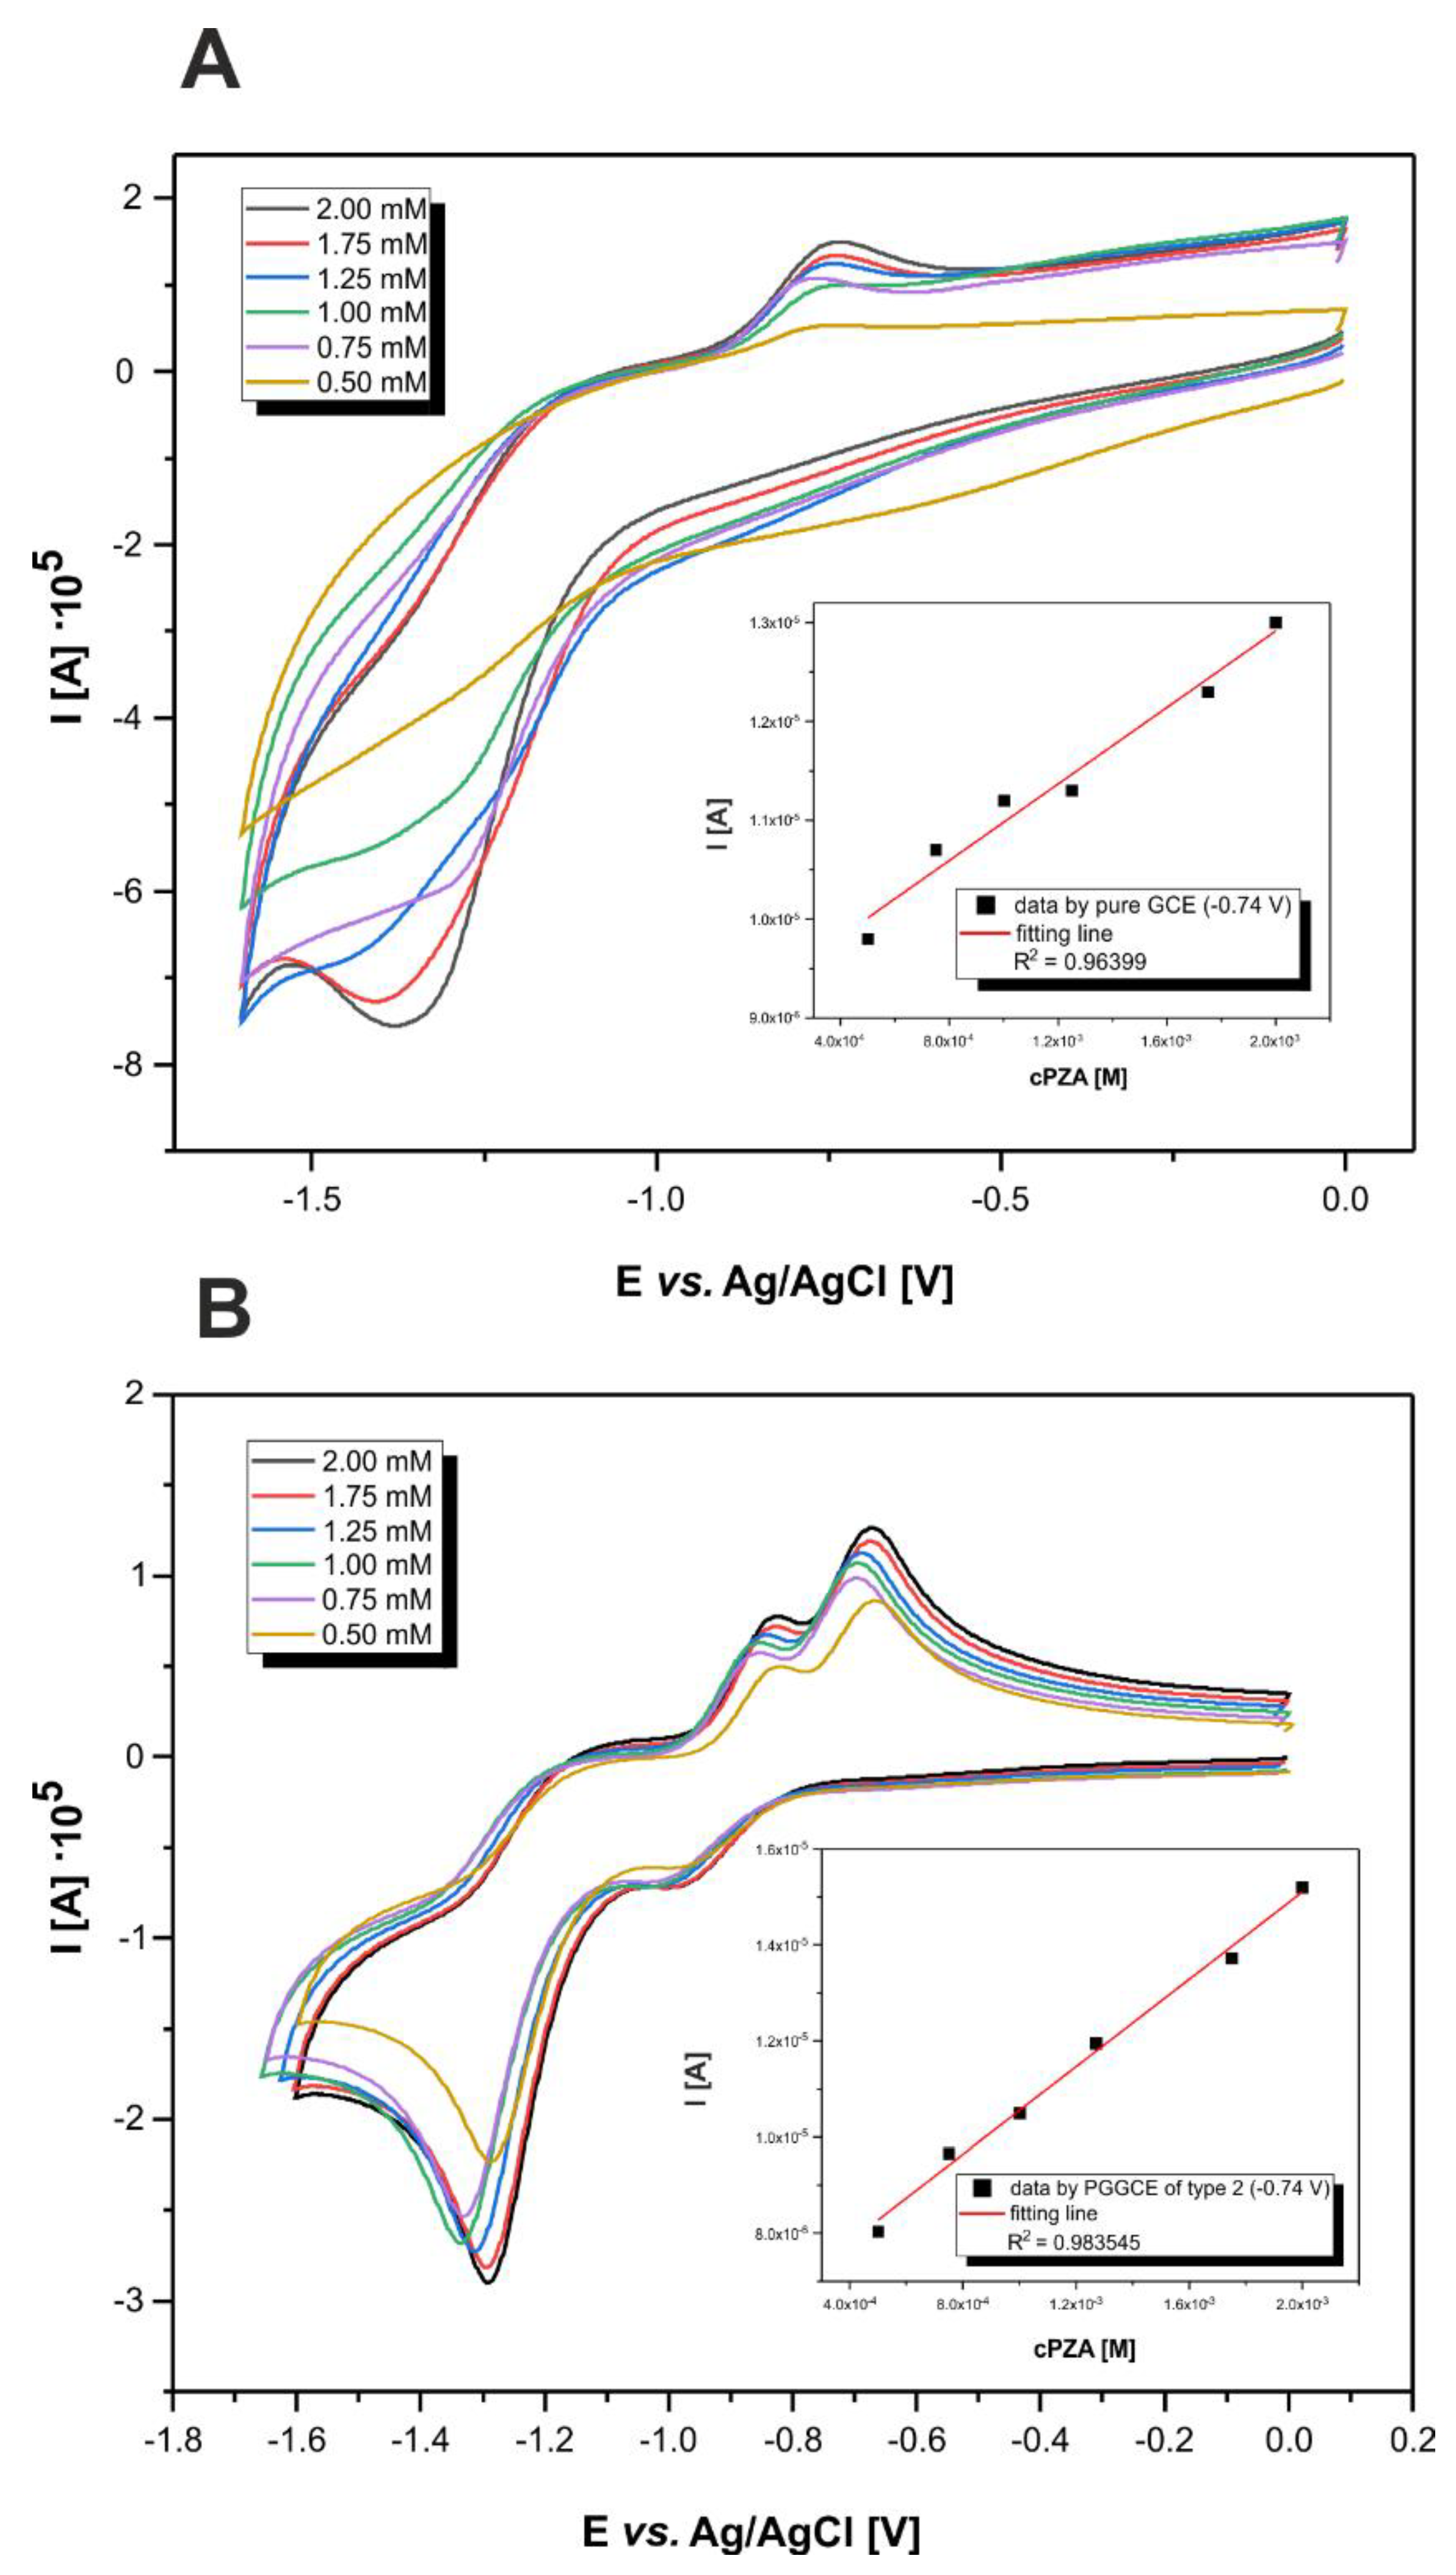
3.4. Analyses with the Use of Modified Electrodes

Measurements carried out for the 2.00 mM PZA solution indicated a significant increase in the intensity of the anode current peak obtained using all modified electrodes. This change is particularly evident for PLGCEs of types 7–9 (Figure S10 of Supplementary Materials). It is worth noting that there has been a shift in the position of this peak from −0.8 to −0.6 V. When the appearance of the new peaks of anode current (−0.90 V) was analyzed, the highest intensity was observed with the use of PGGCEs of types 1–3, and in the case of cathode current (−1.05 V) the greatest intensity measurements were obtained with the use of PLGCE and PGGCE of type 2. These are the additional identifying parameters for the analysis of the studied pharmaceuticals (Figure 7).
Measurements obtained for BZM using modified GCEs mainly showed an increase in the intensity of the anode peak signals. A significant increase in this parameter was noticed when PGGCEs of types 1 and 2 (Figure S11 of Supplementary Materials) were used. In addition, these electrodes were the only ones to provide more intense (type 1) or similar (type 2) cathode current compared to the values obtained with the unmodified electrode. The electrodes that showed very high sensitivity to BZM were PLGCE type 7 (intense anode peak), while the remaining sensors showed similar or less sensitivity compared to unmodified GCE. The deterioration of measurement parameters was particularly noticeable for PAGCEs.
The sensitivity of the modified GCEs for PTCA determination was dependent on the electrochemical process used for observation. When the intensity of the cathode current peaks was observed, a particular increase in sensitivity was noted for PAGCEs of types 4–6 (Figure S12 of Supplementary Materials). A reduction process in the intensity of the anode current peaks (−1.55 V) was observed in almost all cases where modified electrodes were used. Only type 2 of PGGCE showed a higher sensitivity for the measurement of this parameter. For the remaining electrodes, the anode current values were similar to those obtained with the unmodified electrodes.
Measurements obtained for 2.00 mM PAOX showed an increase in the sensitivity of the electrodes for measurement of cathode current intensity. A particular improvement insensitivity for the measurement of this parameter was noted for PAGCE, PGGCE, and type 9 of PLGCE (Figure S13 of Supplementary Materials). Additionally, a significant improvement in sensitivity for anode current measurements was noticed for types 2 and 3 of PGGCE as well as types 4 and 6 of PAGCE. Really important is the new parameter which showed during analyses by PGGCE 3—the anode peak (−0.75 V).
The conducted measurements suggest that the sensitivity of electrodes depends on the type of substance being analyzed and the electrochemical process.
The analyses showed that PGGCEs are the best electrodes for the detection of BZM and PZA (pharmaceuticals drugs; Figure 8), while PAGCEs and PGGCEs are the best for detecting PAOX and PTCA (chemical samples). It should also be noted that the greatest change in GCE surface morphology was observed after the use of 10 mM L-amino acid solutions.
Based on the results, two electrodes were selected for further structural and electrochemical analyses—PGGCE 1 and 2. They showed the highest sensitivity towards compounds with pyrazine motif, and the surfaces of these electrodes were largely covered with a poly-L-amino acid film.

3.5. Analyses with the Use of Re-Modified Electrodes

Detailed analyses at two PGGCE were aimed at selecting a universal electrode for measurements of pyrazine derivatives.
The previously used electrodes were cleaned and electropolymerization was carried out in an analogous manner. The voltammograms confirm that the technique of coating GCE with a poly-L-amino acid film is reproducible.
To re-evaluate the improvement of measuring parameters of modified electrodes, measurements were carried out on pharmaceutical preparations (no more measurements were carried out due to the need to submit the electrodes for morphological analysis). In both cases, the improvement of measurement parameters is noticeable, both in the case of cathode and anode peaks, but it is more significant in the case of using the electrode modified with 10 mM L-glycine.
A detailed analysis of the morphology of the layer formed by the polyforms was the last step in the selection of the universal electrode. Therefore, the layer thickness measurement technique was modified not only by measuring at a given point but also by a global analysis of the entire electrode. Measurements were made on the re-modified electrodes and cleaned electrodes from the first part of the measurements. Photographs of cleaned electrodes show quite a high efficiency of electrode cleaning by repeated polishing and cleaning in HCl and NaCl solutions. When carrying out the preliminary analysis of the modified electrodes, it should be noted that both electrodes have a very large area covered by polyforms, but the areas occupied by the electrode modified by the 10 mM solution are much more distinct.
The 3D modeling performed on re-modified electrodes (PGGCE 1 and PGGCE 2) provided detailed information on the thickness of the layers. This type of surface analysis revealed that PGGCE 2 had a much thicker layer of the film deposited on the electrode (the height difference at the highest point was as much as 9.61 µm, which was over two times greater compared to the type 1 electrode). These measurements are much more reliable and provide more information on the modified GCEs, as they were carried out on electrodes practically unused in measurements, and the measurements concerned the entire electrode, and not only selected points.
To determine the stability of the modified electrodes, the pyrazine derivatives were remeasured. This measurement was carried out a month from the modification date (Figure 9). During this time, about 50 measurements were made with these electrodes on different compounds. The obtained results were compared with the measurements taken with these electrodes at the beginning. It was noticed that the spent electrodes had an almost identical course of voltammogram as the unmodified electrodes. However, this did not seem to indicate the complete disappearance of the poly-L-amino acid film on the electrode surface, but the loss of the original properties of the electrode-by-electrode surface modification.
Detailed analysis of two types of PGGCE electrodes allowed definition of a universal electrode for measuring compounds with a pyrazine motif. The type 2 electrode showed much better parameters than the type 1 electrode, which allows it to be called a universal electrode. It shows greater sensitivity of measurements, visualized by the intensity of the cathode and anode peak, a larger surface of the electrode covered with polyform, and a much greater layer thickness of the poly-L-amino acid film deposited on the electrode. The final stage of the research was to test the linearity of the universal electrode. The obtained results were compared with the measurements for the unmodified electrode. Measurements were carried out on PZA solutions. The calibration curve was drawn based on the current value for the −0.74 V potential. The shape of the graphs suggests that the modified electrode has much better properties than the pure GCE—the graph has more characteristic points allowing for the analysis of this compound—they are intense even for a concentration of 0.5 mM, which allows us to hope for the possibility of conducting measurements at much lower concentrations. Additionally, the calibration curves show that the measurement with PGGCE type 2 is more linear. Looking also at the other characteristic points, it can be stated that the technique of measuring pyrazine derivatives with the use of a modified electrode is much more selective for compounds with the pyrazine motif.

4. Conclusions

The present study allowed the attainment of GCEs with new measurement properties, which was the main aim of this work. In the first phase, the optimal scanning speed (100 mV·s−1) of spectral areas for CV was determined, in terms of both qualitative and quantitative registration of the analyzed pyrazine derivatives as active substances of drugs (BZM, PZA) and chemical samples (PTCA, PAOX) with the use of all types of sensory systems.
New methodological solutions for conducting GCE electropolymerization processes using L-glycine, L-alanine, and L-lysine solutions with concentrations of 1, 10, and 100 mM were proposed. These processes were characterized by a longer duration compared to the procedures suggested in the literature (a smaller number of cycles), thanks to which complete electropolymerization was achieved.
Structural studies carried out using microscopic imaging allowed us to establish that the electrodes with a poly-L-glycine film had the highest percentage of the modified surface. In addition, the coating formed at this point by the polymer was the thickest, compared to the pure unmodified electrode. At further stages of the study, the technique was modified, which allowed the attainment of even more detailed information on the structure of the obtained sensors.
A comparative analysis, which was performed based on the results obtained under the same conditions of temperature and concentration of the GCE-modifying amino acid solution, clearly indicated that PGGCE type 2 can be considered as a universal sensor, and can be recommended for the quantification of structurally diverse pyrazine derivatives, in terms of both the demonstrated properties (conclusions were made based on the quantitative interpretation of the voltammograms obtained for PGGCE) and the height of the recorded signals (related to the current value). Moreover, its structure was the most modified by the poly-forms used in the study.
The results presented in this paper constitute the basis for the potential application of poly-L-glycine biosensors in clinical practice for the determination of substances containing a pyrazine scaffold. Techniques involving the use of these sensors are simple, reproducible, and relatively cheap, which could be of use in the analysis of unmetabolized-pyrazine drugs present in body fluids (e.g., urine).

Supplementary Materials

The following supporting information can be downloaded at: https://0-www-mdpi-com.brum.beds.ac.uk/article/10.3390/chemosensors10010024/s1, including: sample testing photos with the corresponding structures inside and concentrations (Figure S1); sensor surfaces as shown by microscopic 3D imaging (Figures S2–S4); plots of the potential vs. the square root of the scan rate for the pyrazine derivatives studied (Figure S5); microscopic imaging combined with the surface profiles of PAGCE, PGGCE, and PLGCE (Figures S6–S8); images in magnification of the largest modification by volume—poly-L-glycine coating produced on the GCE surface, showing increased efficiency and the sensitivity of detection (Figure S9); voltammograms of stoichiometric analyses of pyrazine-based drugs registered by the all sensors types prepared (Figures S10–S13).

Author Contributions

M.D.: writing original draft in part, formal analysis, measurements; A.M.D.: validation, methodology, writing—review, and editing; D.C.: microscopic imaging; M.M.: review and editing; A.C.: conceptualization, methodology, formal analysis, visualization, project administration, supervision, writing—original draft, review, and editing. All authors have read and agreed to the published version of the manuscript.

Funding

National Science Center (NCN) grant No. 2019/03/X/ST4/00038.

Institutional Review Board Statement

Not applicable.

Informed Consent Statement

Not applicable.

Acknowledgments

The authors thank the financial support from National Science Center (NCN) grant No. 2019/03/X/ST4/00038 and University of Gdańsk 531-T120-D846-21.

Conflicts of Interest

The authors declare no conflict of interest.

References

  1. Goh, Z.; Tee, J.K.; Ho, K.H. An Evaluation of the In Vitro Roles and Mechanisms of Silibinin in Reducing Pyrazinamide- and Isoniazid-Induces Hepatocellular Damage. Int. J. Mol. Sci. 2020, 21, 3714. [Google Scholar] [CrossRef]
  2. Ahmad, Z.; Makaya, N.H.; Grosset, J. History of Drug Discovery: Early Evaluation Studies and Lessons Learnt from Them. Antituber. Chemother. 2011, 40, 2–9. [Google Scholar]
  3. Zhang, Y.; Mitchison, D. The curious characteristics of pyrazinamide: A review. Int. J. Tuberc. Lung Dis. 2003, 7, 6–21. [Google Scholar]
  4. Ogryzek, M.; Chylewska, A.; Królicka, A.; Banasiuk, R.; Turecka, K.; Lesiak, D.; Nidzworski, D.; Makowski, M. Coordination chemistry of pyrazine derivatives analogues of PZA: Design, synthesis, characterization and biological activity. RSC Adv. 2016, 6, 64499–64512. [Google Scholar] [CrossRef] [Green Version]
  5. Yamamoto, S.; Toida, I.; Watanabe, N.; Ura, T. In Vitro Antimycobacterial Activities of Pyrazinamide Analogs. Antimicrob. Agents Chemother. 1995, 9, 2088–2091. [Google Scholar] [CrossRef] [PubMed] [Green Version]
  6. Chylewska, A.; Sikorski, A.; Ogryzek, M.; Makowski, M. Attractive S⋯π and π-π interactions in the pyrazine-2-thiocarboxamide structure: Experimental and computational studies in the context of crystal engineering and microbiological properties. J. Mol. Structure 2016, 1105, 96–104. [Google Scholar] [CrossRef]
  7. Głębocka, A.; Raczyńska, E.D.; Chylewska, A.; Makowski, M. Experimental (FT-IR) and theoretical (DFT) studies on prototropy and H-bond formation for pyrazine-2-amidoxime. J. Phys. Org. Chem. 2016, 29, 326–335. [Google Scholar] [CrossRef]
  8. Chylewska, A.; Ogryzek, M.; Głębocka, A.; Sikorski, A.; Turecka, K.; Raczyńska, E.D.; Makowski, M. Crystalline pyrazine-2-amidoxime isolated by diffusion method and its structural and behavioral analysis in the context of crystal engineering and microbiological activity. RSC Adv. 2016, 6, 64499–64512. [Google Scholar] [CrossRef] [Green Version]
  9. Colson, K.; Doss, D.S.; Swift, R.; Tariman, J. Bortezomib, a newly approved proteasome inhibitor for the treatment of multiple myeloma: Nursing implications. Clin. J. Oncol. Nurs. 2004, 8, 473–480. [Google Scholar] [CrossRef] [PubMed] [Green Version]
  10. Piechotta, V.; Jakob, T.; Langer, P.; Monsef, I.; Scheid, C.; Estcourt, L.J.; Ocheni, S.; Theurich, S.; Kuhr, K.; Scheckel, B.; et al. Multiple drug combinations of bortezomib, lenslidomide, and thalidomide for first- line treatment in adults with transplant- ineligible multiple myleoma: A network meta- analysis. Cochrane Database Syst. Rev. 2019, 25, 1–146. [Google Scholar]
  11. Chauhan, D.; Li, G.; Podar, K.; Hideshima, T.; Shringarpure, R.; Catley, L.; Mitsiades, C.; Munshi, N.; Tai, Y.T.; Suh, N.; et al. The bortezomib/proteasome inhibitor PS-341 and triterpenoid CDDO-Im induce synergistic anti–multiple myeloma (MM) activity and overcome bortezomib resistance. Blood 2004, 103, 3158–3166. [Google Scholar] [CrossRef] [PubMed] [Green Version]
  12. Adams, J.; Kauffman, M. Development of the Proteasome Inhibitor Velcade™ (Bortezomib). Canc. Investig. 2004, 22, 304–311. [Google Scholar] [CrossRef]
  13. Schaberg, T.; Rebhan, K.; Lode, H. Risk factors of side-effects of isoniazid, rifampin and pyrazinamide in patients hospitalized for pulmonary tuberculosis. Eur. Respir J. 1996, 9, 2026–2030. [Google Scholar] [CrossRef] [Green Version]
  14. Yee, D.; Valiquette, C.; Pelletier, M.; Parisien, I.; Rocher, I.; Menzies, D. Incidence of Serious Side Effects from First-Line Antituberculosis Drugs among Patients Treated for Active Tuberculosis. Am. J. Respir. Crit. Car. Med. 2001, 167, 1472–1477. [Google Scholar] [CrossRef]
  15. Kane, R.C.; Bross, P.F.; Farrell, A.T.; Pazdur, R. Velcade®: U.S. FDA Approval for the Treatment of Multiple Myeloma Progressing on Prior Therapy. Oncologist 2003, 8, 508–513. [Google Scholar] [CrossRef]
  16. Reece, D.E.; Sullivan, D.; Lonial, S.; Mohrbacher, A.F.; Chatta, G.; Shustik, C.; Stewart, A. Pharmacokinetic and pharmacodynamic study of two doses of bortezomib in patients with relapsed multiple myeloma. Canc. Chem. Pharm. 2010, 67, 57–67. [Google Scholar] [CrossRef] [Green Version]
  17. Mehashe, J. Managing and avoiding bortezomib toxicity. Comm. Oncol. 2007, 4, 480–484. [Google Scholar]
  18. Pasipanodya, J.G.; Gumbo, T. Clinical and Toxicodynamic Evidence that High-Dose Pyrazinamide Is Not More Hepatotoxic than the Low Doses Currently Used. Antim. Agents Chem. 2010, 54, 2847–2854. [Google Scholar] [CrossRef] [Green Version]
  19. Sandulescu, R.; Mirel, S.; Oprean, R. The development of spectrophotometric and electroanalytical methods for ascorbic acid and aminophen and their applications in the analyse od effervescent dosage forms. J. Pharm. Biomed. Anal. 2000, 23, 77–78. [Google Scholar] [CrossRef]
  20. Mani, S.; Cheemalapati, S.; Chen, S.M.; Devadas, B. Anti-tuberculosis Drug Pyrazinamide Determination at Multiwalled Carbon Nanotubes/Graphene Oxide Hybrid Composite Fabricated Electrode. Int. J. Electrochem. Sci. 2015, 10, 7049–7062. [Google Scholar]
  21. Mulyani, E.; Darmawan, E.; Perwitasari, D.A.; Mulyani, U.A.; Atthobari, J. Validation of pyrazinamide in human plasma using Hplc-Uv for therapeutic drug monitoring. AIP Conf. Proc. 2016, 1746, 20–31. [Google Scholar]
  22. Conte, J.E.; Lin, E.; Zurlinden, E. High- Performance Liquid Chromatographic Determination of Pyrazinamide in Human Plasma Bronchoalveolar LAvage Fluid, and Alveolar Cells. J. Chrom. Sci. 2000, 38, 33–37. [Google Scholar] [CrossRef] [Green Version]
  23. Liu, Y.; Wei, M.; Hu, Y.; Zhu, L.; Du, J. An electrochemical sensor based on molecularly imprinted polymer for determination of anticancer drug Mitoxantrone. Sens. Act. B 2018, 255, 544–551. [Google Scholar] [CrossRef]
  24. Ning, Y.N.; Xiao, B.L.; Niu, N.N.; Moosavi-Movahedi, A.A.; Hong, J. Glucose Oxidase Immobilized on a Functional Polymer Modified Glassy Carbon Electrode and Its Molecule Recognition of Glucose. Polymers 2019, 11, 115. [Google Scholar] [CrossRef] [PubMed] [Green Version]
  25. Bergamini, M.F.; Santos, D.P.; Zanoni, M.V.B. Determination of isoniazid in human urine using screen-printed carbon electrode modified with poly-L-histidine. Bioelectrochemistry 2010, 77, 133–138. [Google Scholar] [CrossRef]
  26. Vega, D.; Agüí, L.; González-Cortés, A.; Yáñez-Sedeño, P.; Pingarrón, J.M. Electrochemical detection of phenolic estrogenic compounds at carbon nanotube-modified electrodes. Talanta 2007, 71, 1031–1038. [Google Scholar] [CrossRef]
  27. Venkataprasad, G.; Reddy, T.M.; Shaikshavali, P.; Gopal, P.A. Novel Electrochemical Sensor Based on Multi-walled Carbon Nanotubes/Poly (L-Methionine) for the Investigation of 5-Nitroindazole: A Voltammetric Study. Anal. Chem. Lett. 2018, 8, 457–474. [Google Scholar] [CrossRef]
  28. Ojani, R.; Raoof, J.-B.; Maleki, A.A.; Safshekan, S. Simultaneous and sensitive detection of dopamine and uric acid using a poly(L-methionine)/gold nanoparticle-modified glassy carbon electrode. Chin. J. Cat. 2014, 35, 423–429. [Google Scholar] [CrossRef]
  29. Gomes, E.S.; Leite, F.R.F.; Ferraz, B.R.L.; Mourão, H.A.J.L.; Malagutti, A.R. Voltammetric sensor based on cobalt-poly(methionine)-modified glassy carbon electrode for determination of estriol hormone in pharmaceuticals and urine. J. Pharm. Anal. 2019, 9, 347–357. [Google Scholar] [CrossRef]
  30. Cheemalapati, S.; Devadas, B.; Chen, S.M. Highly sensitive and selective determination of pyrazinamide at poly-l-methionine/reduced graphene oxide modified electrode by differential pulse voltammetry in human blood plasma and urine samples. J. Coll. Int. Sci. 2014, 418, 132–139. [Google Scholar] [CrossRef]
  31. Devadas, B.; Cheemalapati, S.; Chen, S.M. Highly sensing graphene oxide/poly-arginine-modified electrode for the simultaneous electrochemical determination of buspirone, isoniazid and pyrazinamide drugs. Ionics 2015, 21, 547–555. [Google Scholar] [CrossRef]
  32. Cheemalapati, S.; Devadas, B.; Chen, S.M.; Ali, M.A.; Al- Hemaid, F.M.A. Electrochemical determination of selected antihypertensive and antituberculosis drugs at tyrosine modified electrode. Anal. Meth. 2014, 6, 6774–6782. [Google Scholar] [CrossRef]
  33. Curran, M.P.; McKeage, K. Bortezomib A Review of its Use in Patients with Multiple Myeloma. Drugs 2009, 69, 859–888. [Google Scholar] [CrossRef]
  34. Mabbott, G.A. An introduction to cyclic voltammetry. J. Chem. Educ. 1983, 60, 697–702. [Google Scholar] [CrossRef]
  35. Ferraz, B.R.L.; Leite, F.R.F. Malagutti, Highly sensitive electrocatalytic determination of pyrazinamide using a modified poly(glycine) glassy carbon electrode by square-wave voltammetry. J. Sol. State Electrochem. 2016, 20, 2509–2516. [Google Scholar] [CrossRef]
  36. Narayana, P.V.; Reddy, T.M.; Gopal, P.; Naidu, G.R. Electrochemical sensing of paracetamol and its simultaneous resolution in the presence of dopamine and folic acid at multi-walled carbon nanotubes/poly(glycine) composite modified electrode: A voltammetric study. Anal. Meth. 2014, 6, 9459–9468. [Google Scholar] [CrossRef]
  37. Li, Y.; Liu, J.; Song, G.; Li., K.; Zhang, K.; Ye, B. Sensitive voltammetric sensor for bergenin based on poly(l-lysine)/graphene modified glassy carbon electrode. Anal. Meth. 2013, 5, 3895–3902. [Google Scholar] [CrossRef]
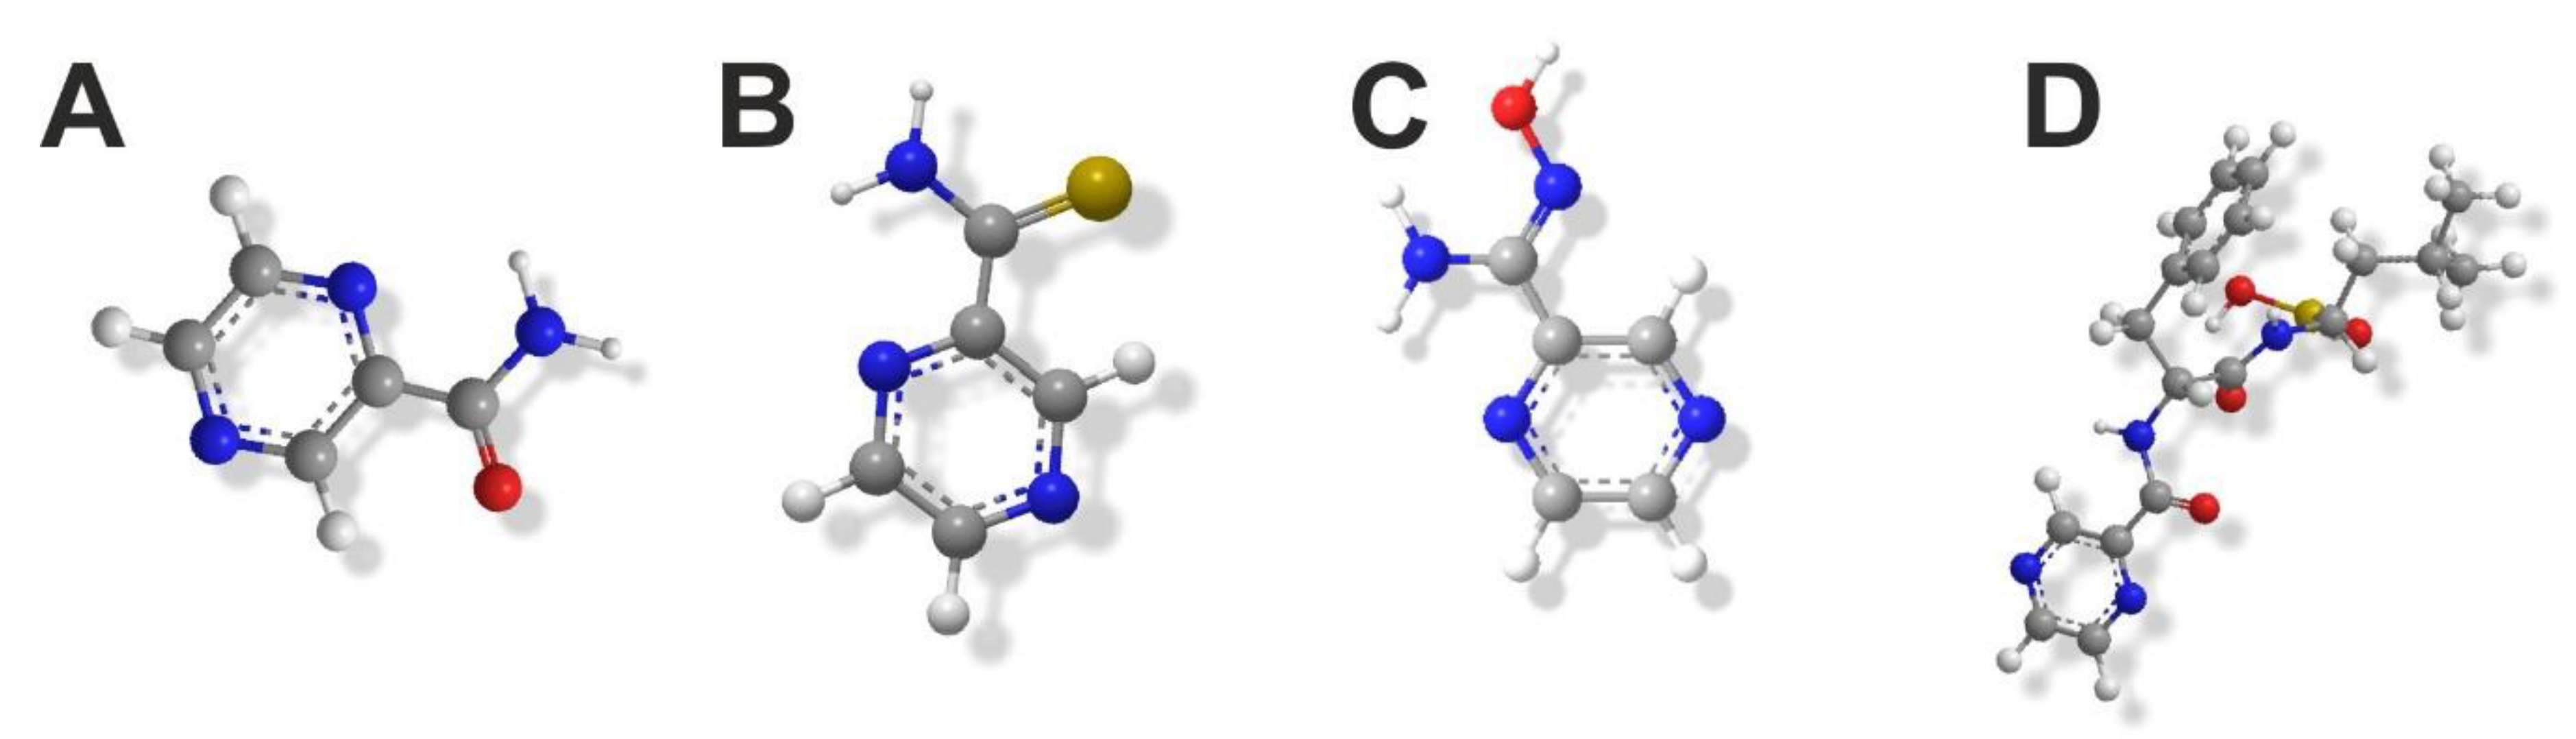
Figure 1. Analyzed structures of PZA as an antituberculosis drug (A); PTCA (B) and PAOX (C) as antifungals; BZM as an anticancer drug (D).
Chemosensors 10 00024 g001
Figure 2. The general mechanism of Amino acid L-isomer electropolymerization on GCE surface.
Chemosensors 10 00024 g002
Figure 3. Modifications of GC electrodes: PGGCE (types 1–3), PAGCE (types 4–6), PLGCE (types 7–9).
Chemosensors 10 00024 g003
Figure 4. Voltamograms of selected pyrazine derivatives made at different scanning rates of CV signals registered by using pure GCE for: 1.25 mM BZM solution (A); 2.00 mM PZA (B), PTCA (C), PAOX (D) solutions.
Chemosensors 10 00024 g004
Figure 5. Microscopic imaging of GCEs’ pure surfaces (A) compiled with PGGCE types 1 and 2 sensors (B). Imaging was performed with the E100: ×100 lens and with bright (coaxial) and dark field (ring light) illumination.
Chemosensors 10 00024 g005
Figure 6. Microscopic 3D models of the surfaces with poly-L-glycine coatings: PGGCE type 1 (A)—layer thickness 4.14 µm; PGGCE type 2 (B)—layer thickness 9.61 µm.
Chemosensors 10 00024 g006
Figure 7. Comparison of voltammograms (CV) and linearities for PZA stoichiometric detections using pure GCE (A) and modified PGGCE type 2 (B).
Chemosensors 10 00024 g007
Figure 8. The images illustrating the blue surface modification of the universal PGGCE sensors were performed with an E500: ×1500 lens to stoichiometric detection of pyrazine drugs (PZA and BZM).
Chemosensors 10 00024 g008
Figure 9. Cyclic voltammograms registered by PGGCEs sensors data to prove their stability (freshly prepared sensors as well as after one month since the modification) in analyses of solutions (NaClO4): 1.25 mM of BZM (A), 2.00 mM of: PZA (B), PTCA (C), PAOX (D).
Chemosensors 10 00024 g009
Table 1. The range of measuring potentials and the values of the potentials for the occurrence of the characteristic peak observed in CV’s for individual pyrazine derivative solution by unmodified GCE.
CompoundPotentials Range (V)Cathode Peak Potential (V)Anode Peak Potential (V)
BZM−1.60 ÷ 1.20−1.33−0.71
PZA−1.60 ÷ 0.00−1.32−0.77
PTCA−1.90 ÷ 1.80−1.13
−1.71
1.53
−0.87
PAOX−1.90 ÷ 1.90−1.36
−1.78
0.36
0.86
−0.31
−0.97
Table 2. The thickness of poly-amino acid coatings on the GCE surface calculated based on microscopic measurements of pure GCE and modified electrodes profiles. The calculation was made by the complete stoichiometric analyses of pyrazine-based drugs.
PGGCEPAGCEPLGCE
Type 1Type 2Type 3Type 4Type 5Type 6Type 7Type 8Type 9
Modified GCE
(μm)
3.153.873.753.237.904.356.374.322.65
Clean GCE
(μm)
1.011.281.591.355.912.214.592.241.33
Thickness
of coating (μm)
2.142.592.161.881.992.141.782.081.32
Publisher’s Note: MDPI stays neutral with regard to jurisdictional claims in published maps and institutional affiliations.

