
Effect of Channel Radius on Fluorescent Nanoparticle Based Molecular Communication


1
Department of Chemical Sciences, Università degli Studi di Catania, Viale A. Doria 6, 95125 Catania, Italy
2
Consorzio per lo Sviluppo dei Sistemi a Grande Interfase, CSGI, Viale A. Doria 6, 95125 Catania, Italy
*
Author to whom correspondence should be addressed.
Chemosensors 2022, 10(1), 29; https://0-doi-org.brum.beds.ac.uk/10.3390/chemosensors10010029
Submission received: 24 December 2021
/
Revised: 4 January 2022
/
Accepted: 10 January 2022
/
Published: 11 January 2022
(This article belongs to the Special Issue Low-Cost Chemo/Bio-Sensors Based on Nanomaterials)
Abstract
:The effect of the communication channel size on the transport and subsequent detection of chemical messengers is investigated on millimetric and micrometric channels. The transport of the information carriers, being characterized by an advective and a diffusive contribution, was simulated by varying the flow velocity and the diffusion coefficient. Then, to evaluate the information quality, the Intersymbol Interference (ISI) between two consecutive signals at a specific release delay was estimated. This allowed us to verify that operating under micrometric channel conditions has a larger flow velocity range to obtain completely separated successive signals and smaller release delays can be used between signals. The theoretical results were confirmed by developing a prototype molecular communication platform operating under microfluidic conditions, which enables communication through fluorescent nanoparticles, namely Carbon Quantum Dots (CQDs).
1. Introduction
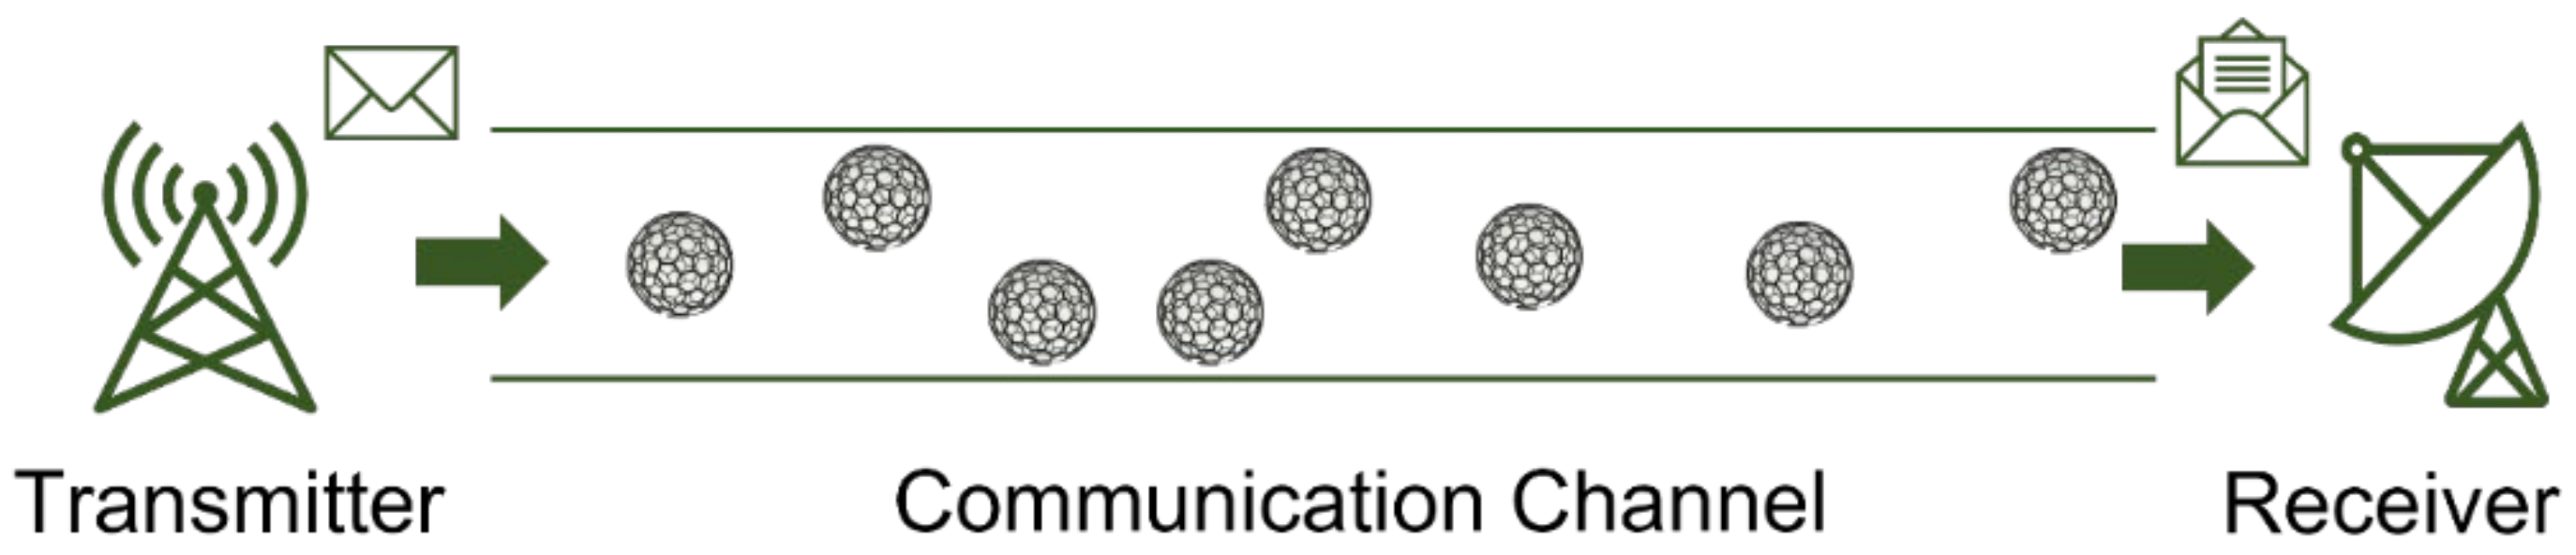
Nowadays, one of the technological fields in which there is the greatest rush of scientific research is communications. Once we have made society hyper-connected thanks to the advent of 5G, a branch of communications research is aspiring to solve a very different problem, namely communication in environments where information cannot be transferred by electromagnetic waves. There are essentially two reasons why communication cannot take place by means of electromagnetic waves: the first is when there are barriers or obstacles that physically impede the propagation of the wave [1]. The second concerns the possible harmful consequences of the waves propagating in a given environment, for example in close contact with or buried within biological systems [2]. An alternative approach to transporting information by electromagnetic waves [3] was theorized more than a decade ago and is based on the use of chemical information carriers (ICs), for example molecules or particles [4]. This artificial chemical communication is known in the scientific community as Molecular Communication (MoCo) [5,6,7]. Molecular Communication, although conceived in recent times, refers to and imitates chemical and biological mechanisms that have always existed and that nature has perfected to allow communication between living species of any order of complexity, but also to regulate biological cycles and allow the development of life itself [8,9]. It is, in fact, a bio-inspired approach. In order to reproduce this mechanism, we need a platform with three main components, as in traditional communication systems: a transmitter, a communication channel, and a receiver [10]. The transmitter can encode the message and release a small number of information carriers; these will propagate through the communication channel which, in most cases, consists of a liquid or gaseous medium. At the end of their journey within the communication channel, the ICs will encounter the receiver, which allows the detection and subsequent decoding of the message. A representative scheme of this mechanism can be seen in Figure 1.
An artificial system for molecular communication, if properly designed and optimized, allows the implementation of sophisticated applications from which the high potential of this communication technique can be seen. For example, a prototypal molecular Internet of Things (IoT) network can be realized, in which different molecular messengers travel from a central source to multiple receivers and they are capable of selectively triggering three distinct actuators upon the change of three distinct environmental parameters [11]. Furthermore, an efficient prototypal high information density MoCo platform can be realized, exploiting the molecular communication approach to transmit infection-induced temperature variations via biological fluids [12].
Depending on the distances covered by the messengers from the transmitter to the receiver, but above all, on the intrinsic size of the communication channel, molecular communication can be classified into macro-molecular communication (Macro-MoCo) [13], micro-molecular communication (Micro-MoCo) [14], and nano-molecular communication (Nano-MoCo) [15]. Based on the different channel size, the contexts in which molecular communication would find an application also change [16]. Environments where Macro-MoCo can be applied are underground or underwater, which are strategic for the well-being of cities or for the improvement of agricultural systems. Practical examples are sewerage and water distribution systems in cities, or channels for sub-irrigation, sub-fertilization, and sub-treatment in agriculture. However, Macro-MoCo could also benefit all those companies and industries characterized by the presence of extensive and complex steel structures that prevent the propagation of waves and therefore make wireless communication almost impossible [17]. Micro-MoCo is increasingly used in biological contexts and in the medical study of new and sophisticated methods of monitoring vital parameters for the treatment or prevention of certain diseases [18]. From a more general point of view, it is a type of communication that would take place by means of the micrometer-sized blood vessels and capillaries in animals. For medical purposes, the optimum would be for two or more bio-implanted devices to communicate [19], at least one of which allows the reading of the variation of a strategic parameter and the release of information carriers. The latter, through the biological fluids, will go to the second device, which allows the decoding of the message and the subsequent dosage of the drug useful in preventing or treating the disease [12]. There are also other biological contexts in which complex vascular systems can be exploited, in addition to the human one. This is the example of plants, which are also characterized by channels that allow the transport of vital lymph, and which are classified into xylem channels and phloem channels. The xylem channels allow the transport of water and minerals, while the phloem channels transport the products of the photosynthesis process that takes place in the leaves [20,21]. Then, there is a type of molecular communication that happens at the nanoscale typical of intracellular biochemical phenomena [22].
Here, we propose a study, first theoretical and then experimental, which aims to highlight the differences and possible limitations of transporting information carriers by an aqueous fluid in Macro-MoCo occurring through communication channels having micrometric or millimetric diameters. Different channel diameters mean transporting the ICs under different fluidic phenomena. What we have investigated is the presence or absence of a peculiar fluid dynamic phenomenon well-known in the literature as Taylor Diffusion. This mechanism can be observed whenever a fluid is transported along a channel of cylindrical section under Poiseuille laminar conditions [23]. Poiseuille’s Law is given by Equation (1):
where v is the velocity, ΔP is the pressure difference imposed between the two ends, η is the fluid viscosity, and L is the channel length. The equation implies that the velocity of the fluid decreases radially from a maximum vmax at the center of the cylinder (r = 0) to a minimum vmin at the walls of the cylinder (r = R). This condition gives the axial spreading of the fluid, namely advection. Under advection, a plug of solute transported by the flow will assume a typical arrow-shaped profile due to the laminar flow. Regions of concentration gradient will develop at the front and back ends of the solute plug, causing a radial diffusion. This radial diffusion is called Taylor Diffusion, named after the first scientist to study the phenomenon [24], of which the role is to limit the axial spreading due to advection, slowing down the anterior end and speeding up the posterior end of the solute. The total effect of the combination of the two contributes, advection and radial diffusion, respectively, is to develop a strongly symmetrical concentration distribution of the solute during its journey [25]. This results in an expected signal to the receiver placed at a distance L from the transmitter characterized by a Gaussian distribution. Thus, the solute concentration at different values of t is approximately given by Equation (2),
where C0 is the initial solute concentration and is the variance.
The greater the diffusion coefficient of the transported substance, the greater the effect of Taylor Diffusion. The diffusion coefficient can be estimated according to the Stokes–Einstein equation,
where kB is the Boltzmann constant, T is the temperature, rh is the hydrodynamic radius of the solute, in our case the information carriers, and η is the fluid viscosity.
For the first time, we explored two different conditions regarding the transport of the ICs in molecular communication: the first one, occurring in the millimetric channel (mChannel), in which the Taylor regime cannot be observed, and the second one, in the micrometric channel (µChannel), affected by the Taylor regime. To analyze the two cases, one parameter we have assessed is the Intersymbol Interference (ISI), which is a key variable in optimizing molecular communication [26,27].
First, we numerically solve simulations concerning the transport of the ICs. Simulations allow us to study the phenomenon from a theoretical point of view, but also to find the best conditions for our purposes by avoiding many experiments. Knowing that the decoding of the message by the receiver is based on the counting of the information carriers arriving at the receiver itself, and therefore on the detection of their concentration [28], the transport of the ICs is studied by numerically solving the Advection Diffusion Equation (ADE),
where C is the concentration value of the information carriers, DIC is their diffusion coefficient, and v is the term representing the velocity field along the transport channel. For our purposes, we simulated the transport of the messengers considering different velocity flow values, diffusion coefficients, and channel diameters. To evaluate ISI effects, we simulated the sending of two consecutive bits with a specific release delay between one and the other. Then, we assembled a prototypal platform, and we undertook an experimental campaign to validate the theoretical results. To carry out a typical MoCo experiment, we had to choose opportune information carriers. We employed fluorescent nanoparticles as information carriers, the well-known Carbon Quantum Dots (CQDs) [29,30]. CQDs meet several requirements: they are very easy to prepare, starting with common and inexpensive precursors, such as citric acid, and using fast synthesis methods, such as thermal degradation [31]. Due to the functional groups formed on the surface, such as hydroxyl and carboxyl, CQDs disperse well in water and aqueous solvents [32]. This makes it possible to avoid the use of organic solvents and to potentially disperse them in biological fluids. Unlike traditional quantum dots, such as those derived from binary compounds (lead sulfide, lead selenide, cadmium selenide, and cadmium sulfide), CQDs are non-toxic and have shown zero cytotoxicity in several papers [33]. This property allows them wide use in biological applications. Finally, when illuminated with a suitable electromagnetic radiation, usually around 370 nm, they show an intense and modulable fluorescence [34] with which we are able to selectively detect them through the receiver.
2. Materials and Methods
Simulations have been performed by the authors using Python programming language and its useful numerical algebra library named NUMPY and the finite volume partial differential equations solver named FiPy. Graph resulting from simulations were prepared using the Matplotlib library.
The Carbon Quantum Dots used in this work were prepared from citric acid (Merck, Rome, Italy), using the pyrolysis method. A quantity of about 10 g of citric acid is weighed and placed inside a beaker on a heating plate at a temperature between 200 and 250 °C. This pyrolysis process produces a dark brown caramel after 10 to 15 min. This is cooled to room temperature, and then a 0.2 M NaOH solution (Merck, Rome, Italy) is added to it until a neutral pH is reached. The resulting suspension is subjected to membrane dialysis (Membra-Cel MC18 with a molecular weight cut-off of 11,000 Daltons) to remove all water-soluble pyrolysis residues and by-products. Dialysis is continued, periodically changing the water, until non-fluorescent dialysis water is obtained (typically after 2 days). Finally, a cryo-centrifugation step is carried out for 1 h at 6000 rpm and 3 °C. The supernatant is recovered and subjected to subsequent characterization and MoCo experiments. The typical concentration of the ‘as prepared’ solution is around 2 mg/mL. For characterization of CDs and related instrumentation, see article [35].
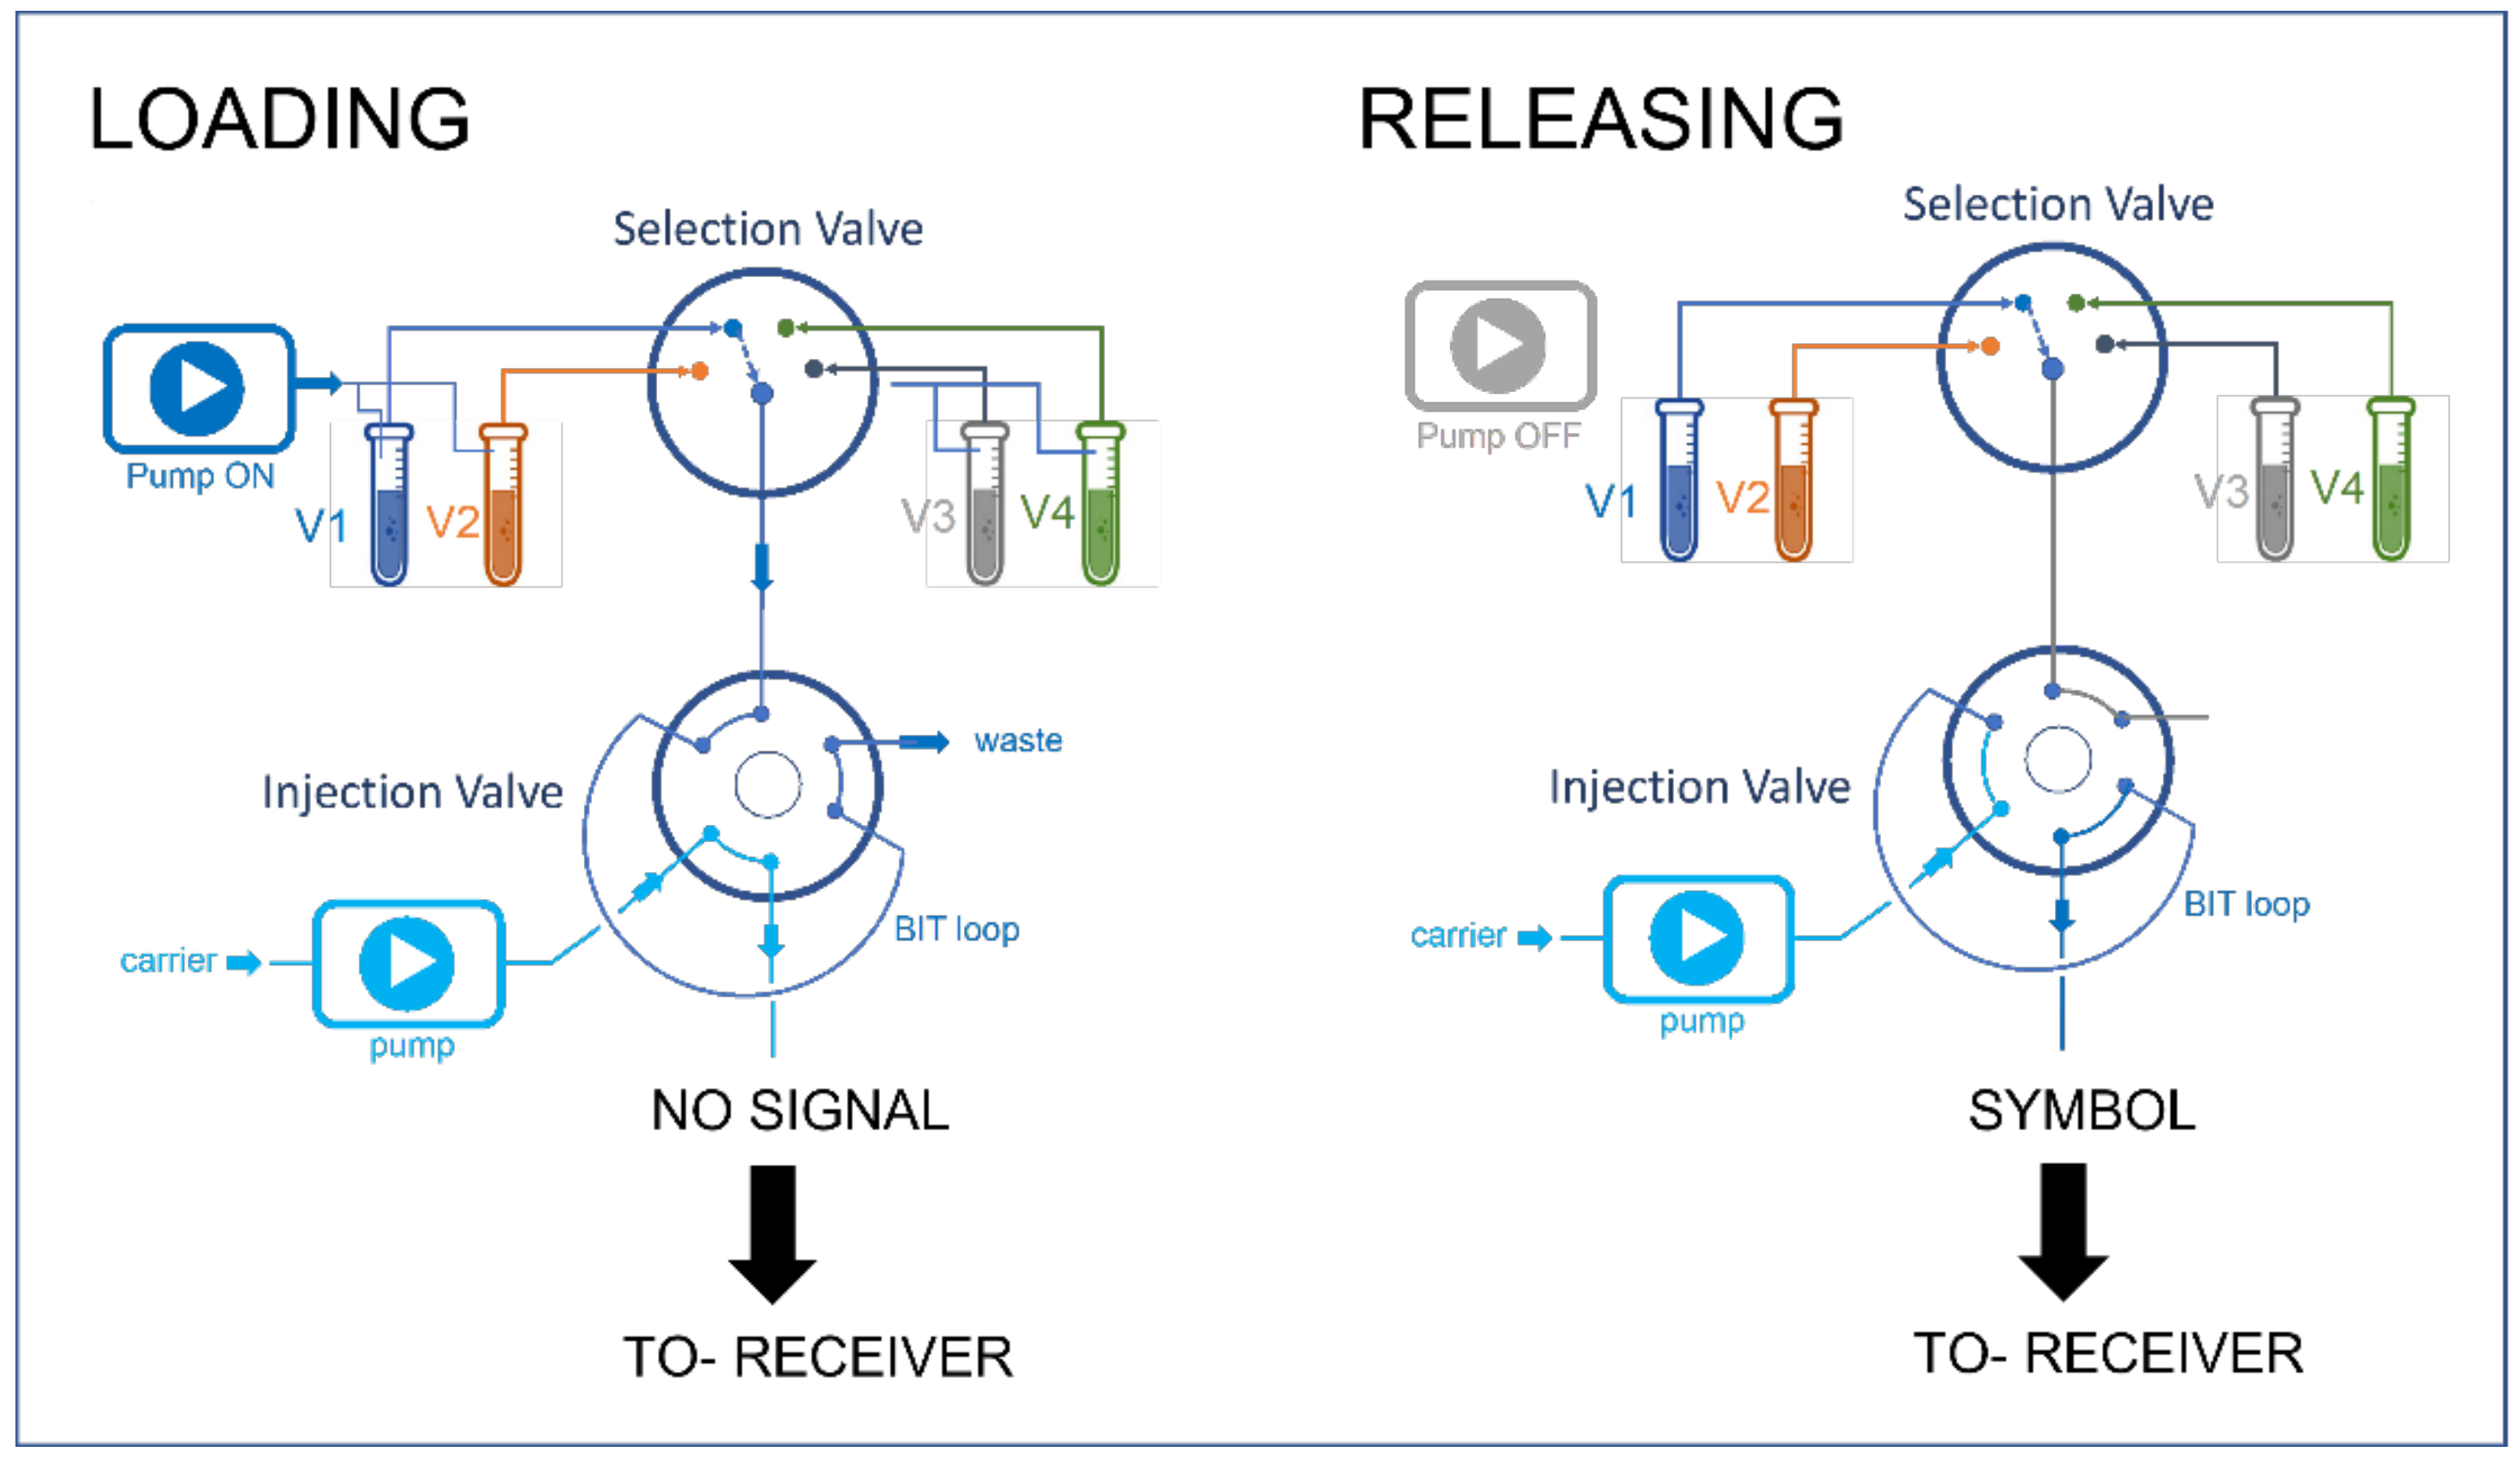
The prototype platform we assembled to conduct molecular communication experiments consists of three main components, namely a transmitter, a communication channel, and a receiver. The transmitter consists of an infusion pump (IVAC P3000) on which is fitted a 10 mL syringe filled with the carrier fluid, a six-way injection valve, and a selection valve (both valves from Rheodyne, IDEX Health & Science). The injection valve has two positions called load and inject. The load position allows information carriers loading into the loop, which is of 20 μL in our prototype (Loading step). The information carriers in the loop are transported to the receiver by the carrier from the infusion pump when the valve moves to the inject position (Releasing step). The selection valve can shift between ten positions, each of which can be linked to a different sample. By applying an overpressure of nitrogen in the selected sample tube, the loop of the injection valve can be filled via a channel connecting the two valves (Pump ON). The schematic representation of the coordinated work of the two valves during the loading and releasing processes is available in Figure 2.
A microfluidic communication channel was used, having diameter of 750 µm (PTFE tube ID 1/32″ OD 1/16″) and a length of 30 cm. We used a fluorescence detector (Shimadzu, rf535) as a receiver, setting it at 365 nm excitation and 450 nm emission. Carrier solutions and CQDs suspensions having different viscosity were prepared by mixing water (ultrapure filtered, Millipore Merck, Rome, Italy) and glycerol (Merck, Rome, Italy) until the desired viscosity was achieved. The viscosity was measured with a viscometer tube (Cannon-Fenske, ASTM D446).
3. Results
The modulation method we considered to realize simulations and experiments is the “On-Off Keying” modulation (OOK), which is a particular case of the “Concentration Shift Keying” (CSK) [36]. For the CSK, information can be encoded according to the transmitter concentration of information carriers. With this modulation, it is possible to transfer information in binary code, encoding the signal 1-bit by releasing ICs with a concentration above a predetermined threshold and 0-bit if lower. Usually, a concentration threshold can be defined as the minimum limit of detection (LOD) of the detector used as a receiver, or just above the limit of interference-generated noise. A simpler case is represented by OOK [37], where there is not any concentration threshold, thus 1-bit is given by an IC concentration sent from the transmitter different from zero (CICs ≠ 0), and 0-bit is achieved when the transmitter does not release ICs (CICs = 0).
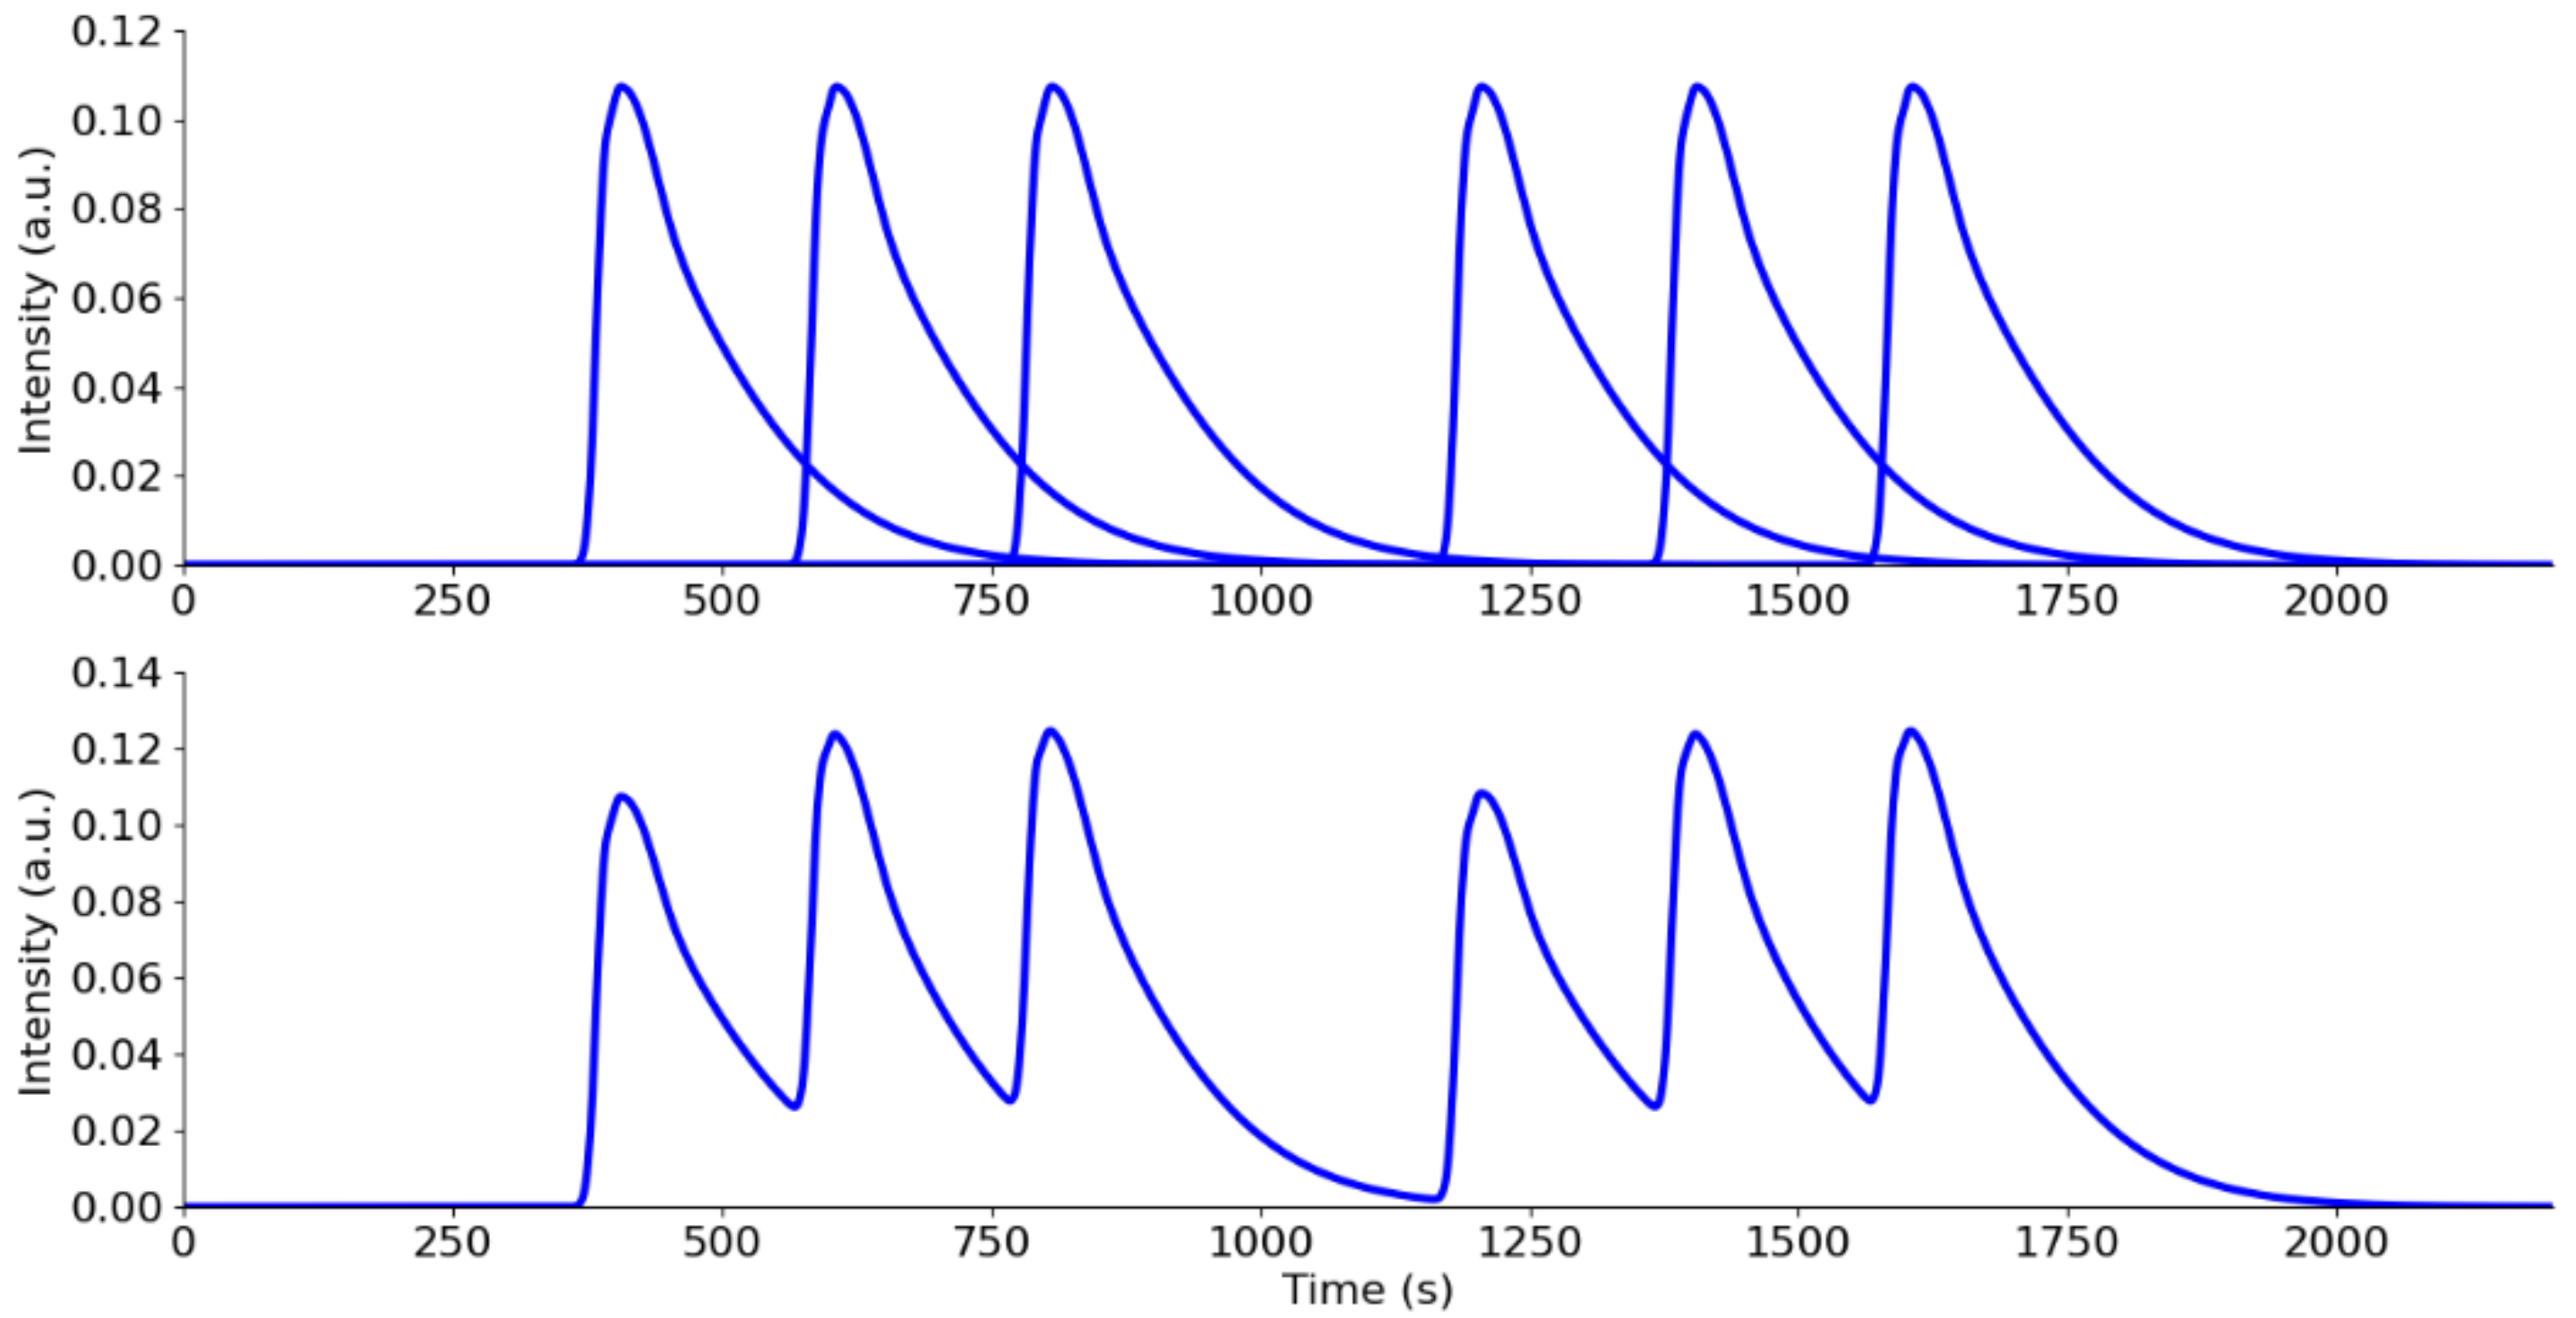
Considering the OOK modulation method, ISI occurs when two neighboring signals in sequence present a certain degree of overlap, causing an error in reading the symbol attributed to those signals if the aspect ratio is lower than the detector sensitivity. To better understand the phenomenon, we report an illustrative example in Figure 3. It represents a simulated sequence of eight consecutive bits (solving Equation (4)), binary encoded, sent with a delay of 200 s from each other. The sequence is 01110111, where 1-bit is given by the presence of the signal (in a realistic case, this means a non-zero concentration of the information carried read by the receiver), and 0-bit is given by the absence of the signal (concentration of the information carries equal to zero). Sequence 01110111 gives “w” letter in ASCII language. The difference between the upper sequence is very clear, proving what the signals should look like without ISI, and the bottom sequence where ISI occurs and the overlap between signals can be observed.
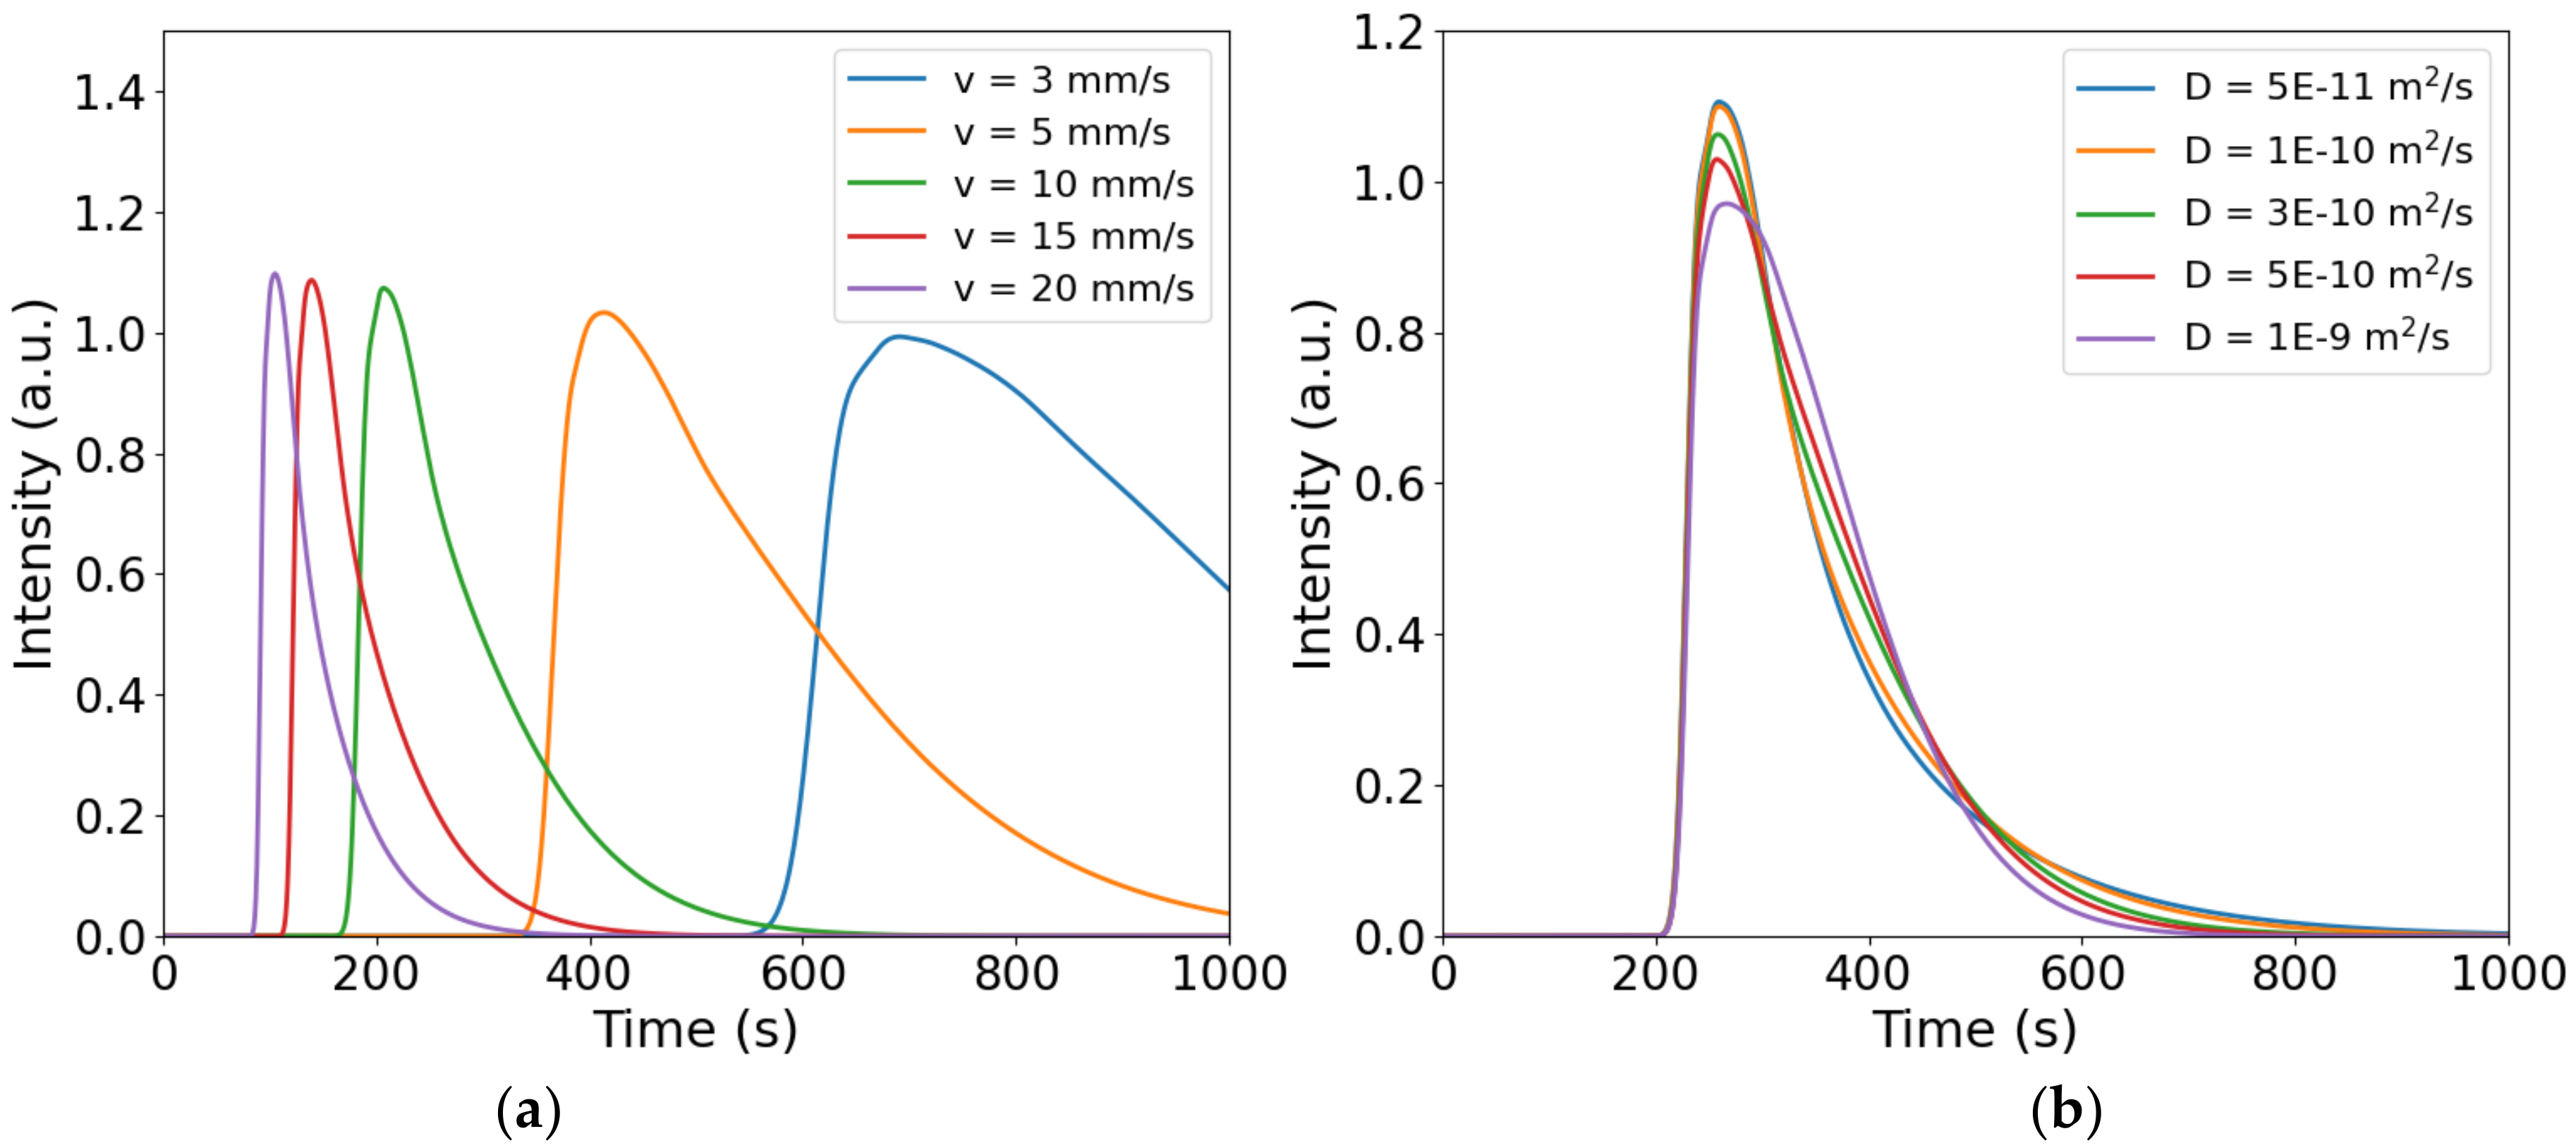
Figure 4 shows simulation results for the transport of a substance plug in a mChannel having radius 1.2 mm and length 30 cm. We investigated how change the signal properties, i.e., shape and intensity, modifying velocity flow (advective term) and keeping constant diffusion coefficient (diffusive term), and vice versa.
Simulated signals represented in Figure 4a were obtained by changing the flow velocity and keeping constant the diffusion coefficient having a value of 3 × 10⁻¹⁰ m2/s. This value was chosen based on information nanoparticles with a typical size of about 2 nm [38]. It can be observed that none of the signals in question have a Gaussian distribution but are all curves with distorted symmetry. This is caused by the parabolic flow velocity profile, whereby what is in the center of the channel travels faster and reaches the receiver sooner, while what is near the walls is transported more slowly, causing a long tail in the signal (tailing effect). Transport is a non-homogeneous process. As the flow velocity decreases, it is noticeable how the dispersion increases, manifesting itself in increasingly less intense and sparse signals. On the other hand, an increase in flow velocity allows the substance to stay more compact during its journey from transmitter to receiver and the signal will be more intense. Figure 4b shows that significant changes in the diffusion coefficient have very little effect on the shape and intensity of the signals. Considering an intermediate value of flow velocity between those considered in Figure 4a equal to 8 mm/s and varying D by almost 2 orders of magnitude always results in highly distorted Gaussian distributions. With mChannel sizes, while analyzing operating ranges of flow velocity and diffusion coefficient typical of molecular communication experiments, non-Gaussian signals are obtained.
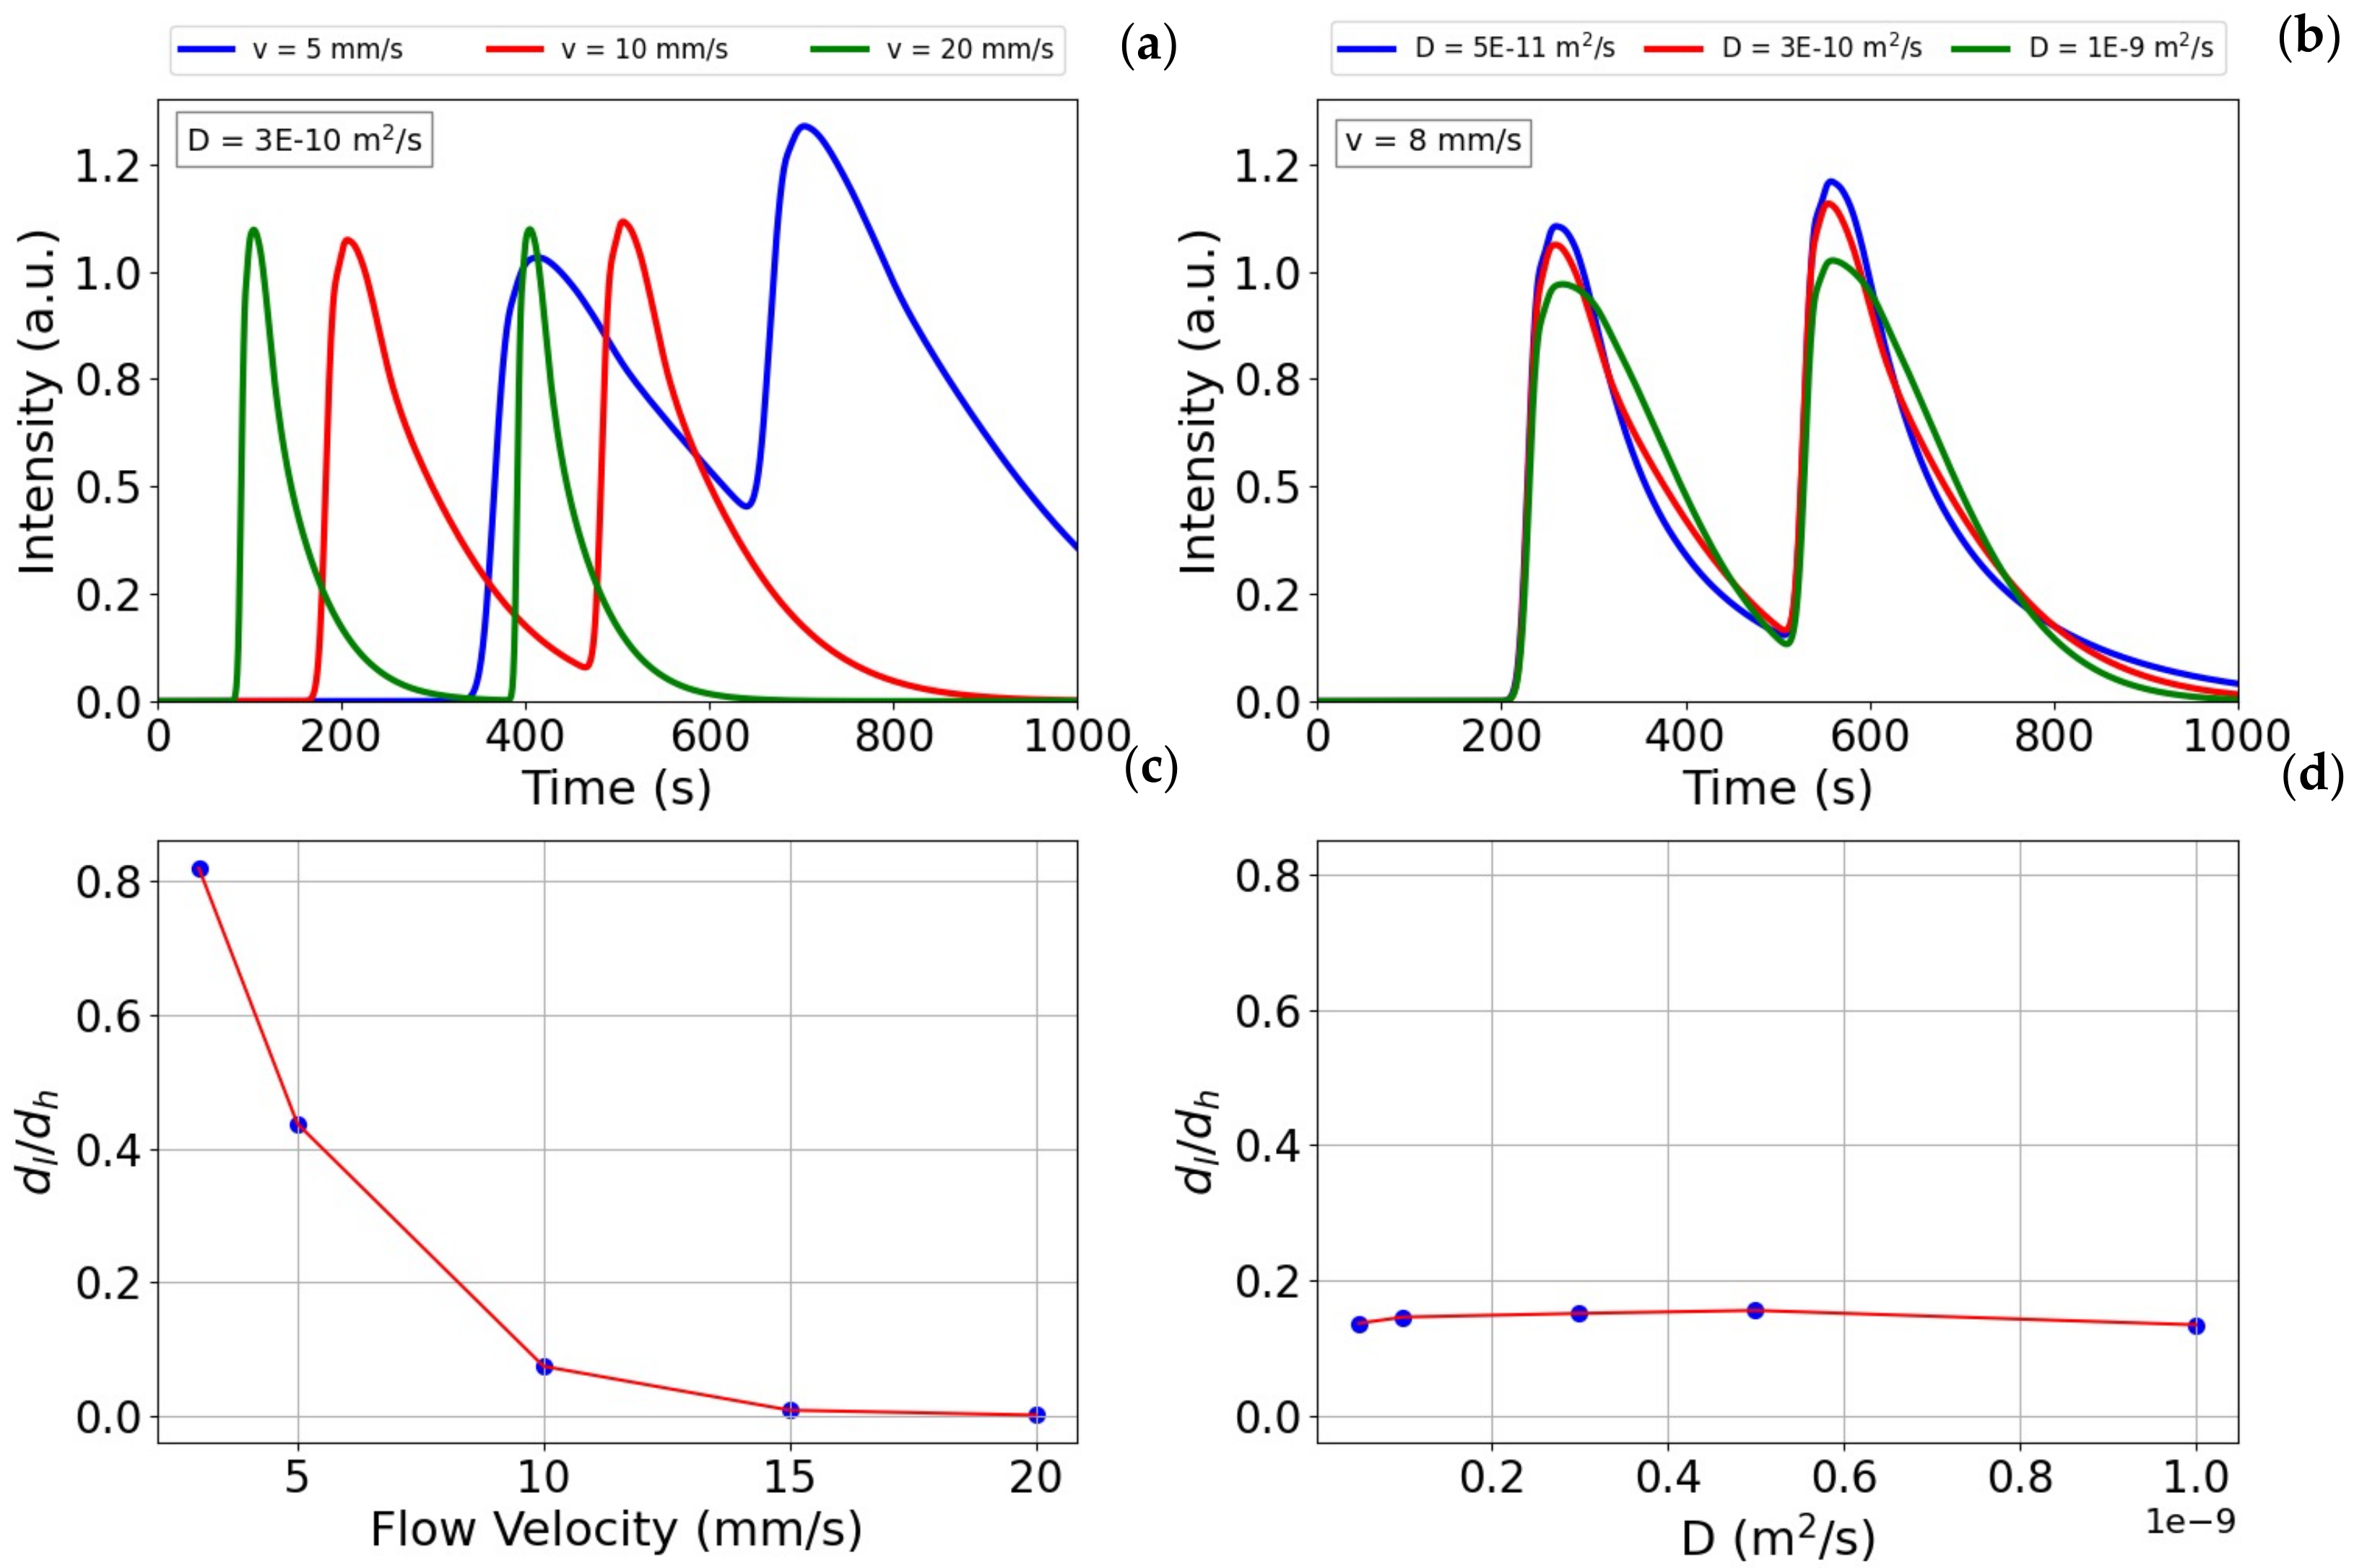
Figure 5a,b show how the effect of ISI varies in mChannel as the flow velocity and diffusion coefficient change, respectively. For this study, a fixed delay between two consecutive bits of 300 s was chosen. Considering only three different values of flow velocity and diffusion coefficient to make the graphs clearer, it can be easily observed that flow velocity strongly influences ISI and that specifically, as the flow velocity decreases, the signal interference increases; on the other hand, variations of even two orders of magnitude in the diffusion coefficient do not influence ISI. To express this result quantitatively, we plotted the trend of the dl/dh ratio against both the flow rate and the diffusion coefficient, where dl indicates the intensity of the “valley” between two consecutive bits and dh the maximum intensity of the first bit. The two borderline cases of this relationship are dl/dh = 0 and dl/dh = 2, and the first one means that the two consecutive bits are perfectly separated and the second one means that two consecutive bits are totally overlapped to observe only one, with twice the intensity of the single bit. Figure 5c shows that this ratio covers a relatively wide range, from about 0.8 to 0 as the flow velocity increases; instead, Figure 5d shows a much narrower range of the dl/dh ratio than the first, depicting values between approximately 0.135 and 0.155. This is further confirmation of what has been described by Figure 5a,b. Similar results are obtained with larger channel radii, even with more pronounced effects.
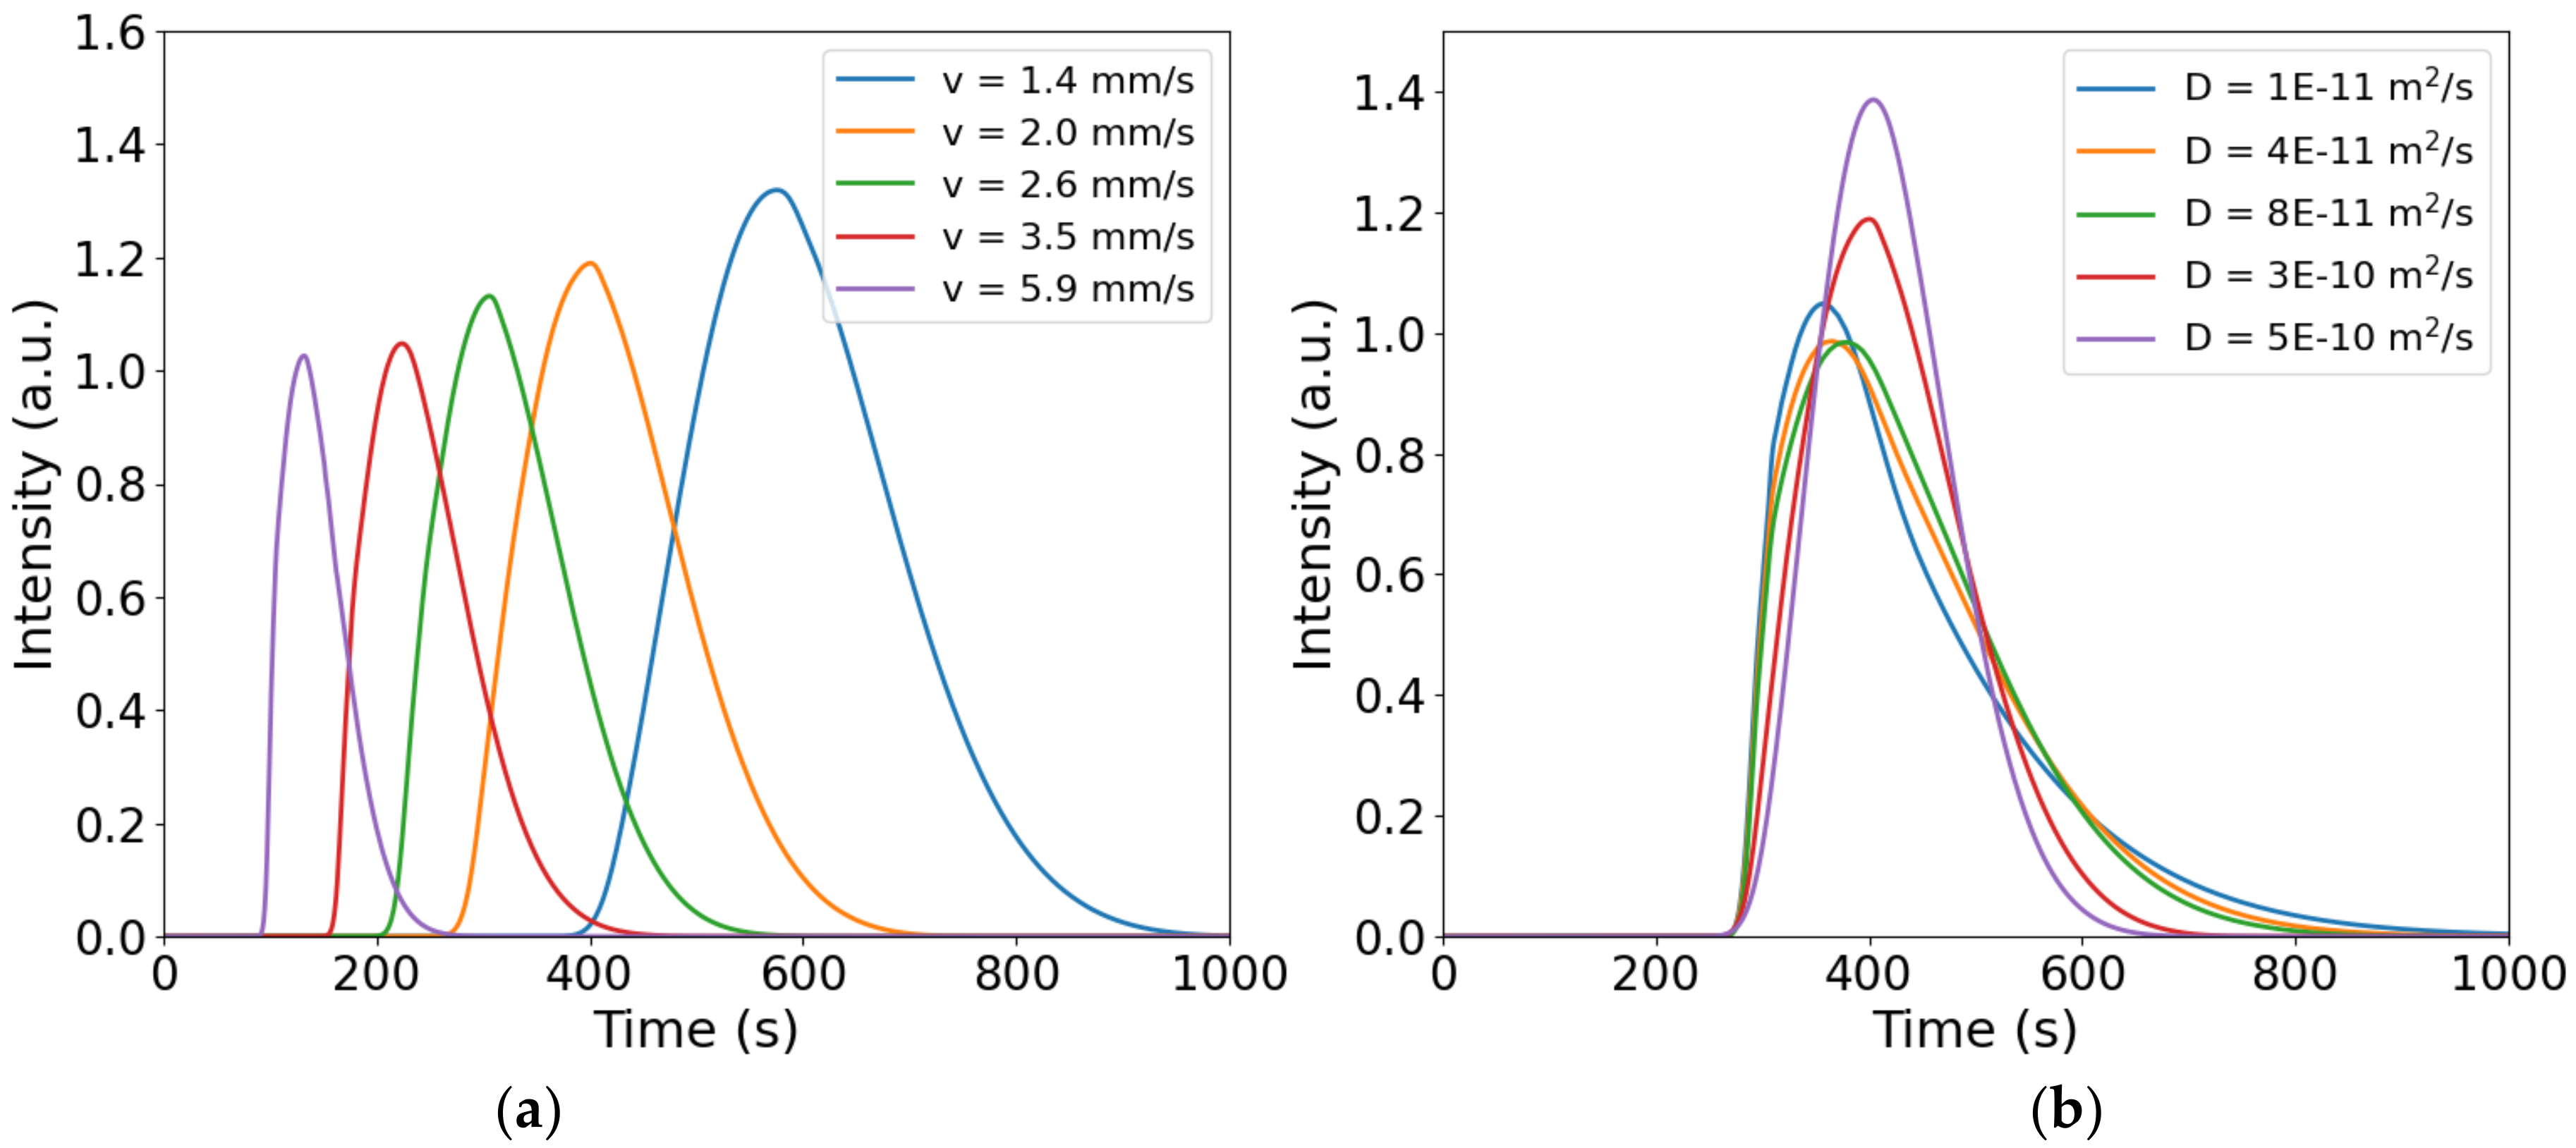
We investigated µChannel conditions, considering that communication takes place in a pipe having internal diameter (ID) of 1/32” (about 0.375 mm radius) mostly used in common microfluidic experiments. Figure 6a shows the trend of the simulated signals at varying flow velocities which is quite different from the mChannel conditions. In this case, as the velocity decreases, not only does the signal intensity increase, but also its shape changes, becoming an almost perfect Gaussian (for example, signal obtained at a flow velocity of 1.4 mm/s). This can be observed because, as the flow velocity decreases, the contribution of radial diffusion, and thus of the Taylor regime, increases, allowing the plug to be compacted during its journey. That radial diffusion now has a greater weight can also be observed in Figure 6b, as signals are no longer independent of the diffusion coefficient variations. Intuitively, with the same flow velocity of 2 mm/s, as D increases, the plug arrives at the receiver more compactly and less dispersed, showing up as the result of a common Taylorgram [39]. In the light of this, under the microfluidic conditions employed in this simulation, it can be studied how the Taylor regime, whenever the flow velocity decreases or the diffusion coefficient increases, affects the signal in a typical transport model for molecular communication. Here too, we have evaluated Intersymbol Interference in the same way as for mChannel conditions, setting a delay of 300 s between two consecutive bits.
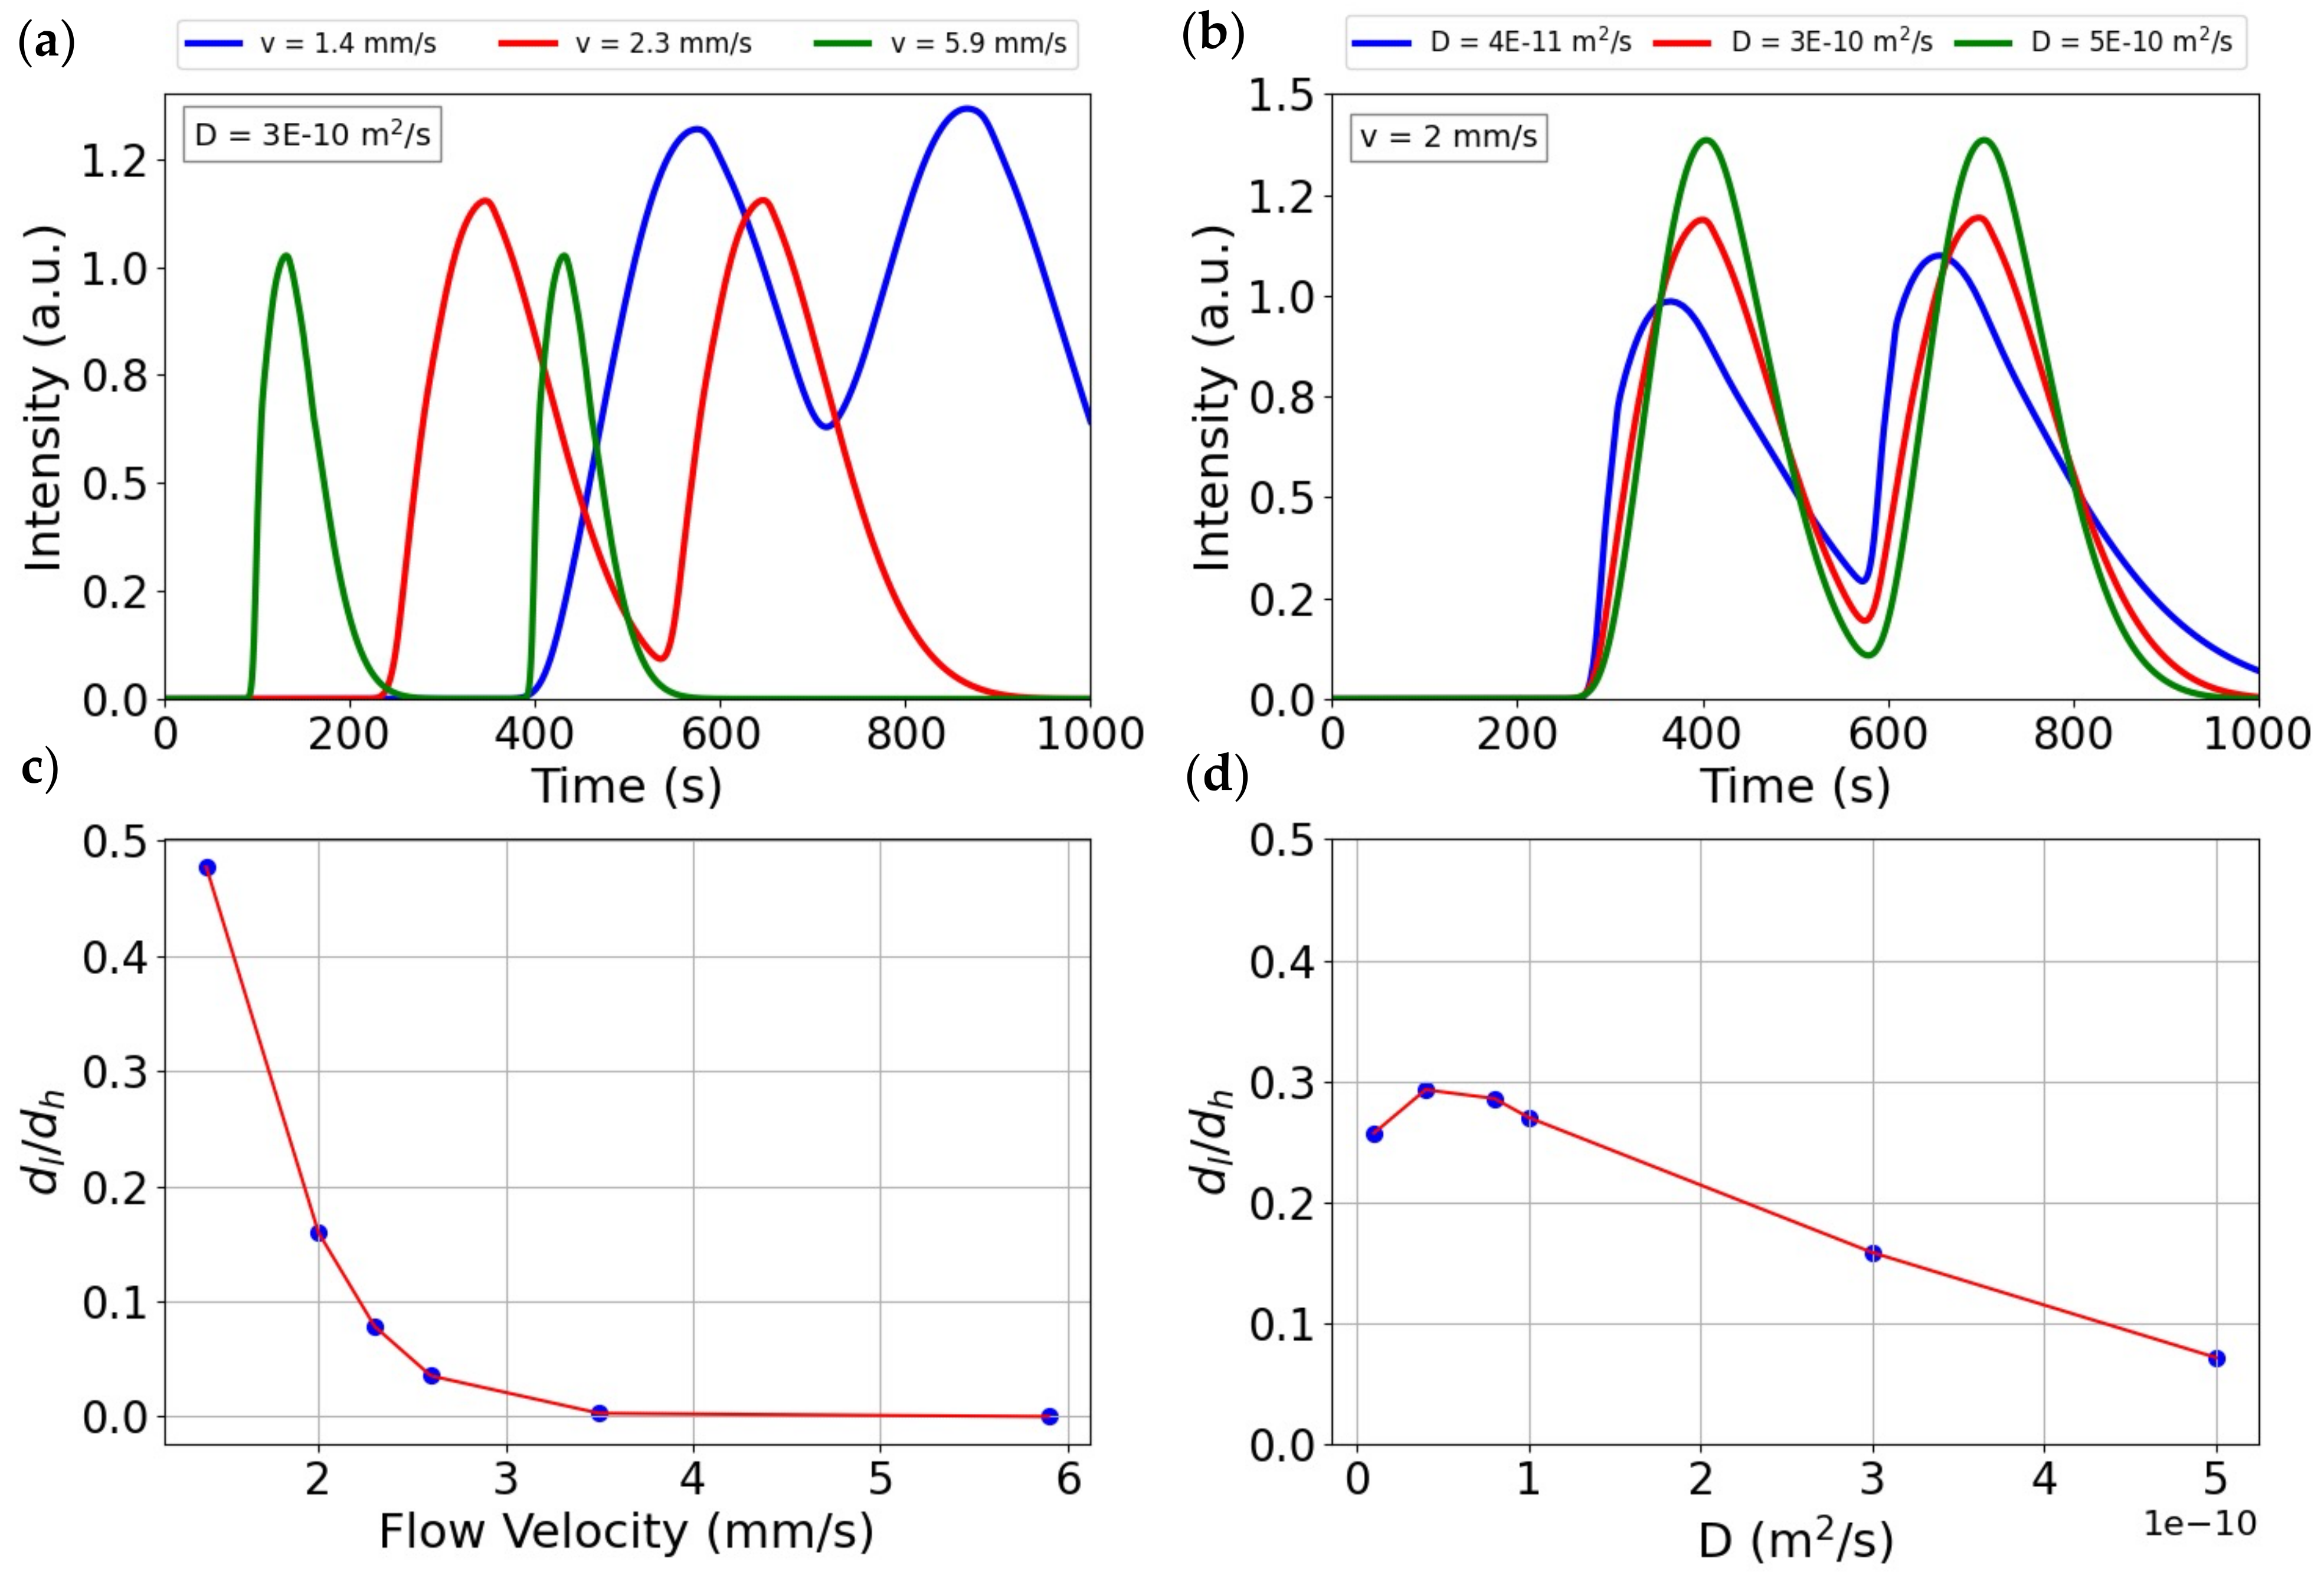
Figure 7a shows that, as flow velocity decreases, ISI increases, as seen for mChannel simulations. Figure 7b shows that ISI is also influenced by variations in the diffusion coefficient, as it can be observed that the dl/dh ratio changes considerably within a range of D that differs by at most one order of magnitude. Obviously, with the above considerations and looking at Figure 7d, the ISI effect decreases as the diffusion coefficient increases. We can call this condition in which Taylor diffusion clearly manifests itself due to the size of the channel in which transport has been simulated µChannel condition.
In an overview, we can say that, in what we have defined as mChannel conditions, if we wanted to send a bit sequence, to increase the information density and avoid reading errors due to ISI, we would have to work only at higher flow rates. The performance does not change if we modify the diffusion coefficient of the transported substance, for example by varying the viscosity of the transport fluid or the size of the messengers (remember Stokes–Einstein’s law). In any case, it will not be possible to obtain compact Gaussian signals. Concerning µChannel conditions, we can maintain a high bit rate even at lower flow velocities due to the Taylor effect that sets in as the flow velocities decrease. In this case, the signals leave the asymmetrical distribution and become almost perfect Gaussians. In addition, an increase in the diffusion coefficient also makes it possible to observe a contribution from the Taylor regime that causes less plug dispersion. Thus, operating under µChannel conditions allows us to have a wider range of flow velocities to obtain successive signals that are completely separated and to use smaller delays between signals without loss of information quality. In the light of these results, it was decided to set up a prototype for molecular communication under µChannel conditions (see Materials and Methods) which, as has been seen, are those with which it is easiest to optimize the process of transporting messengers and thus information. To do this, four carbon dots suspensions with the same concentration but different viscosities were prepared, respectively, of 1.0, 2.5, 5.0, and 7.5 mPa s affecting the diffusion of information nanoparticles. The first one is a CQD suspension in water only, while the others are suitable mixtures of water and glycerol. A carrier with the same viscosity was prepared for each CQD suspension. Higher viscosities have not been considered because, operating under microfluidic conditions, the syringe system that allows continuous flow of the carrier does not maintain optimum performance.
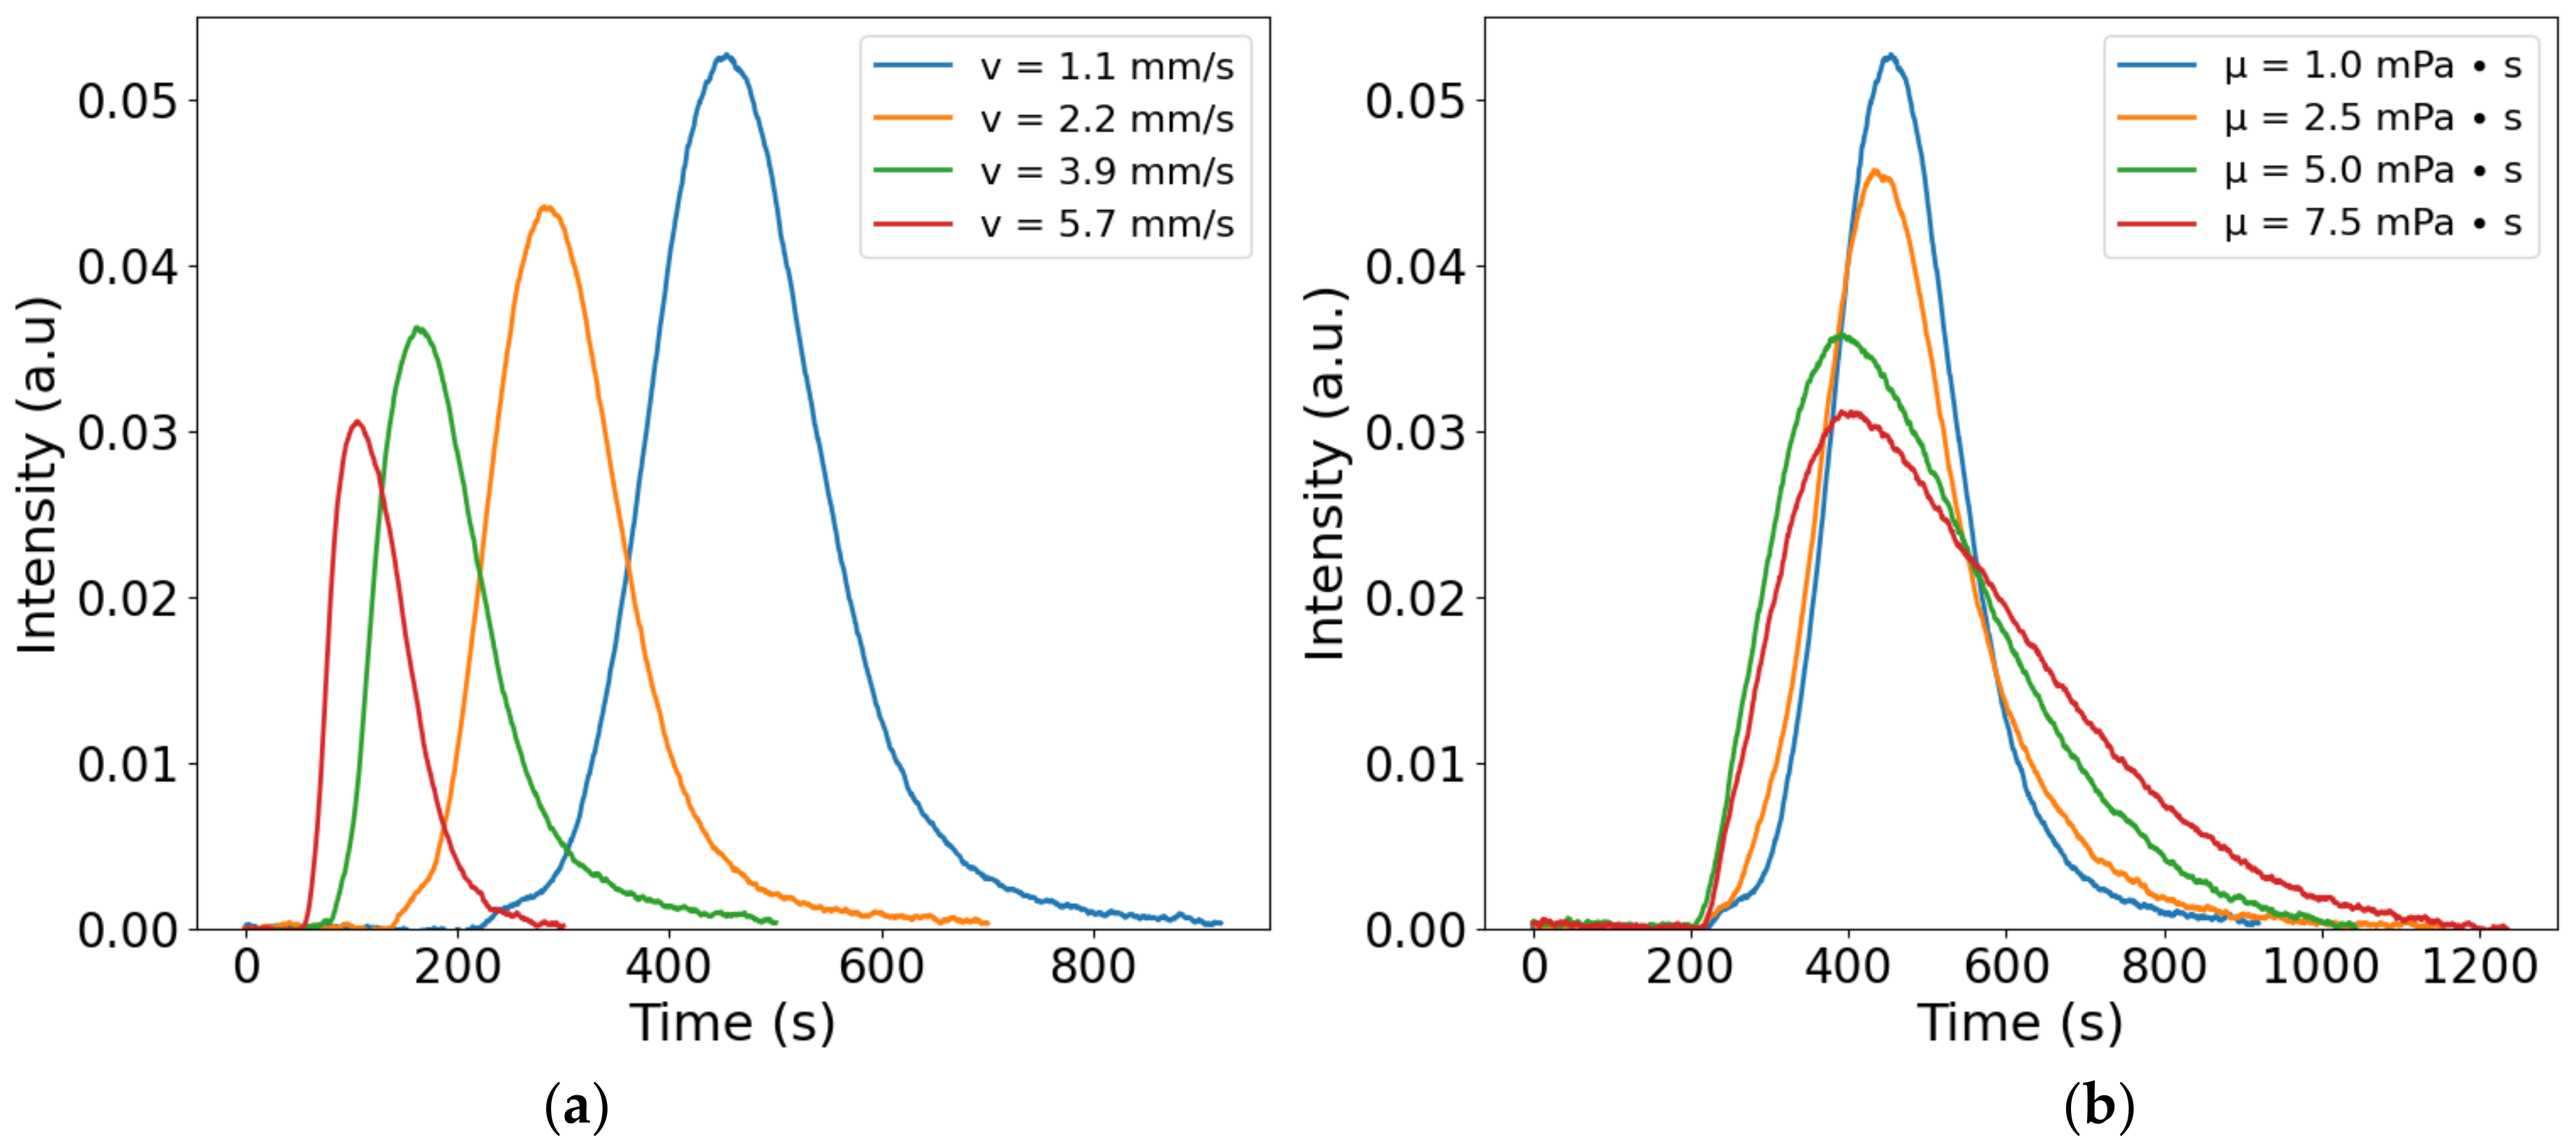
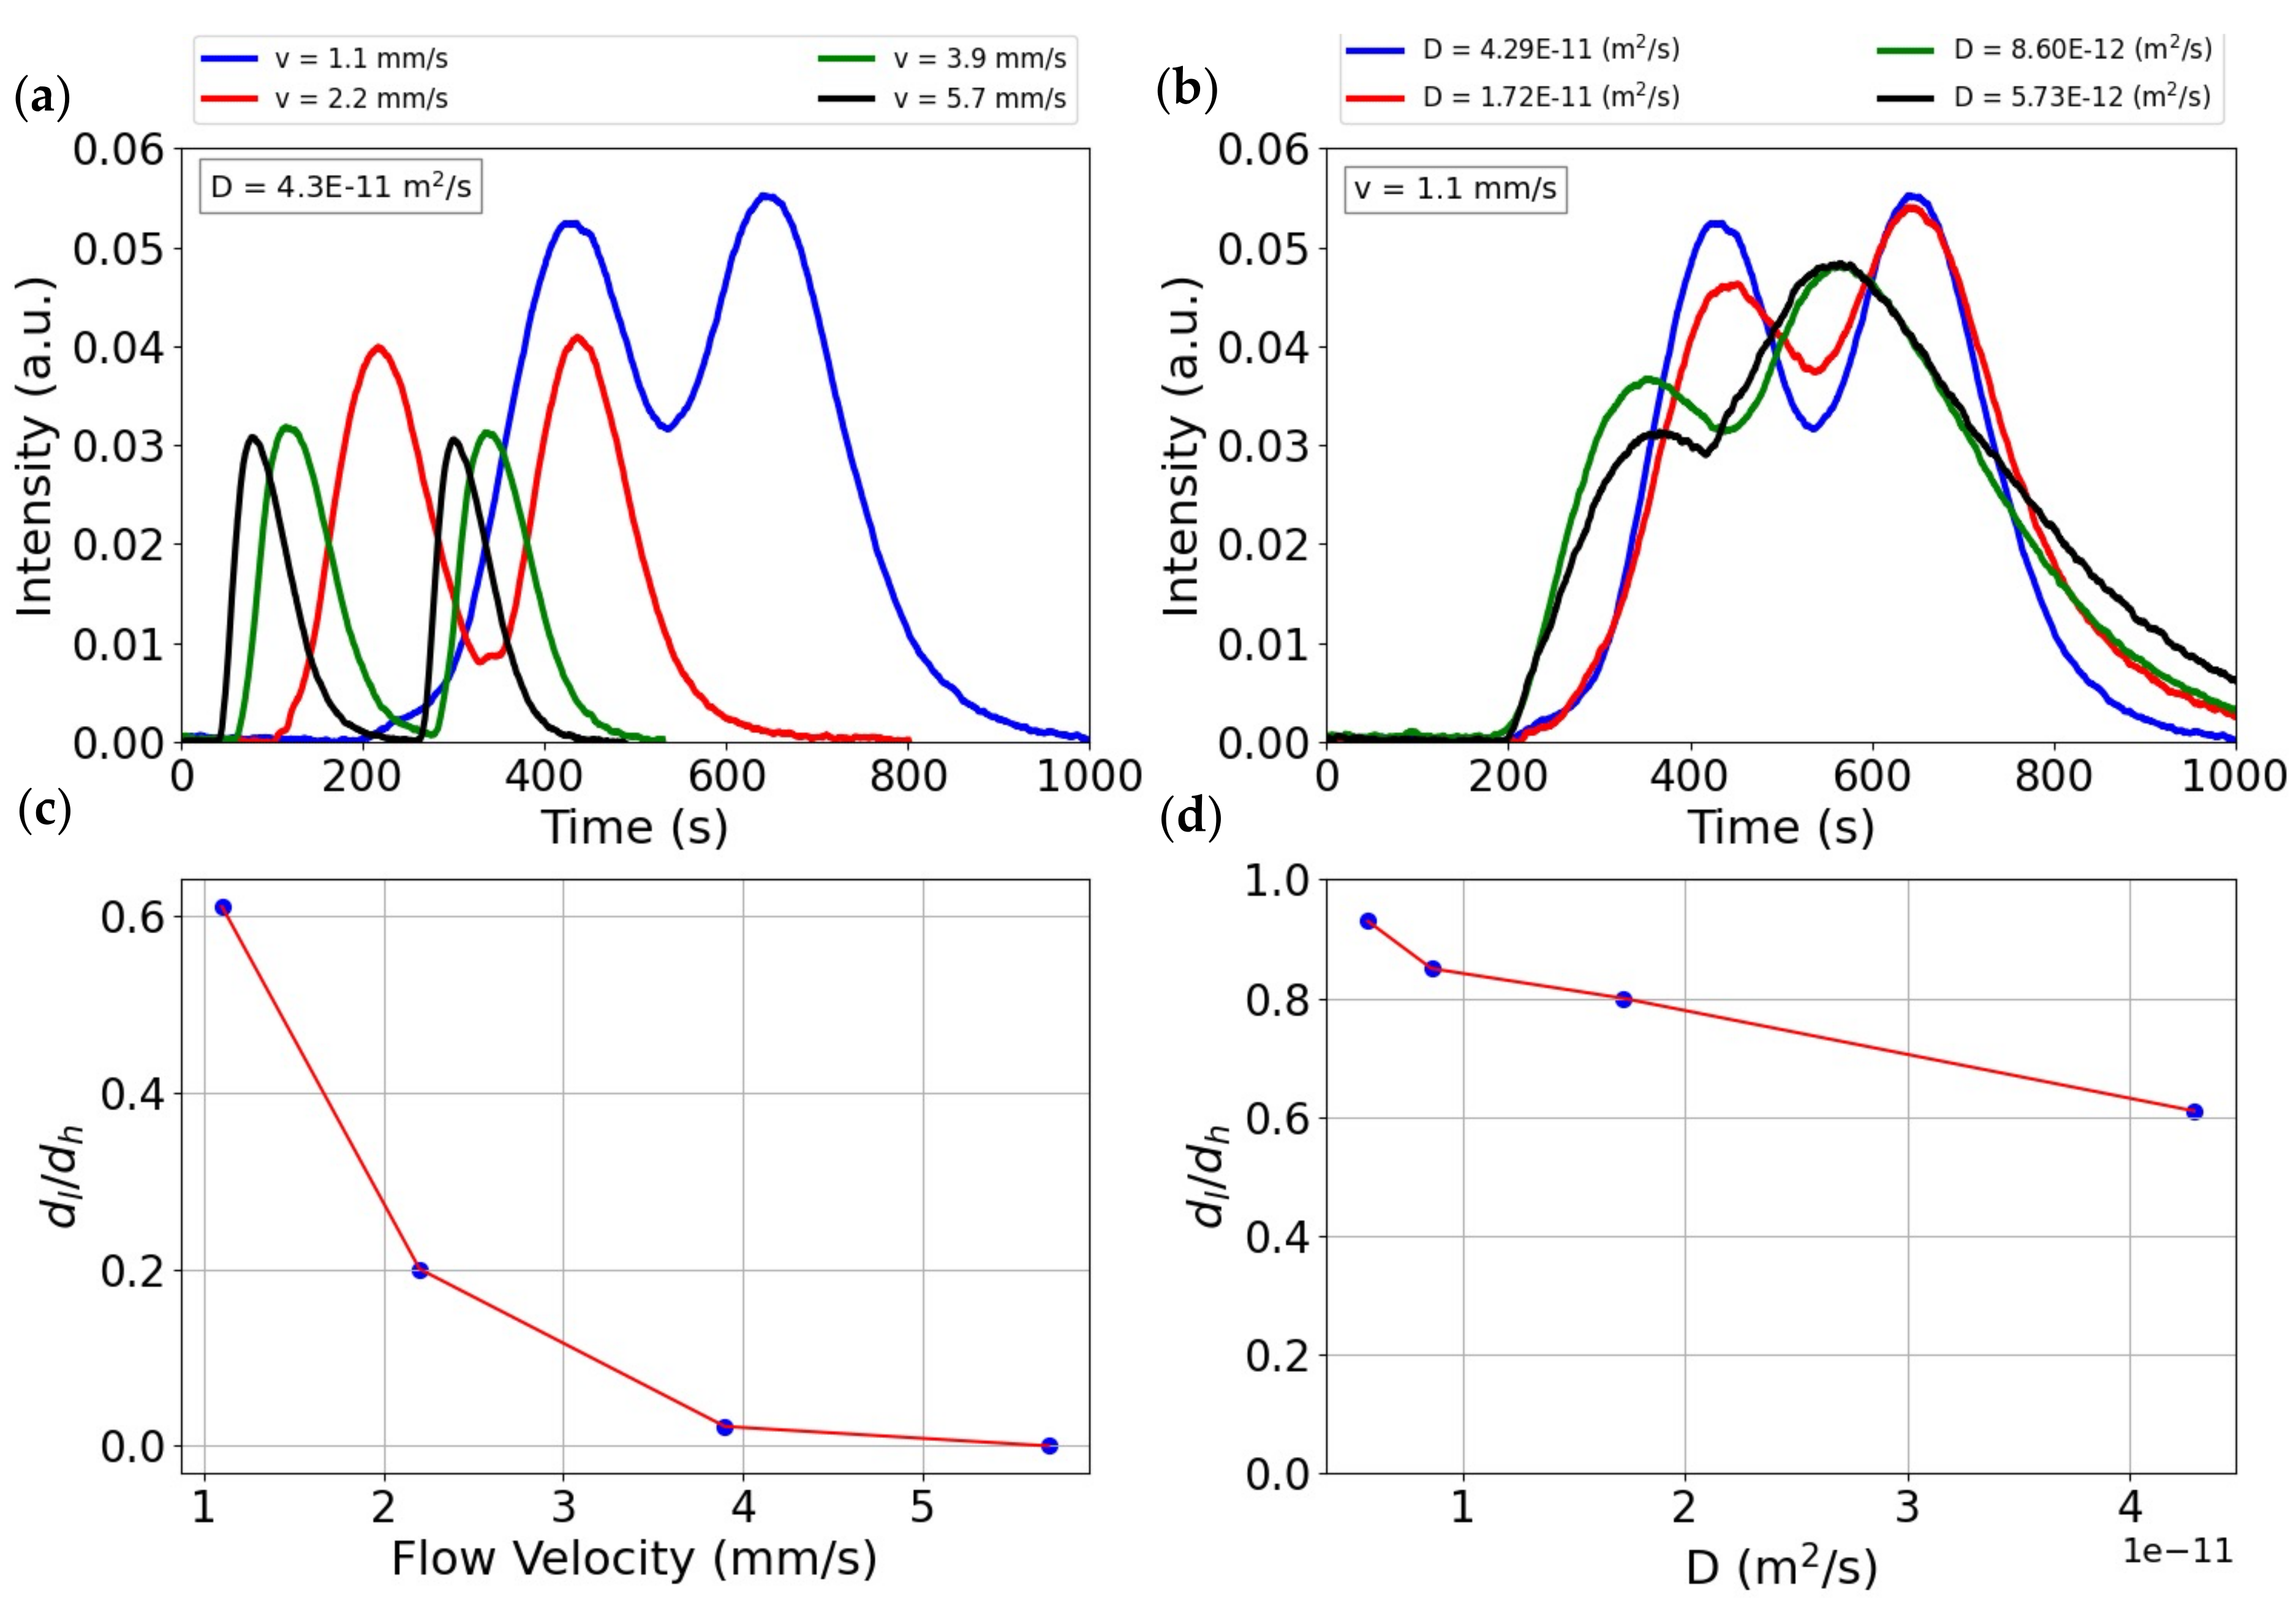
Figure 8a shows the experimental signals obtained by varying the flow velocity within a range like that which was used for the simulations. In this case, we operated with the suspension of CQDs in water, therefore at constant viscosity and diffusion coefficient. It is extremely clear that, under experimental conditions, the same trend of the signals seen in the simulations is obtained as the flow velocity decreases. To investigate the trend of the signals at constant flow velocity and varying diffusion coefficient, we obtained the signals represented in Figure 8b at varying viscosity of the entire communication channel. Considering carbon quantum dots having an average diameter of 10 nm [35], the diffusion coefficient associated with each viscosity for the Stokes–Einstein equation is estimated to be 4.29 × 10⁻¹¹, 1.72 × 10⁻¹¹, 8.60 × 10⁻¹², and 5.73 × 10⁻¹² m2/s, respectively. Again, as with the theoretical results, as the viscosity decreases, hence as the diffusion coefficient increases, a larger Taylor effect is obtained resulting in a more intense and Gaussian signal.
Figure 9 confirms the Intersymbol Interference trend seen with the simulations as the flow velocity and diffusion coefficient vary in microfluidic conditions. For a simplified comparison, in the legend of Figure 9b and in the x-axis of Figure 9d, the values of the diffusion coefficients of the four different CQDs suspensions have been given instead of the viscosities. It is significant to observe the exponential trend in Figure 9c, which is also exactly reproduced in Figure 7c by means of simulations: in both, completely separated signals are obtained at flow velocities of about 4 mm/s.
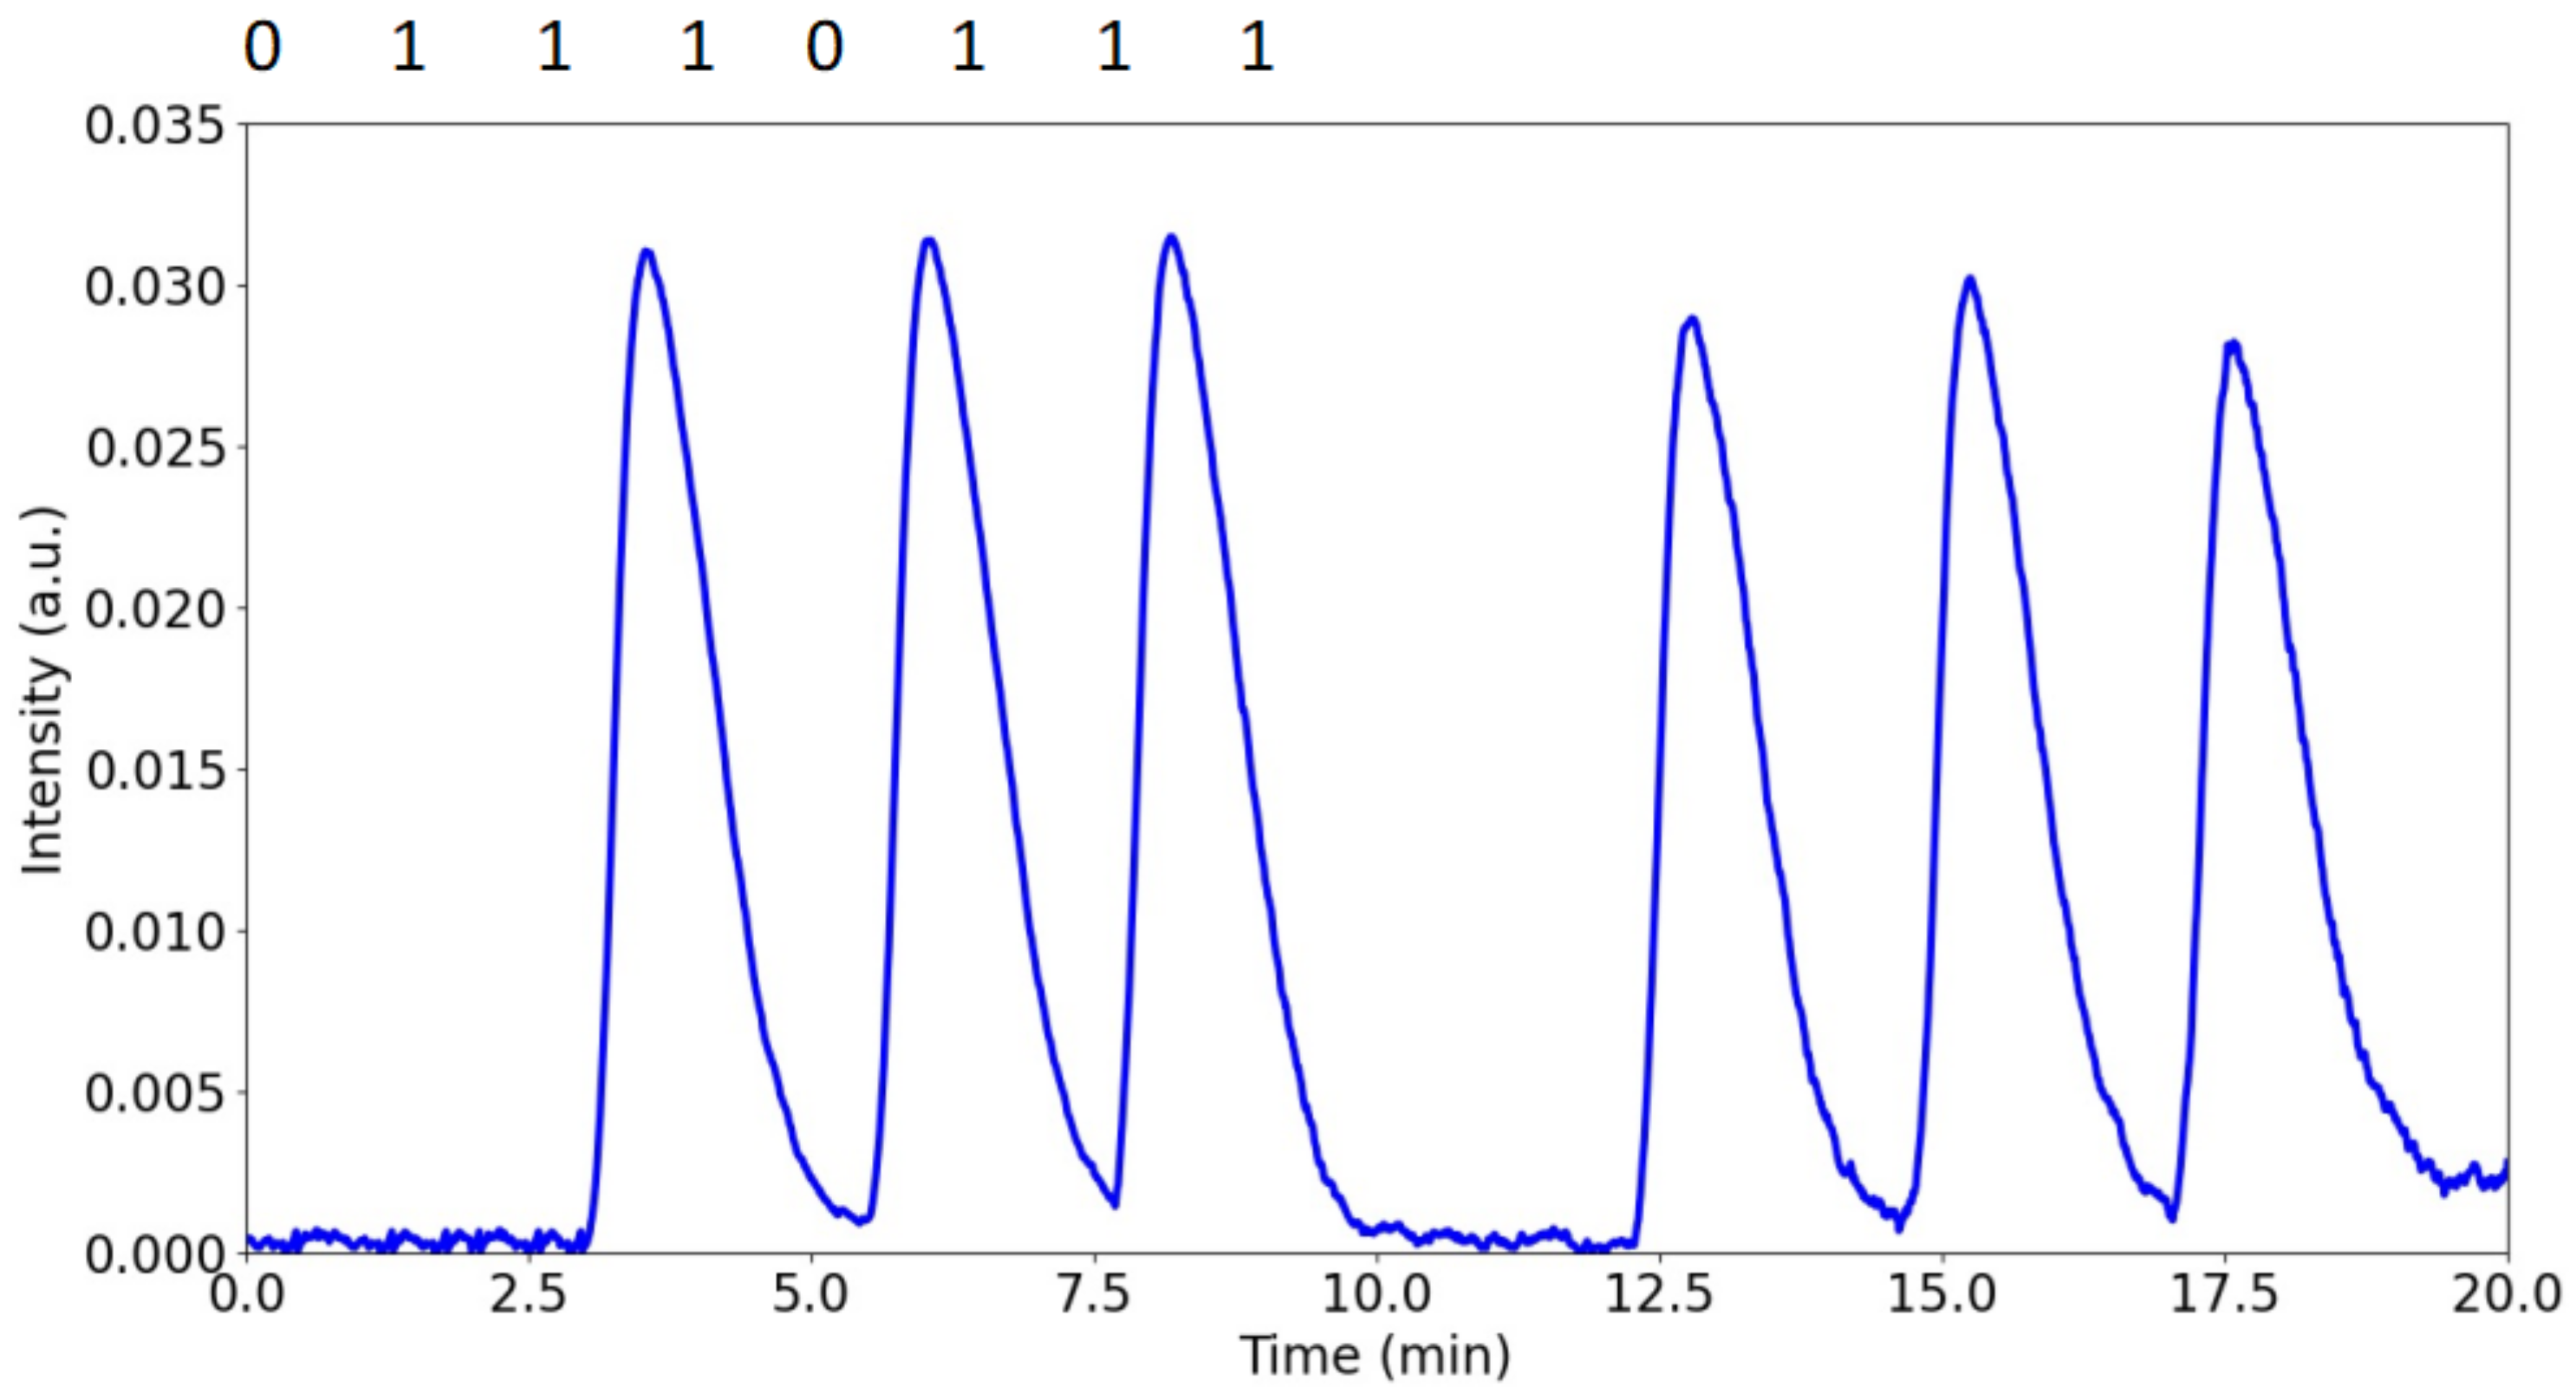
Figure 10 shows the transmission of the letter “w” simulated in Figure 3, this time obtained experimentally through our prototype, using a flow velocity of 5.7 mm/s and nanoparticles having a diffusion coefficient of about 4.3 × 10⁻¹¹ m2/s. It is evident that an ISI-free bit sequence is obtained, using a delay between signals of just over two minutes. This is a concrete demonstration of working in our prototype for molecular communication operating in μChannel conditions based on the theoretical and experimental results collected.
4. Conclusions
In this work, the comparison between µChannel and mChannel conditions was studied in order to optimize the transport of information carriers for molecular communication. Through a theoretical study first, and an experimental campaign later, it was possible to analyze the benefits that the Taylor regime triggered in µChannel-MoCo brings. However, for mChannel-MoCo, it has been seen that the only condition to ensure a good information density without incurring read errors is to operate at higher flow rates, in the case of µChannel-MoCo, using the Taylor regime, optimization can be achieved by means of the flow rate and the diffusion coefficient of the information particles. It is extremely encouraging to see the accuracy with which the experimental signals were obtained compared to the simulated ones. This allows us to confirm that, in µChannel-MoCo, a wider range of flow velocities can be used to obtain successive signals that are completely separated and smaller delays between signals without loss of information quality. This could pave the way for the realization of communication platforms under “wave-negative” conditions such as communication between implanted bio mediated devices. In this application context, the use of capillaries is desirable for reasons of compatibility and limiting the invasiveness of the implant impact. Such communication would be “inherently” secure. In the sense that it will not be possible to intercept the message remotely because the information particles are not metallic and do not emit any electromagnetic field. They can be detected only if locally stimulated by incident light. Therefore, an eavesdropper who wants to read the message should physically take the liquid from the capillary. The results we have presented here open other potential applications in other “underground” contexts such as in the field of subterranean communication where electromagnetic radiation is unusable. In these contexts, the length of the channels must be much larger, on the order of meters. Our results indicate that, even in this case, rather than using macro channels, it is better to go for microfluidic channels. Problems related to the slowness of the communication realized in this way still remain open and could be overcome with the use of multi-ary logics and release of multi-symbol information nanoparticles.
Author Contributions
Conceptualization, N.T. and F.C.; methodology, F.C. and L.F.; software, F.C. and N.T.; validation, N.T.; resources, N.T.; data curation, F.C.; writing—original draft preparation, F.C.; writing—review and editing, N.T.; visualization, F.C.; supervision, N.T.; project administration, N.T.; funding acquisition, N.T. All authors have read and agreed to the published version of the manuscript.
Funding
This research was funded by the University of Catania, Grant No. Nati4Smart Piano di incentivi per la Ricerca 2020/2022—Linea di intervento 2” and “The APC was funded by University of Catania”.
Institutional Review Board Statement
Not applicable.
Informed Consent Statement
Not applicable.
Data Availability Statement
Not applicable.
Acknowledgments
The authors thank Giovanni Contarino for valuable effort in the laboratory.
Conflicts of Interest
The authors declare no conflict of interest.
References
- Guo, W.; Abbaszadeh, M.; Lin, L.; Charmet, J.; Thomas, P.; Wei, Z.; Li, B.; Zhao, C. Molecular Physical Layer for 6G in Wave-Denied Environments. IEEE Commun. Mag. 2021, 59, 33–39. [Google Scholar] [CrossRef]
- Ozdemir, F.; Kargi, A. Electromagnetic Waves and Human Health. In Electromagnetic Waves; Intech Open: London, UK, 2011. [Google Scholar]
- Guo, W.; Mias, C.; Farsad, N.; Wu, J.-L. Molecular Versus Electromagnetic Wave Propagation Loss in Macro-Scale Environments. IEEE Trans. Mol. Biol. Multi-Scale Commun. 2015, 1, 18–25. [Google Scholar] [CrossRef] [Green Version]
- Nakano, T.; Eckford, A.W.; Haraguchi, T. Molecular communication. Mol. Commun. 2011, 9781107023, 1–179. [Google Scholar] [CrossRef]
- Nakano, T.; Moore, M.J.; Wei, F.; Vasilakos, A.V.; Shuai, J. Molecular Communication and Networking: Opportunities and Challenges. IEEE Trans. Nanobiosci. 2012, 11, 135–148. [Google Scholar] [CrossRef] [PubMed]
- Atakan, B.; Akan, O.B. An information theoretical approach for molecular communication. In Proceedings of the 2007 2nd Bio-Inspired Models of Network, Information and Computing Systems, Budapest, Hungary, 10–12 December 2007; IEEE: Piscatway, NJ, USA, 2007; pp. 33–40. [Google Scholar]
- Farsad, N.; Yilmaz, H.B.; Eckford, A.; Chae, C.-B.; Guo, W. A Comprehensive Survey of Recent Advancements in Molecular Communication. IEEE Commun. Surv. Tutor. 2016, 18, 1887–1919. [Google Scholar] [CrossRef] [Green Version]
- Martinez-Ricos, J.; Agustin-Pavon, C.; Lanuza, E.; Martinez-Garcia, F. Intraspecific Communication Through Chemical Signals in Female Mice: Reinforcing Properties of Involatile Male Sexual Pheromones. Chem. Senses 2006, 32, 139–148. [Google Scholar] [CrossRef] [PubMed] [Green Version]
- Antunes, L.C.M.; Ferreira, R.B.R. Intercellular communication in bacteria. Crit. Rev. Microbiol. 2009, 35, 69–80. [Google Scholar] [CrossRef]
- Farsad, N.; Guo, W.; Eckford, A.W. Tabletop Molecular Communication: Text Messages through Chemical Signals. PLoS ONE 2013, 8, e82935. [Google Scholar] [CrossRef] [Green Version]
- Fichera, L.; Li-Destri, G.; Tuccitto, N. Fluorescent nanoparticle-based Internet of things. Nanoscale 2020, 12, 9817–9823. [Google Scholar] [CrossRef]
- Fichera, L.; Li-Destri, G.; Tuccitto, N. Graphene Quantum Dots enable digital communication through biological fluids. Carbon 2021, 182, 847–855. [Google Scholar] [CrossRef]
- Khaloopour, L.; Rouzegar, S.V.; Azizi, A.; Hosseinian, A.; Farahnak-Ghazani, M.; Bagheri, N.; Mirmohseni, M.; Arjmandi, H.; Mosayebi, R.; Nasiri-Kenari, M. An Experimental Platform for Macro-Scale Fluidic Medium Molecular Communication. IEEE Trans. Mol. Biol. Multi-Scale Commun. 2019, 5, 163–175. [Google Scholar] [CrossRef]
- Bicen, A.O.; Akyildiz, I.F. System-Theoretic Analysis and Least-Squares Design of Microfluidic Channels for Flow-Induced Molecular Communication. IEEE Trans. Signal. Process. 2013, 61, 5000–5013. [Google Scholar] [CrossRef] [Green Version]
- De Luis, B.; Llopis-Lorente, A.; Sancenón, F.; Martínez-Máñez, R. Engineering chemical communication between micro/nanosystems. Chem. Soc. Rev. 2021, 50, 8829–8856. [Google Scholar] [CrossRef]
- Nakano, T.; Eckford, A.W.; Haraguchi, T. Molecular Communication; Cambridge University Press: Cambridge, UK, 2013; ISBN 9781139149693. [Google Scholar]
- Parcerisa Giné, L.; Akyildiz, I.F. Molecular communication options for long range nanonetworks. Comput. Netw. 2009, 53, 2753–2766. [Google Scholar] [CrossRef] [Green Version]
- Moritani, Y.; Hiyama, S.; Suda, T. Molecular communication for health care applications. In Proceedings of the Fourth Annual IEEE International Conference on Pervasive Computing and Communications Workshops (PERCOMW’06), Pisa, Italy, 13–17 March 2006; IEEE Computer Society: Washington, DC, USA, 2006; pp. 5–553. [Google Scholar]
- Malak, D.; Akan, O.B. Molecular communication nanonetworks inside human body. Nano Commun. Netw. 2012, 3, 19–35. [Google Scholar] [CrossRef]
- Wang, Z.; Xie, X.; Zhao, J.; Liu, X.; Feng, W.; White, J.C.; Xing, B. Xylem-and Phloem-Based Transport of CuO Nanoparticles in Maize ( Zea mays L.). Environ. Sci. Technol. 2012, 46, 4434–4441. [Google Scholar] [CrossRef]
- White, P.J. Long-distance Transport in the Xylem and Phloem. In Marschner’s Mineral Nutrition of Higher Plants; Elsevier: Amsterdam, The Netherlands, 2012; pp. 49–70. [Google Scholar]
- Bray, D. SIGNALING COMPLEXES: Biophysical Constraints on Intracellular Communication. Annu. Rev. Biophys. Biomol. Struct. 1998, 27, 59–75. [Google Scholar] [CrossRef]
- Bird, R.B.; Stewart, W.E.; Lightfoot, E.N. Transport. Phenomena; John Wiley and Sons, Inc.: New York, NY, USA, 1960; pp. 5J–6J. [Google Scholar] [CrossRef]
- Taylor, G.I. Dispersion of soluble matter in solvent flowing slowly through a tube. Proc. R. Soc. London. Ser. A Math. Phys. Sci. 1953, 219, 186–203. [Google Scholar] [CrossRef]
- Bello, M.S.; Rezzonico, R.; Righetti, P.G. Use of Taylor-Aris Dispersion for Measurement of a Solute Diffusion Coefficient in Thin Capillaries. Science 1994, 266, 773–776. [Google Scholar] [CrossRef]
- Mahfuz, M.U.; Makrakis, D.; Mouftah, H.T. Characterization of intersymbol interference in concentration-encoded unicast molecular communication. In Proceedings of the 2011 24th Canadian Conference on Electrical and Computer Engineering(CCECE), Niagara Falls, ON, Canada, 8–11 May 2011; IEEE: Piscatway, NJ, USA, 2011; pp. 000164–000168. [Google Scholar]
- Kilinc, D.; Akan, O.B. Receiver Design for Molecular Communication. IEEE J. Sel. Areas Commun. 2013, 31, 705–714. [Google Scholar] [CrossRef]
- Llatser, I.; Cabellos-Aparicio, A.; Pierobon, M.; Alarcon, E. Detection Techniques for Diffusion-based Molecular Communication. IEEE J. Sel. Areas Commun. 2013, 31, 726–734. [Google Scholar] [CrossRef]
- Tuccitto, N.; Li-Destri, G.; Messina, G.M.L.; Marletta, G. Fluorescent Quantum Dots Make Feasible Long-Range Transmission of Molecular Bits. J. Phys. Chem. Lett. 2017, 8, 3861–3866. [Google Scholar] [CrossRef]
- Tuccitto, N.; Li-Destri, G.; Messina, G.M.L.; Marletta, G. Reactive messengers for digital molecular communication with variable transmitter-receiver distance. Phys. Chem. Chem. Phys. 2018, 20, 30312–30320. [Google Scholar] [CrossRef]
- Jelinek, R. Carbon Quantum Dots. In Carbon Nanostructures; Springer International Publishing: Cham, Switzerland, 2017; ISBN 978-3-319-43909-9. [Google Scholar]
- Wu, M.; Wang, Y.; Wu, W.; Hu, C.; Wang, X.; Zheng, J.; Li, Z.; Jiang, B.; Qiu, J. Preparation of functionalized water-soluble photoluminescent carbon quantum dots from petroleum coke. Carbon 2014, 78, 480–489. [Google Scholar] [CrossRef]
- Tian, X.; Zeng, A.; Liu, Z.; Zheng, C.; Wei, Y.; Yang, P.; Zhang, M.; Yang, F.; Xie, F. Carbon quantum dots: In vitro and in vivo studies on biocompatibility and biointeractions for optical imaging. Int. J. Nanomed. 2020, 15, 6519–6529. [Google Scholar] [CrossRef] [PubMed]
- Luo, P.G.; Sahu, S.; Yang, S.-T.; Sonkar, S.K.; Wang, J.; Wang, H.; LeCroy, G.E.; Cao, L.; Sun, Y.-P. Carbon “quantum” dots for optical bioimaging. J. Mater. Chem. B 2013, 1, 2116. [Google Scholar] [CrossRef] [PubMed]
- Tuccitto, N.; Fichera, L.; Ruffino, R.; Cantaro, V.; Sfuncia, G.; Nicotra, G.; Sfrazzetto, G.T.; Li-Destri, G.; Valenti, A.; Licciardello, A.; et al. Carbon Quantum Dots as Fluorescence Nanochemosensors for Selective Detection of Amino Acids. ACS Appl. Nano Mater. 2021, 4, 6250–6256. [Google Scholar] [CrossRef]
- Kuran, M.S.; Yilmaz, H.B.; Tugcu, T.; Akyildiz, I.F. Modulation Techniques for Communication via Diffusion in Nanonetworks. In Proceedings of the 2011 IEEE International Conference on Communications (ICC), Kyoto, Japan, 5–9 June 2011; IEEE: Piscatway, NJ, USA, 2011; pp. 1–5. [Google Scholar]
- Mahfuz, M.U.; Makrakis, D.; Mouftah, H.T. Strength-based optimum signal detection in concentration-encoded pulse-transmitted OOK molecular communication with stochastic ligand-receptor binding. Simul. Model. Pract. Theory 2014, 42, 189–209. [Google Scholar] [CrossRef]
- Calì, F.; Cantaro, V.; Fichera, L.; Ruffino, R.; Trusso Sfrazzetto, G.; Li-Destri, G.; Tuccitto, N. Carbon Quantum Dots from Lemon Waste Enable Communication among Biodevices. Chemosensors 2021, 9, 202. [Google Scholar] [CrossRef]
- Alizadeh, A.; de Castro, C.A.N.; Wakeham, W.A. The theory of the Taylor dispersion technique for liquid diffusivity measurements. Int. J. Thermophys. 1980, 1, 243–284. [Google Scholar] [CrossRef]
Figure 1.
Schematic representation of an artificial molecular communication system considering spherical nanoparticles as information carriers.
Figure 1.
Schematic representation of an artificial molecular communication system considering spherical nanoparticles as information carriers.

Figure 2.
Schematic representation of the loading and realizing steps coordinately governed by selection and injection valves.
Figure 2.
Schematic representation of the loading and realizing steps coordinately governed by selection and injection valves.

Figure 3.
Binary encoded sequence of eight consecutive bits representative of the letter “w” in ASCII language. Signals as they should be without ISI (upper graph), signals as they are with ISI (lower graph).
Figure 3.
Binary encoded sequence of eight consecutive bits representative of the letter “w” in ASCII language. Signals as they should be without ISI (upper graph), signals as they are with ISI (lower graph).

Figure 4.
Simulated signals obtained in a channel having radius 1.2 mm and length 30 cm; (a) colors are associated with different values of flow velocity, while a constant diffusion coefficient of 3 × 10⁻¹⁰ m2/s is used; (b) colors are associated with different values of diffusion coefficient, while a constant flow velocity of 8 mm/s is used.

Figure 5.
(a,b) Simulated signals representing two consecutive bits with a fixed delay between them of 300 seconds, colors are associated with different values of flow velocity and diffusion coefficient, respectively; (c,d) development of the dl/dh ratio as a function of flow velocity and diffusion coefficient, respectively.

Figure 6.
Simulated signals obtained in a channel having radius 0.375 mm and length 30 cm; (a) colors are associated with different values of flow velocity, while a constant diffusion coefficient of 3 × 10⁻¹⁰ m2/s is used; (b) colors are associated with different values of diffusion coefficient, while a constant flow velocity of 2 mm/s is used.

Figure 7.
(a,b) Simulated signals representing two consecutive bits with a fixed delay between them of 300 seconds, colors are associated with different values of flow velocity and diffusion coefficient, respectively; (c,d) development of the dl/dh ratio as a function of flow velocity and diffusion coefficient, respectively.

Figure 8.
Experimental signals under microfluidic conditions; (a) colors are associated with different values of flow velocity using a CDs suspension water only (1.0 mPa s); (b) colors are associated with different values of viscosity, while a constant flow velocity of 1.1 mm/s is used.
Figure 8.
Experimental signals under microfluidic conditions; (a) colors are associated with different values of flow velocity using a CDs suspension water only (1.0 mPa s); (b) colors are associated with different values of viscosity, while a constant flow velocity of 1.1 mm/s is used.

Figure 9.
(a,b) Experimental signals representing two consecutive bits with a fixed delay between them of 220 seconds, colors are associated with different values of flow velocity and diffusion coefficient, respectively; (c,d) development of the dl/dh ratio as a function of flow velocity and diffusion coefficient, respectively.

Figure 10.
Experimental bit sequence representing the letter ′w′ in ASCII language.

Publisher’s Note: MDPI stays neutral with regard to jurisdictional claims in published maps and institutional affiliations. |
© 2022 by the authors. Licensee MDPI, Basel, Switzerland. This article is an open access article distributed under the terms and conditions of the Creative Commons Attribution (CC BY) license (https://creativecommons.org/licenses/by/4.0/).
Share and Cite
MDPI and ACS Style
Calì, F.; Fichera, L.; Tuccitto, N. Effect of Channel Radius on Fluorescent Nanoparticle Based Molecular Communication. Chemosensors 2022, 10, 29. https://0-doi-org.brum.beds.ac.uk/10.3390/chemosensors10010029
AMA Style
Calì F, Fichera L, Tuccitto N. Effect of Channel Radius on Fluorescent Nanoparticle Based Molecular Communication. Chemosensors. 2022; 10(1):29. https://0-doi-org.brum.beds.ac.uk/10.3390/chemosensors10010029
Chicago/Turabian StyleCalì, Federico, Luca Fichera, and Nunzio Tuccitto. 2022. "Effect of Channel Radius on Fluorescent Nanoparticle Based Molecular Communication" Chemosensors 10, no. 1: 29. https://0-doi-org.brum.beds.ac.uk/10.3390/chemosensors10010029
Note that from the first issue of 2016, this journal uses article numbers instead of page numbers. See further details here.