
Spermine and Spermidine Detection through Restricted Intramolecular Rotations in a Tetraphenylethylene Derivative

 , , , , , and
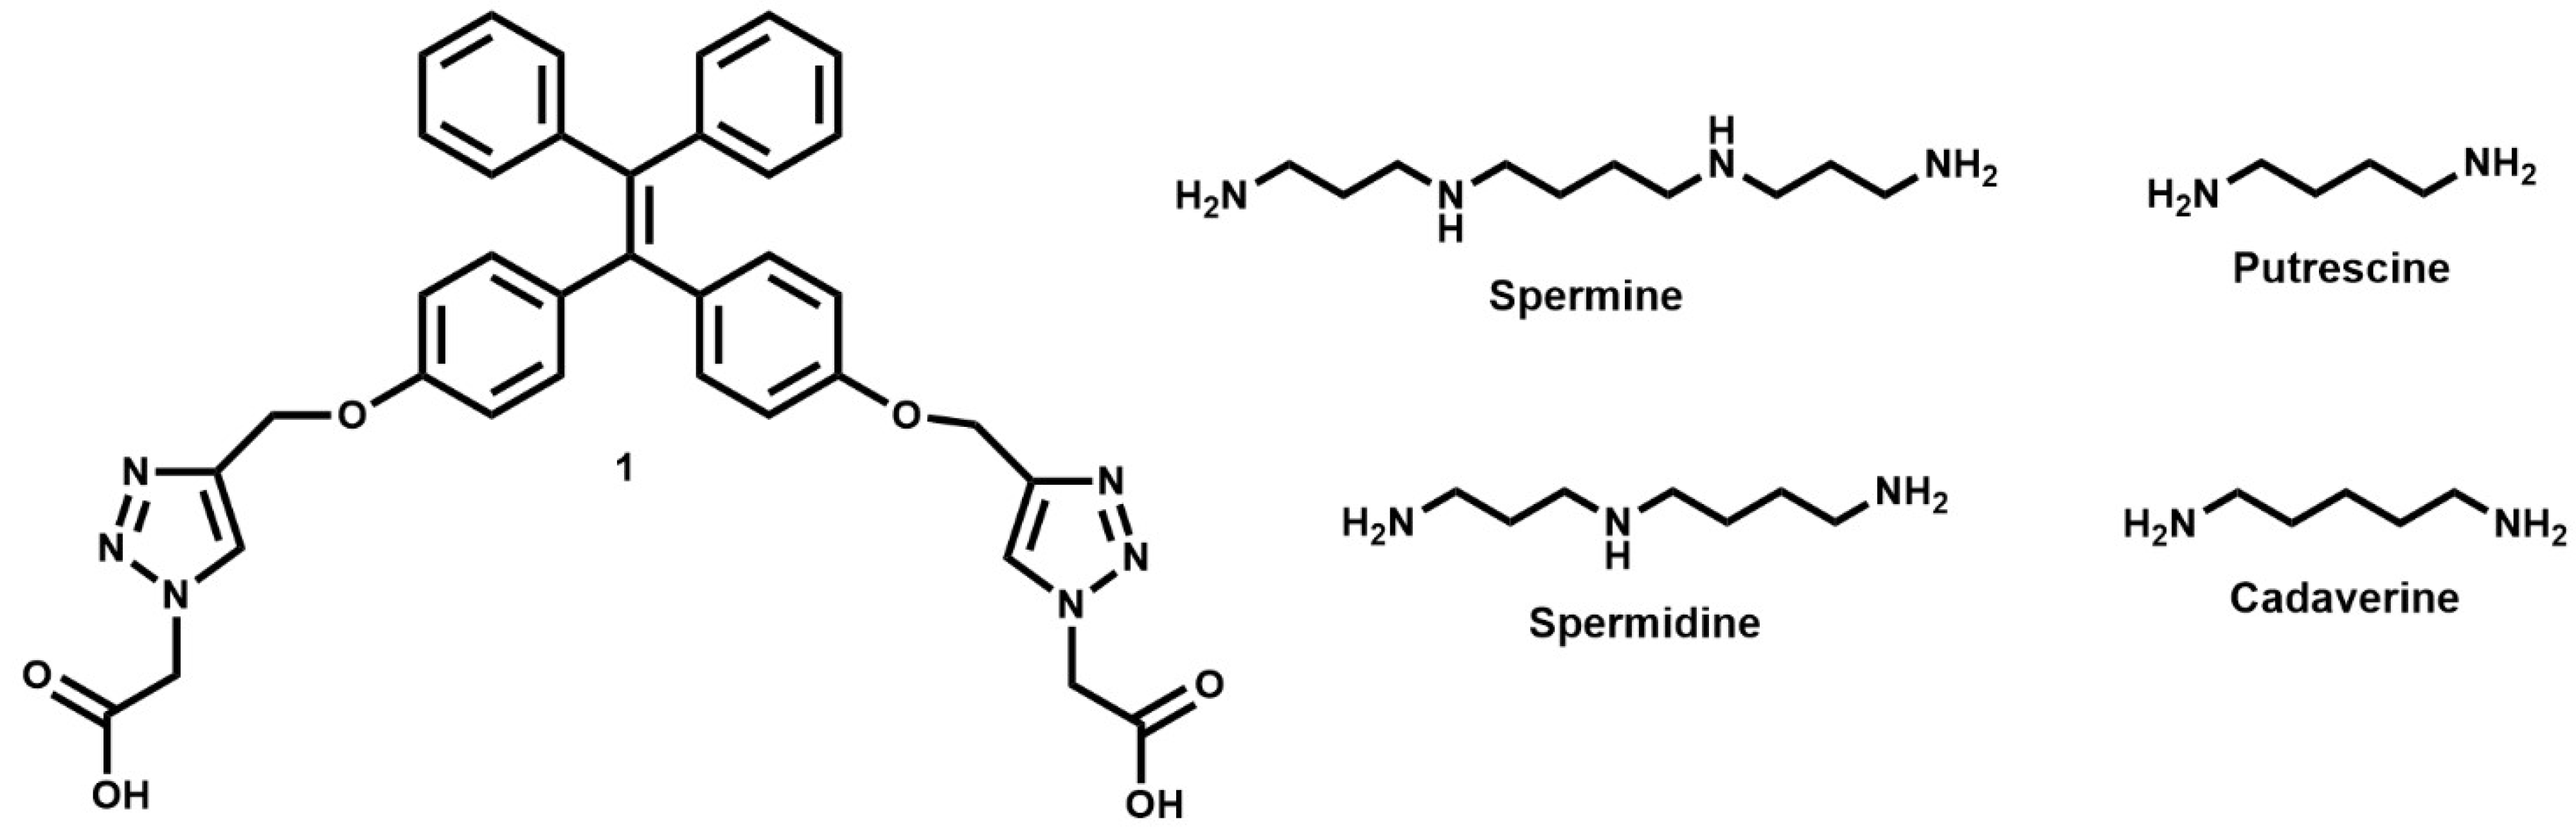
Abstract
:1. Introduction
2. Results and Discussion
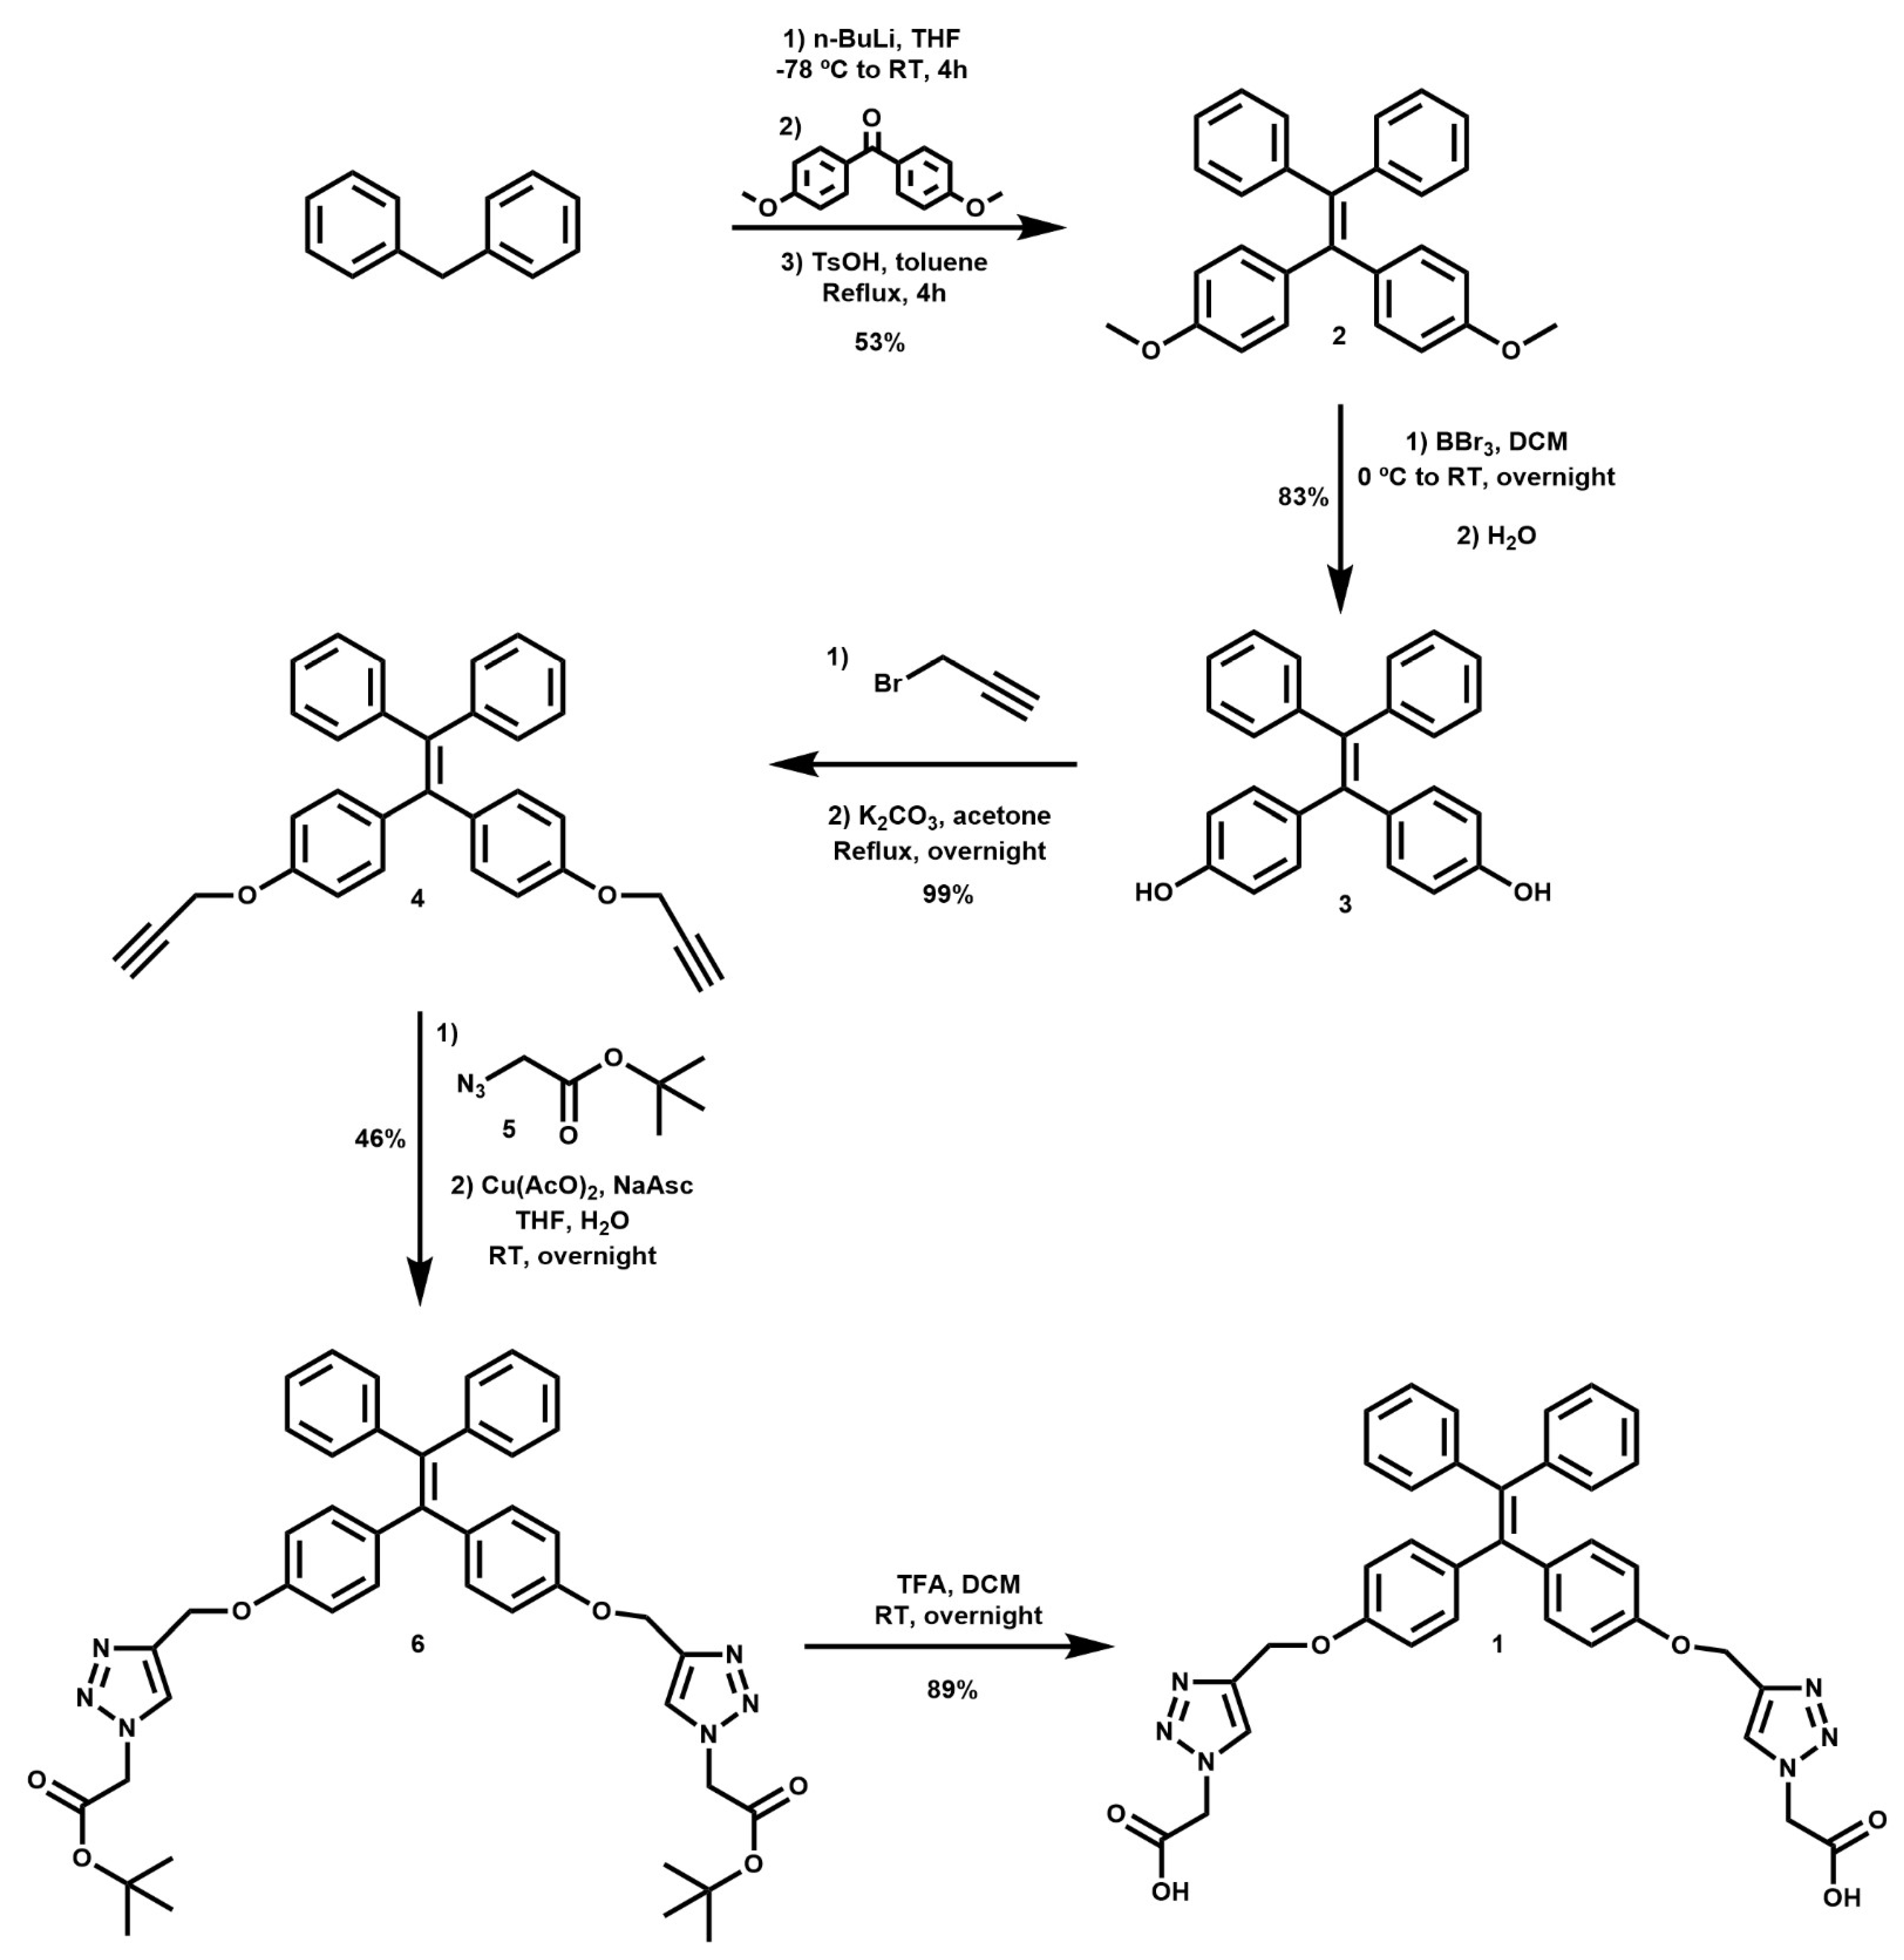
2.1. Synthesis of Chemosensor 1
2.2. Detection Studies
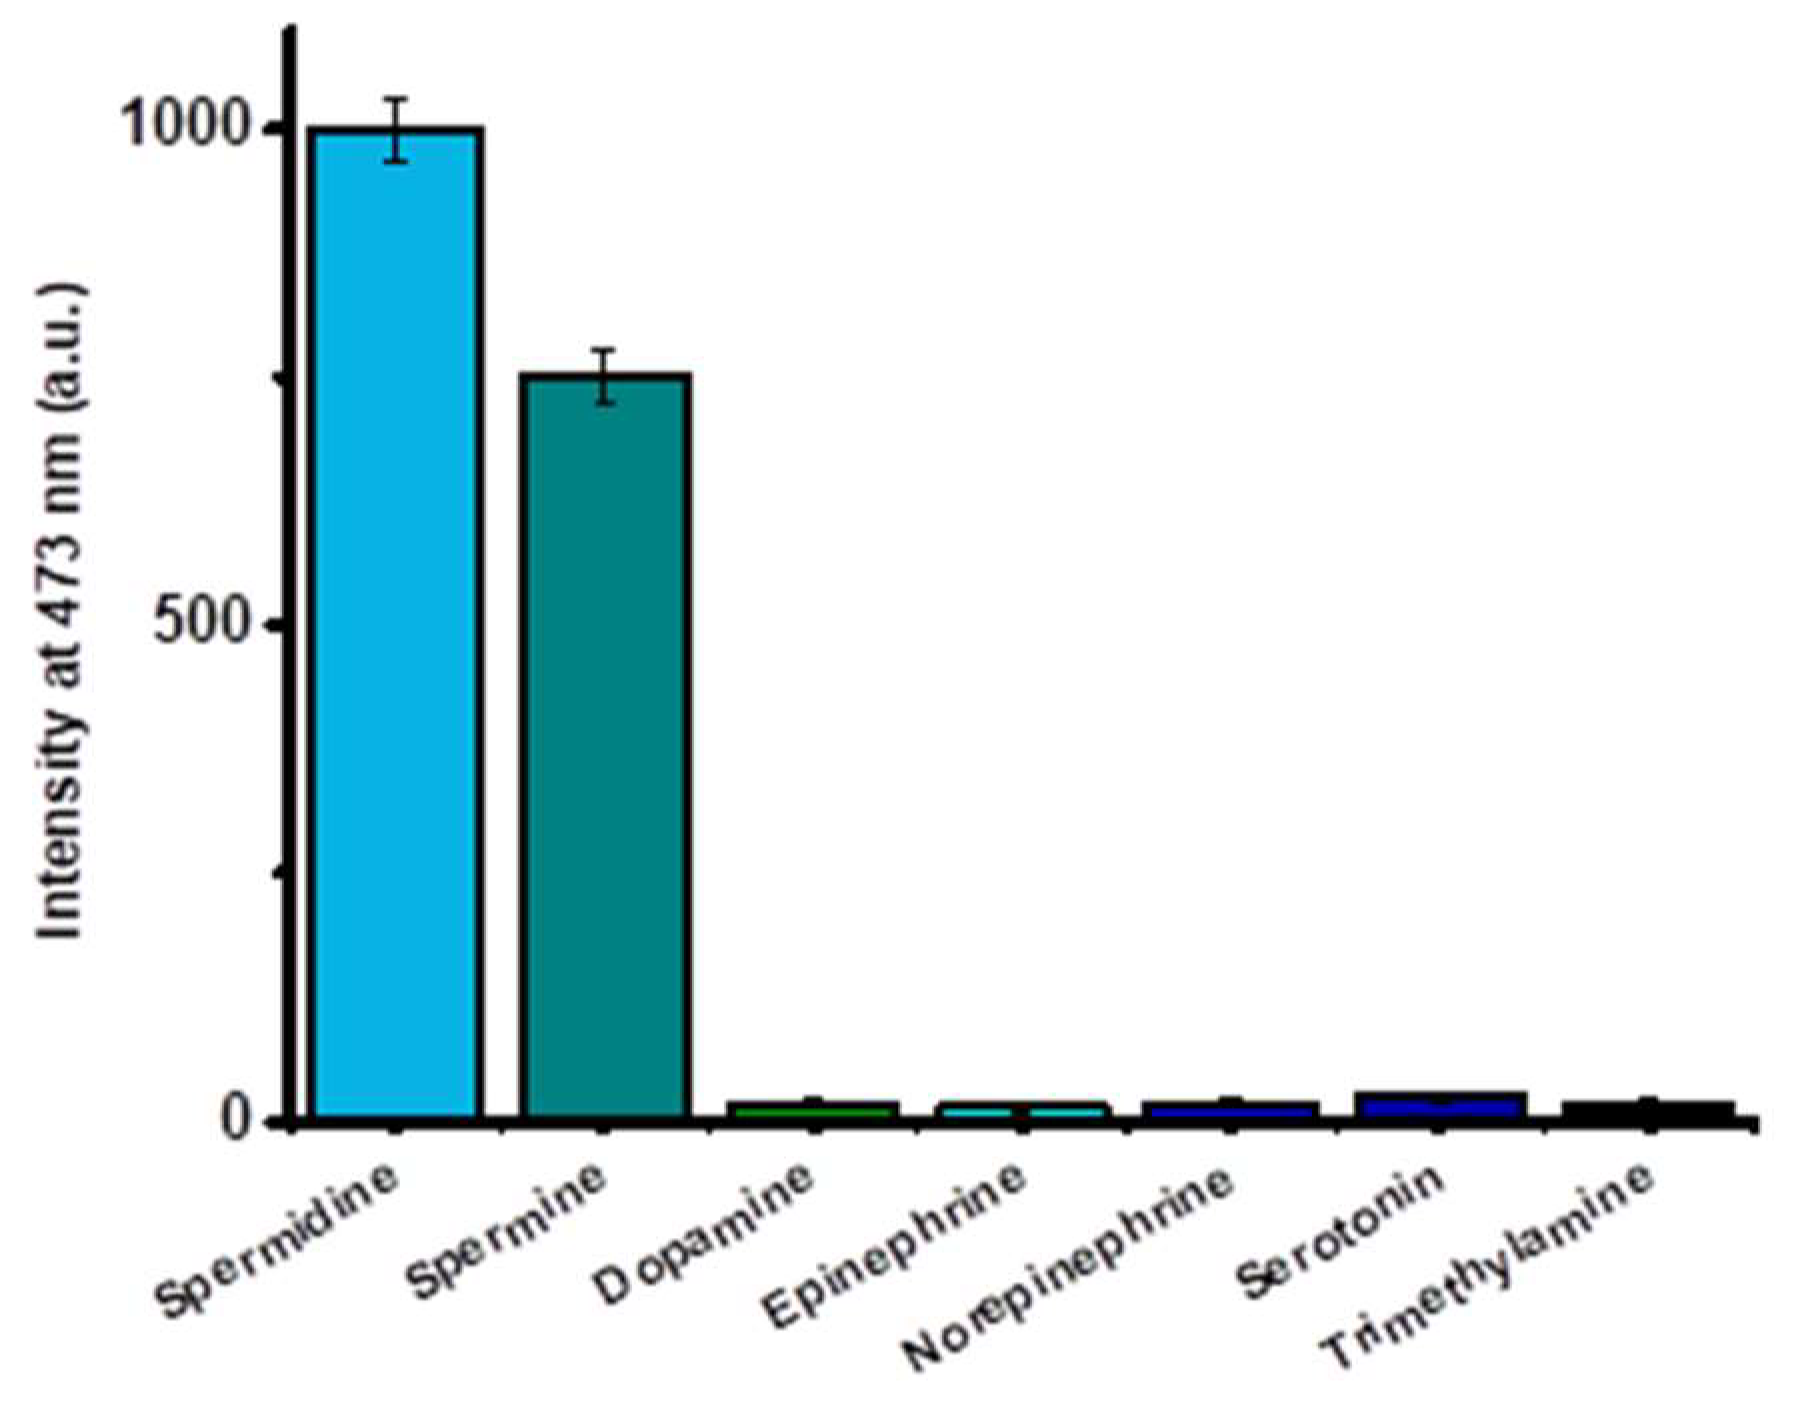
2.3. Selectivity Studies
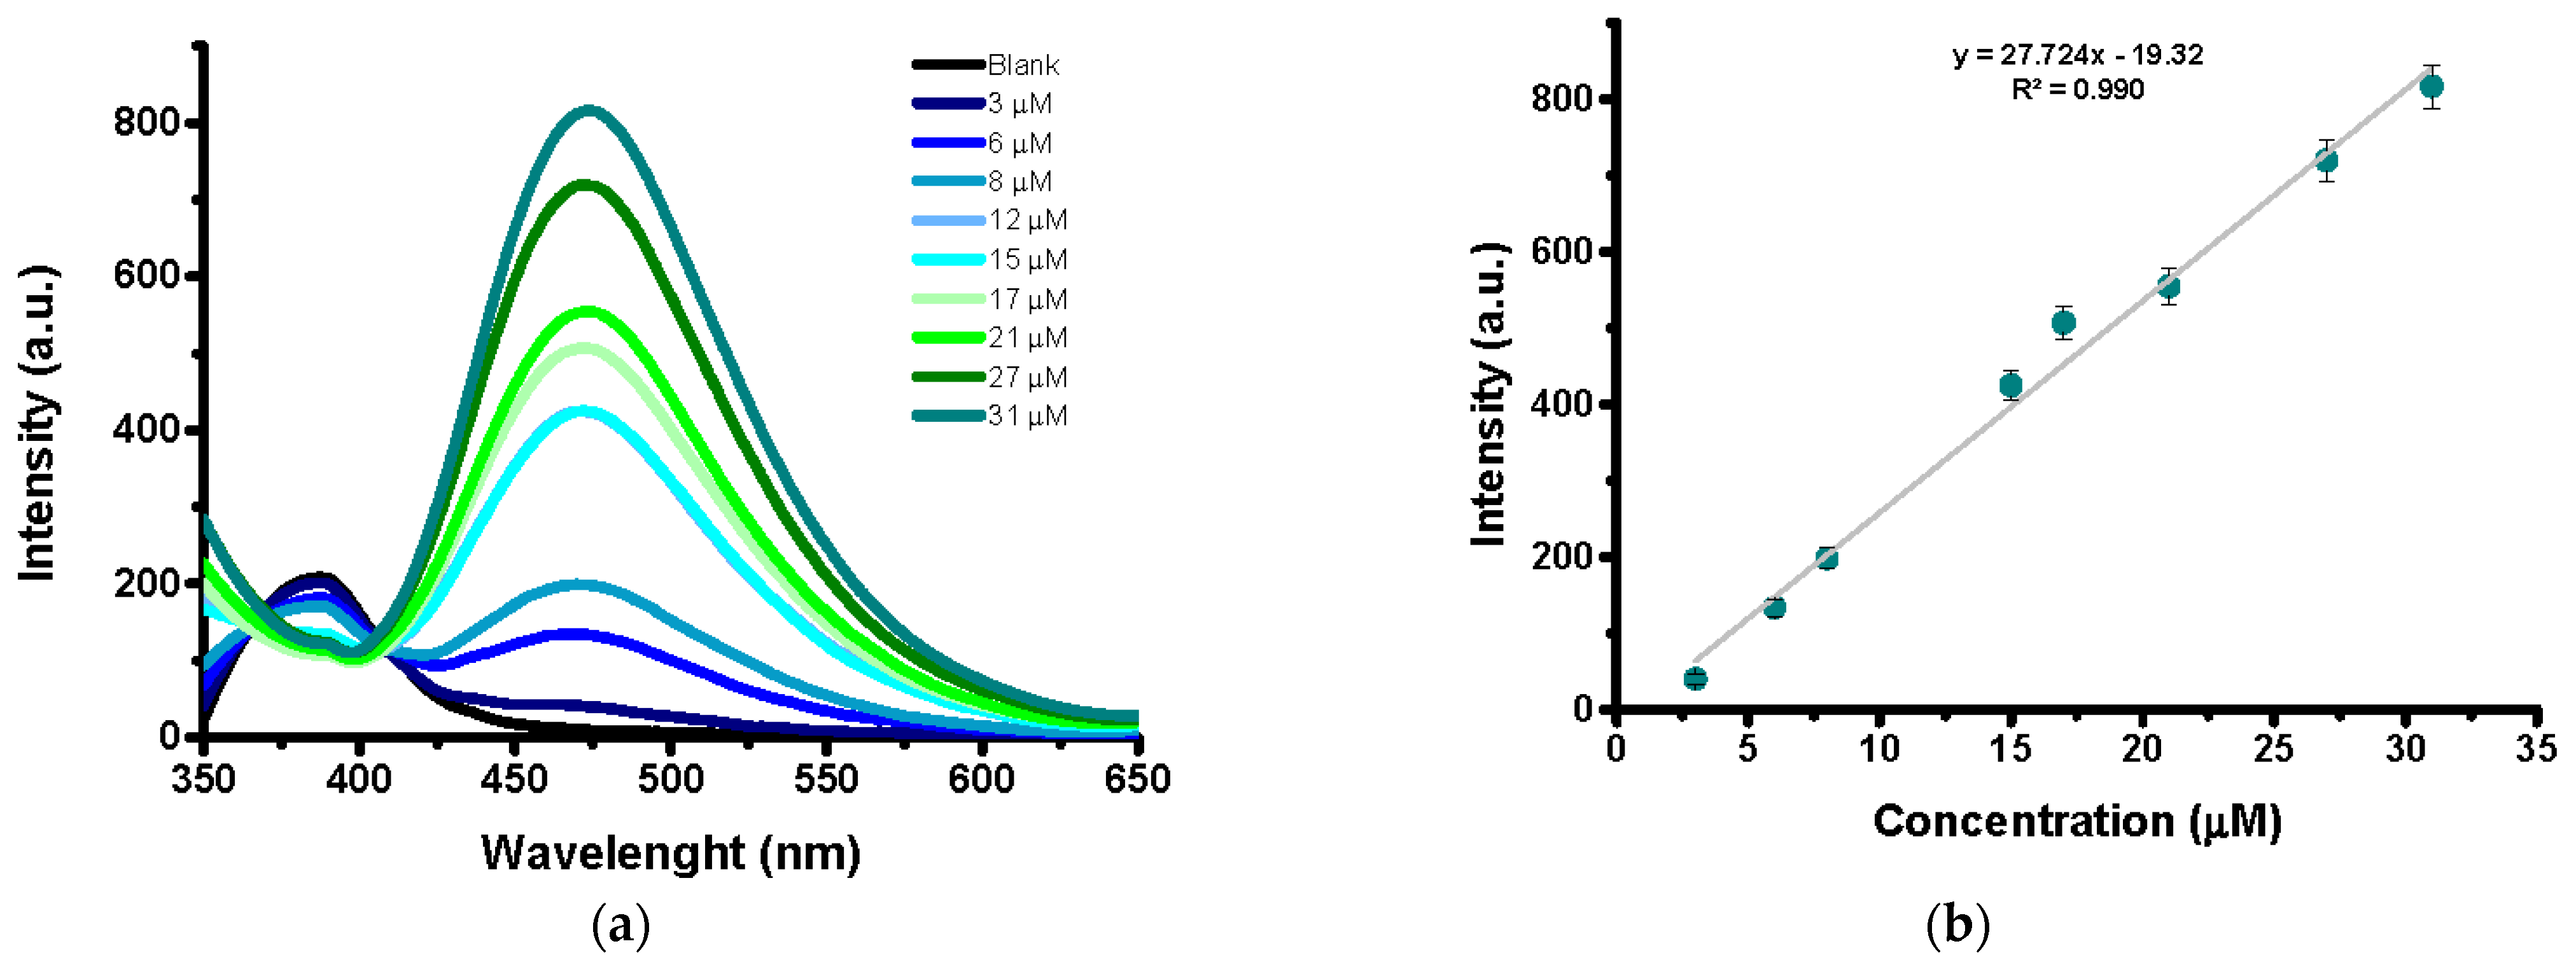
2.4. Sensitivity Studies in Urine
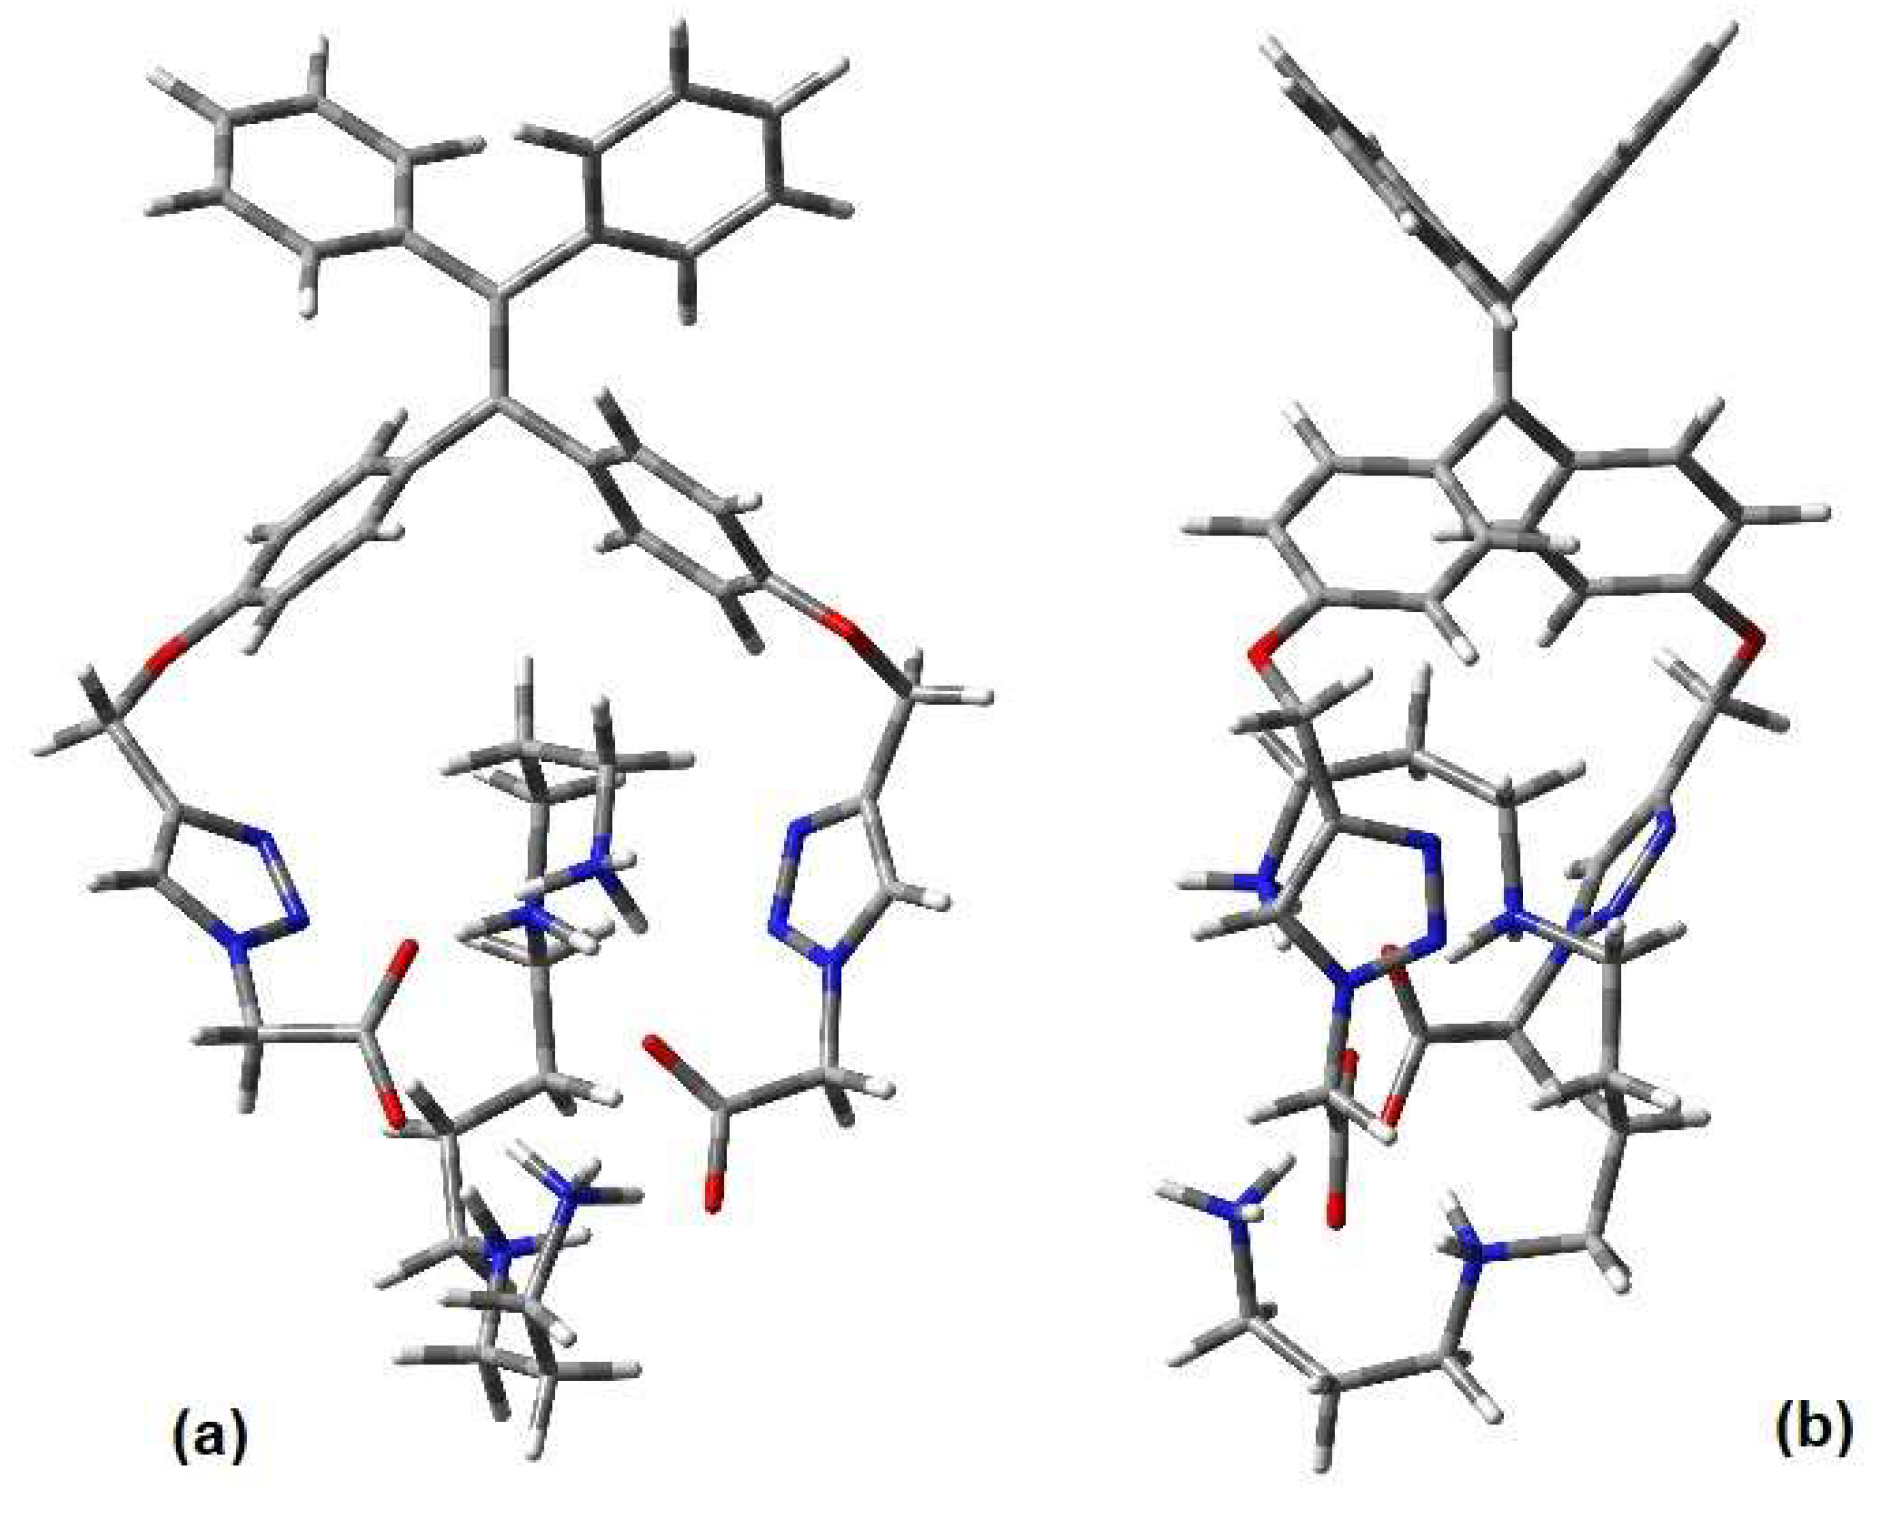
2.5. Theoretical Calculations
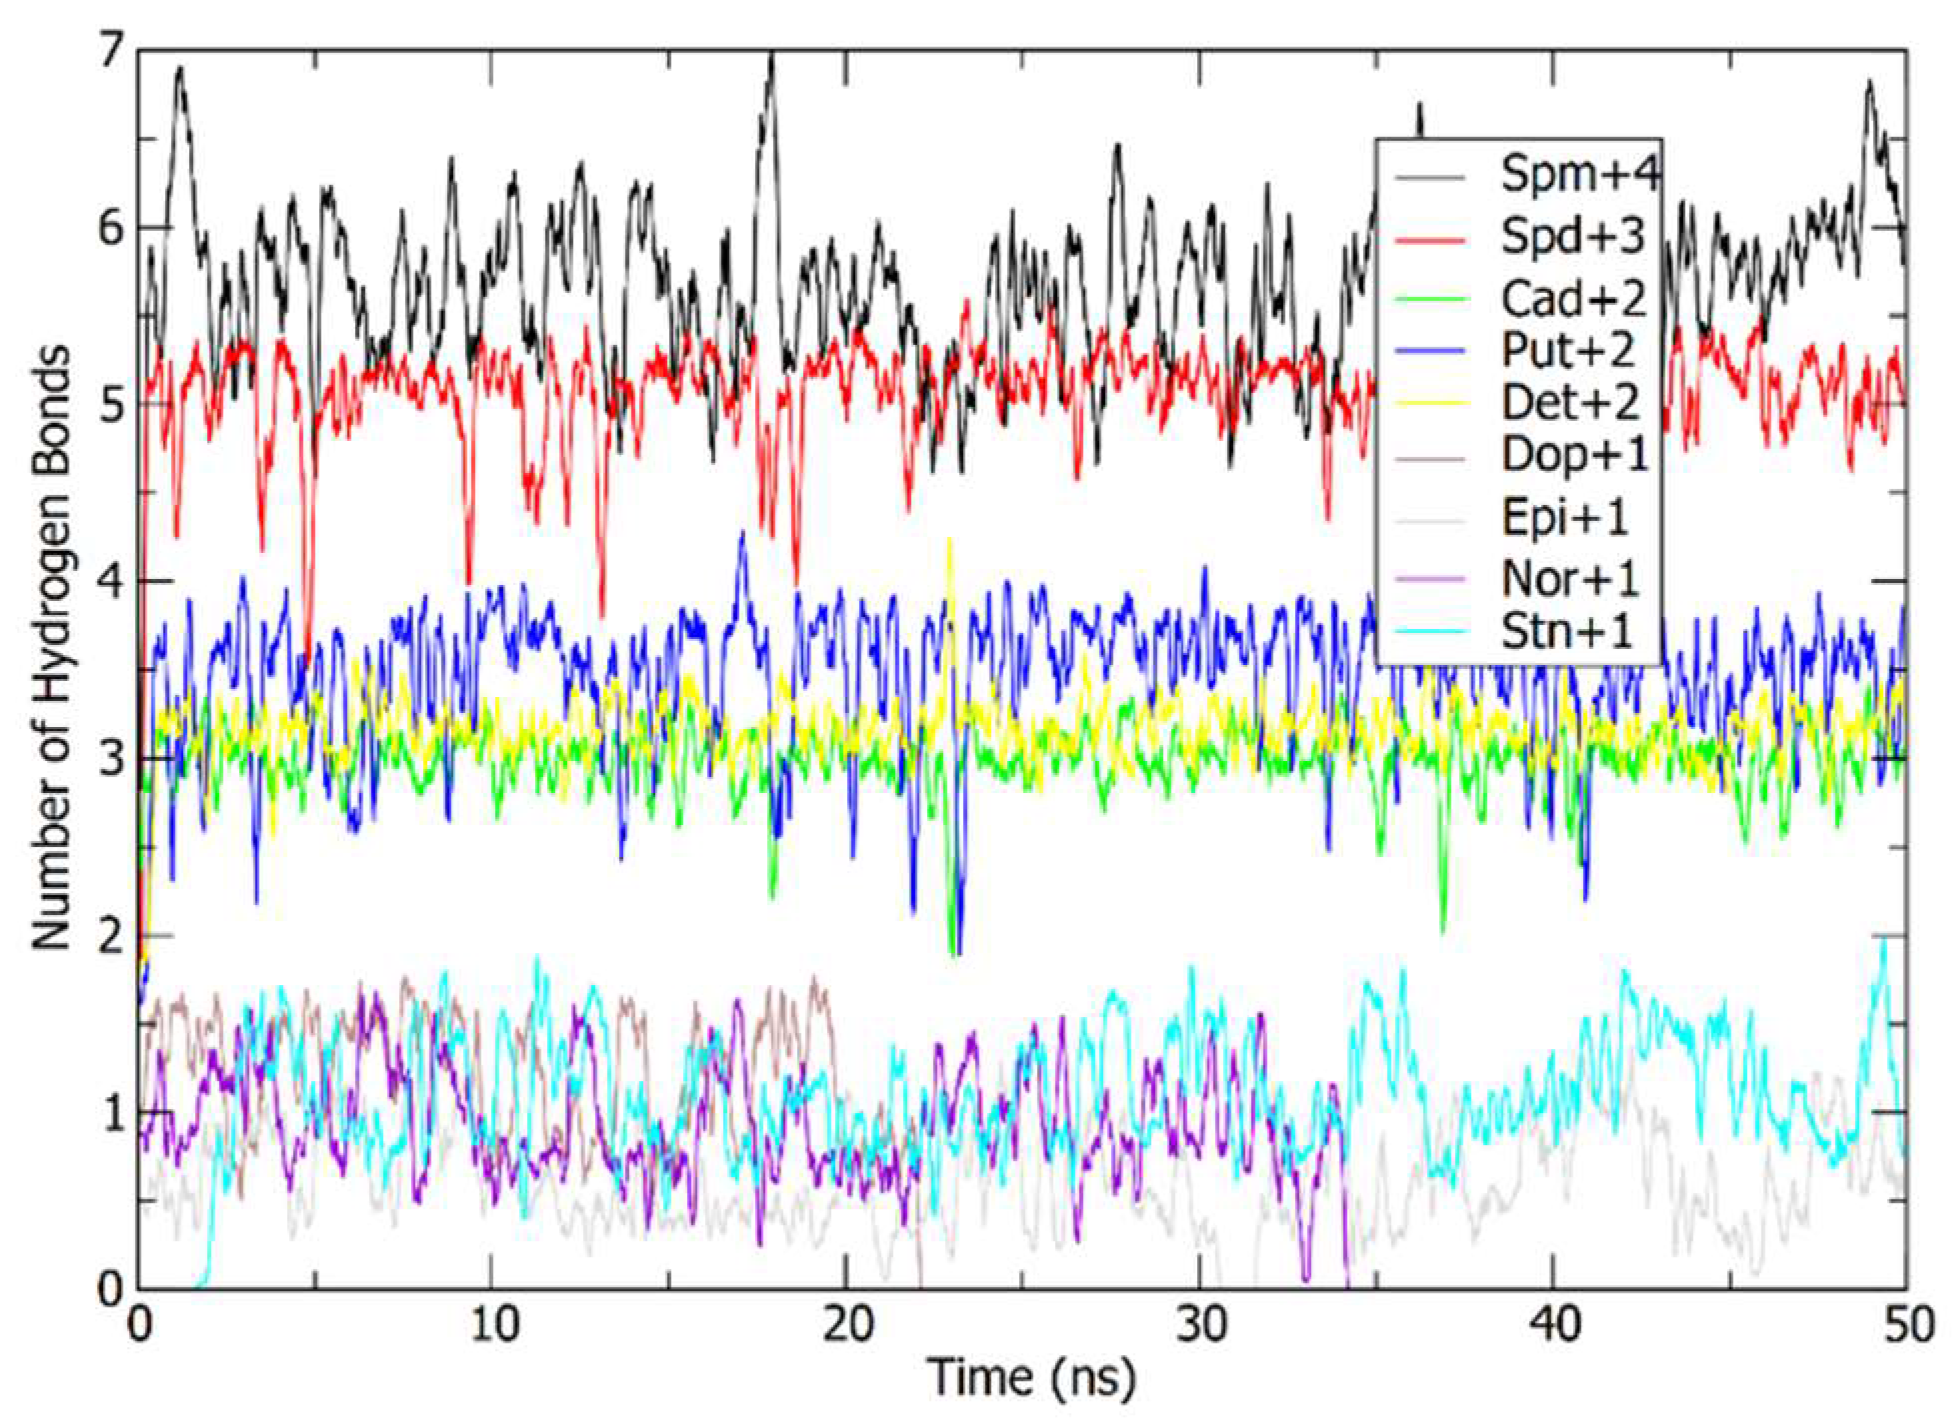
2.5.1. Molecular Dynamics Simulations
2.5.2. DFT Calculations
2.5.3. Complexes’ Geometry Description
2.5.4. Binding Energy Analysis
3. Materials and Methods
3.1. Preparation of 4,4’-(2,2-Diphenylethene-1,1-diyl)bis(methoxybenzene) (2)
3.2. Synthesis of 4,4’-(2,2-Diphenylethene-1,1-diphenyl) Diphenol (3)
3.3. Synthesis of 4,4’-(2,2-Diphenylethene-1,1-diyl)bis((prop-2-yn-1-yloxy) Benzene) (4)
3.4. Synthesis of tert-Butyl 2-Azidoacetate (5)
3.5. Azide-Click CuAAC Synthesis of Di-terc-butyl 2,2’-((((((2,2-Diphenylethene-1,1-diyl)bis(4,1-phenylene)bis(oxy))bis(methylene))bis(1H-1,2,3-triazole-4,1-diyl)diacetate (6)
3.6. Synthesis of Compound 1
3.7. Fluorescence Measurements
3.8. Fluorescence Titrations
4. Conclusions
Supplementary Materials
Author Contributions
Funding
Acknowledgments
Conflicts of Interest
References
- Zhu, H.; Fan, J.; Wang, B.; Peng, X. Fluorescent, MRI, and colorimetric chemical sensors for the first-row d-block metal ions. Chem. Soc. Rev. 2015, 44, 4337–4366. [Google Scholar] [CrossRef] [Green Version]
- Upadhyay, S.; Singh, A.; Sinha, R.; Omer, S.; Negi, K. Colorimetric chemosensors for d-metal ions: A review in the past, present and future prospect. J. Mol. Struct. 2019, 1193, 89–102. [Google Scholar] [CrossRef]
- Bryan, A.J.; De Silva, A.P.; De Silva, S.A.; Rupasinghe, R.D.; Sandanayake, K.S. Photo-induced electron transfer as a general design logic for fluorescent molecular sensors for cations. Biosensors 1989, 4, 169–179. [Google Scholar] [CrossRef]
- Martínez-Máñez, R.; Sancenón, F. Fluorogenic and Chromogenic Chemosensors and Reagents for Anions. Chem. Rev. 2003, 103, 4419–4476. [Google Scholar] [CrossRef]
- Martínez-Máñez, R.; Sancenón, F. Chemodosimeters and 3D Inorganic Functionalised Hosts for the Fluoro-Chromogenic Sensing of Anions. Coord. Chem. Rev. 2006, 250, 3081–3093. [Google Scholar] [CrossRef]
- Mao, L.; Liu, Y.; Yang, S.; Li, Y.; Zhang, X.; Wei, Y. Recent Advances and Progress of Fluorescent Bio-/Chemosensors Based on Aggregation-Induced Emission Molecules. Dyes Pigm. 2019, 162, 611–623. [Google Scholar] [CrossRef]
- Cao, D.; Liu, Z.; Verwilst, P.; Koo, S.; Jangjili, P.; Kim, J.S.; Lin, W. Coumarin-based small-molecule fluorescent chemosensors. Chem. Rev. 2019, 119, 10403–10519. [Google Scholar] [CrossRef]
- Chae, J.B.; Yun, D.; Lee, H.; Lee, H.; Kim, K.T.; Kim, C. Highly Sensitive Dansyl-Based Chemosensor for Detection of Cu2+ in Aqueous Solution and Zebrafish. ACS Omega 2019, 4, 12537–12543. [Google Scholar] [CrossRef] [PubMed] [Green Version]
- Kim, T.I.; Kim, Y. Analyte-directed formation of emissive excimers for the selective detection of polyamines. Chem. Commun. 2016, 52, 10648–10651. [Google Scholar] [CrossRef]
- VanDenburgh, K.L.; Liu, Y.; Sadhukhan, T.; Benson, C.R.; Cox, N.M.; Erbas-Cakmak, S.; Flood, A.H. Multi-state amine sensing by electron transfers in a BODIPY probe. Org. Biomol. Chem. 2020, 18, 431–440. [Google Scholar] [CrossRef]
- Satrijo, A.; Swager, T.M. Anthryl-doped conjugated polyelectrolytes as aggregation-based sensors for nonquenching multicationic analytes. J. Am. Chem. Soc. 2007, 129, 16020–16028. [Google Scholar] [CrossRef] [PubMed]
- Bao, B.; Yuwen, L.; Zheng, X.; Weng, L.; Zhu, X.; Zhan, X.; Wang, L. A fluorescent conjugated polymer for trace detection of diamines and biogenic polyamines. J. Mater. Chem. 2010, 20, 9628–9634. [Google Scholar] [CrossRef]
- Mei, J.; Hong, Y.; Lam, J.W.Y.; Qin, A.; Tang, Y.; Tang, B.Z. Aggregation-Induced Emission: The Whole Is More Brilliant than the Parts. Adv. Mater. 2014, 26, 5429–5479. [Google Scholar] [CrossRef]
- Liu, Y.; Deng, C.; Tang, L.; Qin, A.; Hu, R.; Sun, J.Z.; Tang, B.Z. Specific Detection of D-Glucose by a Tetraphenylethene-Based Fluorescent Sensor. J. Am. Chem. Soc. 2011, 133, 660–663. [Google Scholar] [CrossRef] [PubMed]
- Rodriguez-Nuevalos, S.; Parra, M.; Ceballos, S.; Gil, S.; Costero, A.M. A nitric oxide induced “click” reaction to trigger the aggregation induced emission (AIE) phenomena of a tetraphenyl ethylene derivative: A new fluorescent probe for NO. J. Photochem. Photobiol. 2020, 388, 112132. [Google Scholar] [CrossRef]
- Pan, Y.Q.; Xu, X.; Zhang, Y.; Zhang, Y.; Dong, W.K. A highly sensitive and selective bis (salamo)-type fluorescent chemosensor for identification of Cu2+ and the continuous recognition of S2−, Arginine and Lysine. Spectrochim. Acta A Mol. Biomol. Spectrosc. 2020, 229, 117927. [Google Scholar] [CrossRef] [PubMed]
- Wang, Y.; Liu, H.; Chen, Z.; Pu, S. Aggregation-induced emission enhancement (AIEE)-active tetraphenylethene (TPE)-based chemosensor for CN−. Spectrochim. Acta A Mol. Biomol. Spectrosc. 2021, 245, 118928. [Google Scholar] [CrossRef]
- Liu, Y.; Yu, Y.; Lam, J.W.; Hong, Y.; Faisal, M.; Yuan, W.Z.; Tang, B.Z. Simple Biosensor with High Selectivity and Sensitivity: Thiol-Specific Biomolecular Probing and Intracellular Imaging by AIE Fluorogen on a TLC Plate through a Thiol–Ene Click Mechanism. Chem. Eur. J. 2010, 16, 8433–8438. [Google Scholar] [CrossRef] [PubMed]
- Han, K.; Cho, B.K. Chain-dependent emission color codes of extended tetraphenylethylene derivatives: Discrimination between water and methanol. RSC. Adv. 2015, 5, 9510–9517. [Google Scholar] [CrossRef]
- Lenis, Y.Y.; Elmetwally, M.A.; Maldonado-Estrada, J.G.; Bazer, F.W. Physiological importance of polyamines. Zygote. 2017, 25, 244–255. [Google Scholar] [CrossRef]
- Sagar, N.A.; Tarafdar, S.; Agarwal, S.; Tarafdar, A.; Sharma, S. Polyamines: Functions, Metabolism, and Role in Human Disease Management. Med. Sci. 2021, 9, 44. [Google Scholar] [CrossRef] [PubMed]
- Tabor, C.W.; Tabor, H. Polyamines. Ann. Rev. Biochem. 1984, 53, 749–790. [Google Scholar] [CrossRef] [PubMed]
- Bae, D.H.; Lane, D.J.; Jansson, P.J.; Richardson, D.R. The old and new biochemistry of polyamines. Biochim. Biophys. Acta. Gen. Subj. 2018, 1862, 2053–2068. [Google Scholar] [CrossRef] [PubMed]
- Morgan, D.M. Polyamines. Mol. Biotechnol. 1999, 11, 229–250. [Google Scholar] [CrossRef] [PubMed]
- Nowotarski, S.L.; Woster, P.M.; Casero, R.A., Jr. Polyamines and cancer: Implications for chemotherapy and chemoprevention. Expert Rev. Mol. Med. 2013, 15, e3. [Google Scholar] [CrossRef] [PubMed] [Green Version]
- Damiani, E.; Wallace, H.M. Polyamines and Cancer. In Polyamines. Methods and Protocols; Alcázar, R., Tiburcio, A., Eds.; Humana Press: New York, NY, USA, 2018; Volume 1694, pp. 469–488. [Google Scholar] [CrossRef]
- Gerner, E.W.; Meyskens, F.L. Polyamines and cancer: Old molecules, new understanding. Nat. Rev. Cancer. 2004, 4, 781–792. [Google Scholar] [CrossRef] [Green Version]
- Wallace, H.M.; Duthie, J.; Evans, D.M.; Lamond, S.; Nicoll, K.M.; Heys, S.D. Alterations in polyamine catabolic enzymes in human breast cancer tissue. Clin. Cancer. Res. 2000, 6, 3657–3661. [Google Scholar]
- Ignatenko, N.A.; Gerner, E.W.; Besselsen, D.G. Defining the role of polyamines in colon carcinogenesis using mouse models. J. Carcinog. 2011, 10, 10. [Google Scholar] [CrossRef]
- Min, J.Z.; Matsumoto, A.; Li, G.; Jiang, Y.Z.; Yu, H.F.; Todoroki, K.; Toyo’oka, T. A quantitative analysis of the polyamine in lung cancer patient fingernails by LC-ESI-MS/MS. Biomed. Chromatogr. 2014, 28, 492–499. [Google Scholar] [CrossRef] [PubMed]
- Schipper, R.G.; Romijn, J.C.; Cuijpers, V.M.J.I.; Verhofstad, A.A.J. Polyamines and prostatic cancer. Biochem. Soc. Trans. 2003, 31, 375–380. [Google Scholar] [CrossRef] [PubMed]
- Gilmour, S.K. Polyamines and nonmelanoma skin cancer. Toxicol. Appl. Pharmacol. 2007, 224, 249–256. [Google Scholar] [CrossRef] [PubMed] [Green Version]
- Niemi, R.J.; Roine, A.N.; Häkkinen, M.R.; Kumpulainen, P.S.; Keinänen, T.A.; Vepsäläinen, J.J.; Mäenpää, J.U. Urinary polyamines as biomarkers for ovarian cancer. Int. J. Gynecol. Cancer. 2017, 27, 1360–1366. [Google Scholar] [CrossRef] [Green Version]
- Madeo, F.; Bauer, M.A.; Carmona-Gutierrez, D.; Kroemer, G. Spermidine: A physiological autophagy inducer acting as an anti-aging vitamin in humans? Autophagy 2019, 15, 165–168. [Google Scholar] [CrossRef] [PubMed]
- Godoy-Reyes, T.M.; Llopis-Lorente, A.; García-Fernández, A.; Gaviña, P.; Costero, A.M.; Martínez-Máñez, R.; Sancenón, F. Acetylcholine-responsive cargo release using acetylcholinesterase-capped nanomaterials. Chem. Commun. 2019, 55, 5785–5788. [Google Scholar] [CrossRef]
- Godoy-Reyes, T.M.; Llopis-Lorente, A.; García-Fernández, A.; Gaviña, P.; Costero, A.M.; Villalonga, R.; Martínez-Máñez, R.A. L-glutamate-responsive delivery system based on enzyme-controlled self-immolative arylboronategated nanoparticles. Org. Chem. Front. 2019, 6, 1058–1063. [Google Scholar] [CrossRef]
- Godoy-Reyes, T.M.; Costero, A.M.; Gaviña, P.; Martínez-Máñez, R.; Sancenón, F. A Colorimetric Probe for the Selective Detection of Norepinephrine Based on a Double Molecular Recognition with Functionalized Gold Nanoparticles. ACS Appl. Nano Mater. 2019, 2, 1367–1373. [Google Scholar] [CrossRef]
- Ramakrishnam Raju, M.V.; Lin, H.C. Self-assembly of Tetraphenylethene-based [2]catenane driven by acid–base-controllable molecular switching and its enabled aggregation-induced emission. Org. Lett. 2014, 16, 5564–5567. [Google Scholar] [CrossRef] [PubMed]
- Ma, Y.; Zeng, Y.; Liang, H.; Ho, C.L.; Zhao, Q.; Huang, W.; Wong, W.Y. A water-soluble tetraphenylethene based probe for luminescent carbon dioxide detection and its biological application. J. Mater. Chem. 2015, 3, 11850–11856. [Google Scholar] [CrossRef]
- Russell, D.H. Increased polyamine concentrations in the urine of human cancer patients. Nat. Cell Biol. 1971, 233, 144–145. [Google Scholar] [CrossRef] [PubMed]
- Jiang, X. Determination of polyamines in urine of normal human and cancer patients by capillary gas chromatography. Biomed. Chromatogr. 1990, 4, 73–77. [Google Scholar] [CrossRef] [PubMed]
- Chemicalize. Available online: https://chemicalize.com/ (accessed on 31 March 2021).
- Case, D.A.; Darden, T.A.; Cheatham, T.E., III; Simmerling, C.L.; Wang, J.; Duke, R.E.; Luo, R.; Walker, R.C.; Zhang, W.; Merz, K.M.; et al. AMBER 12; University of California: San Francisco, CA, USA, 2012. [Google Scholar]
- Zhao, Y.; Truhlar, D.G. The M06 suite of density functionals for main group thermochemistry, thermochemical kinetics, nonscovalent interactions, excited states, and transition elements: Two new functionals and systematic testing of four M06-class functionals and 12 other functionals. Theor. Chem. Acc. 2008, 120, 215–241. [Google Scholar] [CrossRef] [Green Version]
- Ditchfield, R.; Hehre, W.J.; People, J.A. Self-Consistent Molecular Orbital Methods. 9. Extended Gaussian-type basis for molecular-orbital studies of organic molecules. J. Chem. Phys. 1971, 54, 724. [Google Scholar] [CrossRef]
- Grimme, S.; Antony, J.; Ehrlich, S.; Krieg, H. A consistent and accurate ab initio parameterization of density functional dispersion correction (DFT-D) for the 94 elements H-Pu. J. Chem. Phys. 2010, 132, 154104. [Google Scholar] [CrossRef] [PubMed] [Green Version]
- Frisch, M.J.; Trucks, G.W.; Schlegel, H.B.; Scuseria, G.E.; Robb, M.A.; Cheeseman, J.R.; Scalmani, G.; Barone, V.; Petersson, G.A.; Nakatsuji, H.; et al. Gaussian 16; Revision A.03; Gaussian, Inc.: Wallingford, CT, USA, 2016. [Google Scholar]
- Computational Chemistry Comparison and Benchmark DataBase. Available online: https://cccbdb.nist.gov/vibscalejustx.asp (accessed on 31 March 2021).


Publisher’s Note: MDPI stays neutral with regard to jurisdictional claims in published maps and institutional affiliations. |
© 2021 by the authors. Licensee MDPI, Basel, Switzerland. This article is an open access article distributed under the terms and conditions of the Creative Commons Attribution (CC BY) license (https://creativecommons.org/licenses/by/4.0/).
Share and Cite
Barros, M.; Ceballos, S.; Arroyo, P.; Sáez, J.A.; Parra, M.; Gil, S.; Costero, A.M.; Gaviña, P. Spermine and Spermidine Detection through Restricted Intramolecular Rotations in a Tetraphenylethylene Derivative. Chemosensors 2022, 10, 8. https://0-doi-org.brum.beds.ac.uk/10.3390/chemosensors10010008
Barros M, Ceballos S, Arroyo P, Sáez JA, Parra M, Gil S, Costero AM, Gaviña P. Spermine and Spermidine Detection through Restricted Intramolecular Rotations in a Tetraphenylethylene Derivative. Chemosensors. 2022; 10(1):8. https://0-doi-org.brum.beds.ac.uk/10.3390/chemosensors10010008
Chicago/Turabian StyleBarros, Mariana, Samuel Ceballos, Pau Arroyo, José Antonio Sáez, Margarita Parra, Salvador Gil, Ana María Costero, and Pablo Gaviña. 2022. "Spermine and Spermidine Detection through Restricted Intramolecular Rotations in a Tetraphenylethylene Derivative" Chemosensors 10, no. 1: 8. https://0-doi-org.brum.beds.ac.uk/10.3390/chemosensors10010008