Article

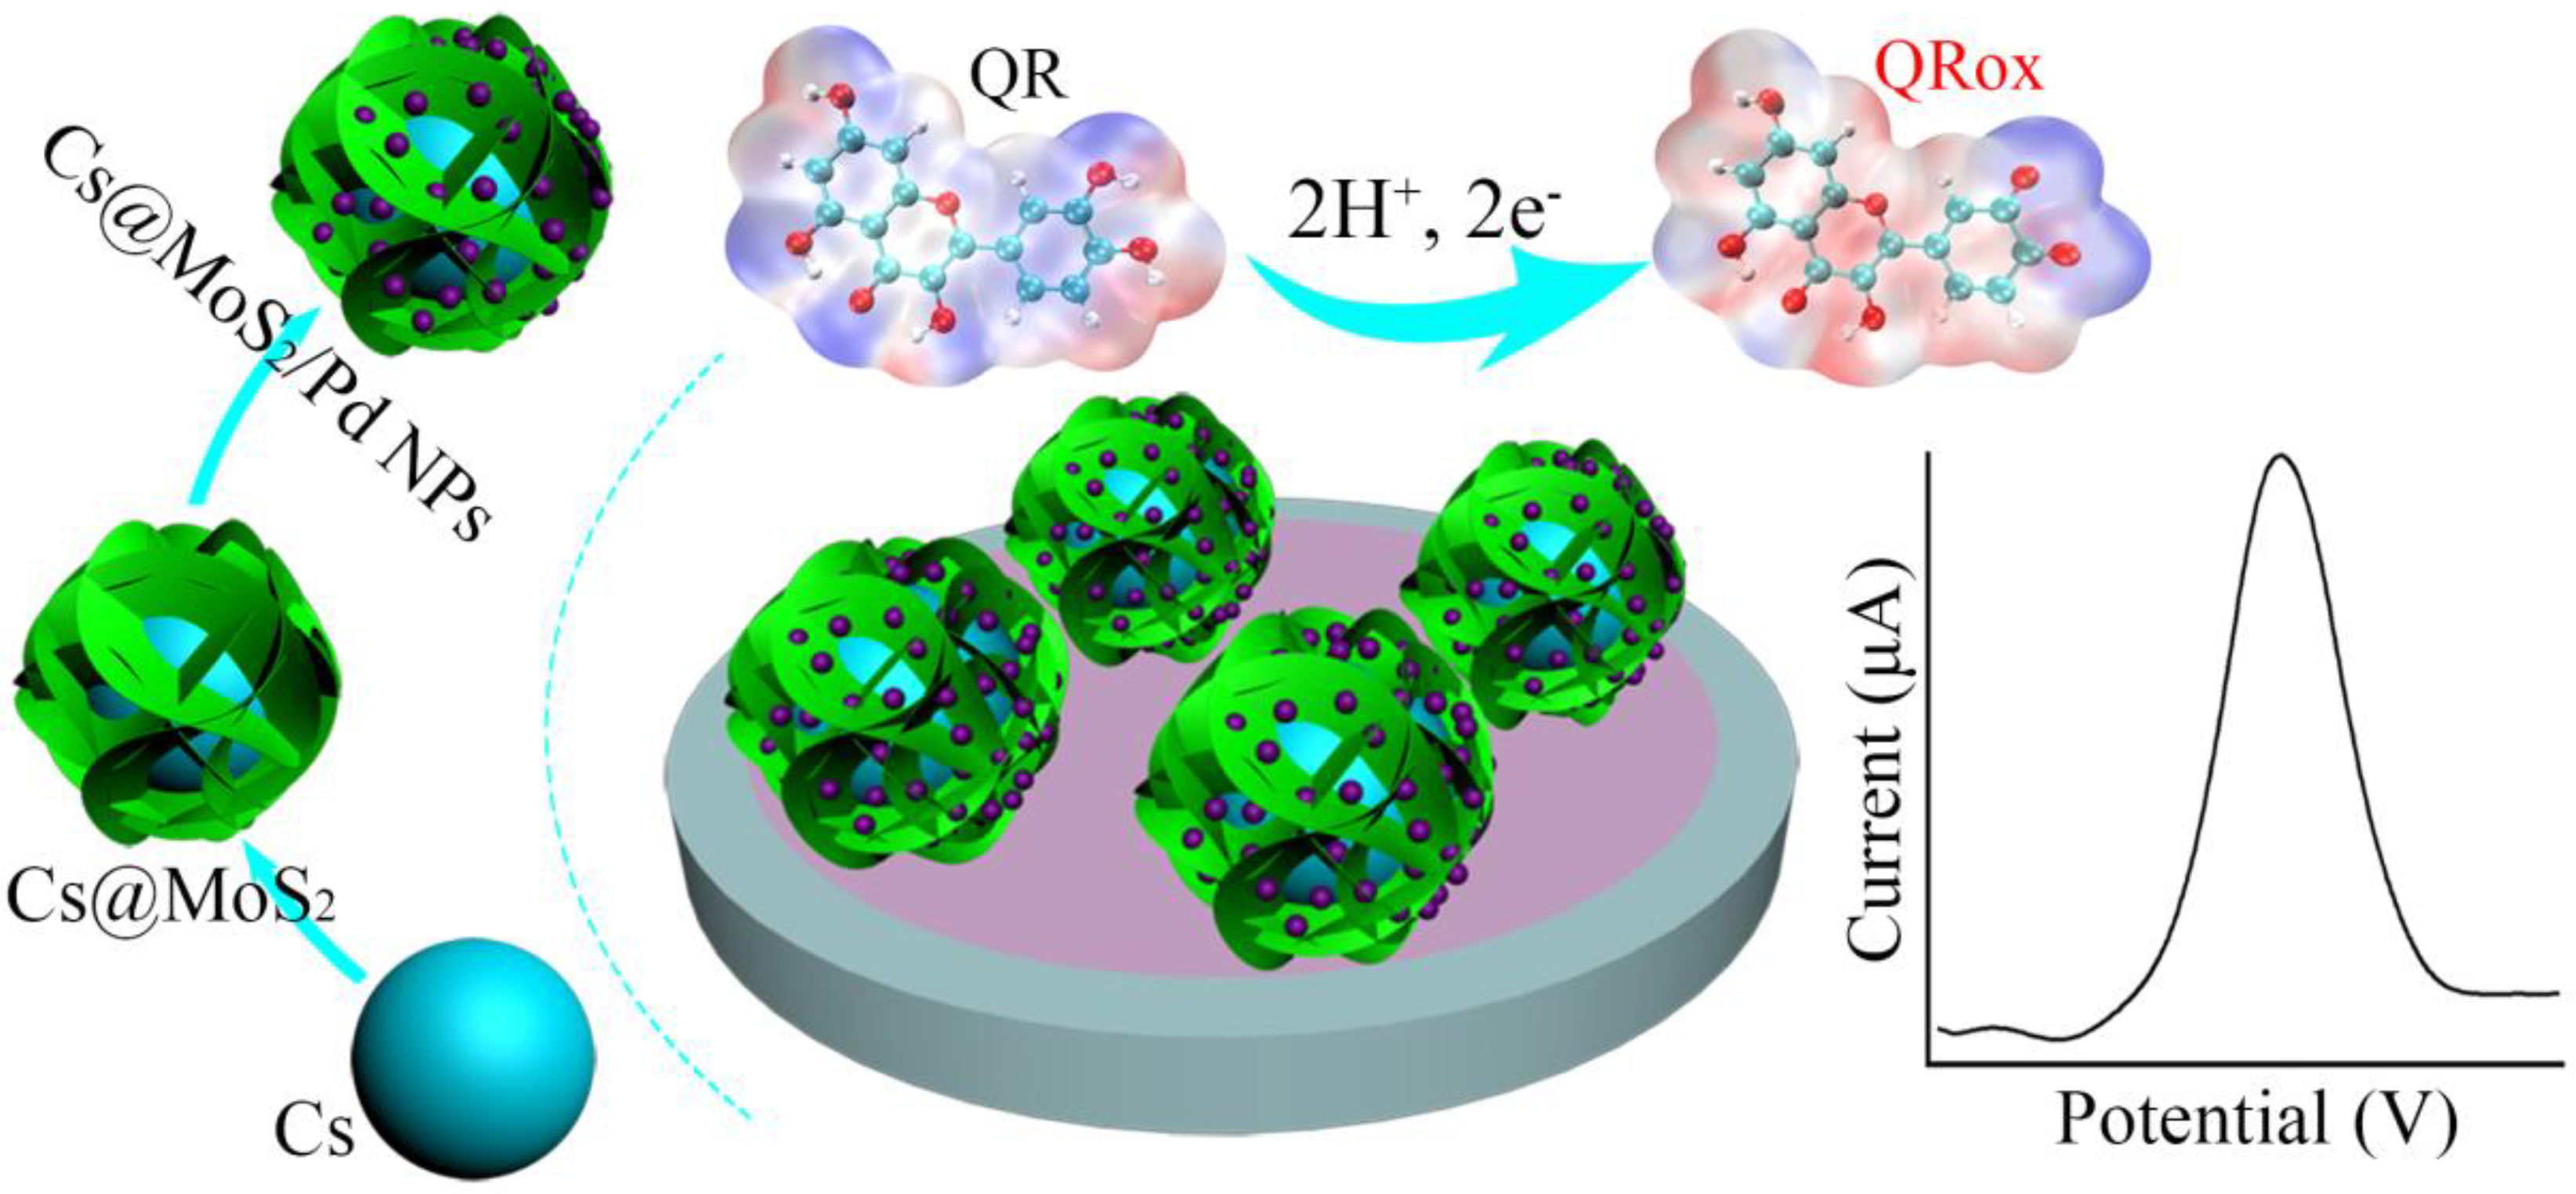
Palladium Nanoparticle-Modified Carbon Spheres @ Molybdenum Disulfide Core-Shell Composite for Electrochemically Detecting Quercetin

1
School of Chemistry and Chemical Engineering, Nanjing University of Science and Technology, Nanjing 210094, China
2
Jiangsu Key Laboratory of Advanced Catalytic Materials and Technology, Changzhou University, Changzhou 213164, China
*
Author to whom correspondence should be addressed.
Submission received: 15 December 2021 / Revised: 12 January 2022 / Accepted: 26 January 2022 / Published: 30 January 2022

Abstract

:
Quercetin (QR), abundant in plants, is used to treat colitis and gastric ulcer and is also a promising anticancer agent. To quantificationally detect QR, a sensitive electrochemical sensor was fabricated by palladium nanoparticles loaded on carbon sphere @ molybdenum disulfide nanosheet core-shell composites (Cs@MoS2-Pd NPs). The Cs@MoS2-Pd NPs worked to remedy the shortcomings of MoS2 and exhibited good catalytic activity to QR. The oxidation reaction of QR on Cs@MoS2-Pd NPs/GCE involved two electrons and two protons. Furthermore, the molecular surface for electrostatic potential, Laplacian bond order, and Gibbs free energy were computationally simulated to speculate the order and site of the oxidation of QR. The results showed that the 4′ O–H and 3′ O–H broke successively during the oxidation reaction. When the concentration of QR was within 0.5 to 12 μM, the fabricated sensor could achieve linear detection, and the detection limit was 0.02 μM (S/N = 3). In addition, the sensor possessed good selectivity, repeatability, and stability, which has a broad prospect in practical application.

1. Introduction

Quercetin (3,5,7,3′,4′-pentahydroxyflavone, QR), a most important bioflavonoid, can be found in many plant samples, such as tea, apple, and dendrobe [1]. Its phenolic hydroxyl groups have reducibility and produce a complex reaction with metal ions, which can scavenge free radicals and protect the oxidation of DNA in vitro [2]. Thus, QR has acted in many biological roles such as anti-oxidant, anti-inflammatory, and anti-cancer roles [3,4]. QR is also used to treat colitis, gastric ulcer, and oral ulcer [5]. Moreover, it also exerts a pro-apoptotic effect on cancer cells and blocks the growth of tumor cells [6]. Therefore, the accurate determination of QR in biochemistry and natural pharmaceutical chemistry has attracted increasing interest [7]. The typical methods for analyzing QR are high-performance liquid chromatography with ultraviolet detection [8], tandem mass spectrometry [9], and capillary electrophoresis [10]. Although the above methods can obtain accurate determination results, expensive instruments, complex procedures for sample pretreatment, and a time-consuming nature limit their large-scale use. Hence, the accurate, quick, and easy detection of QR has been extensively studied.
An electrochemical sensor, as a powerful tool for wide analytical applications [11], is an interesting candidate for the detection of QR due to its good selectivity, sensibility, stability, reproducibility, etc. [12]. It is a detection device that uses a modified electrode catalyzing the redox reaction of the analyte, which can convert the concentration of the analyte into an electrical signal. The signal of the electrochemical sensor depends on the catalytic activity of the modified electrode [13]. Therefore, designing the material with high catalysis is the key to improving the sensitivity of the electrochemical sensor.
Two-dimension transition metal dichalcogenides (TMDCs) with good catalytic activity are selected as promising candidates [14]. A molybdenum disulfide (MoS2) nanosheet, a typical TMDCs consisting of S-Mo-S “sandwiches”, has been studied due to its outstanding properties and potential applications in catalysis [15]. The active sites of MoS2 originate from the under-coordinated sulfur atoms at the edges [16]. Meanwhile, its aggregation originating from high surface energy and a van der Waals interlayer impedes the exposure of the edge, resulting in low catalytic activity [17]. Additionally, the low conductivity of MoS2 owing to a large bandgap also limits its development [18]. For the sake of ameliorating the above disadvantages, graphene [19] and carbon nanotubes [20], as typical conductive substrates, have been used to load or support MoS2. However, these treatments are dangerous and easy to cause environmental pollution due to their use of strong acids. A carbon sphere (Cs) can be prepared from glucose via a hydrothermal method [21]. The preparation technology is harmless to the environment, and the generated Cs has good conductivity, an easily modified surface, and a controllable size [22]. The oxygen-containing functional groups on the surface of Cs increase its dispersion and provide a good microenvironment for an in situ synthesis of MoS2 on Cs (Cs@MoS2). To further improve the catalysis of the composite material, palladium nanoparticles (Pd NPs) have been considered. They have excellent catalytic activity from the vacant d orbitals, good conductivity owing to a lot of free electrons, and a simple preparation [23,24]. As the catalytic reaction occurs on the surface of the catalyst [25], the small-size Pd NPs can enlarge the effective area and atomic utilization. Moreover, the Pd NPs form a bi-catalytic system with MoS2, which improves the catalytic activity of the composite material and realizes the sensitive detection of QR.
In this work, an electrochemical sensor based on an in situ synthesis of Pd NPs on Cs@MoS2 (Cs@MoS2-Pd NPs) was fabricated for the sensitive detection of QR. Cs, as the growth substrate to MoS2 nanosheets and Pd, not only improves the overall conductivity of the material but also effectively prevents the aggregation of MoS2. Moreover, Pd NPs with a small size (8 nm) further improve the catalytic activity of the material. The oxidation reaction of QR on Cs@MoS2-Pd NPs/GCE involves two electrons and two protons. Additionally, the order and site of QR oxidation are speculated by a simulated computation. The electrochemical sensor based on Cs@MoS2-Pd NPs displays good performance, implying that it has great potential for the detection of QR in actual food.

2. Experimental Section

2.1. Fabrication of Cs@MoS2-Pd NPs Modified Electrode

The preparation of Cs@MoS2-Pd NPs references the reported method of [26,27,28]. The specific preparation method and required reagents and apparatus are listed in the Supplementary Materials. The glassy carbon electrode (GCE, d = 3 mm) was polished thoroughly by alumina polishing powders (1.0, 0.3, and 0.05 μm) and then washed via ultrasonic in water and ethanol, successively. The cleaned GCE was dried by nitrogen and then dripped with 5.0 μL Cs@MoS2-Pd NPs dispersion (1 mg/mL). After being dried at room temperature, the Cs@MoS2-Pd NPs modified GCE (Cs@MoS2-Pd NPs/GCE) was fabricated. Its schematic diagram is shown in Figure 1. The same method was also used to prepare MoS2/GCE, Cs/GCE and Cs@MoS2/GCE for comparison.

2.2. Electrochemical Measurements

The conventional three-electrode system involved modified GCE (d = 3 mm) as a working electrode, a platinum wire as a counter electrode, and a saturated calomel electrode (SCE) as a reference electrode. The cyclic voltammetry (CV), AC impedance (EIS), and open-circuit potential were in a mixture solution containing 2.5 mM of K4[Fe(CN)6], 2.5 mM of K3[Fe(CN)6], and 0.1 M of KCl. The initial potential of EIS was the open-circuit potential, and its frequency ranged 1~105 Hz. The square wave voltammetry (SWV) was measured into 10 mL PBS. Chronocoulometry was implemented in 0.1 mM K3[Fe(CN)6] solution containing 0.1 M KCl.

2.3. Actual Samples Pretreatment

The apple juice was diluted 50-fold with PBS (pH = 6.0). Then, the mixture was broken up, heated at 80 °C for 1 h, and filtered. In total, 1.0 g green tea ground to a powder was added into 50 mL PBS (pH = 6.0), heated at 80 °C for 1 h, and filtered. Finally, the pH of all actual samples was adjusted by HCl/NaOH (0.1 M) to 6.0.

2.4. Theoretical Calculation Method

The geometry of QR was optimized by Gaussian 09 software at B3LYP/6-311 G(d,p) level [29]. The molecular surface for electrostatic potential and the Laplacian bond order were applied to predict reactive sites [30]. The above analyses were finished by Multiwfn 3.8 with the help of visual program VMD 1.9.3 [31].

3. Results and Discussion

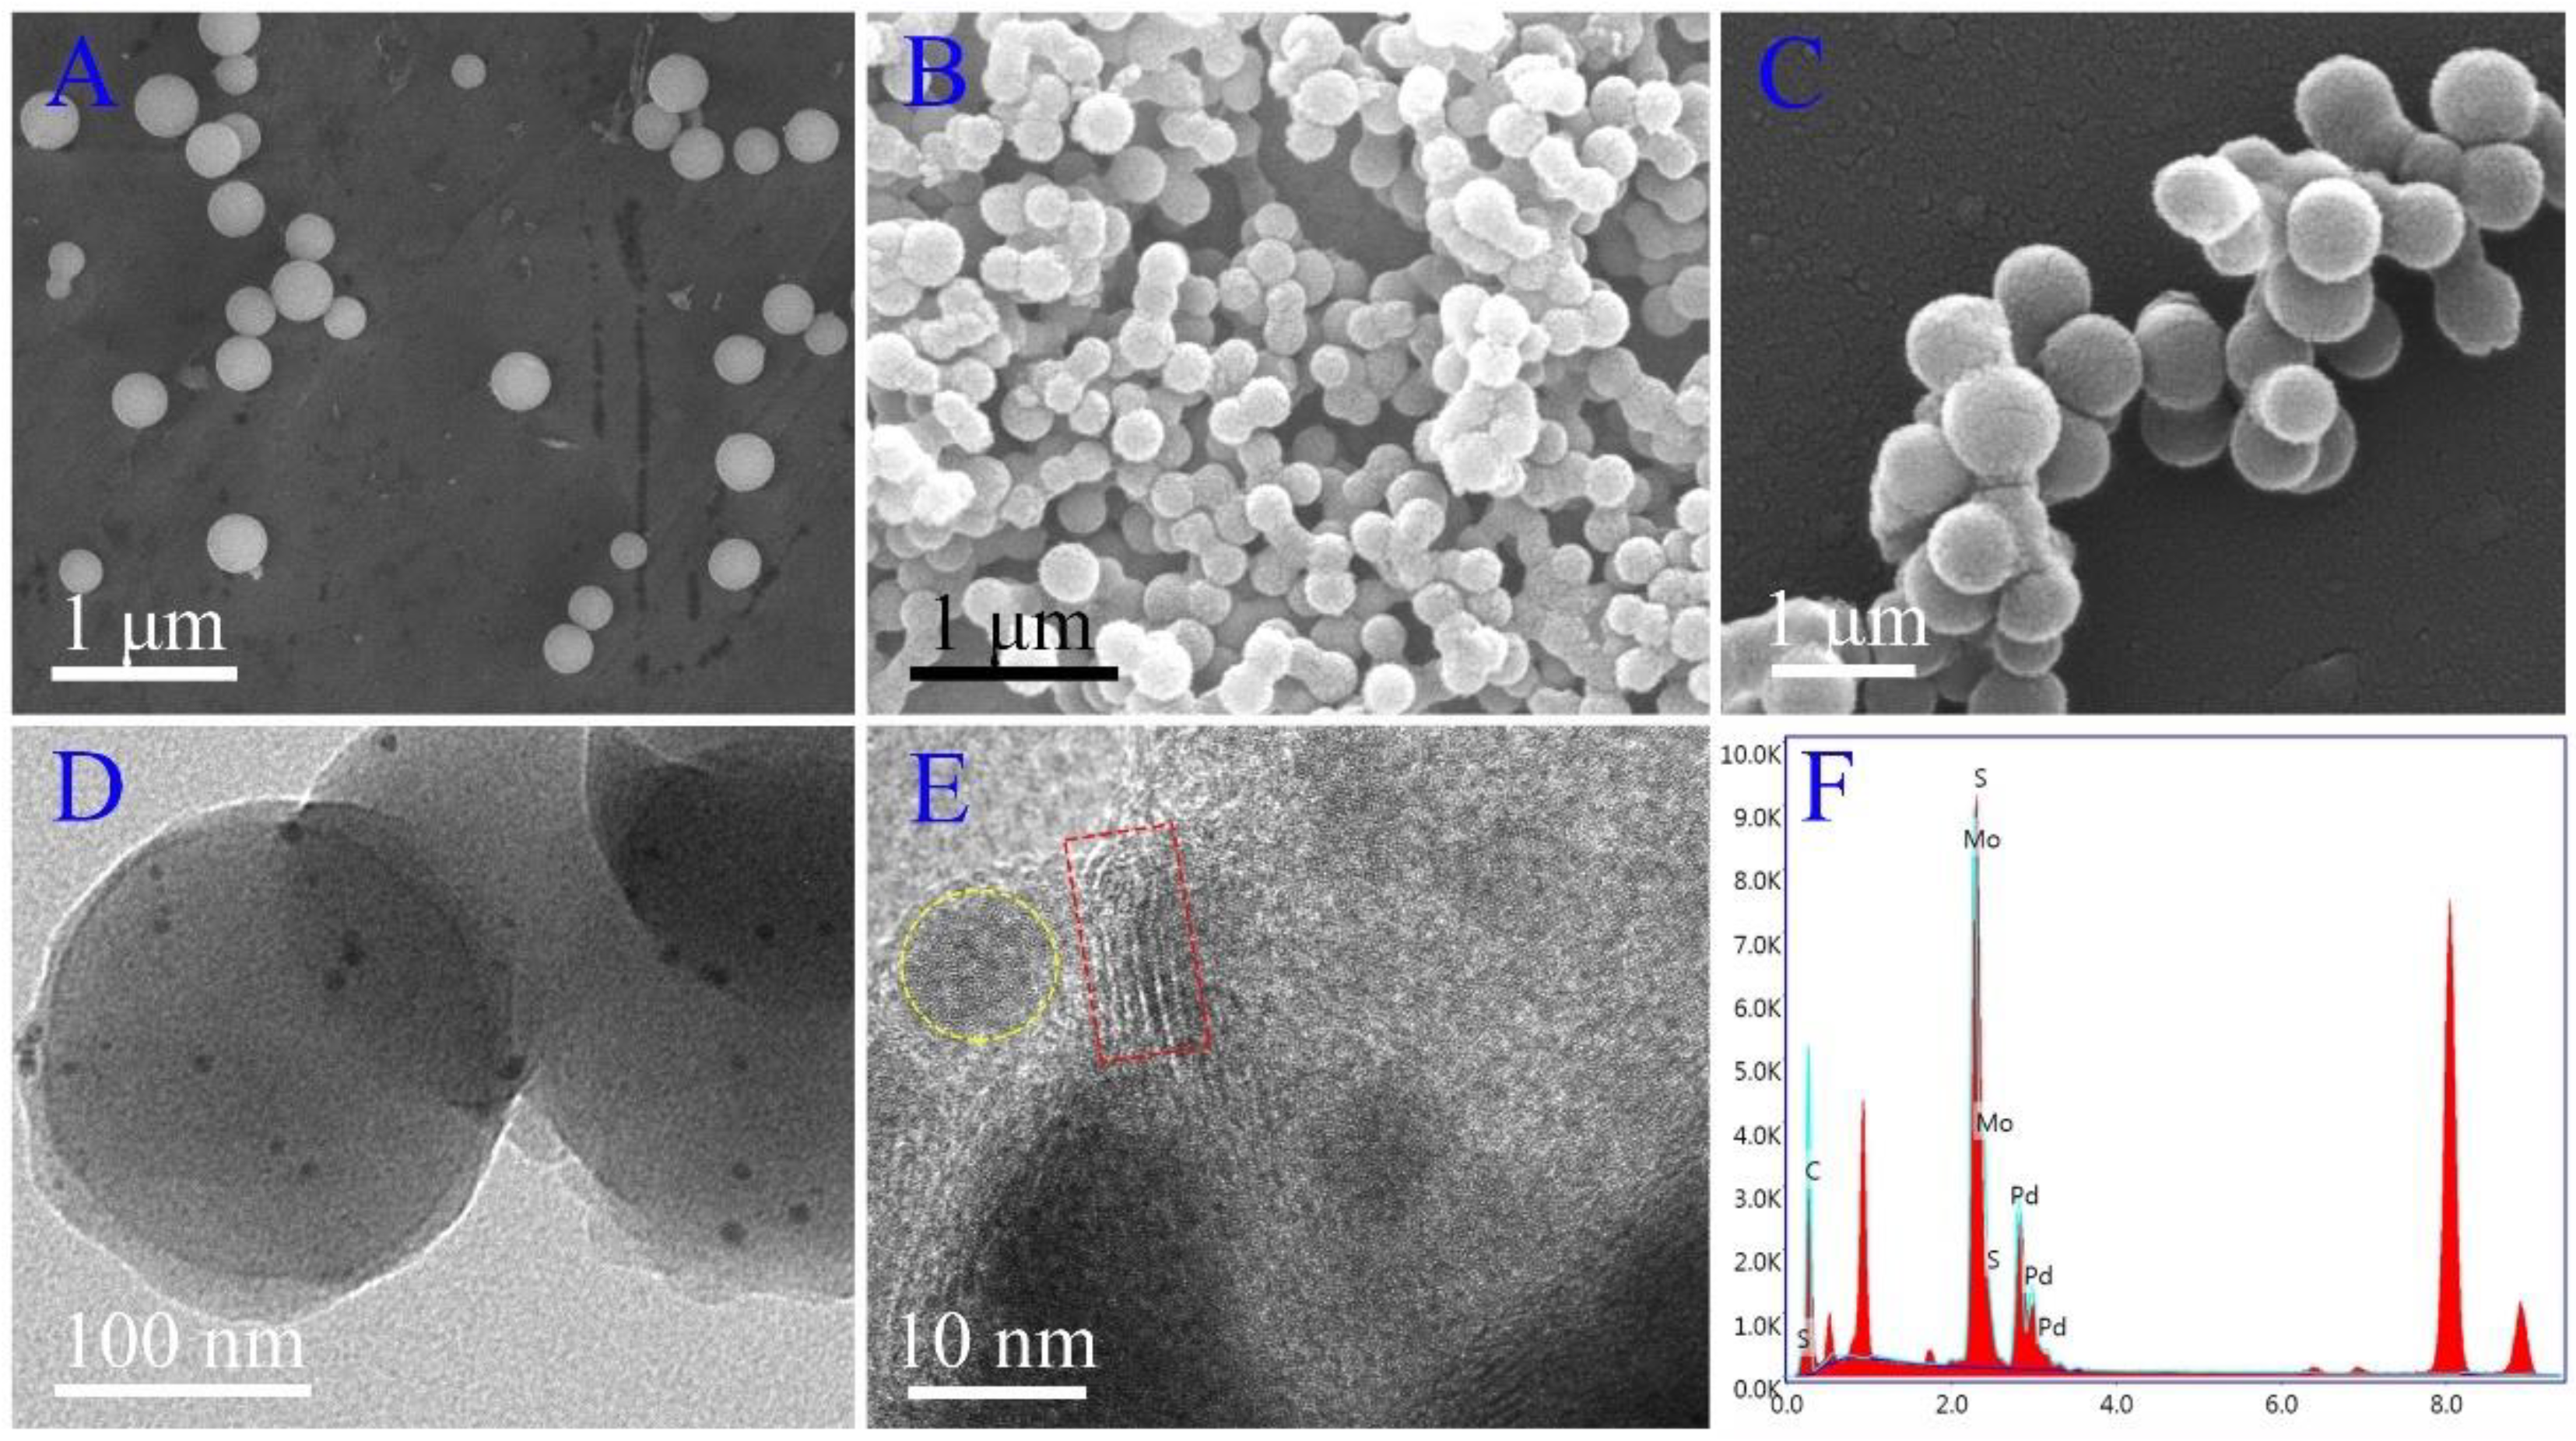
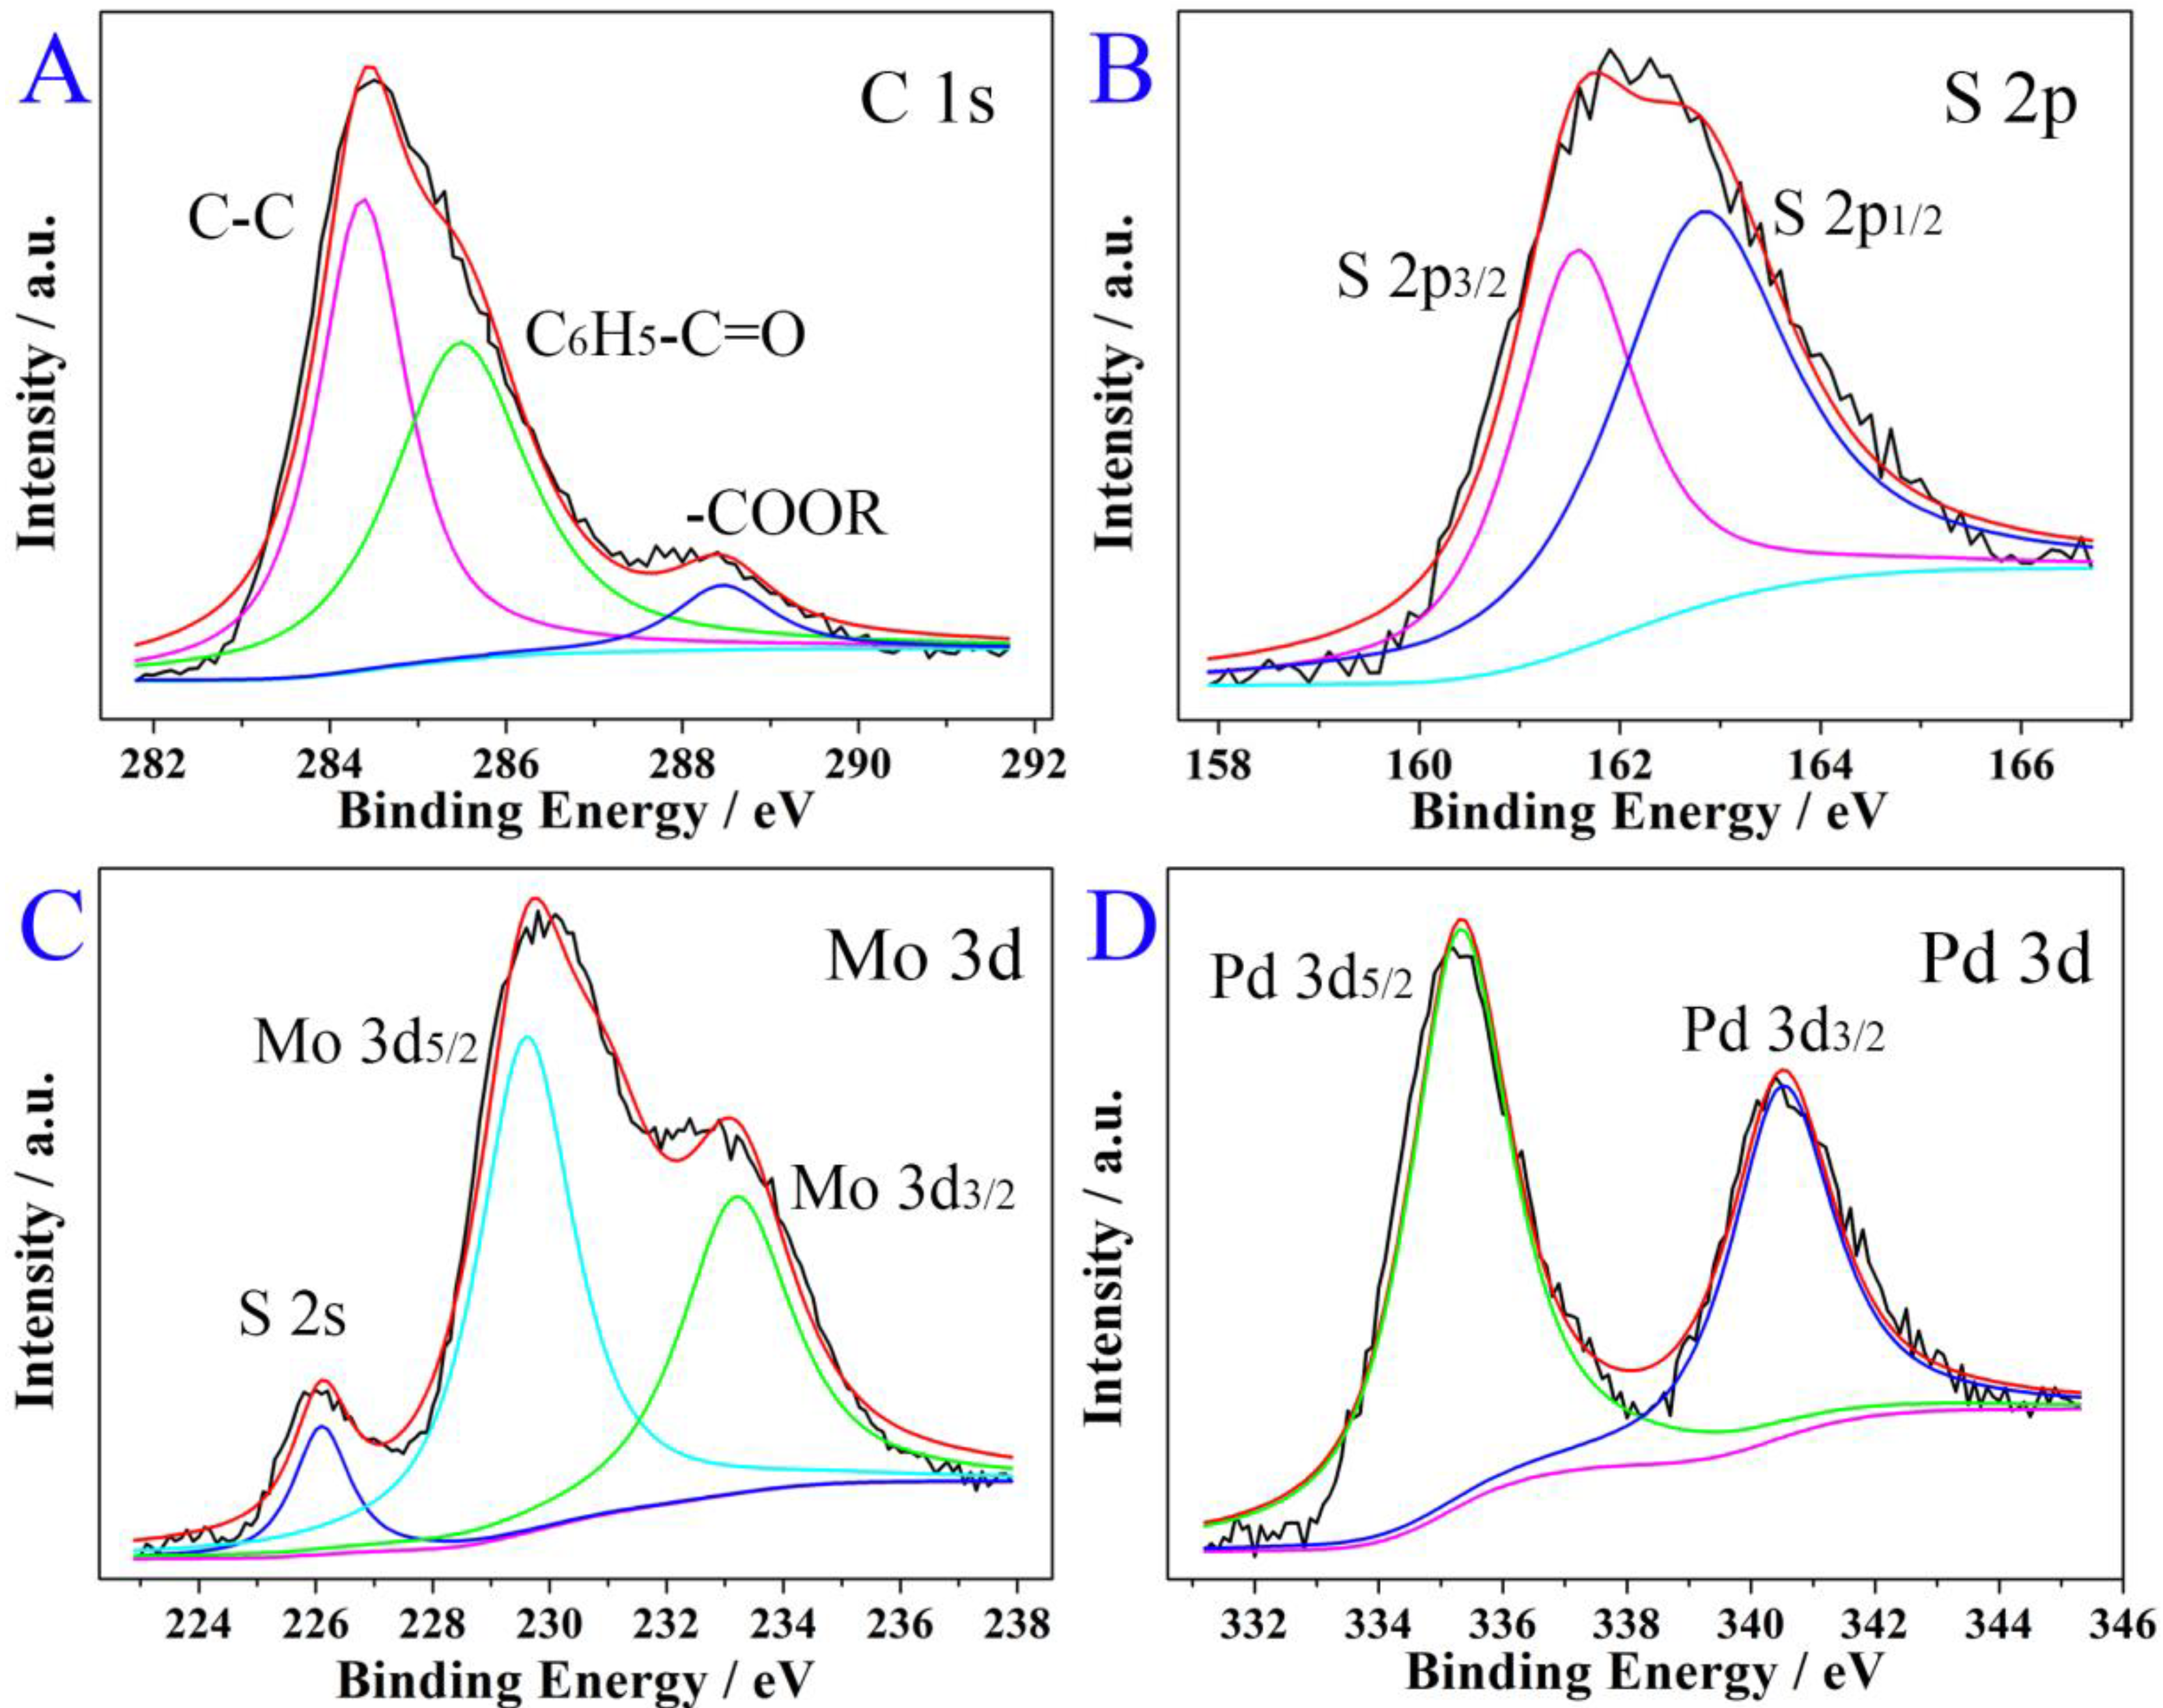
3.1. Characterization of Cs@MoS2-Pd NPs Nanocomposite

The morphology and element content of the nanocomposite were characterized by SEM, TEM, EDS, and XPS. From the SEM of Cs (Figure 2A), it can be seen that Cs was a sphere with a smooth surface and its diameter was about 250 nm. After an in situ synthesis of MoS2, the surface of the sphere became rough (Figure 2B,C), indicating that MoS2 had grown on the surface of Cs. The TEM of Cs@MoS2-Pd NPs (Figure 2D) shows that many small nanoparticles with a diameter of about 8 nm were loaded on the Cs@MoS2. Its more detailed microstructure is shown in Figure 2E. The layers of the MoS2 nanosheets were about six layers (in the red box) less than Zhao’s research (20 layers) [32], which indicates the aggregation of MoS2 was obstructed. In the yellow circle, the palladium nanoparticle is loaded on MoS2, but its crystal is not obvious. To further prove the composite was Cs@MoS2-Pd NPs, the EDS was tested. The results are exhibited in Figure 2E. The EDS included the elements of C, S, Mo, and Pd, indicating the composite was Cs@MoS2-Pd NPs.
XPS was used to characterize the Cs@MoS2-Pd NPs’ state. In the C 1s spectra (Figure 3A), peaks for graphitic carbon (C–C, CHx, C=C), phenolic carbonyl groups (C6H5–C=O), and carbonyl or ester groups (C=O, –COOR) were observed at 284.4, 285.5, and 288.5 eV, respectively [33]. The S 2p spectrum exhibited two contributions, S 2p3/2 and S 2p1/2, located at 161.6 and 162.9 eV (Figure 3B), respectively, which can be assigned to MoS2 [34]. The Mo 3d spectrum exhibited two contributions, Mo 3d5/2 and Mo 3d3/2 of Mo4+, located at 229.6 and 233.2 eV, respectively, and the peak at 226.1 eV correspond to the S 2s in Figure 3C [35]. Two binding energy peaks located at 340.5 eV and 335.3 eV, shown in Figure 3D, belong to the characteristic peaks of Pd [36]. The results also indicate that Cs@MoS2-Pd NPs had been successfully prepared. The characterization of Cs@MoS2-Pd NPs by FTIR, XRD, Raman, and Zeta potential in Figure S1 [37,38,39,40] and the specific analysis are in Supplementary Materials, which results are also proved that the Cs@MoS2-Pd NPs had been successfully prepared.

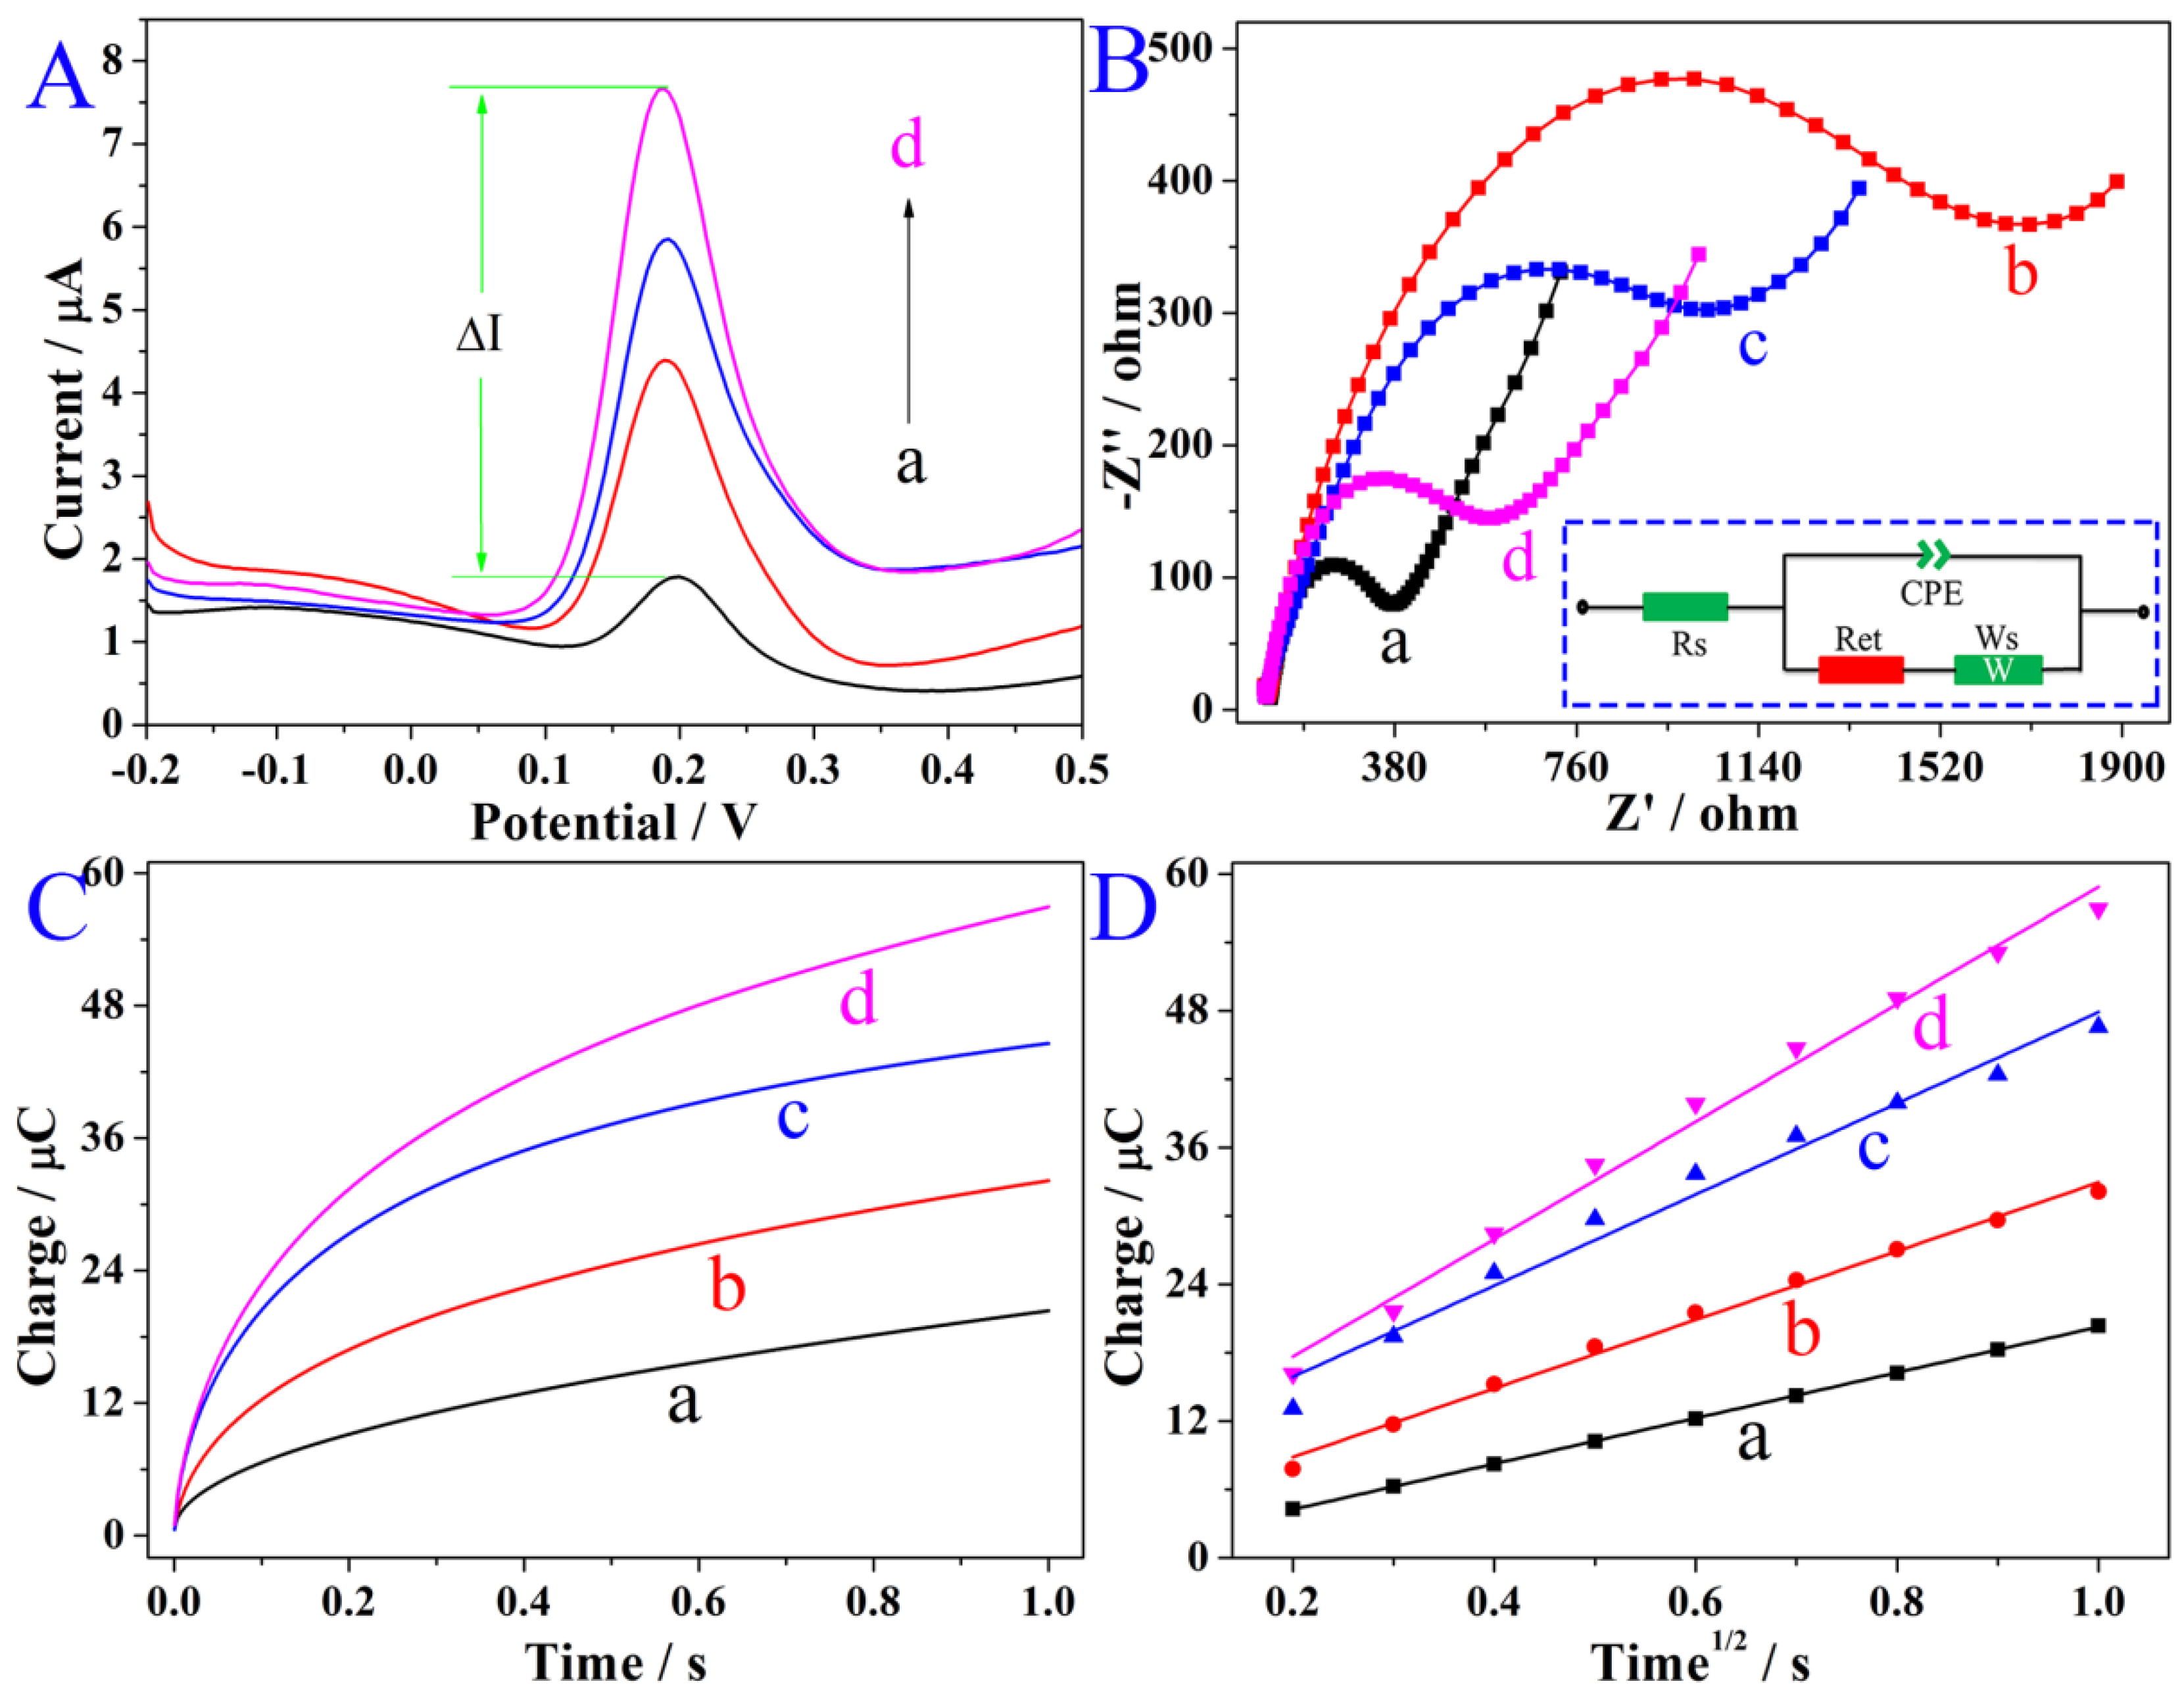
3.2. The Study of Catalytic Activity

To study catalytic activity, Cs (a), MoS2 (b), Cs@MoS2 (c), and Cs@MoS2-Pd NPs (d) (5.0 μL, 1 mg/mL) modified on GCE were used to test SWV in PBS including 6.0 μM QR. In Figure 4A, curve a has a delicate peak current value, indicating the catalytic capacity of GCE to QR was very limited. Curve b only has a little peak current, indicating that Cs had low catalytic activity to the oxidation of QR. The current of curve c is larger than curve b, which is attributed to the good catalytic activity of MoS2. Compared with curve c, curve d has a low content of MoS2 but shows a larger current. This phenomenon is attributed to how Cs obstructs the agglomeration and enhances the conductivity of MoS2. From curve e, it can be seen that palladium nanoparticles further enhanced the catalytic activity of the composites. Additionally, the current of curve d is 5.4 times that of curve 2 and ΔI is 4.996 μA. Thus, Cs@MoS2-Pd NPs/GCE with high catalytic activity is suitable for detecting QR.
The conductivity of the effective area has a strong effect on the electrochemical catalytic activity. To study their effect, different modified GCEs were measured via EIS and chronocoulometry. For EIS, the diameter of the semicircle in the high frequency represents the charge transfer resistance (Rct). Figure 4B shows the Nyquist plots of bare GCE (a), MoS2/GCE (b), Cs@MoS2/GCE (c), and Cs@MoS2-Pd NPs/GCE (d). From the Nyquist plots, it can be seen that the bare GCE had small Rct, the Rct of MoS2/GCE was larger, and the Rct of Cs@MoS2/GCE and Cs@MoS2-Pd NPs/GCE was smaller than MoS2/GCE. The data of Rct simulated by ZView 2 are listed in Table S1, which is consistent with the results in the Nyquist plots. The results indicate that Cs and Pd can improve conductivity and enhance electron transfer. The results indicate the introduction of Cs and palladium nanoparticles can improve conductivity.
The results of chronocoulometry are presented in Figure 4C. After Cs (b), Cs@MoS2 (c), and Cs@MoS2-Pd NPs (d) are modified on GCE (a), the interfacial charge increases. By taking the square root of time, Figure 4D is obtained. The effective area (A) can be calculated by the slope of the line via the Anson equation [41]:
Q(t) = 2nFAcD1/2t1/2π−1/2 + Qdl + Qads
where n is the transfer electrons number (n = 1), c is the concentration of the [Fe(CN)6]3− solution, F, D, Qdl, and Qads are the Faraday constant and diffusion coefficient double-layer charge and Faraday charge, respectively. From the calculation of the effective area in Table S2, the effective area of Cs@MoS2-Pd NPs/GCE was about 2.6 times that of GCE. Furthermore, the effective area of Cs@MoS2-Pd NPs/GCE was greatly increased, which is attributed to Cs obstructing the agglomeration of MoS2, and the small size of the palladium nanoparticles also contributed to the increase in the effective area. Therefore, the good catalytic activity of Cs@MoS2-Pd NPs was attributed to a large effective area and high conductivity.

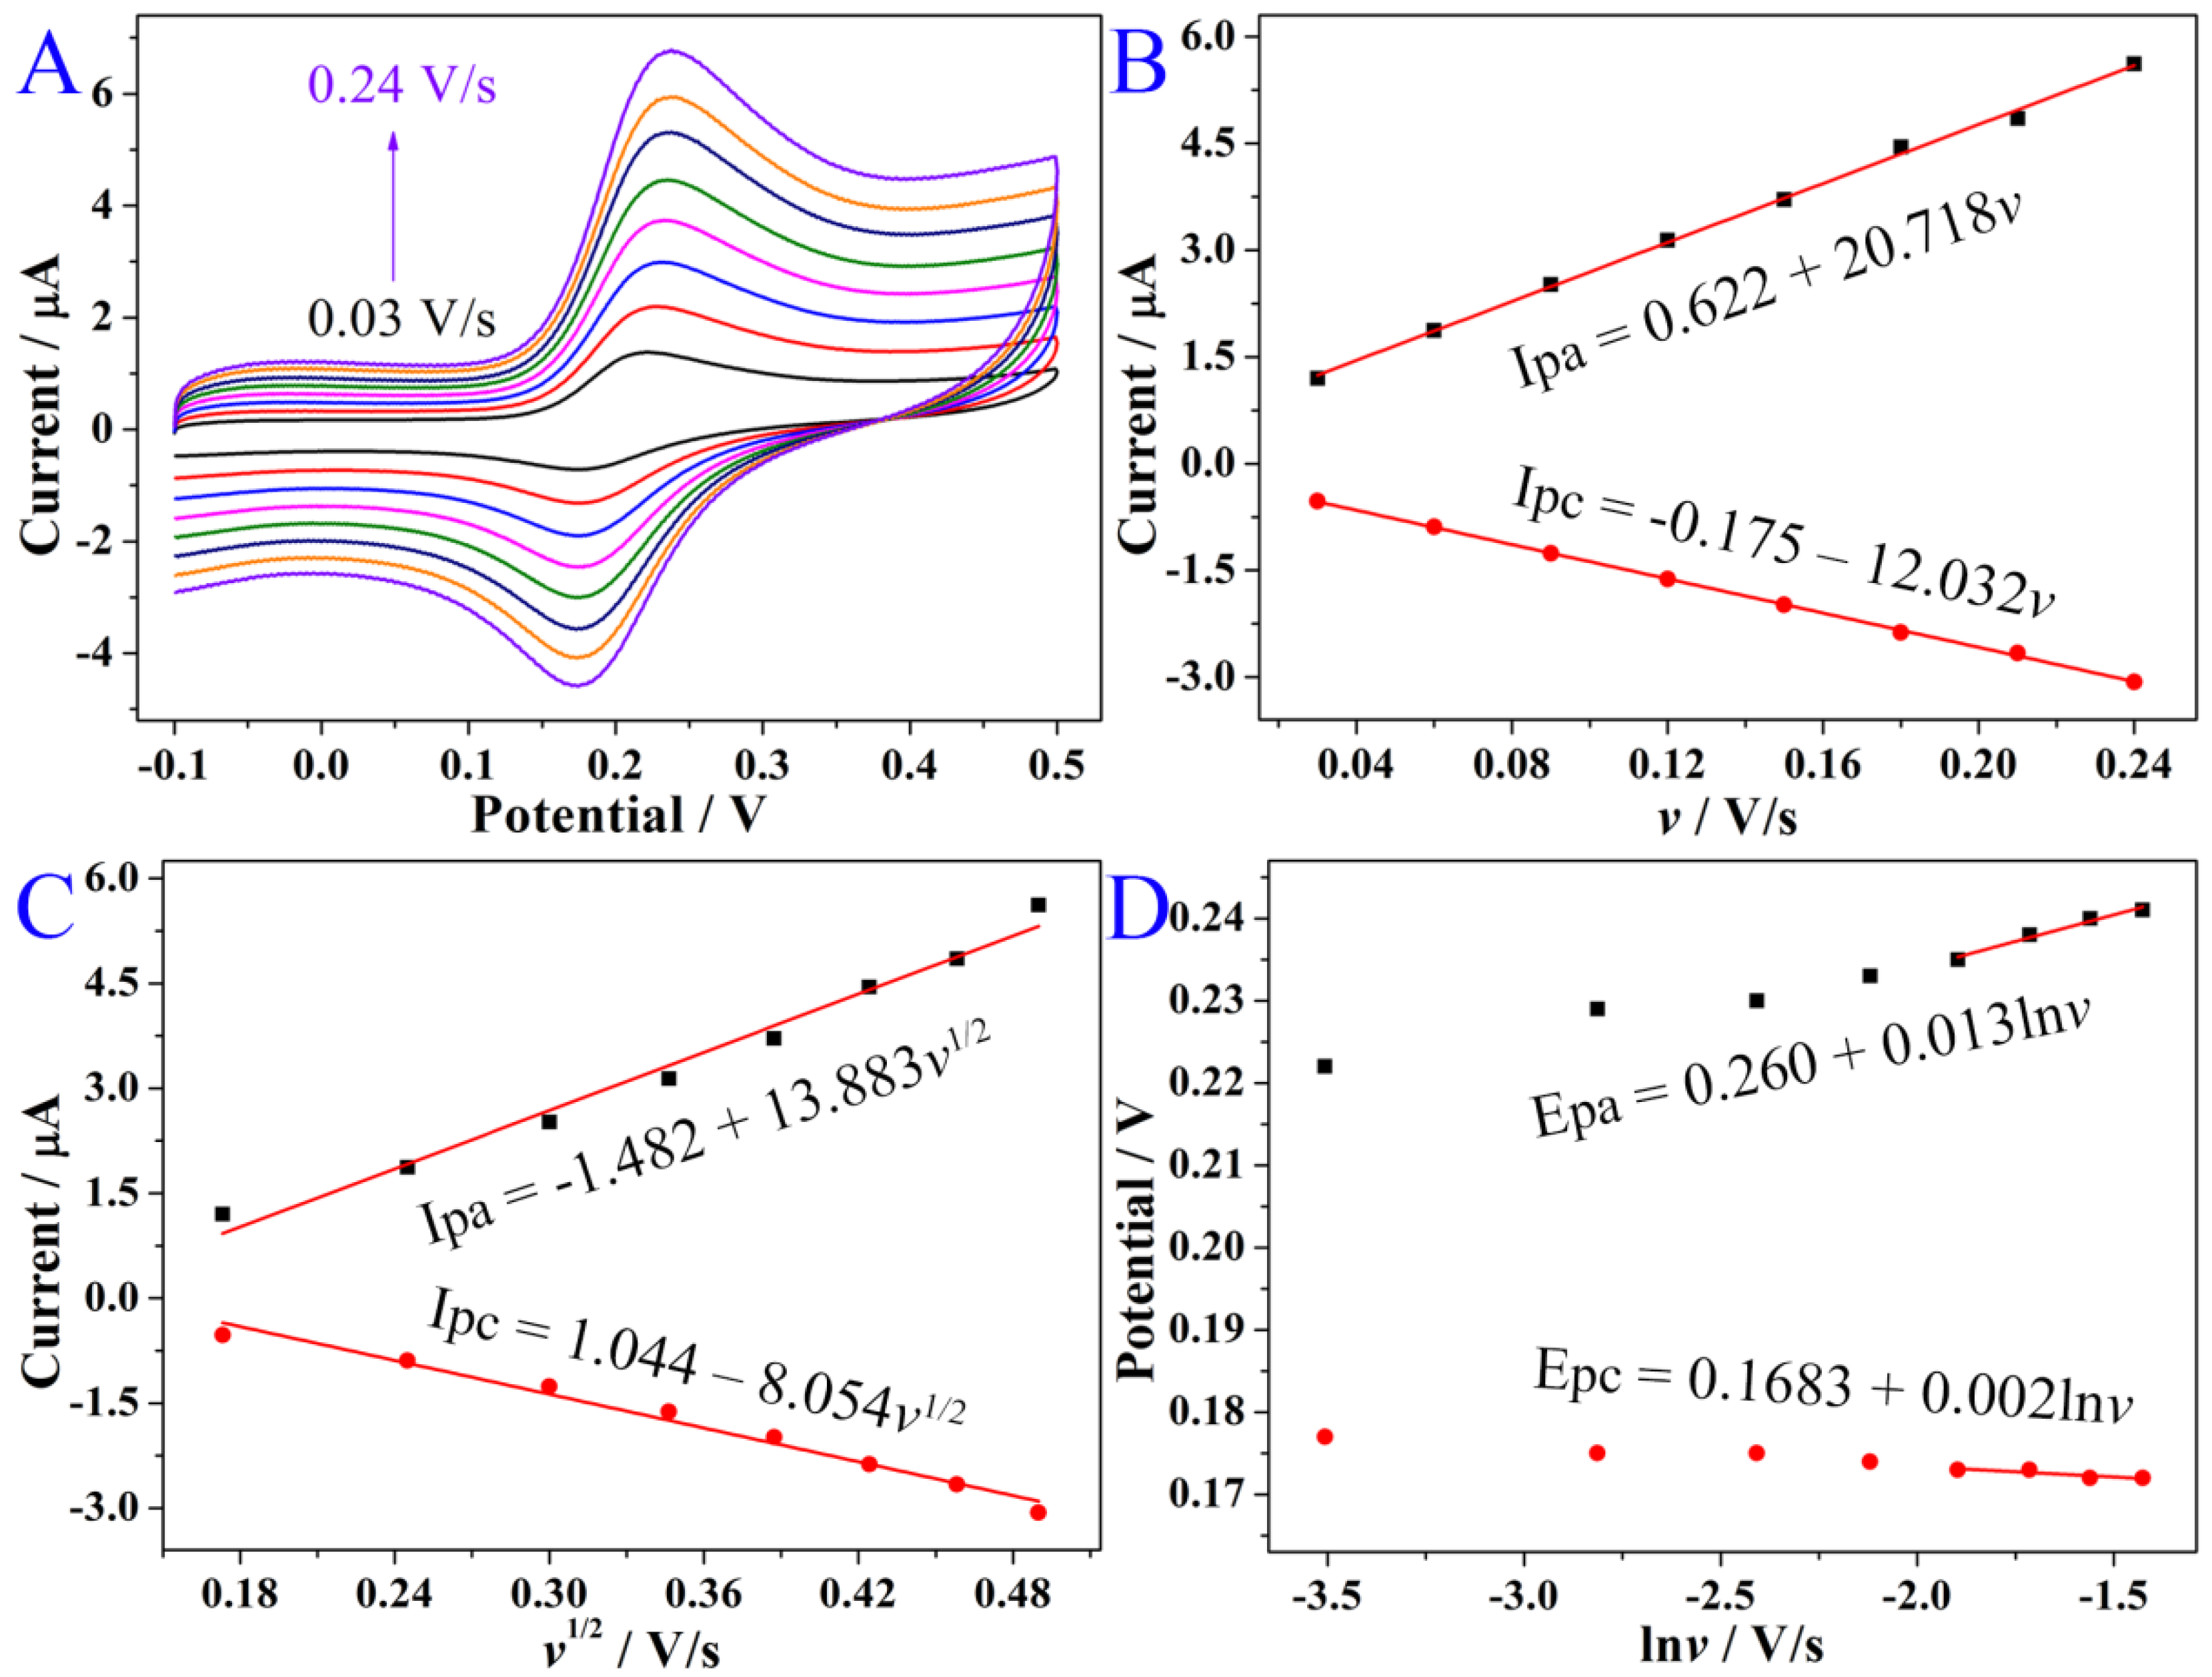
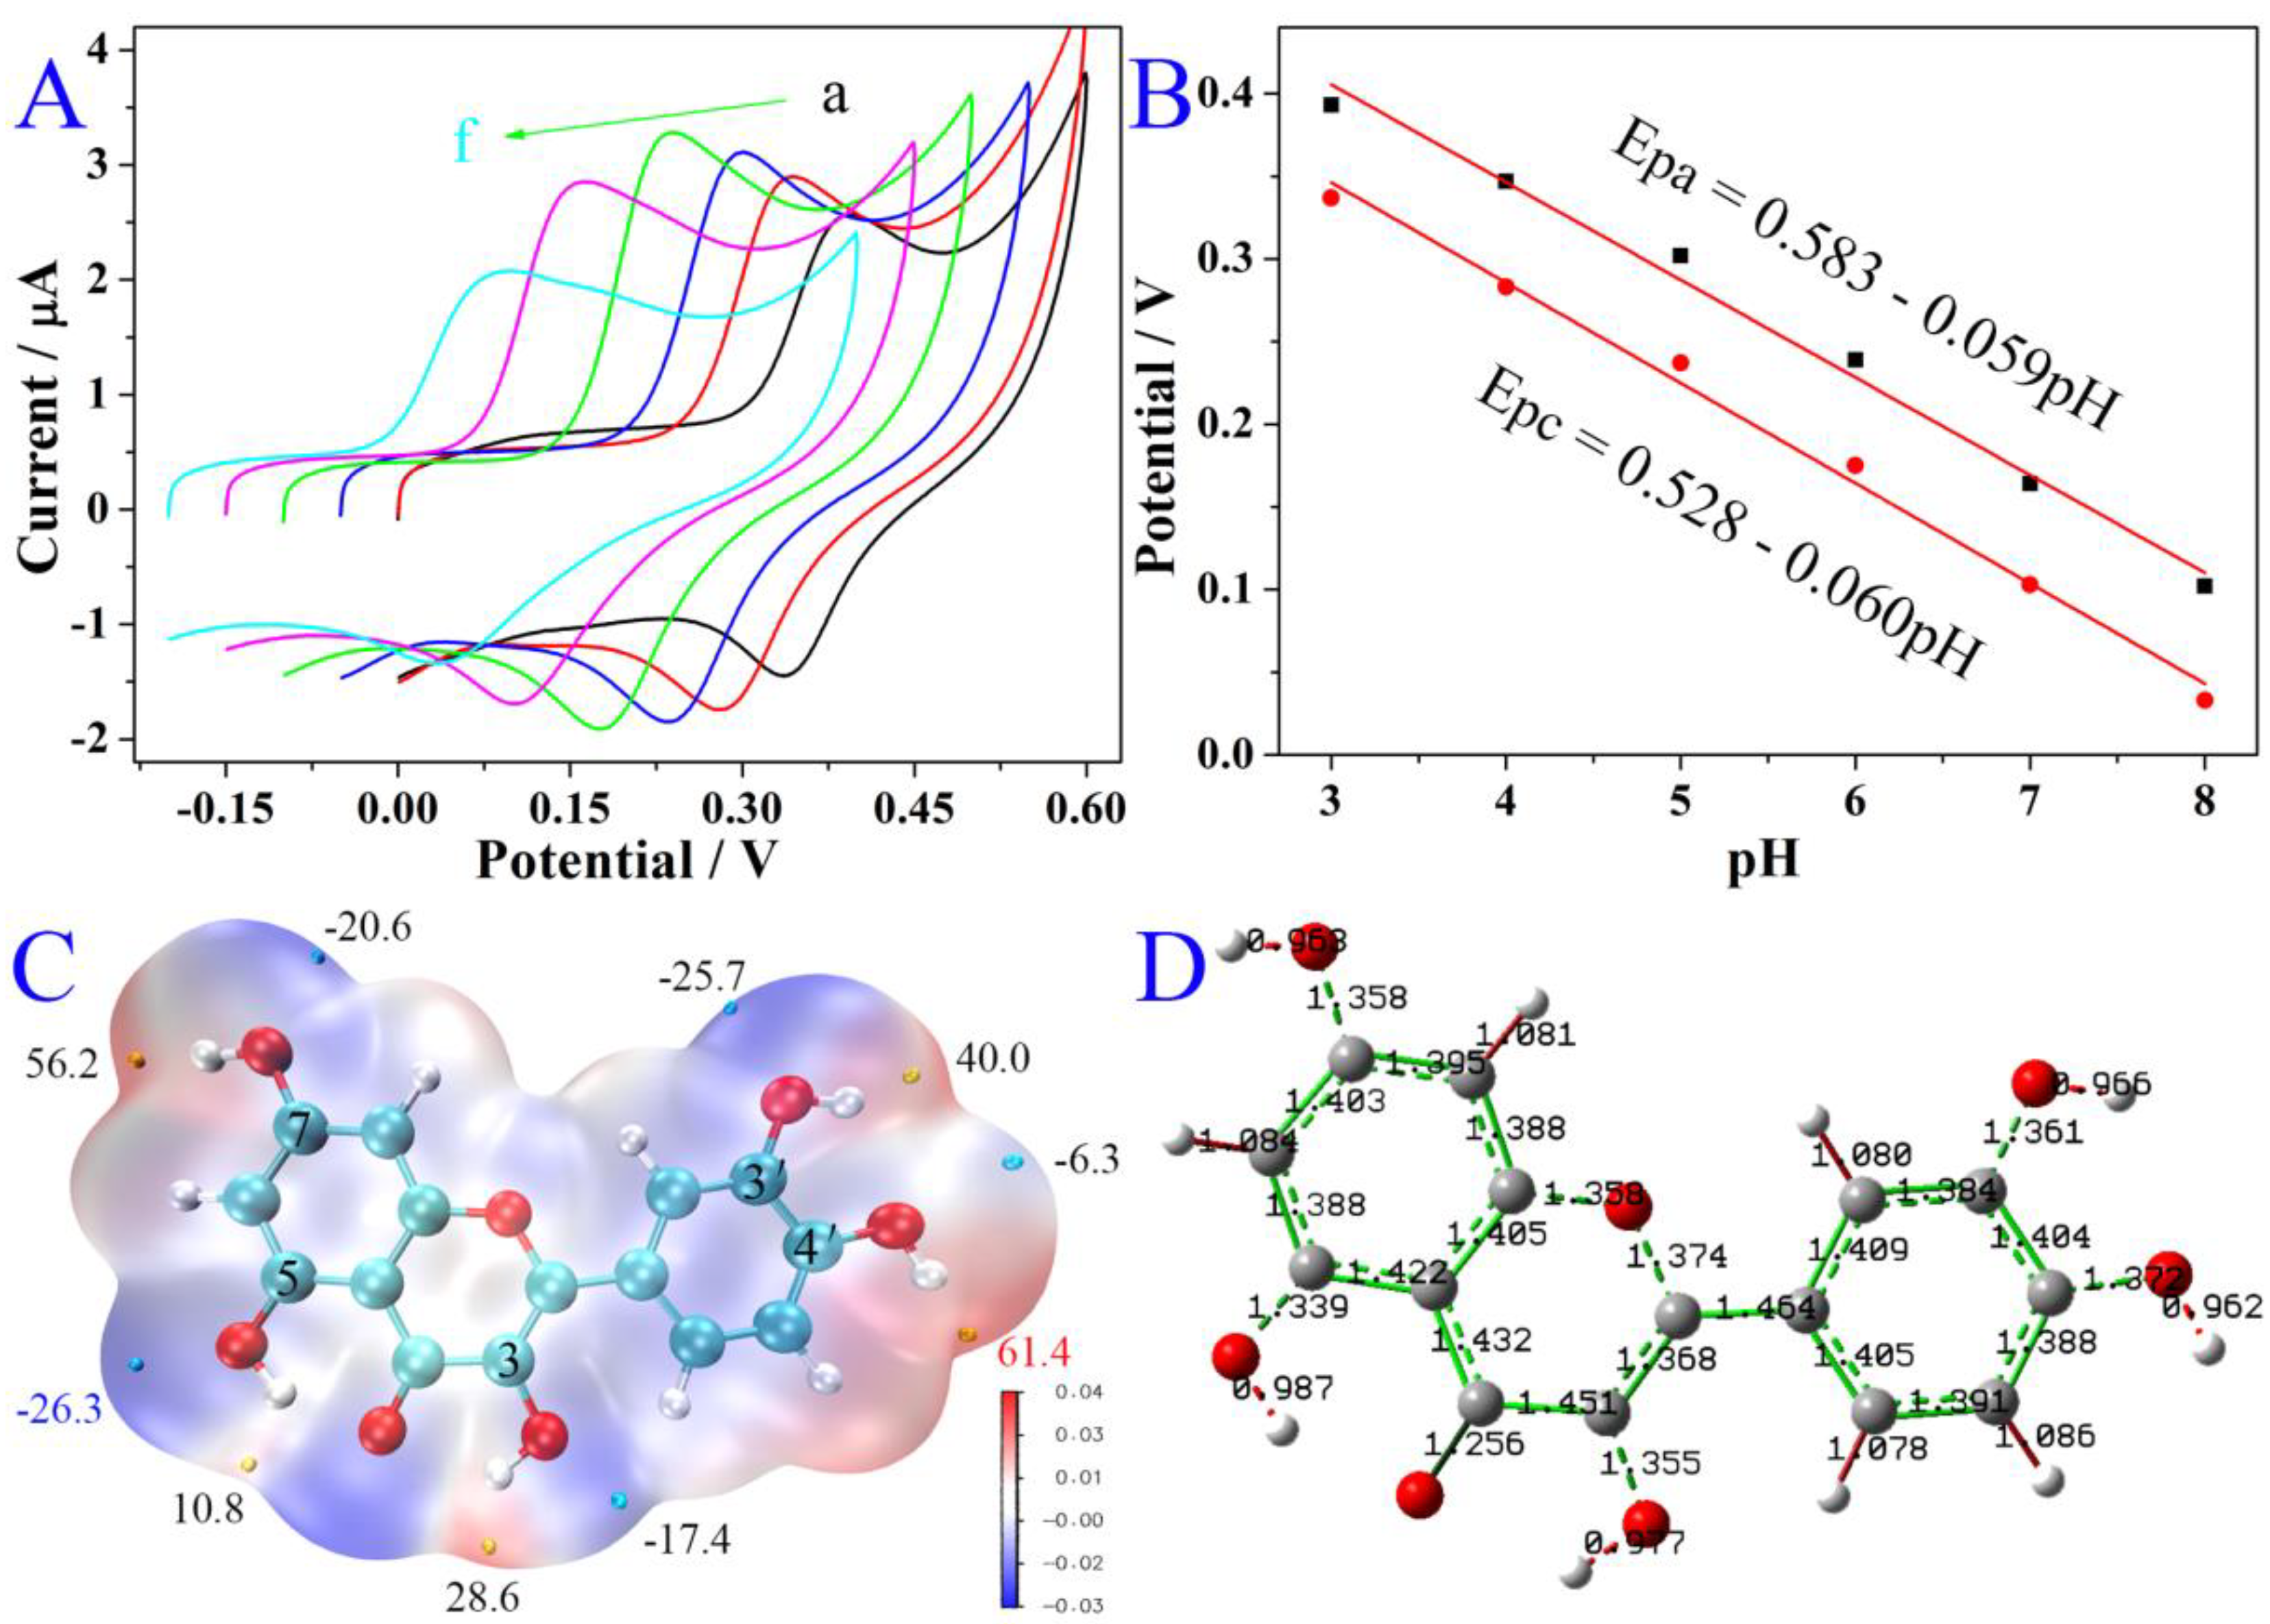
3.3. The Study of Electrocatalysis Oxidation to QR

The electrocatalysis oxidation of Cs@MoS2-Pd NPs to QR was investigated by CV in PBS (pH = 6.0) including 9.0 μM QR, using different scan rates (v) from 0.03 V/s to 0.24 V/s. The peak current increased with the increase in the v in Figure 5A. Figure 5B displays the corresponding linear plot between v and peak current. The linear regression equations are Ipa = 0.622 + 20.718v (μA), Ipc = −0.175–12.032v (μA), indicating that the redox reaction of QR on the interface of Cs@MoS2-Pd/GCE followed an adsorption-controlled process. Meanwhile, the linear relationship Ipa = −1.482 + 13.883v1/2 (μA), Ipc = 1.044–8.054v1/2 (μA) between the square root of v and the peak current are obtained in Figure 5C, suggesting that the reaction was a diffusion-controlled process. Thus, the redox reaction of QR on the interface of Cs@MoS2-Pd NPs/GCE was a mixed process composed by absorption-controlled and diffusion-controlled processes.
The electron number (n) of the redox reaction to QR on the interface of Cs@MoS2-Pd NPs/GCE can be calculated by Laviron’s equation [42], as follows:
Epa = E0 + RT/(1 − a)nF ln[RTks/(1 − a)nF] + RT/(1 − a)nF lnv
Epc = E0 + RT/anF ln[RTks/anF] − RT/anF lnv
where E0, α, v, and ks are formal potential, electron transfer coefficient, scan rate, electron transfer rate constant, and T, R, and F are common meanings. The linear relationship between peak potential and the Napierian logarithm of v was Epa = 0.260 + 0.013lnv (V), Epc = 0.1683 + 0.002lnv (V) in Figure 5D. The value of n was calculated to be around 2, which is consistent with previously reported findings [43,44]. Therefore, two electrons are involved in the electro-oxidation of QR on the interface of Cs@MoS2-Pd NPs/GCE.
To investigate the effect of protons on the electro-oxidation of QR, the CV of Cs@MoS2-Pd NPs/GCE was measured in PBS with different pHs including 10 μM QR. In Figure 6A, the peak potential (E) decreased with the increase in pH. The linear relationships were Epa = 0.583–0.059pH (V), Epc = 0.528–0.060pH (V) in Figure 6B. The relationship between E and pH is as follows according to the Nernst equation [45]:
dEpa/dpH = (−2.303mRT)/nF
where m is the number of protons that participated in the electrochemical reaction. The m/n = 1 can be obtained from the slope of the relation between E and pH. Therefore, the electro-oxidation of QR on the interface of Cs@MoS2-Pd NPs/GCE was a reaction with two electrons and two protons.
The molecular surface for electrostatic potential and Laplacian bond order were used to speculate the site of obtained QR oxidation reaction, as shown in Figure 6C,D. As shown in Figure 6C, the H4′, H7, H3′, H3, and H5 atoms of QR were the centers of positive potentials. Moreover, the maximum positive potential was H4′ (61.4 kcal/mol), which implies that H4′ is most vulnerable to attack and leave. The Laplacian bond orders of QR (Figure 6D) show that the 4′ O–H bond was minimum (0.962), indicating that this oxygen–hydrogen was the easiest to break. The calculation methods show that the 4′ O–H was easy to break, which is consistent with other reports [46]. In addition, from the above calculation results, it can be seen that 7 O–H and 3′ O–H also are easy to break. Proton and electron transfer can be visualized through at least three mechanisms’ characteristics [29]. However, different mechanisms have free radical formation. The Gibbs free energy of free radicals was obtained to evaluate their stability. The Gibbs free energy of QR2*1 and QR2*2 (in Figure 7) were −2,895,554 and −2,985,483 kJ/mol, respectively, implying that QR2*1 was stable. Therefore, the results indicate the order of oxidation of QR was 4′ O–H and 3′ O–H.

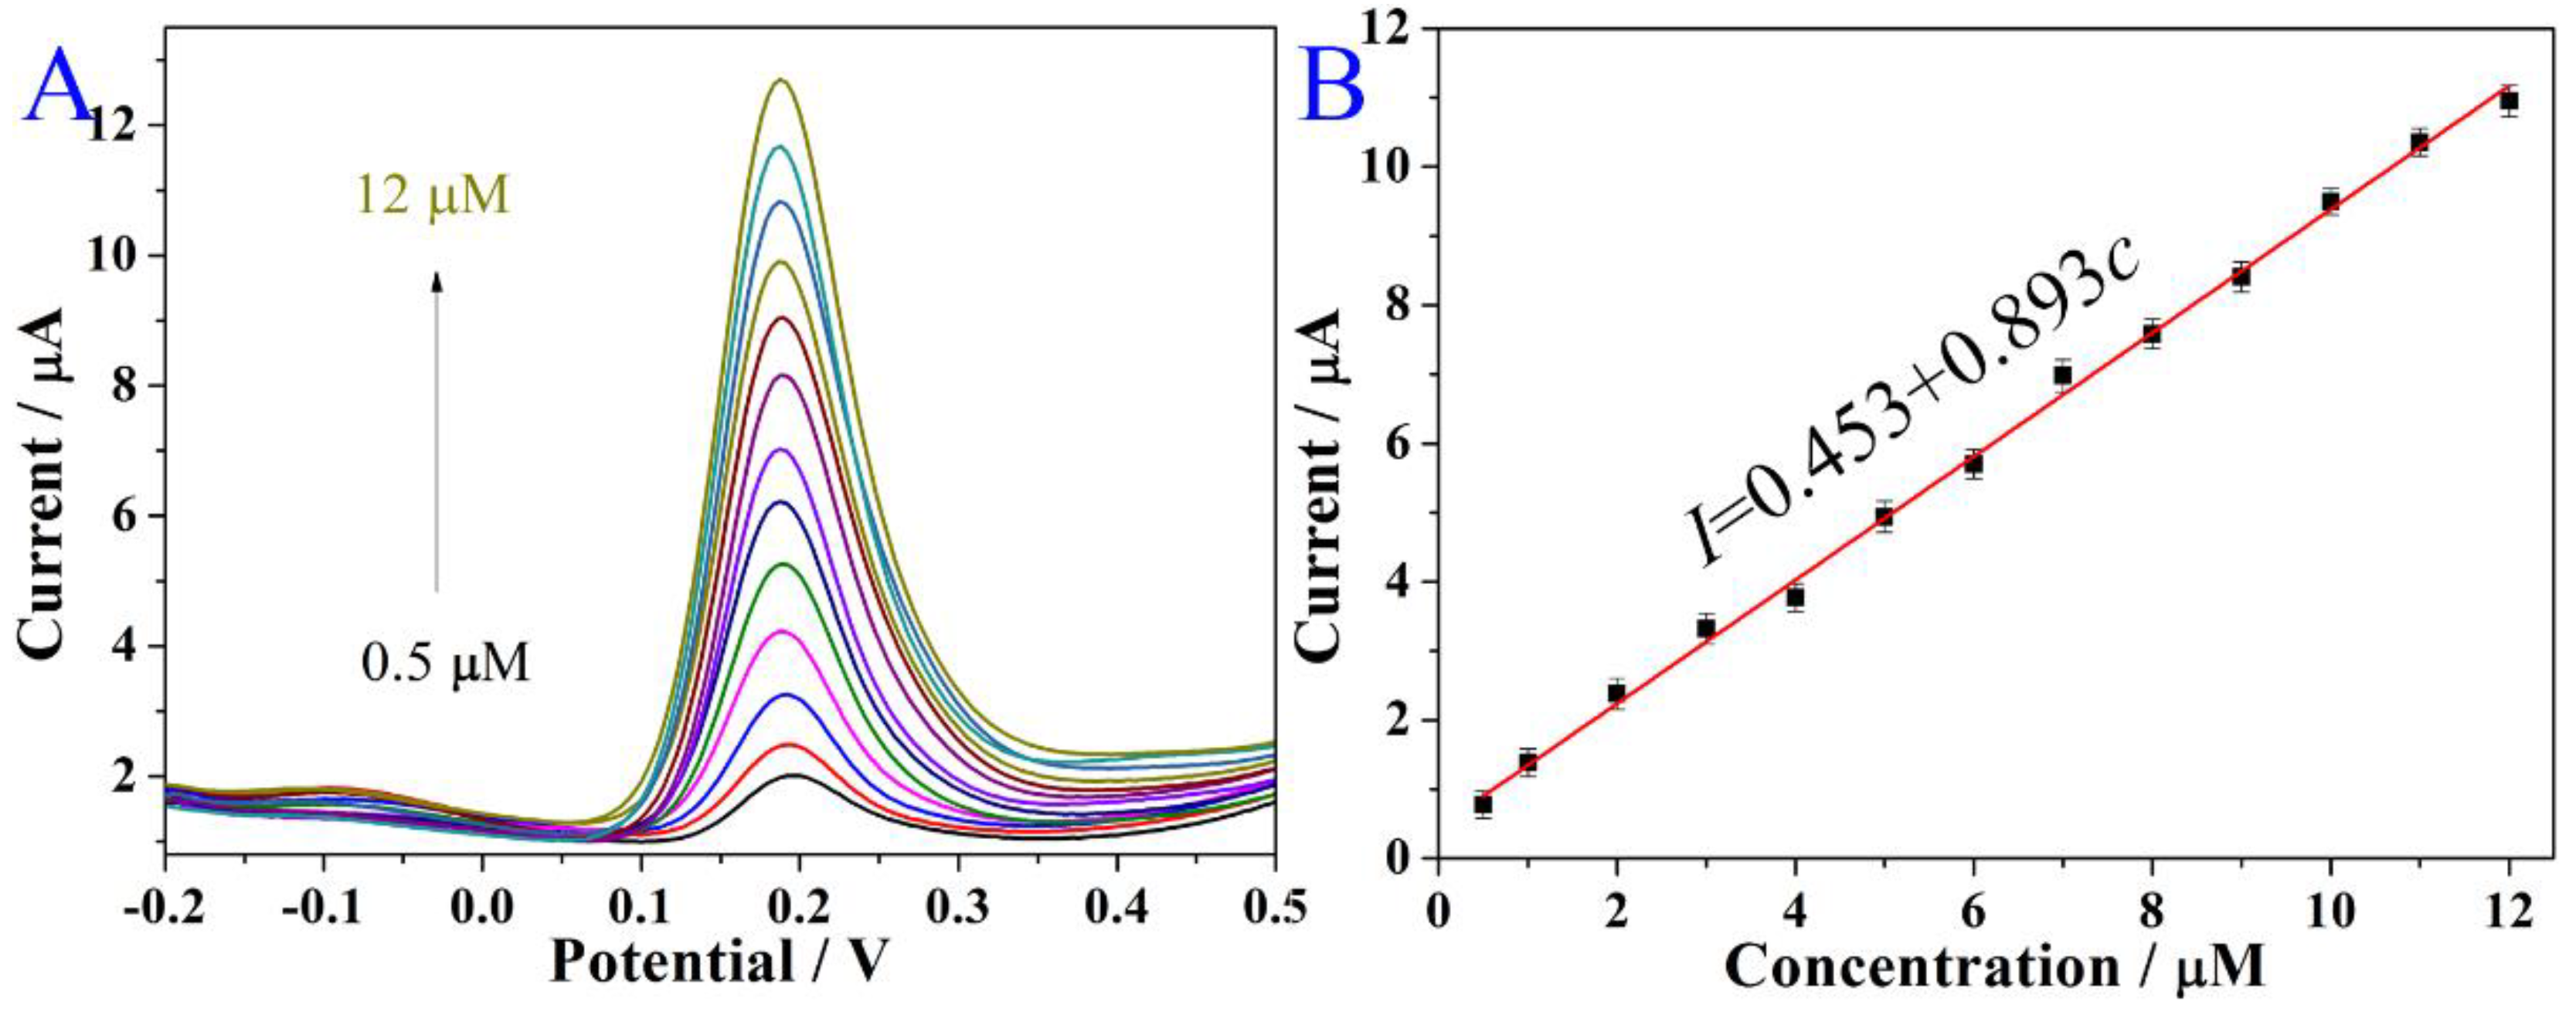
3.4. Analytical Performance

Under the optimal conditions (the optimization of test conditions in Figure S2 are listed in the Supplementary Materials), the sensor fabricated by Cs@MoS2-Pd NPs/GCE was used to detect QR via SWV in PBS. As shown in Figure 8A, the current signal increased when the concentration of QR increased from 0.5 μM to 12 μM. The specific changes are shown in Figure 8B. The current signal was linearly related to the concentration of QR, ranging from 0.5 μM to 12 μM with a limit of detection of 0.02 μM (signal-to-noise ratio of 3). Its regression equation was I = 0.453 + 0.893 c (μA), with a correlation coefficient of 0.998. Compared with the previous research in Table S3 [47,48,49,50,51], the proposed sensor had a low detection limit and wide linear range, which powerfully proved that the sensor had high sensitivity for quantificationally detecting QR.

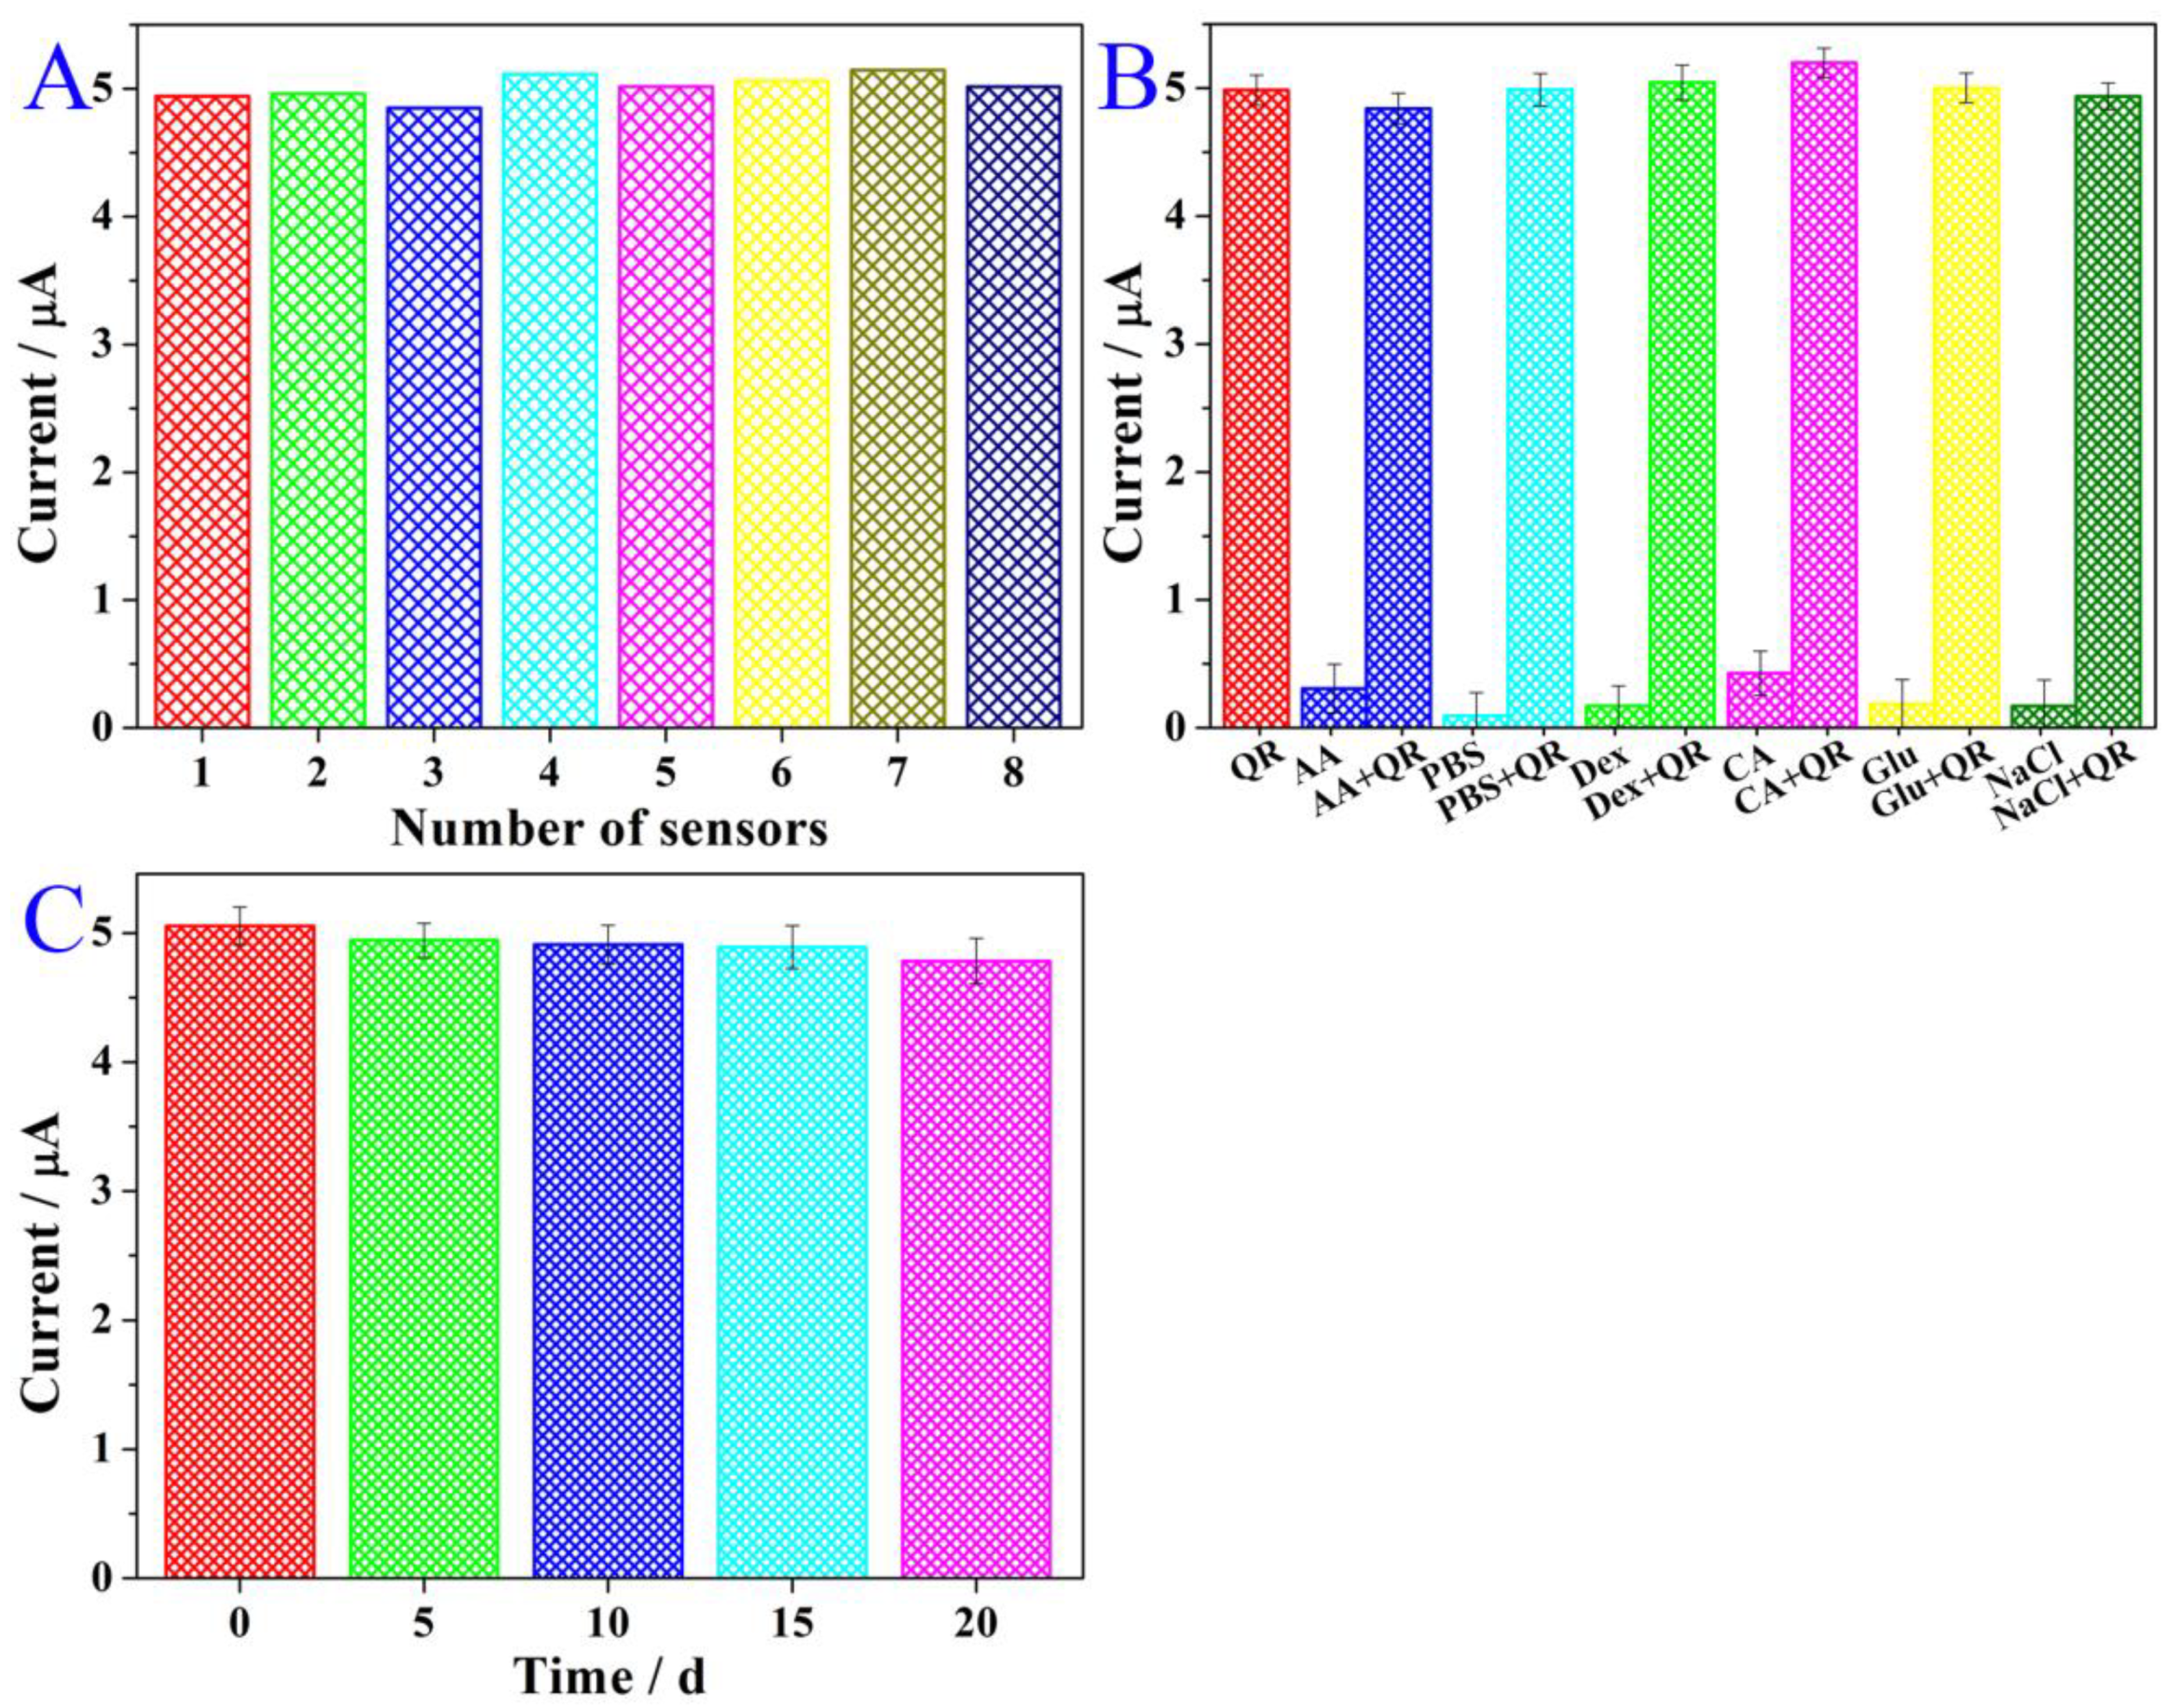
3.5. Reproducibility, Selectivity, and Stability

The reproducibility, selectivity, and stability of the sensor are the basis to analyzing real samples that can be evaluated by SWV. To study reproducibility, eight sensors were prepared for detecting QR (6.0 μM) under the same conditions. The results are shown in Figure 9A. The relative standard deviation (RSD) of them was 2.23% (less than 5%), implying that the sensor had good reproducibility.
The real sample is a mixture that requires an electrochemical sensor with good selectivity. Ascorbic acid, PBS, dextrin, citric acid, glucose, and sodium chloride were used as interferences to assess the selectivity of the sensor. From Figure 9B, it can be seen that the response current signals were small when the PBS only had interferences (15 μM) without QR. After 6.0 μL QR (1.0 mM) was injected, the response current signals were the same as the pure QR (6.0 μL, 1.0 mM), and the changes were less than 5% of the current without interference. The results indicate that the selectivity of the sensor was good.
To study the stability of the sensor, five sensors were fabricated under the same conditions, stored in a dryer for twenty days, and tested every five days. In Figure 9C, the current signal decreased with time. The current signal became 96.6% of the initial current after ten days. After twenty days, the current signal reached 90.7% of the initial current. The results indicate that the sensor had acceptable stability, which can be attributed to the in situ synthesis of Cs@MoS2-Pd NPs with good stability.

3.6. Real Sample Analysis

The performance of the fabricated sensor to real sample analysis was studied by a standard addition method [52]. The QR was detected by the fabricated sensor in 10.0 mL of real sample solution of apple juice and green tea, and the additional amounts were 0, 1.0, 3.0, and 5.0 μL (1.0 mM). The results are listed in Table S4. It can be seen that the RSD of the results was less than 4.27% and the recovery range was between 94.3% and 111%, which indicated that the fabricated sensor was reliable and could be applied to detect QR in real samples. Those results are attributed to its good reproducibility, selectivity, and stability.

4. Conclusions

In this study, an electrochemical sensor based on Cs@MoS2-Pd NPs was fabricated to sensitively detect QR. The conductivity of MoS2 was improved by Cs and Pd NPs, and its aggregation was additionally prevented. Pd NPs with more active surfaces and MoS2 were used as catalytically active components to form a bi-catalysis, which causes Cs@MoS2-Pd NPs to have good catalytic activity toward QR. The oxidation reaction of QR on Cs@MoS2-Pd NPs/GCE belonged to the adsorption–diffusion control process and involved two electrons and two protons. The simulation results showed that the 4′ O–H and 3′ O–H broke successively during the oxidation of QR. Under the optimal experimental conditions, the sensor obtained a calibration curve at I = 0.453 + 0.893 c (μA). The detection range of QR was from 0.5 μM to 12 μM and the limit of detection was 0.02 μM. Good reproducibility, selectivity, and stability provide a good foundation for its practical application. Thus, the sensor has a bright application prospect.

Supplementary Materials

The following are available online at https://0-www-mdpi-com.brum.beds.ac.uk/article/10.3390/chemosensors10020056/s1, reagents and apparatus; preparation of Cs@MoS2-Pd NPs; characterization of Cs@MoS2-Pd NPs by FTIR, XRD, Raman, and Zeta potential; Figure S1: The IR (A) and apparent Zeta potential (D) of Cs, Cs@MoS2, and Cs@MoS2-Pd NPs; XRD (B) and Raman spectroscopy (C) of Cs@MoS2-Pd NPs; Figure S2: The optimization of experimental conditions: pH of PBS (A) and amount of Cs@MoS2-Pd NPs (B); Table S1: The analog datum of EIS; Table S2: The fitted equation and effective area (A); Table S3: Comparison with previous literature; Table S4: Detection of the QR in human serum samples with the proposed sensor.

Author Contributions

Conceptualization, F.P. and Q.H.; methodology, S.F.; software, Y.W. and H.W.; validation, W.L.; writing—original draft preparation, F.P.; writing—review and editing, Q.H. and W.L.; supervision, W.L.; funding acquisition, G.H., Q.H. and W.L. All authors have read and agreed to the published version of the manuscript.

Funding

The work was supported by the National Natural Science Foundation of China (Nos. 51872140, 51972173), High-End Foreign Expert Introduction Program (G20200010151), and Jiangsu Key Laboratory of Advanced Catalytic Materials and Technology (BM2012110), China. We also thank the support of the Analysis and Test Center, Nanjing University of Science and Technology, for SEM, TEM, and XPS data collection.

Institutional Review Board Statement

Not applicable.

Informed Consent Statement

Not applicable.

Data Availability Statement

The data presented in this study are available in the article or Supplementary Materials.

Conflicts of Interest

The authors declare no conflict of interest.

References

  1. Veerapandian, M.; Seo, Y.-T.; Yun, K.; Lee, M.-H. Graphene oxide functionalized with silver@ silica–polyethylene glycol hybrid nanoparticles for direct electrochemical detection of quercetin. Biosens. Bioelectron. 2014, 58, 200–204. [Google Scholar] [CrossRef] [PubMed]
  2. Khani, R.; Sheykhi, R.; Bagherzade, G. An environmentally friendly method based on micro-cloud point extraction for determination of trace amount of quercetin in food and fruit juice samples. Food Chem. 2019, 293, 220–225. [Google Scholar] [CrossRef] [PubMed]
  3. Jiang, W.; Zhang, H.; Wu, J.; Zhai, G.; Li, Z.; Luan, Y.; Garg, S. CuS@ MOF-Based Well-Designed Quercetin Delivery System for Chemo–Photothermal Therapy. ACS Appl. Mater. Interfaces 2018, 10, 34513–34523. [Google Scholar] [CrossRef] [PubMed]
  4. Pradhan, A.; Kumari, A.; Srivastava, R.; Panda, D. Quercetin Encapsulated Biodegradable Plasmonic Nanoparticles for Photothermal Therapy of Hepatocellular Carcinoma Cells. ACS Appl. Bio Mater. 2019, 2, 5727–5738. [Google Scholar] [CrossRef] [PubMed]
  5. Zhou, Z.; Gu, C.; Chen, C.; Zhao, P.; Xie, Y.; Fei, J. An ultrasensitive electrochemical sensor for quercetin based on 1-pyrenebutyrate functionalized reduced oxide graphene/mercapto-β -cyclodextrin /Au nanoparticles composite film. Sens. Actuators B Chem. 2019, 288, 88–95. [Google Scholar] [CrossRef]
  6. Gibellini, L.; Pinti, M.; Nasi, M.; Montagna, J.P.; De Biasi, S.; Roat, E.; Bertoncelli, L.; Cooper, E.L.; Cossarizza, A. Quercetin and cancer chemoprevention. Evid. Based Compl. Alt. 2011, 3, 591356. [Google Scholar] [CrossRef] [PubMed] [Green Version]
  7. Prutskij, T.; Deriabina, A.; Melendez, F.J.; Castro, M.E.; Trejo, L.C.; Vazquez Leon, G.D.; Gonzalez, E.; Perova, T.S. Concentration-Dependent Fluorescence Emission of Quercetin. Chemosensors 2021, 9, 315. [Google Scholar] [CrossRef]
  8. Buiarelli, F.; Bernardini, F.; Di Filippo, P.; Riccardi, C.; Pomata, D.; Simonetti, G.; Risoluti, R. Extraction, Purification, and Determination by HPLC of Quercetin in Some Italian Wines. Food Anal. Methods 2018, 11, 3558–3562. [Google Scholar] [CrossRef]
  9. Robotham, S.A.; Brodbelt, J.S. Regioselectivity of human UDP-glucuronosyltransferase isozymes in flavonoid biotransformation by metal complexation and tandem mass spectrometry. Biochem. Pharmacol. 2011, 82, 1764–1770. [Google Scholar] [CrossRef] [Green Version]
  10. Chen, G.; Zhang, H.W.; Ye, J.N. Determination of rutin and quercetin in plants by capillary electrophoresis with electrochemical detection. Anal. Chim. Acta 2000, 423, 69–76. [Google Scholar] [CrossRef]
  11. Felix, F.S.; Angnes, L. Electrochemical immunosensors–a powerful tool for analytical applications. Biosens. Bioelectron. 2018, 102, 470–478. [Google Scholar] [CrossRef] [PubMed]
  12. Chen, Y.; Liu, B.; Chen, Z.B.; Zuo, X. Innovative Electrochemical Sensor Using TiO2 Nanomaterials to Detect Phosphopeptides. Anal. Chem. 2021, 93, 10635–10643. [Google Scholar] [CrossRef] [PubMed]
  13. Pei, F.; Wang, P.; Ma, E.; Yang, Q.; Yu, H.; Liu, J.; Yin, H.; Li, Y.; Liu, Q.; Dong, Y. A sensitive label-free immunosensor for alpha fetoprotein detection using platinum nanodendrites loaded on functional MoS2 hybridized polypyrrole nanotubes as signal amplifier. J. Electroanal. Chem. 2019, 835, 197–204. [Google Scholar] [CrossRef]
  14. Er, E.; Erk, N. Construction of a sensitive electrochemical sensor based on 1T-MoS2 nanosheets decorated with shape-controlled gold nanostructures for the voltammetric determination of doxorubicin. Microchim. Acta 2020, 187, 1–9. [Google Scholar] [CrossRef]
  15. Li, M.; Zhang, L.; Fan, X.; Wu, M.; Du, Y.; Wang, M.; Kong, Q.; Zhang, L.; Shi, J. Dual synergetic effects in MoS2/pyridine-modified g-C3N4 composite for highly active and stable photocatalytic hydrogen evolution under visible light. Appl. Catal. B Environ. 2016, 190, 36–43. [Google Scholar] [CrossRef]
  16. Huang, J.; Dong, Z.; Li, Y.; Li, J.; Tang, W.; Yang, H.; Wang, J.; Bao, Y.; Jin, J.; Li, R. MoS2 nanosheet functionalized with Cu nanoparticles and its application for glucose detection. Mater. Res. Bull. 2013, 48, 4544–4547. [Google Scholar] [CrossRef]
  17. Zhang, Z.; Li, W.; Yuen, M.F.; Ng, T.-W.; Tang, Y.; Lee, C.-S.; Chen, X.; Zhang, W. Hierarchical composite structure of few-layers MoS2 nanosheets supported by vertical graphene on carbon cloth for high-performance hydrogen evolution reaction. Nano Energy 2015, 18, 196–204. [Google Scholar] [CrossRef]
  18. Xia, S.; Wang, Y.; Liu, Y.; Wu, C.; Wu, M.; Zhang, H. Ultrathin MoS2 nanosheets tightly anchoring onto nitrogen-doped graphene for enhanced lithium storage properties. Chem. Eng. J. 2018, 332, 431–439. [Google Scholar] [CrossRef]
  19. Sun, Y.-F.; Sun, J.-H.; Wang, J.; Pi, Z.-X.; Wang, L.-C.; Yang, M.; Huang, X.-J. Sensitive and anti-interference stripping voltammetry analysis of Pb (II) in water using flower-like MoS2/rGO composite with ultra-thin nanosheets. Anal. Chim. Acta 2019, 1063, 64–74. [Google Scholar] [CrossRef]
  20. Li, J.; Hou, Y.; Gao, X.; Guan, D.; Xie, Y.; Chen, J.; Yuan, C. A three-dimensionally interconnected carbon nanotube/layered MoS2 nanohybrid network for lithium ion battery anode with superior rate capacity and long-cycle-life. Nano Energy 2015, 16, 10–18. [Google Scholar] [CrossRef]
  21. Kong, L.; Lu, X.; Bian, X.; Zhang, W.; Wang, C. Accurately tuning the dispersity and size of palladium particles on carbon spheres and using carbon spheres/palladium composite as support for polyaniline in H2O2 electrochemical sensing. Langmuir 2010, 26, 5985–5990. [Google Scholar] [CrossRef] [PubMed]
  22. Singh, G.; Ismail, I.S.; Bilen, C.; Shanbhag, D.; Sathish, C.; Ramadass, K.; Vinu, A. A facile synthesis of activated porous carbon spheres from d-glucose using a non-corrosive activating agent for efficient carbon dioxide capture. Appl. Energy 2019, 255, 113831. [Google Scholar] [CrossRef]
  23. Elemike, E.E.; Onwudiwe, D.C.; Wei, L.; Chaogang, L.; Zhiwei, Z. Noble metal–semiconductor nanocomposites for optical, energy and electronics applications. Sol. Energy Mater. Sol. Cells 2019, 201, 110106. [Google Scholar] [CrossRef]
  24. Cui, Y.; Li, J.; Liu, M.; Tong, H.; Liu, Z.; Hu, J.; Qian, D. Convenient synthesis of three-dimensional hierarchical CuS@Pd core-shell cauliflowers decorated on nitrogen-doped reduced graphene oxide for non-enzymatic electrochemical sensing of xanthine. Microchim. Acta 2020, 187, 1–11. [Google Scholar] [CrossRef] [PubMed]
  25. Lv, H.; Li, Y.; Zhang, X.; Gao, Z.; Zhang, C.; Zhang, S.; Dong, Y. Enhanced peroxidase-like properties of Au@ Pt DNs/NG/Cu2+ and application of sandwich-type electrochemical immunosensor for highly sensitive detection of CEA. Biosen. Bioelectron. 2018, 112, 1–7. [Google Scholar] [CrossRef] [PubMed]
  26. Sun, X.; Li, Y. Colloidal carbon spheres and their core/shell structures with noble—Metal nanoparticles. Angew. Chem. Int. Ed. 2004, 43, 597–601. [Google Scholar] [CrossRef] [PubMed]
  27. Zhang, S.; Hu, R.; Dai, P.; Yu, X.; Ding, Z.; Wu, M.; Li, G.; Ma, Y.; Tu, C. Synthesis of rambutan-like MoS2/mesoporous carbon spheres nanocomposites with excellent performance for supercapacitors. Appl. Surf. Sci. 2017, 396, 994–999. [Google Scholar] [CrossRef]
  28. Xiao, P.; Buijnsters, J.G.; Zhao, Y.; Yu, H.; Xu, X.; Zhu, Y.; Tang, D.; Zhu, J.; Zhao, Z. Fullerene-like WS2 supported Pd catalyst for hydrogen evolution reaction. J. Catal. 2019, 380, 215–223. [Google Scholar] [CrossRef]
  29. Marković, Z.; Amić, D.; Milenković, D.; Dimitrić-Marković, J.M.; Marković, S. Examination of the chemical behavior of the quercetin radical cation towards some bases. Phys. Chem. Chem. Phys. 2013, 15, 7370–7378. [Google Scholar] [CrossRef]
  30. Lu, T.; Chen, F. Quantitative analysis of molecular surface based on improved Marching Tetrahedra algorithm. J. Mol. Graph. Modell. 2012, 38, 314–323. [Google Scholar] [CrossRef]
  31. Lu, T.; Chen, F. Bond order analysis based on the Laplacian of electron density in fuzzy overlap space. J. Phys. Chem. A 2013, 117, 3100–3108. [Google Scholar] [CrossRef] [PubMed]
  32. Zhao, X.; Lei, Y.; Fang, P.; Li, H.; Han, Q.; Hu, W.; He, C. Piezotronic effect of single/few-layers MoS2 nanosheets composite with TiO2 nanorod heterojunction. Nano Energy 2019, 66, 104168. [Google Scholar] [CrossRef]
  33. Li, M.; Li, W.; Liu, S. Control of the morphology and chemical properties of carbon spheres prepared from glucose by a hydrothermal method. J. Mater. Res. 2012, 27, 1117–1123. [Google Scholar] [CrossRef]
  34. Wang, H.; Skeldon, P.; Thompson, G. XPS studies of MoS2 formation from ammonium tetrathiomolybdate solutions. Surf. Coat. Technol. 1997, 91, 200–207. [Google Scholar] [CrossRef]
  35. Niu, Y.; Wang, R.; Jiao, W.; Ding, G.; Hao, L.; Yang, F.; He, X. MoS2 graphene fiber based gas sensing devices. Carbon 2015, 95, 34–41. [Google Scholar] [CrossRef]
  36. Hu, Q.-Y.; Zhang, R.-H.; Chen, D.; Guo, Y.-F.; Zhan, W.; Luo, L.-M.; Zhou, X.-W. Facile aqueous phase synthesis of 3D-netlike Pd–Rh nanocatalysts for methanol oxidation. Int. J. Hydrog. Energy 2019, 44, 16287–16296. [Google Scholar] [CrossRef]
  37. Cheng, G.G.; Dong, L.J.; Kamboj, L.; Khosla, T.; Wang, X.D.; Zhang, Z.Q.; Guo, L.Q.; Pesika, N.; Ding, J.N. Hydrothermal Synthesis of Monodisperse Hard Carbon Spheres and Their Water-Based Lubrication. Tribol. Lett. 2017, 65, 147. [Google Scholar] [CrossRef]
  38. Song, Y.J.; Cao, K.H.; Li, W.J.; Ma, C.Y.; Qiao, X.W.; Li, H.L.; Hong, C.L. Optimal film thickness of rGO/MoS2 @ polyaniline nanosheets of 3D arrays for carcinoembryonic antigen high sensitivity detection. Microchem. J. 2020, 155. [Google Scholar] [CrossRef]
  39. Seo, J.C.; Umirov, N.; Park, S.B.; Lee, K.; Kim, S.S. Microalgae-derived hollow carbon-MoS2 composite as anode for lithium-ion batteries. J. Ind. Eng. Chem. 2019, 79, 106–114. [Google Scholar] [CrossRef]
  40. Yu, X.; Shi, J.J.; Wang, L.; Wang, W.T.; Bian, J.J.; Feng, L.J.; Li, C.H. A novel Au NPs-loaded MoS2/RGO composite for efficient hydrogen evolution under visible light. Mater. Lett. 2016, 182, 125–128. [Google Scholar] [CrossRef]
  41. Khorablou, Z.; Shahdost-Fard, F.; Razmi, H. Flexible and highly sensitive methadone sensor based on gold nanoparticles/polythiophene modified carbon cloth platform. Sens. Actuators B Chem. 2021, 344, 130284. [Google Scholar] [CrossRef]
  42. Feng, X.; Yin, X.; Bo, X.; Guo, L. An ultrasensitive luteolin sensor based on MOFs derived CuCo coated nitrogen-doped porous carbon polyhedron. Sens. Actuators B Chem. 2019, 281, 730–738. [Google Scholar] [CrossRef]
  43. Ponnaiah, S.K.; Periakaruppan, P. A glassy carbon electrode modified with a copper tungstate and polyaniline nanocomposite for voltammetric determination of quercetin. Microchim. Acta 2018, 185, 524. [Google Scholar] [CrossRef] [PubMed]
  44. Karthika, A.; Raja, V.R.; Karuppasamy, P.; Suganthi, A.; Rajarajan, M. A novel electrochemical sensor for determination of hydroquinone in water using FeWO4/SnO2 nanocomposite immobilized modified glassy carbon electrode. Arab. J. Chem. 2020, 13, 4065–4081. [Google Scholar] [CrossRef]
  45. Ansari, S.; Ansari, M.S.; Satsangee, S.; Jain, R. WO3 decorated graphene nanocomposite based electrochemical sensor: A prospect for the detection of anti-anginal drug. Anal. Chim. Acta 2019, 1046, 99–109. [Google Scholar] [CrossRef]
  46. Marković, Z.; Milenković, D.; Đorović, J.; Marković, J.M.D.; Stepanić, V.; Lučić, B.; Amić, D. PM6 and DFT study of free radical scavenging activity of morin. Food Chem. 2012, 134, 1754–1760. [Google Scholar] [CrossRef]
  47. Şenocak, A.; Köksoy, B.; Demirbaş, E.; Basova, T.; Durmuş, M. 3D SWCNTs-coumarin hybrid material for ultra-sensitive determination of quercetin antioxidant capacity. Sens. Actuators B Chem. 2018, 267, 165–173. [Google Scholar] [CrossRef]
  48. Tchieno, F.M.M.; Tonle, I.K.; Njanja, E.; Ngameni, E. A sensitive and low-cost analytical method for the electrochemical determination of quercetin, based on 1-ethylpyridinium bromide/carbon paste composite electrode. Int. J. Chem. 2015, 7, 27. [Google Scholar] [CrossRef]
  49. Piovesan, J.V.; Spinelli, A. Determination of quercetin in a pharmaceutical sample by square-wave voltammetry using a poly (vinylpyrrolidone)-modified carbon-paste electrode. J. Braz. Chem. Soc. 2014, 25, 517–525. [Google Scholar] [CrossRef]
  50. Wu, D.; Chen, Z. ZnS quantum dots-based fluorescence spectroscopic technique for the detection of quercetin. Luminescence 2014, 29, 307–313. [Google Scholar] [CrossRef]
  51. Gutiérrez, F.; Ortega, G.; Cabrera, J.L.; Rubianes, M.D.; Rivas, G.A. Quantification of quercetin using glassy carbon electrodes modified with multiwalled carbon nanotubes dispersed in polyethylenimine and polyacrylic acid. Electroanalysis 2010, 22, 2650–2657. [Google Scholar] [CrossRef]
  52. Liu, Y.-Y.; Fan, J.-J.; He, F.; Li, X.-N.; Tang, T.-T.; Cheng, H.; Li, L.; Hu, G.-Z. Glycosyl/MOF-5-based carbon nanofibers for highly sensitive detection of anti-bacterial drug quercetin. Surf. Interfaces 2021, 27, 101488. [Google Scholar] [CrossRef]
Figure 1. Schematic of the preparation of Cs@MoS2-Pd NPs and fabrication of the electrochemistry sensor.
Chemosensors 10 00056 g001
Figure 2. The SEM images of Cs (A), Cs@MoS2 (B), and Cs@MoS2-Pd NPs (C). The TEM images of Cs@MoS2-Pd NPs (D,E) and their EDS images (F).
Chemosensors 10 00056 g002
Figure 3. High-resolution XPS spectra for Cs@MoS2-Pd NPs: C 1s (A), S 2p (B), Mo 3d (C), Pd 3d (D).
Chemosensors 10 00056 g003
Figure 4. The SWV (A) of GCE (a), Cs/GCE (b), MoS2/GCE (c), Cs@MoS2/GCE (d), and Cs@MoS2-Pd NPs/GCE (e); the EIS (B) of GCE (a), MoS2/GCE (b), Cs@MoS2/GCE (c), and Cs@MoS2-Pd NPs/GCE (d); chronocoulometry curves (C) of GCE (a), Cs/GCE (b), Cs@MoS2/GCE (c), and Cs@MoS2-Pd NPs/GCE (d); and plot of Q versus t1/2 (D).
Chemosensors 10 00056 g004
Figure 5. The CV of Cs@MoS2-Pd NPs/GCE in 10 μM QR (A); the relationship between peak current and v (B) and v1/2 (C); rhe relationship between peak potential and lnv (D).
Chemosensors 10 00056 g005
Figure 6. The CV of Cs@MoS2-Pd NPs/GCE in 10 μM QR with different pHs (A) and their oxidation peak potential changes (B) from 3.0 to 8.0; the electrostatic potential(C) and Laplacian bond order (D) of QR, optimized using the B3LYP functional, with the 6-311 + G(d,p) basis set.
Chemosensors 10 00056 g006
Figure 7. The schemata of the oxidation of QR.
Chemosensors 10 00056 g007
Figure 8. The SWV of sensor in different concentrations of QR from 0.5 to 12 μM (A) and their calibration curve of concentration and current (B).
Chemosensors 10 00056 g008
Figure 9. The reproducibility (A), selectivity (B), and stability (C) of sensor in PBS with 6 μM QR.
Chemosensors 10 00056 g009
Publisher’s Note: MDPI stays neutral with regard to jurisdictional claims in published maps and institutional affiliations.

