1. Introduction
Cultural heritage (CH) preservation is nowadays understood as a two-phase action: on one hand, it consists of restoring and recovering damaged CH elements; on the other hand, increasing attention is directed to monitoring the parameters responsible for the CH artifacts’ degradation.
A new emerging problem in CH preservation regards the phenomena of degradation caused by compounds produced by the CH items themselves. This problem is particularly complicated for numerous factors: compounds to be monitored depend on the nature of the CH item [
1,
2,
3]. Even objects of the same general type may produce different compounds depending on specific previous treatments and restorations performed on them. Harmful compounds released by the CH item are often mixed with numerous other released substances; thus, specific sensors must be used. Harmful compounds must be detected at the onset of the process, meaning low detection limits are required for the sensor.
Environment condition monitoring is also critical to ensure that sensors and measuring devices can perform satisfactorily. The conditions to be monitored are temperature, pressure, humidity of measured gas representing the main parameters to monitor in museums in order to establish the conservation status of CH objects.
A case of application is the preservation of historical photographical and movie films. CH movie films can go as back as early the beginning of the 20th century while photographic films can date to even earlier. Both movies and photographic films used cellulose esters as support on which the photosensitive compounds were applied. The two main cellulose esters used (in order of time) were cellulose (di and tri) nitrate and cellulose (poly)acetate. Both polymers have good flexibility and mechanical resistance but over time they undergo various degradation processes that makes them rigid, brittle and, finally, unsuitable for reproduction and/or visualization. The two types of film polymer undergo different degradation pathways, meaning that sensors selective for different compounds are needed.
Cellulose nitrate is a common semi-synthetic plastic film, formally known as “celluloid”, and was widely used until 1940 when it started to be phased out in favor of cellulose (poly)acetate.
Cellulose acetate is another very common semi-synthetic plastic film. Its use in both cinematographic and photographic films started around 1930 and completely supplanted celluloid between 1940 and 1950. Cellulose acetate consists of linear cellulose polymers in which each glucose monomer has two or three -OH groups functionalized as acetate ester [
4,
5]. Triphenyl phosphate is the most common plasticizer used for acetate films in quantities from 5–25% by weight of the cellulose ester [
6,
7,
8,
9]. The degradation of cellulose acetate is a two-stage process: in the first step, water from air humidity promotes the breakage of an ester bond between glucose and an acetate group. The product of this step is a (n-1) acetate glucose and an acetic acid molecule. The second step of the degradation involves the acetic acid produced in the first step: a sufficiently high concentration of acetic acid will start an autocatalytic breakage process of the glucose-acetate ester bond. This process will become autocatalytic, resulting in a rapid degradation of the film once threshold concentrations of acetic acid are reached [
10,
11,
12]. If the cellulose acetate film is put in a storage where there is already a high concentration of acid vapors (i.e., the presence of already degraded cellulose acetate films), the degradation process can immediately move to the second phase, with a very high degradation speed. It is thus very important to frequently monitor both the degradation state of the cinematographic films and their possible acetic acid contamination due to storage near already degraded films.
The current recognized technique to measure acetic acid produced during film degradation is by using A-D strips. These are small paper strips, soaked with an acid-base indicator, which shift in color from blue, through shades of green and finally yellow in the presence of increasing amount of acetic acid [
13,
14]. Although these strips allow a rough evaluation of the degradation state of the film, they depend strongly on the operator interpretation (acetic acid concentration is calculated by comparing A-D strip color to a provided reference) and make it difficult to monitor the ongoing conditions of very large film collections.
In this work, we present an alternative, innovative solution for monitoring the conditions of cellulose-based films by quantifying the acetic acid released during degradation. A metal oxide semiconductor (MOS) sensors duplex has been assembled, testing different commercially available resistive MOS sensors, optimizing the sensor choice in order to create a sensing duplex capable of selectively quantifying acetic acid coming from cellulose acetate cinematographic films degradation. MOS-type sensors were chosen since numerous literature sources reports them as having low limit of detection, being quite selective for their target gas(es) and having extremely low energy and space requirements compared to other detection tools having similar analytical properties [
15,
16,
17]. These last points are of particular interest for the case discussed here, since the developed sensing solution aims to be integrated directly into old cinematographic film boxes in order to provide real-time estimation of the undergoing degradation. The sensor duplex was tested first against known concentrations of acetic acid and with the main secondary released vapor, as found with SPME-GC/MS measurements, and finally with real cinematographic film samples. The results were validated by comparison with those obtained employing the official degradation level determination system for cellulose acetate cinematographic films, A-D strips. Finally, software was written to automatically acquire data from the sensing array, display them both in numerical and graphical form, and perform calculations to determine the acetic acid concentration regardless of interferents. The obtained system can thus remotely monitor the degradation level of cellulose acetate-based films by quantifying the acetic acid present in the film box, allowing for sensitive (30 ppb detection limit vs. 500 ppb of A-D strips), fast (10-min incubation in the box vs. 24+ hours with A-D strips) and safe (no exposure of human operator to gasses accumulated in the box during storage) cinematographic films monitoring and preservation.
2. Materials and Methods
2.1. Materials
Materials used in this study are ethanol, pure acetic acid (98%), acetone, methyl chloride, 1-butanol, purchased from Sigma Aldrich (St. Louis, MO, USA). Metal Oxide Semiconductor (MOS) sensors were bought from Figaro USA, Inc. (Figaro USA, Inc. Arlington Heights, IL 60005 USA), electrical components were bought from RS Components S.r.l (RS Components S.r.l Sesto San Giovanni, Milan, Italy). Arduino Board UNO was bought from Italian Arduino Authorized Distributor (Melopero S.r.l., Rome, Italy). Milli-Q water was used in all experiments that required sample dilution.
2.2. Scanning Electron Microscopy and Raman Spectroscopy
Morphology and chemical properties of selected sensors were studied by scanning electron microscopy (SEM, JEOL, Tokyo, Japan), JEOL JSM’7001F (JEOL, Tokyo, Japan) with energy-dispersive X-ray analysis (EDX). To study the phase of thin-layer metal oxides, Raman spectroscopy (Renishaw micro-Raman spectrometer, Renishaw, Wotton-under-Edge, England) was used. The Raman spectra were excited by a 633 nm laser with a power 0.5 mW.
2.3. Mathematical Data Processing and Gas Concentration Calculation
All mathematical systems used to process the data produced by the assembled MOS sensor duplex and the codes used to calculate acetic acid concentration were written using the GNU language R.
2.4. Evaluation of Film Degradation by Colorimetric Paper Strips
A-D Strips (RIT Image Permanence Institute, Rochester Institute of Technology/IPI, Rochester, NY, USA) are small paper strips imbibed with a chemical that changes color upon exposition to acid vapors. These strips are considered the official methodology to evaluate the degradation level of cellulose acetate-based films [
18]. The evaluation is performed as follows: one A-D strip is put inside the box containing the film to evaluate its degradation level. The box is closed and at least 24 h are allowed to pass (depending on storage temperature of the film, film stored in refrigerated rooms will require longer incubation times). The strip is then recovered, and its color is compared to a reference to evaluate the degradation level of the film. The color will vary from blue (level 0) corresponding to no significant degradation, up to bright yellow (level 3) corresponding to almost completely degraded films. It is possible to calculate the amount of acetic acid released by the film sample by using the conversion table provided with the A-D strips [
18].
2.5. Sample Selection
A total of 48 film and photographic reels made of cellulose acetate were selected for testing. Three further reels, made of different materials (i.e., polyester-PET, cellulose nitrate), were added to act as negative controls for the test. For each sample, the degradation level and corresponding acetic acid concentration were determined using A-D strips. The samples chosen are reported in
Table 1, along with information provided by the owner, degradation level determined by means of A-D strips, and corresponding acetic acid concentration in the film box [
18].
2.6. Analysis of Volatiles Released by Films Using Contact Solid-Phase Micro-Extraction (SPME) Coupled with Gas Chromatography /Mass Spectrometry (GC/MS)
A total number of 25 films, selected from those reported above as having different degradation and conservation status, based on the carrier material cellulose acetate were analyzed under controlled climatic storage conditions, using contact solid-phase microextraction (SPME) (Merck KGaA, Darmstadt, Germany) coupled with gas chromatography/mass spectrometry (GC/MS) (HP 5890, Hewlet Packard inc., Palo Alto, CA, USA; MSD 5972, Agilent Santa Clara, CA, USA; Column: ZB-5 HT, Zebron, Phenomex, Torrance, CA, USA).
The SPME techniques allows the sampling, extraction, concentration, and sample introduction into the column to be performed as a single step, without the need for organic solvent for sample extraction or complex procedures to calculate sample dilution and loss. This comparatively simple and efficient method, which has been widely used in different fields of analytical chemistry such as environmental and food analysis, is based on the extraction of solutes and volatiles from a sample matrix employing a highly absorptive polymeric layer coated onto a solid fused silica fiber. After a fixed exposure time of the fiber to the sample, equilibrium is reached between analytes in the matrix and analytes absorbed on the fiber and the extracted mass are, from this moment on, maximized and constant. The concentration of extracted analytes is thus proportional to their concentration in the sample. The SPME fiber with the absorbed analytes is directly inserted into the injection system of the gas chromatograph (GC), where the analytes desorb into the gas mobile phase (helium) which also acts as a carrier. In conjunction with the insertion of the fiber in the injector, the GC analysis is started.
The described method has been routinely used for gas chromatography (GC) and gas chromatography/mass spectrometry (GC/MS) analyses and successfully applied to a wide variety of compounds, especially for the extraction of volatile and semi-volatile organic compounds from industrial, environmental, biological and food samples [
19], as well as for analyses of volatile compounds in the context of cultural heritage objects [
20,
21].
Since the method is non-destructive, it can be applied to valuable original films, without damage or need of destructive sampling. Adapting the application of the method described in Lattuati et al. [
20], in this particular case, the atmosphere was analyzed directly in the original film cans using divinylbenzol/carboxen/polydimethylsiloxane (DVB/CAR/PDMS) fibers, which were chosen to obtain general analysis results including polar analytes. The exposure time of the fibers was optimized to the analytes and, therefore, was determined to 24 h under a controlled climatic storage environment of 20 °C and 45% relative humidity (RH). GC/MS was performed with Agilent HP 5890/MSD 5972, Column: Zebron ZB-5 HT, 0.25 mm, He 1 mL/min. Injector Liner 1 mm i.D., Desorption of SPME-fibers 250 °C. Oven: 2 min at 50 °C, heating with 10°/min up to 300 °C. MSD Transfer Line 280 °C, Scan mode measurement: 10 to 650 units.
2.7. Analysis Results and Findings
The results obtained from the SPME-GC/MS measurements allow the analysis of off-gassing chemicals inside the closed original film boxes or cans and, therefore, can give essential findings about the composition of the atmosphere inside such a film box. The samples tested comprise several naturally aged historical film samples of various deterioration stages on cellulose acetate base, with different types of film materials (positive, negative, black and white, color).
The variety of out-gassing chemicals is large and inconsistent and reflects all aspects of the history of the individual film roll:
Original composition;
Chemicals used within the development process (to a minor extent);
Storage conditions and their influences on chemical degradation;
Actual deterioration stage;
Treatment during use and long-time storage (e.g., influences from cleaning chemicals, chemicals added for preservation issues, etc.);
Influence of long-time storage container (ventilated vs. non ventilated, inert materials vs. chemically reactive materials, etc.).
To a minor extent, the measurement process itself gives variations in results, due to the influence of the position of the SPME fiber, the RH and temperature during sampling.
Both factors were minimized to the best possible extent, e.g., RH and temperature were kept constant and stable for all measurements as well as for storage of the film samples (controlled and documented storage conditions, access storage, 20 °C/45%RH), and the fibers were positioned in close contact on similar and comparable positions on the respective film rolls.
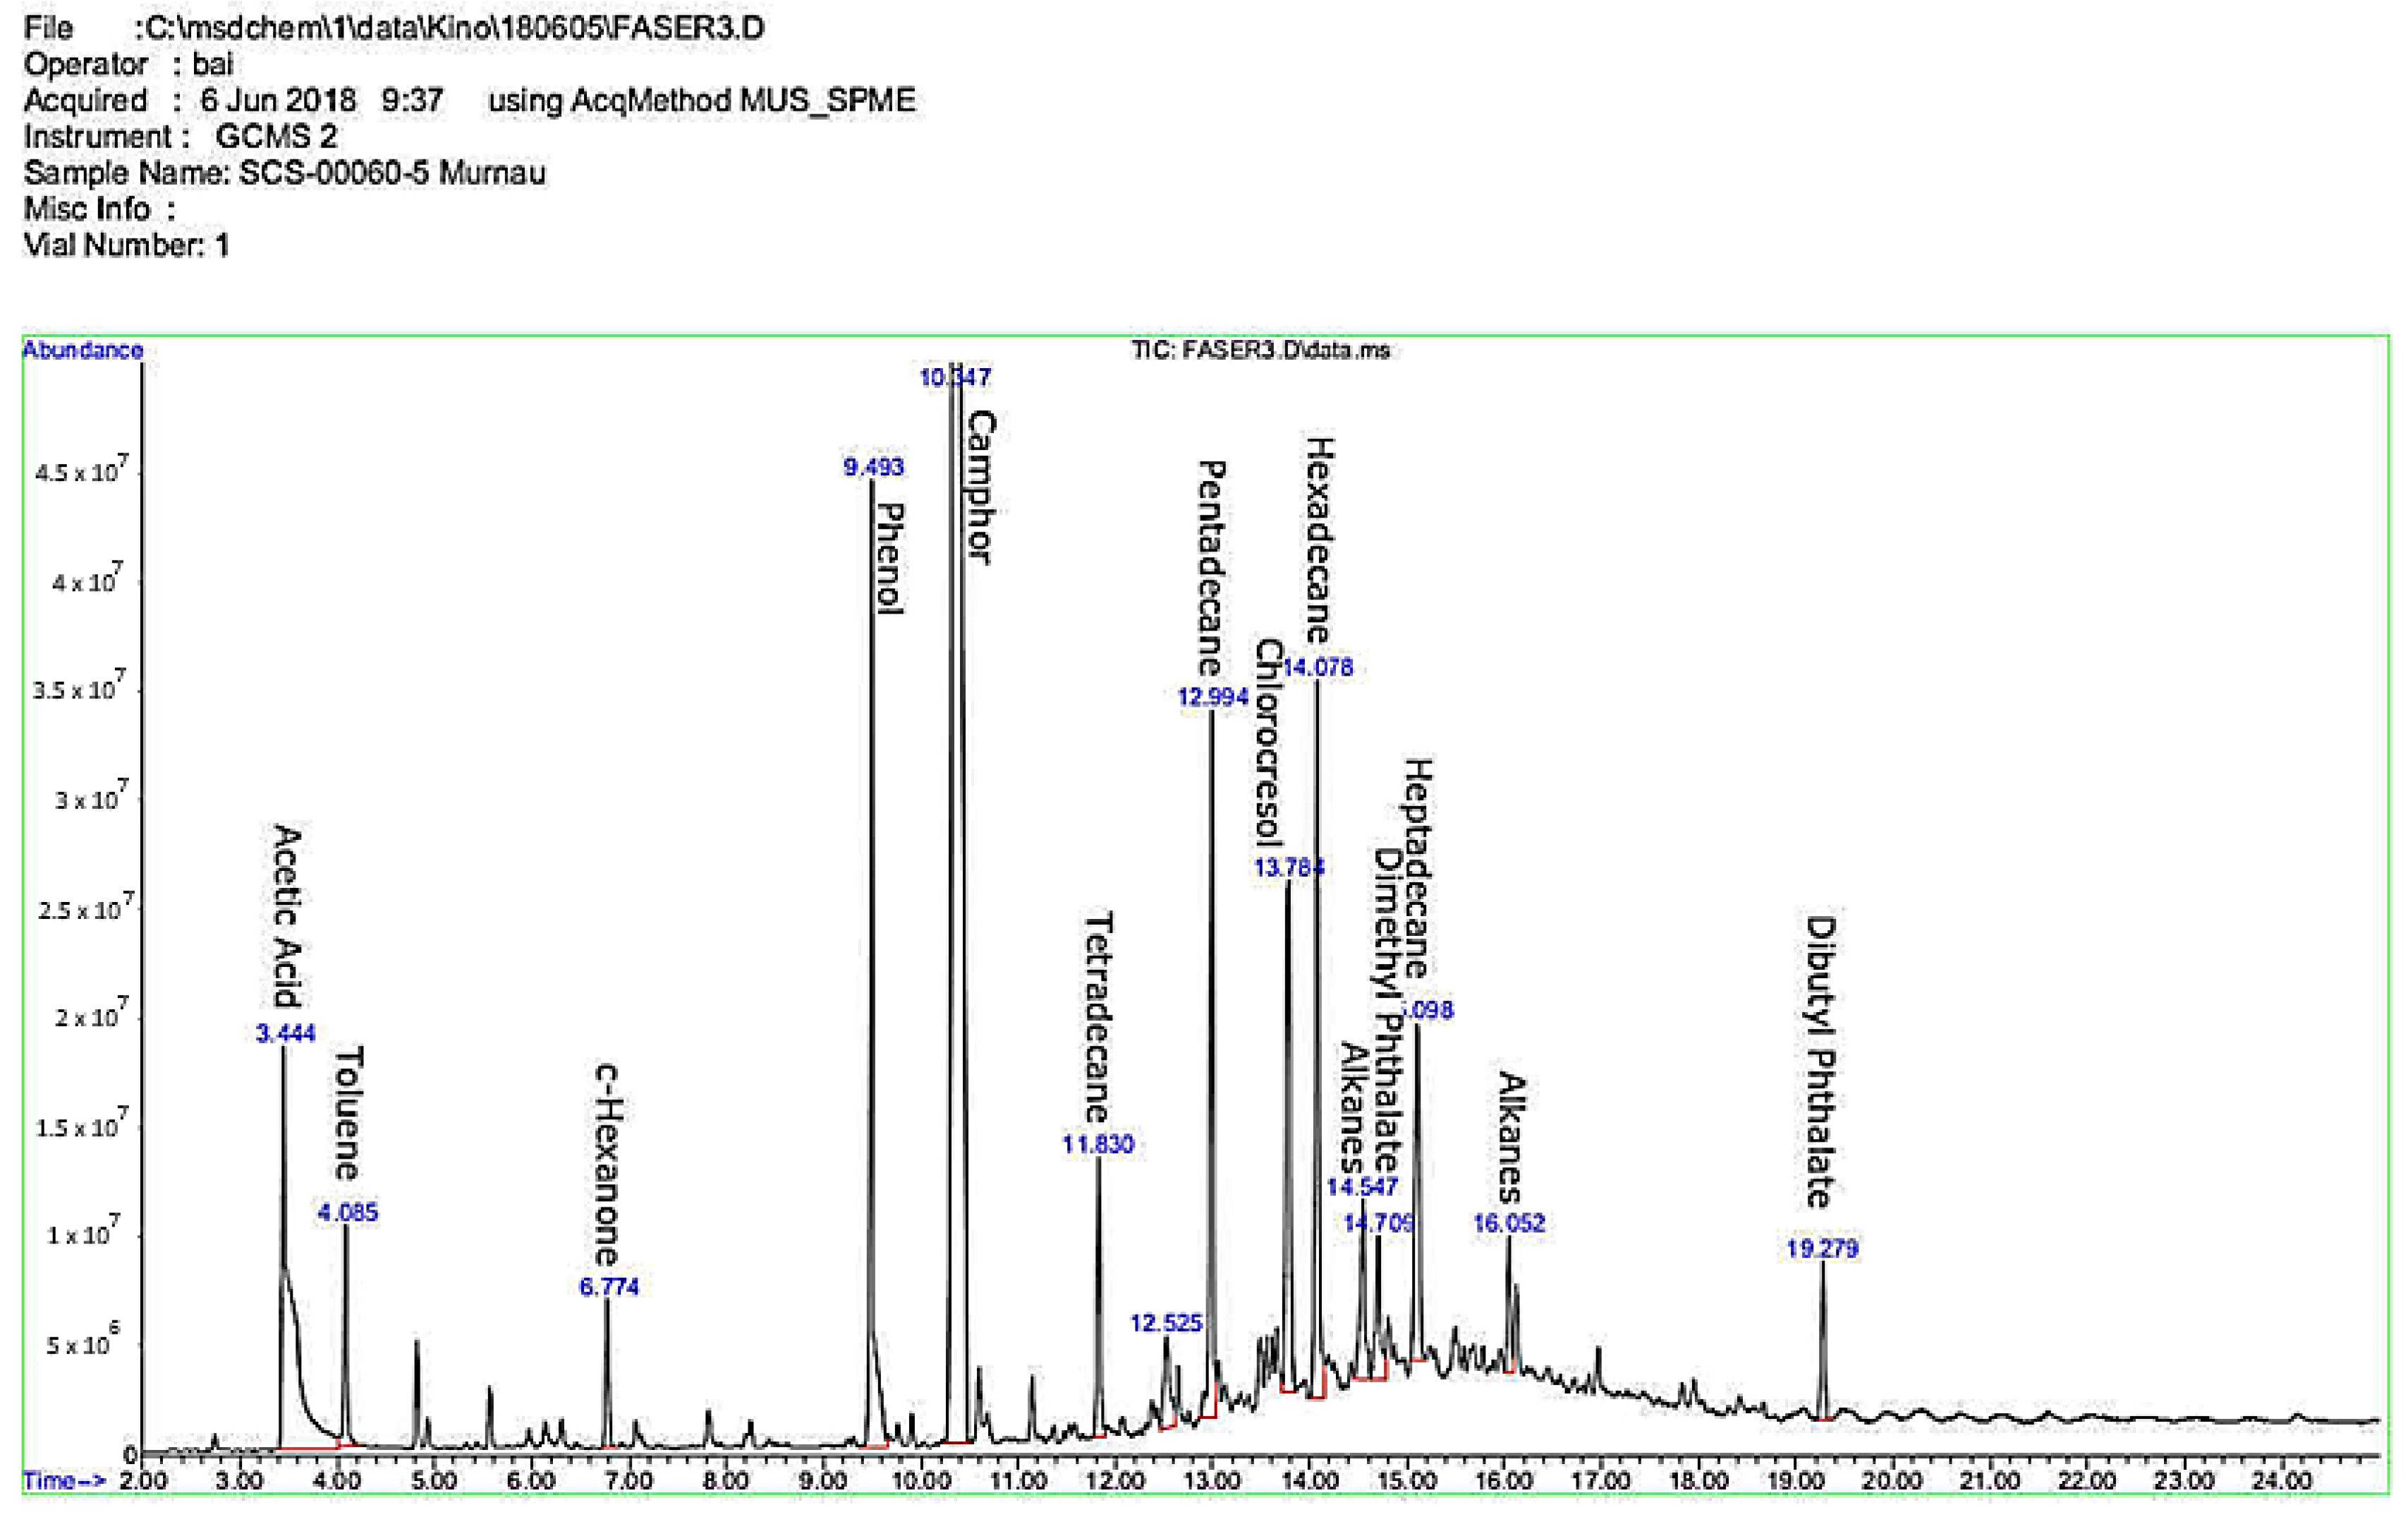
As an example, the SPME-GC/MS chromatograms of two films are reported in
Figure 1 and
Figure 2. The first figure shows the SPME-GC/MS chromatogram analysis results obtained from sample SCS-00060-5, cellulose acetate based black and white positive film, (manufacturer: Perutz, dated 1953) in a comparatively low deterioration stage (A-D strip level 1.5). Interestingly, phenol and camphor show high peaks, followed by the peak regions of alkanes and phthalates. A toluene peak is detected in the neighboring area.
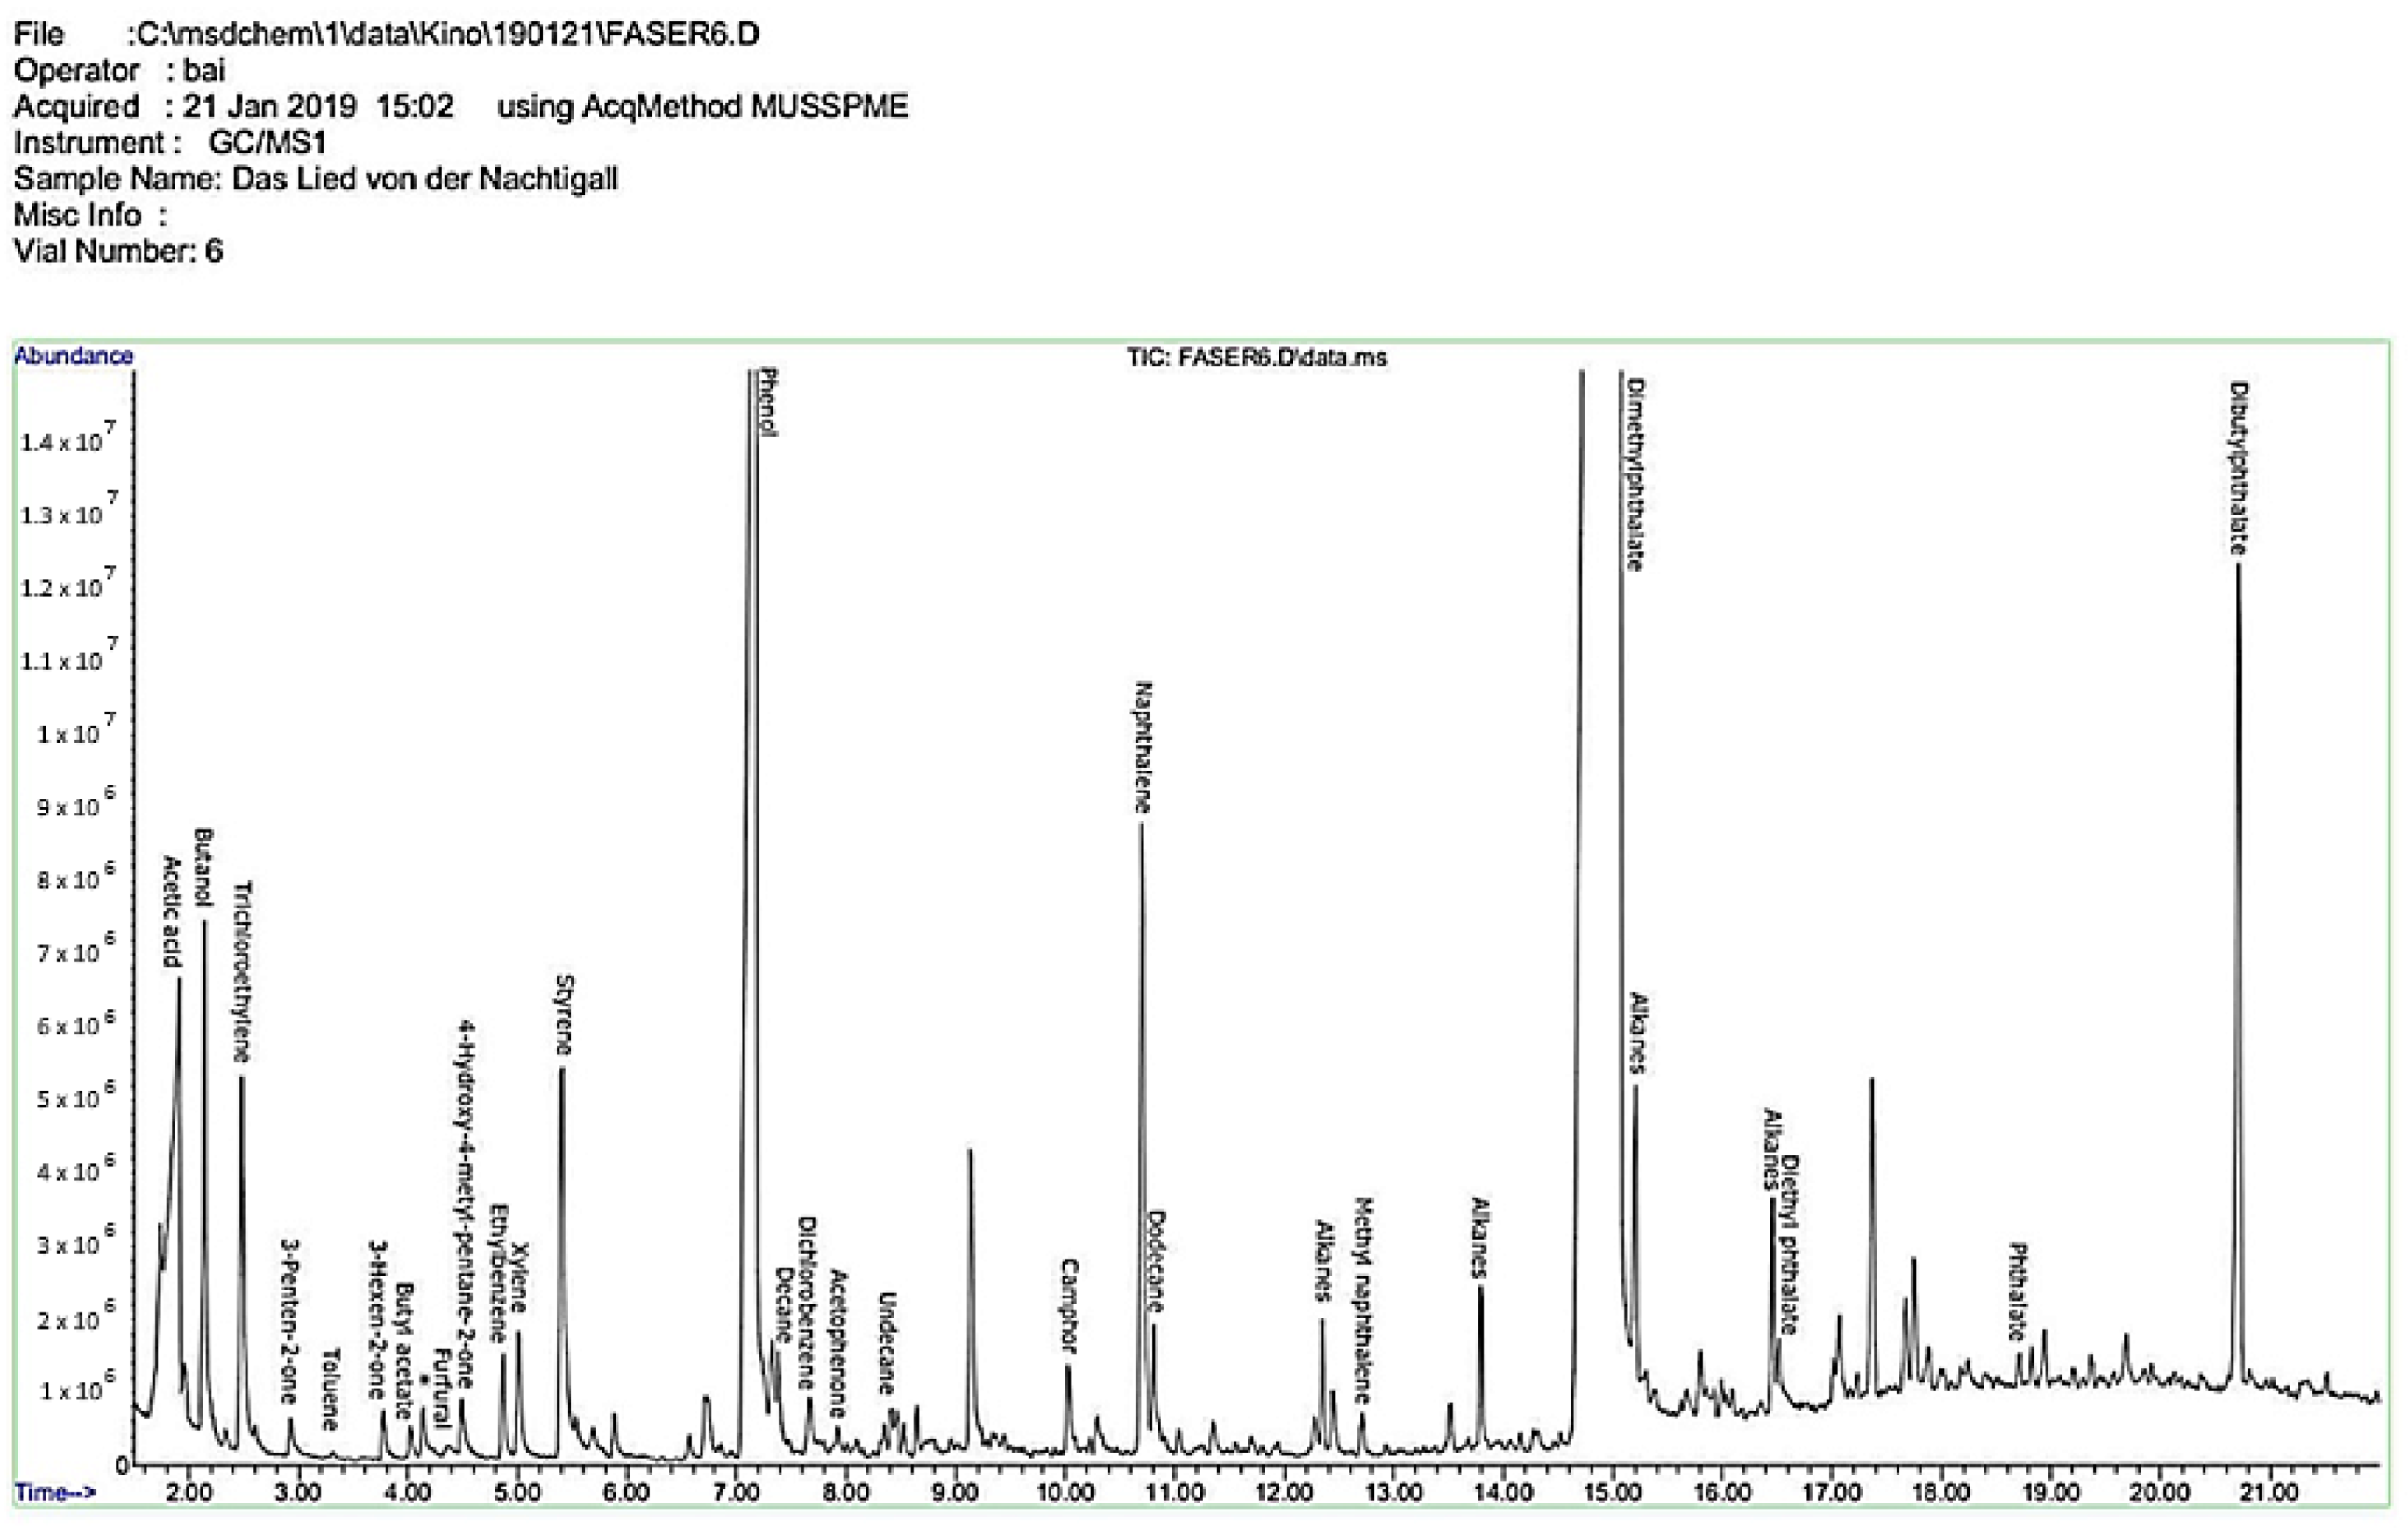
Figure 2 shows the SPME-GC/MS chromatogram analysis results obtained from sample DFF_12_584, a 16 mm cellulose acetate based black and white positive film, in a low deterioration stage (A-D strip level 1.5–2). A butanol peak is detected in the direct neighboring area of acetic acid, and besides phenol and plasticizers (phthalates), a high amount of naphthalene was detected.
With cellulose acetate films, in many cases, some chemicals show higher peaks (and, therefore, higher levels, according to the semi-quantitative measuring method) than acetic acid. It is interesting to note that in several samples very high amounts of naphthalene were present, most probably a decomposition byproduct of diacetate films, where monochloronaphthalene was used as a plasticizer. It can also be assumed that naphthalene was used as insecticide, respectively as a protective chemical.
To summarize the results, a high and diverse variety of chemicals was detected. This fact is a very important finding, because in practice this means that film material of the same charge, manufacturer and period can be developed, stored, used, and treated differently during its history of use and, in combination with the numerous decomposition byproducts, therefore can evaporate different chemicals. The variety of the chemicals detected is large but can be categorized in main groups of acids (acetic acid, butanoic acid, hexanoic acid), alkanes, short chain alcohols, phenols, naphthalene, and phthalates.
2.8. Sensors Positioning in Film Boxes
In order to provide accurate, real-time data concerning the amount of acetic acid released by degrading films, the sensors should be put as close as possible to the cinematographic film. At the same time, to provide repeatable value, prevent cross-contamination and protect the sensors from mechanical damage by impact with the films, a significant distance and/or physical separation should be put between cinematographic film and sensors. In this work, we have tried to reconcile these two needs by producing two small holes on the top of the film container, through which the sensors were inserted to sample the air inside the box. An external structure, with minimized thickness, weight and integrating the Arduino board, anchored the sensors in place, providing power and acquiring the data, to be transmitted to the computer.
3. Results
3.1. Selection of Gas Sensors
To provide an accurate, real-time estimation of the amount of acetic acid accumulating during cellulose acetate films degradation, it was necessary firstly to identify the most common species released by the film during the degradation process. From literature sources [
22,
23,
24,
25,
26], it was found that the average cellulose film degradation releases short organic acids (used for cellulose esterification, mainly acetic acid), various solvents using during the film manufacture, and residues of products used in conservation treatments (mainly butanol, used as antifungal treatment).
To define which vapors were most prominently emitted, cellulose acetate cinematographic films were analyzed by means of SPME-GC/MS. The results obtained are reported in
Section 2.7. From the reported data it emerged that, as expected, the main marker of cellulose acetate film degradation is acetic acid, but other volatiles are also released, such as phenols, short chain alcohols, and naphthalene.
To the best of our knowledge, there are no commercial sensors currently available which are, at the same time, capable of quantifying acetic acid down to ppb level (as required to intervene before autocatalytic phenomena begin), do not respond to other volatiles released during film storage, and have extremely low space and power consumption requirements to make them suitable for long-term monitoring inside the boxes of historical cinematographic films To solve this problem, two sensors were selected, based on literature [
27,
28,
29]: one showing higher response when exposed to acetic acid compared to other similar volatiles (such as trans-2-nonenal, pelargonic acid, diacetyl, butyl acetate, and n-decane), and a second one reported to be more selective towards short chain alcohols (such as ethanol, propanol, butanol). The first sensor will hereafter be identified as BIOS1 while the second will be identified as BIOS2.
3.2. Sensor Thin Layer Analysis
SEM, EDX and Raman analysis were performed on the surface of the chosen MOS sensors to understand if the different responses obtained depended on some different physic-chemical property of the MOS layers (i.e., layer thickness, layer surface roughness, metal oxide composing the thin layer).
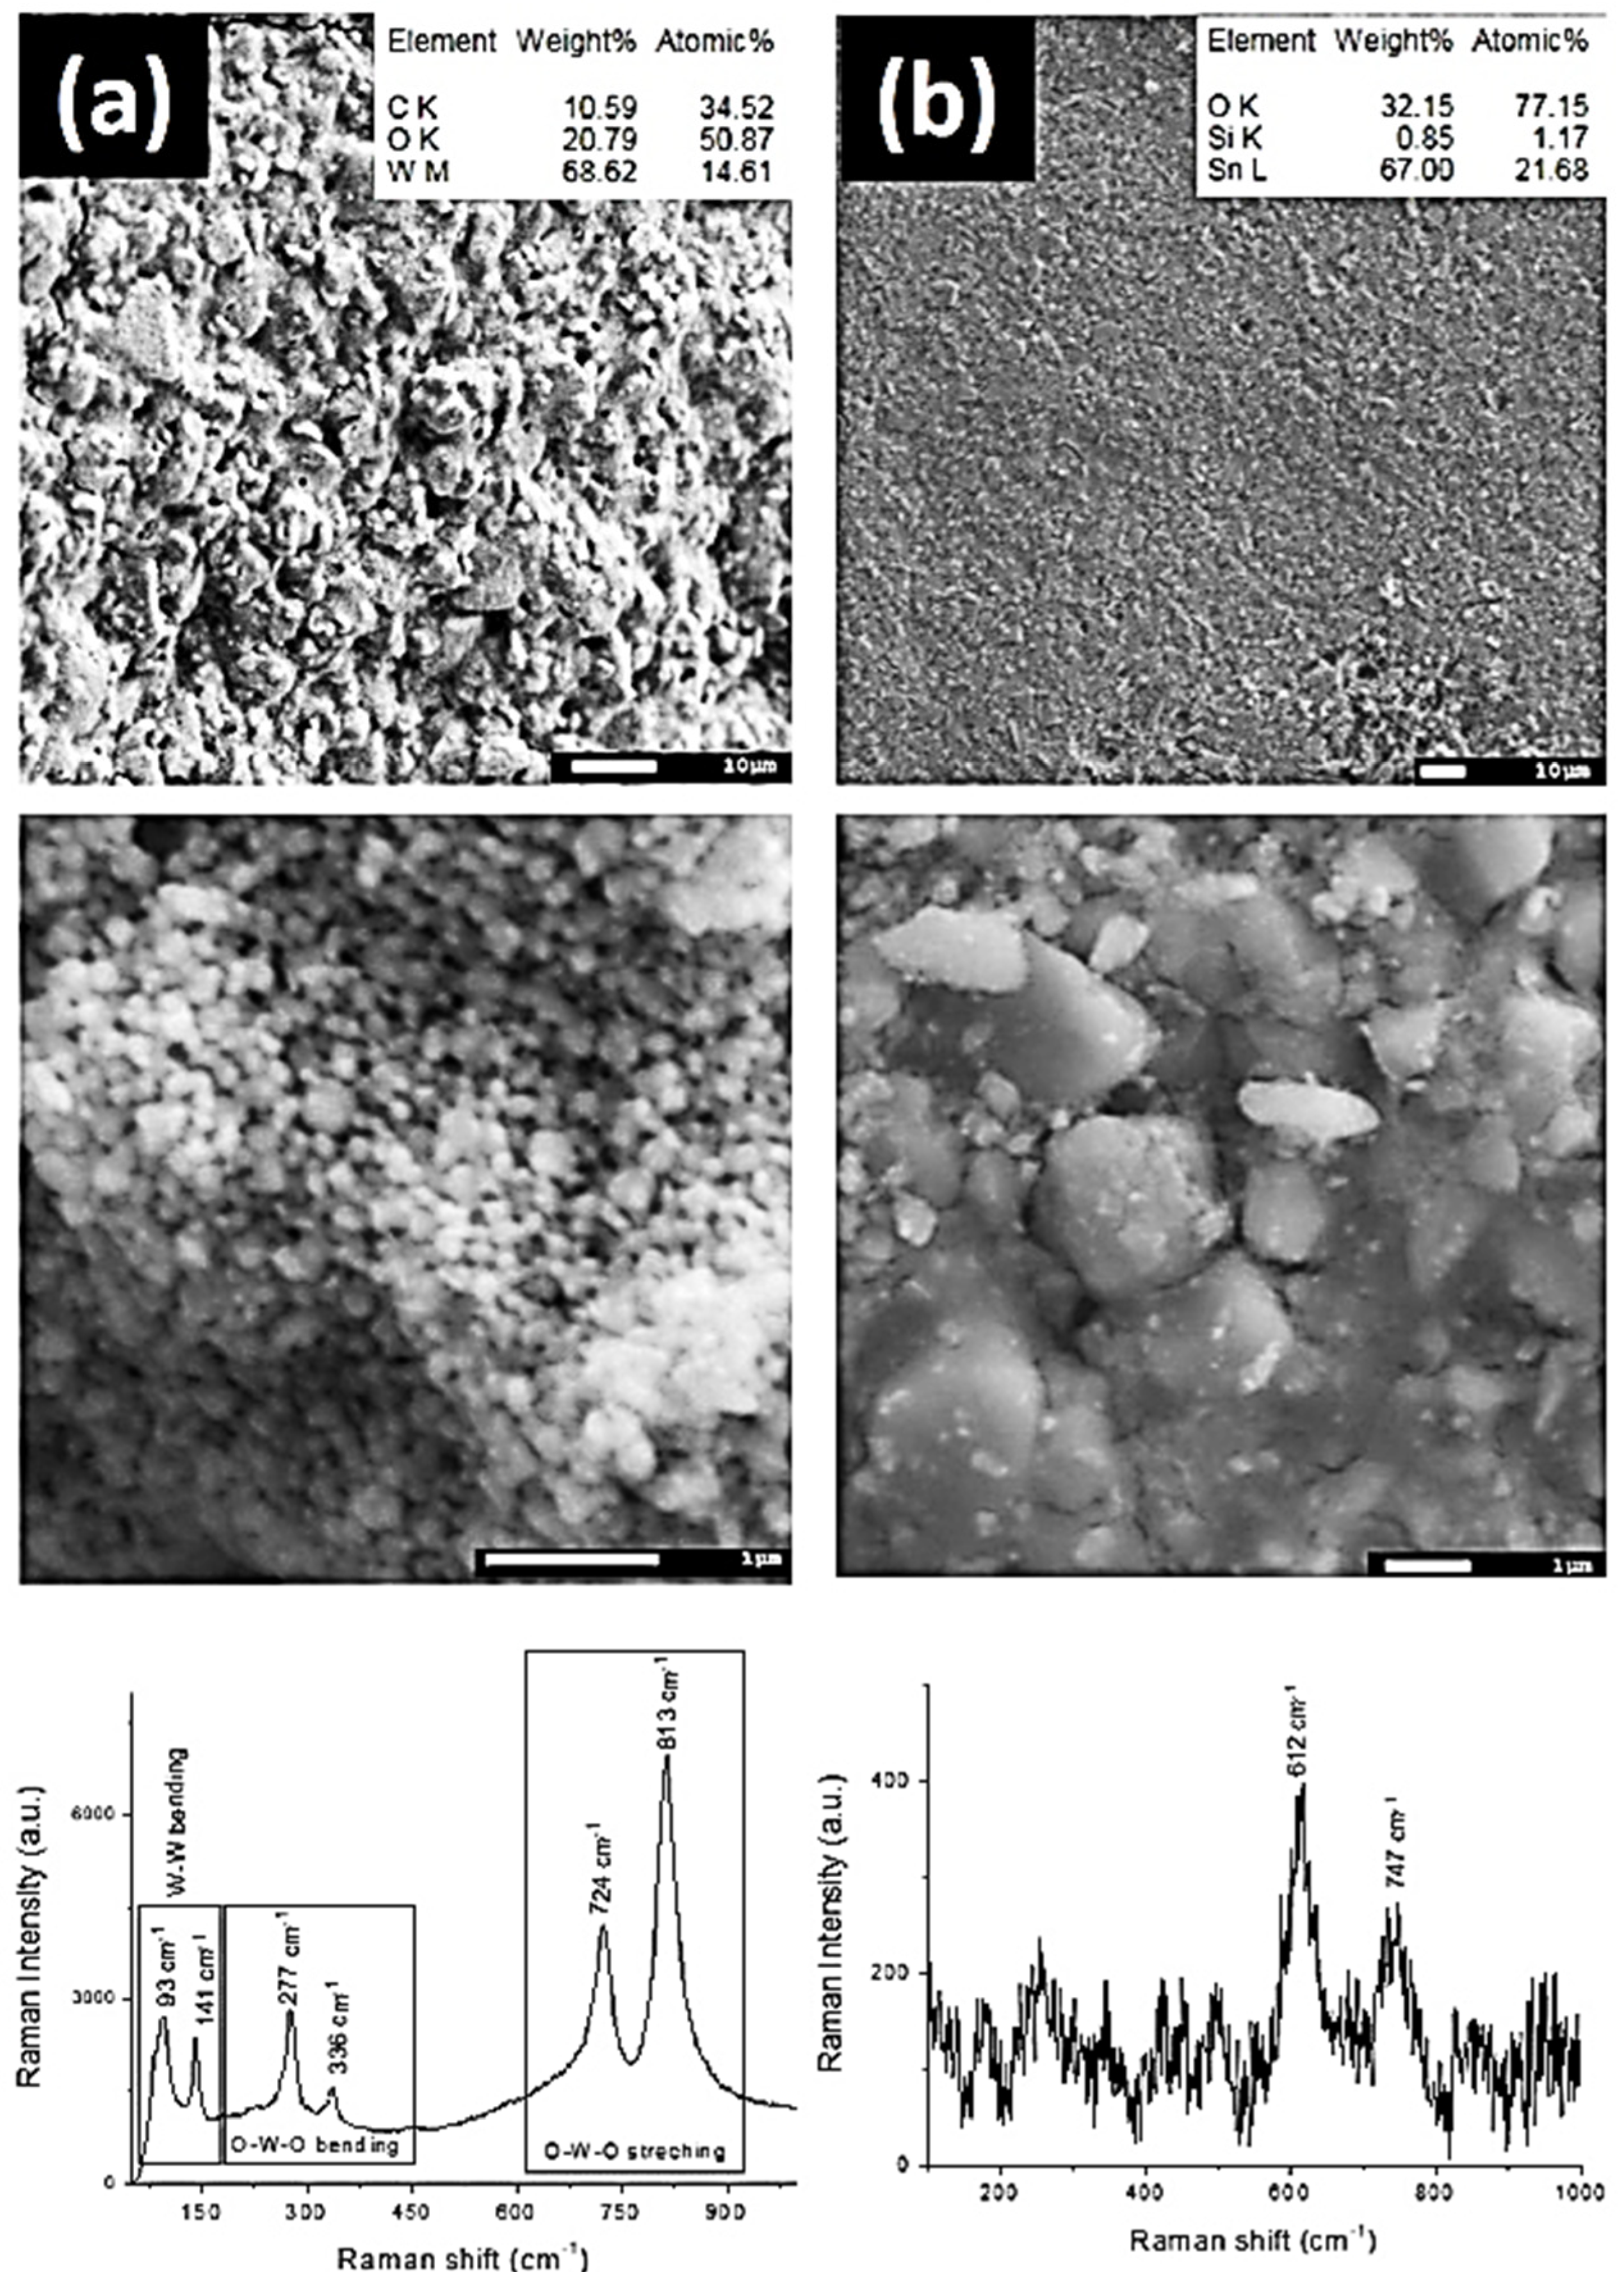
Figure 3 demonstrates the SEM/EDX analysis and Raman spectroscopy of produced sensors. It is clearly seen that the surface of sample (a) has a very rough surface. EDX analysis shows the presence of W, O and C in the film. The layer of WO
3 consist of spherical nanoparticles with an average diameter about 100–150 nm. In order to study the phase composition of the produced sensors we used Raman spectroscopy. The Raman spectrum of the sample (a) indicates at least six modes at 93, 141, 277, 336, 724, 813 cm
−1 which correspond to W-W bending, O-W-O bending and O-W-O stretching of monoclinic crystalline WO
3 phases, respectively [
30,
31].
The sample (b) is presented in the
Figure 3b. It can be seen that the surface of the produced sensors is composed mostly of Sn and O. The surface is quite smooth; however, the highly magnified SEM images demonstrate that it consisted of micrometer crystalline blocks, which may be associated with a polycrystalline structure of the film. Raman spectroscopy confirmed this assumption. One may observe at least two weak peaks at 612 and 747 cm
−1 corresponding to TO and LO Eu modes of SnO
2, respectively [
32,
33].
3.3. Sensors Response toward Target Gases
As reported in
Section 3.1, the MOS sensors BIOS1 and BIOS2 were chosen since the first had a more generic response, while the latter showed higher responses when exposed to short chain alcohols. These findings were further justified by the different composition and surface structure of the respective MOS layers, as seen in
Section 3.2.
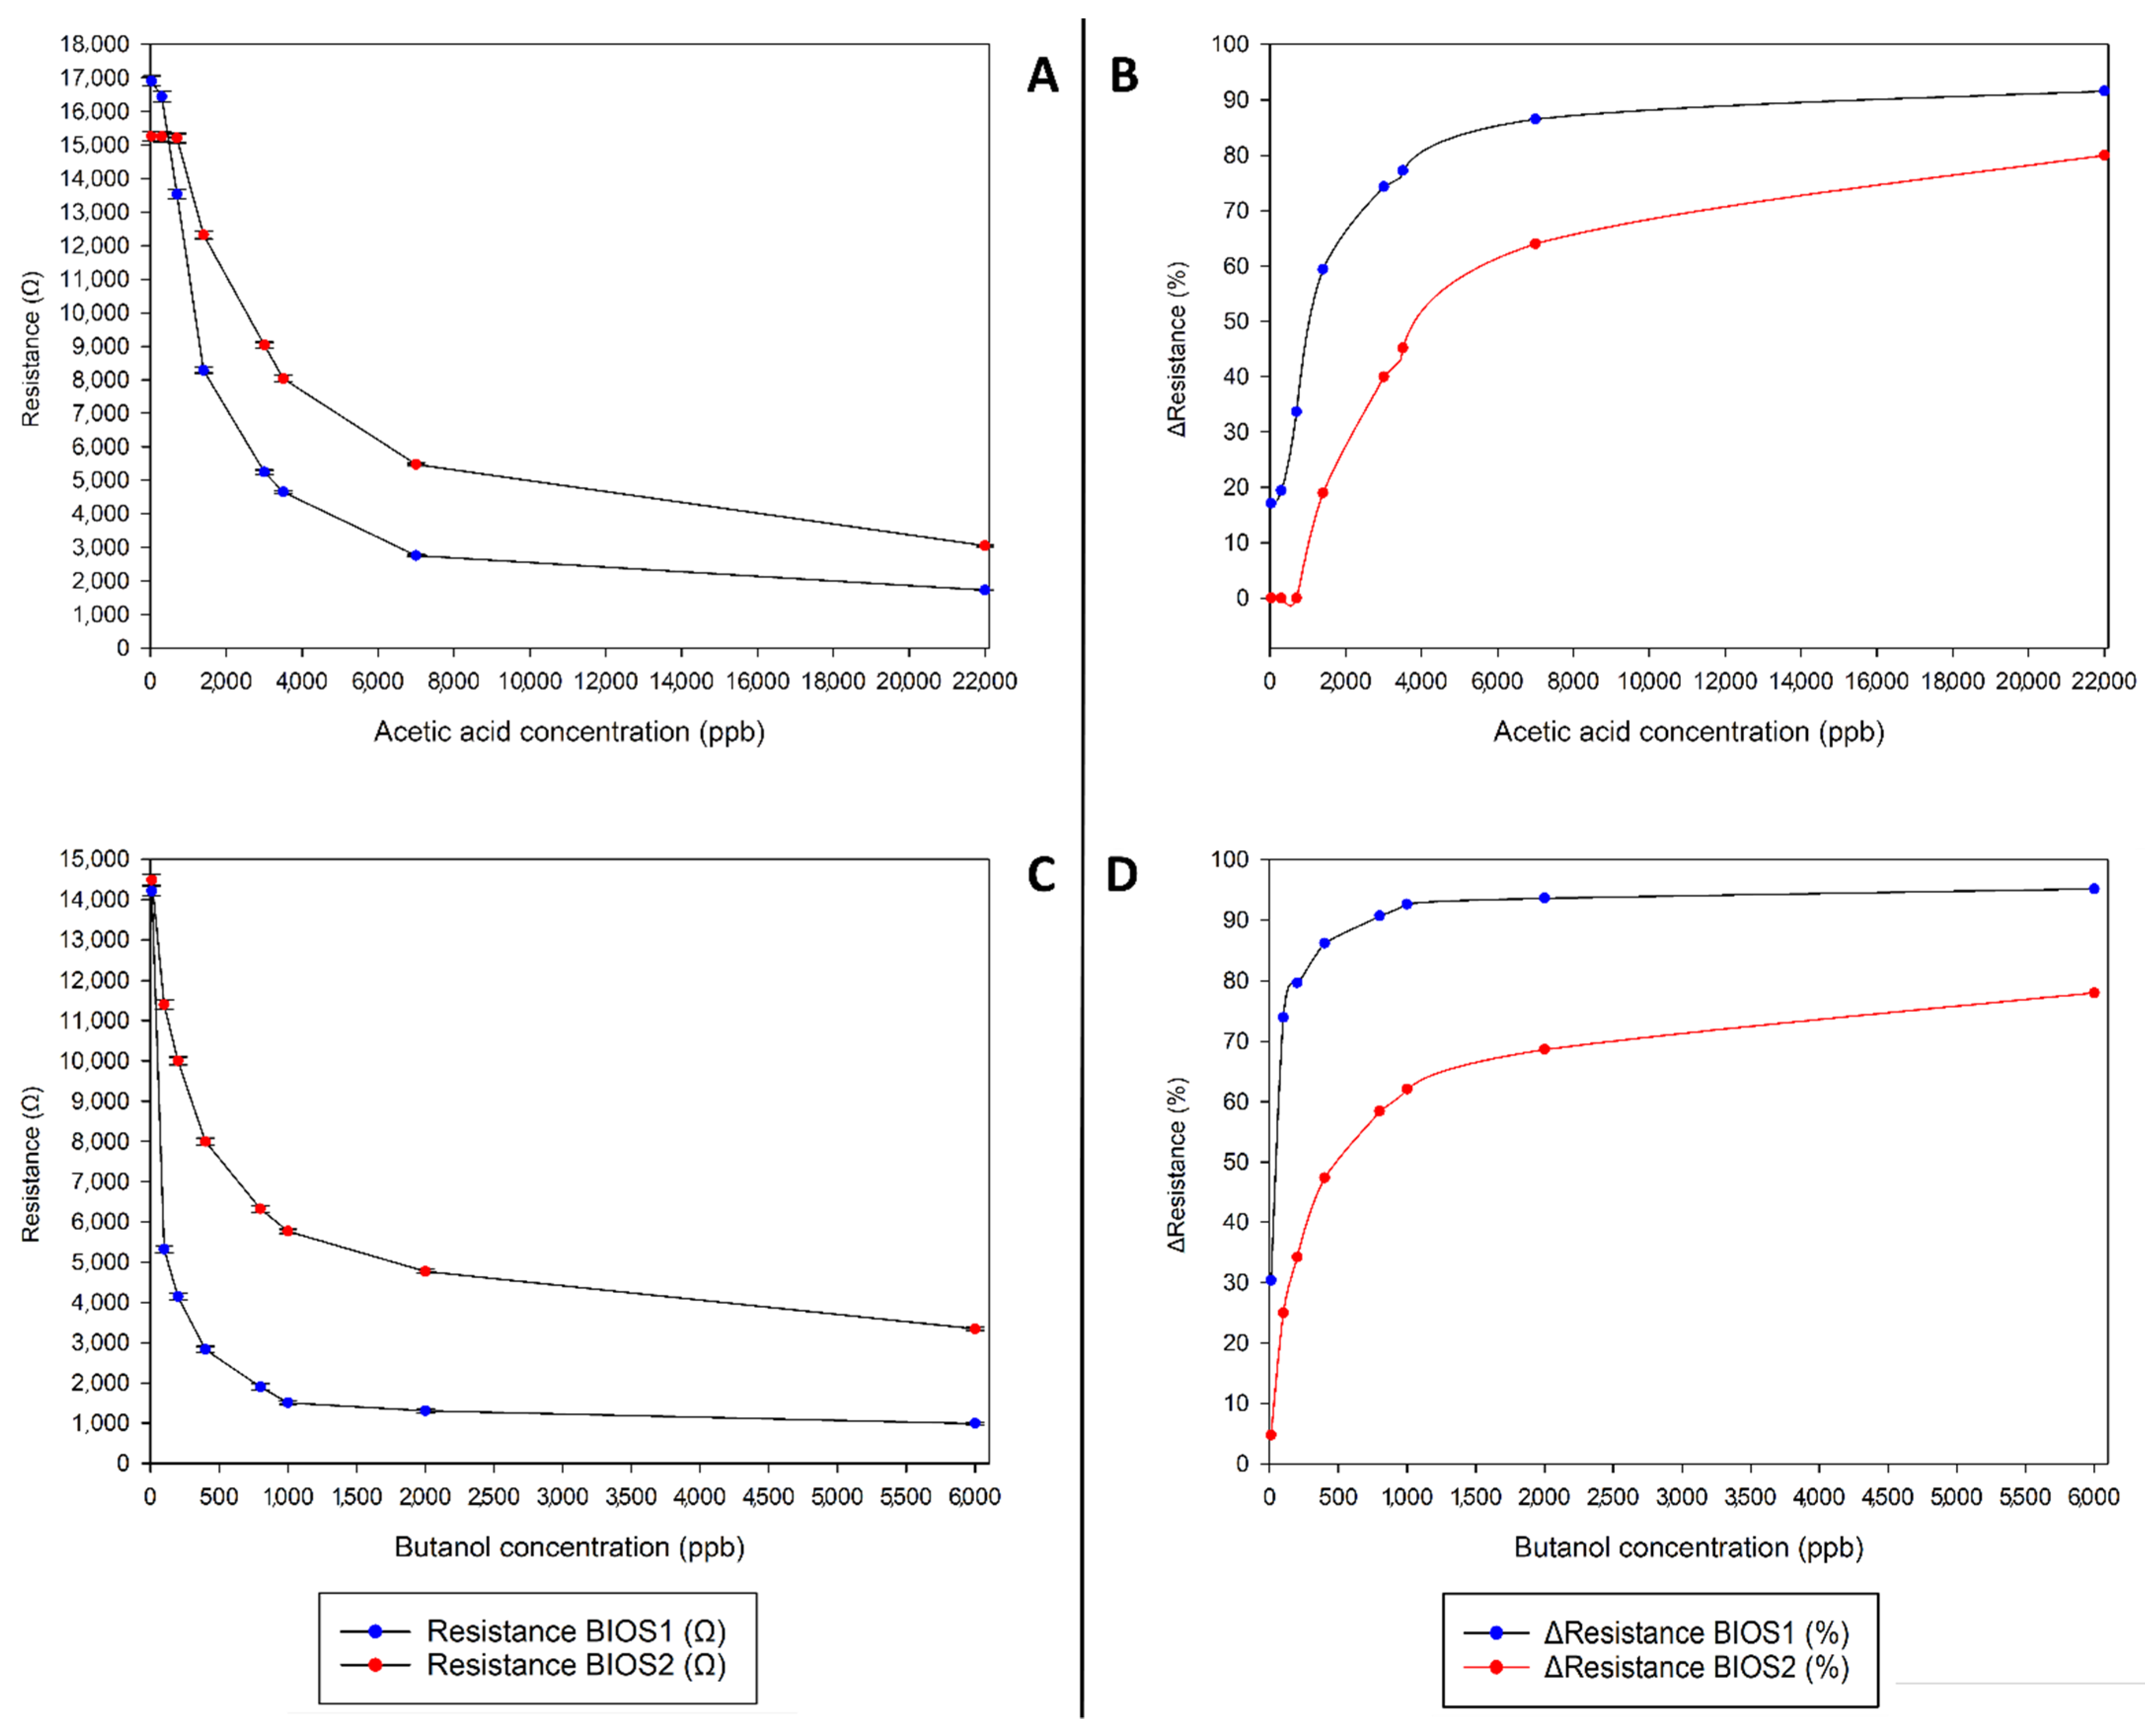
Since from SPME-GC/MS, it emerged that the most common vapor released by films, other than acetic acid, is butanol (data not shown) the sensor duplex responses towards acetic acid and butanol were investigated and are reported in
Figure 4.
As can be seen, the two sensors show different response trends when exposed to the two target volatiles. BIOS1 seems to detect lower concentrations of acetic acid compared to BIOS2 and reaches saturation faster, while both sensors seem to be quite responsive to low concentrations of butanol.
It should be noted that neither of the two sensors show a linear range of response, having instead a response type more like negative exponential (or quasi-logarithmic for the curves reporting percentage reduction compared to baseline), which is common for resistive sensors like the ones employed in this work.
3.4. Mathematical Data Processing and Acetic Acid Concentration Determination
As reported in
Section 3.3, sensors BIOS1 and BIOS2 respond both to acetic acid and butanol. It can be supposed that the resistance measured for each sensor, when they are exposed to an atmosphere containing both volatiles, will be a linear combination of the resistance variation for each gas. Thus, from a mathematical standpoint this can be expressed as:
where
, and
are the resistance values detected by the two sensors,
is the volume fraction of the acetic acid.
are the calibration curves of BIOS1 and BIOS2, respectively, when exposed to Acetic acid (AC) or butanol (but). The calibrations curves obtained in
Section 3.3 are approximated well by:
where
and
are the concentration of each volatile species. Due to the complexity and non-linearity of the system obtained, machine-assisted numeric resolution is needed to solve it and accurately calculate the acetic acid concentration in a multiple volatiles mixture.
To solve this system, a software algorithm has been developed using an open-source mathematics-oriented syntax software called GNU Octave. The developed software takes as inputs the resistance values provided by the sensors and returns the total concentration of gases and the molar fraction of acetic acid, from which the acetic acid concentration can be calculated. To solve the system illustrated above, the developed algorithm uses the GNU Octave function
vpasolve, which allows the resolution of the non-linear equation using a Newton-type algorithm. By rearranging the system as shown below in Equation (3):
Substituting the calibration curves obtained, shown in Equation (2), for the two sensors against each target volatile, we can write Equation (4):
The numerical solution of Equation (4) gives as output the total concentration of released volatiles and the volume fraction of acetic acid
. It was previously seen that the two sensors only respond to acetic acid and butanol, and the two values
and
can be put in a mathematical relationship, as shown in Equation (5):
The algorithm can thus, using Equations (4) and (5), calculate the concentration of acetic acid () and butanol ).
To solve a system and provide the acetic acid concentration, the algorithm needs about 5 s (depending on the hardware specifics of the machine on which it is operated and the complexity of the resulting system). The algorithm was tested on the raw data coming from mixtures of butanol and acetic acid at different concentrations, and it was found that the system has a limit of detection (LOD) for acetic acid of 30 ppb and provided accurate responses for acetic acid concentrations up to 30 ppm.
To prove the initial supposition that resistance measured for each sensor, when they are exposed to an atmosphere containing both volatiles, will be a linear combination of the resistance variation for each gas, a test was conducted by exposing the two sensors different mixtures of acetic acid and butanol in a closed container. Tested mixtures and the results obtained are reported in
Table 2.
From the data obtained it can be assumed that, even if BIOS1 and BIOS2 sensors’ response to air containing both target analyte and interferent is not a perfect linear combination of the responses of each sensor towards each gas, it can be safely approximated using the linear model with minimal deviation between experimental and calculated acetic acid concentration values.
The algorithm has been integrated in the user interface software, called a BIOSENSOR Monitor. The BIOSENSOR Monitor recognizes the connection of the sensing array to the PC, identify which sensors are connected and in which slot and provides users with the data from each sensor both in numerical and graphical forms. If the sensors BIOS1 and BIOS2 are plugged in the board, the BIOSENSOR Monitor allows the user to read the raw resistance value provided by the sensors or, by pressing a button on its simple interface, to start the integrated algorithm, calculating and displaying the acetic acid concentration detected by the sensors.
3.5. Test of Developed BIOS1 + BIOS2 Sensor Duplex on Real Samples and Validation with A-D Strips
To demonstrate that the developed BIOS1 + BIOS2 sensor duplex can be successfully applied for automated real-time determination of acetic acid concentrations in film boxes, it was used to quantify the acetic acid vapor released by the film samples described in
Section 2.5. For each measurement, the following protocol was employed:
The BIOS1 + BIOS2 sensor duplex was placed on the top cover of a circular film box of fixed diameter, with the sensor reaching inside the container (see
Section 2.8 Sensors positioning in film boxes) the material of which simulates those used in real storage conditions. The box was put in a refrigerator at 4 °C, with controlled relative humidity at 50%, to simulate the conditions used in conservation institutes for cinematographic films to simulate storage conditions used in conservation institutes
The film to analyze was placed in the box, having care to not touch the sensors surfaces.
The box was closed, and the data acquisition was started along with the data processing software.
After 10 min (time required empirically determined as required for homogeneous diffusion of volatiles in the box and thus obtain stable values from the BIOS1 + BIOS2 duplex) acetic acid concentration was calculated from the acquired data.
The data obtained for each film, and the comparison with the acetic acid concentrations determined employing the official methodology (A-D strip placed in box with film for 24 h) are reported in
Table 3.
After each measurement, the sensor was exposed to clean fresh air (no forced ventilation required) and the signal from both BIOS1 and BIOS2 sensors went back to baseline levels in less than 5 min.
The good agreement obtained between data from A-D strips and acetic acid concentration calculated with the developed algorithm confirms that butanol is the only interfering vapor among those released by degrading cellulose acetate cinematographic films.
As can be seen from
Table 3, the results obtained with the developed array fit very well with those obtained employing the official method.
3.6. BIOS1 + BIOS2 Sensor Duplex Long-Term Stability under Continuous Exposure to Cinematographic Films Vapors
To evaluate the stability of the selected sensors when continuously exposed to the vapors released by the cinematographic films, a test was conducted by leaving six films in six different boxes, each with its own BIOS1 + BIOS2 sensor duplex installed. Acetic acid concentrations were measured at the start of the test, after 15 days and after 30 days. The results obtained are reported in
Table 4.
From the data reported, no significant variations are detected in the acetic acid concentrations calculated in the examined period.
4. Discussion
The sensor duplex has been developed to provide a competitive system for the early detection of the acetic acid released during the degradation of cinematographic films produced using cellulose acetate. As mentioned in the introduction, this material’s degradation process consists of two phases: an initial one, which is water-dependent, the kinetic of which is quite slow. Once the concentration of acetic acid reaches a certain concentration in air, an autocatalytic process triggers, which quickly leads to irreversible damage to the film. It is thus fundamental to detect the release of acetic acid from the cinematographic films as soon as possible in order to apply safekeeping techniques.
The developed sensor duplex proved reliable for the accurate quantification of acetic acid among all the volatiles released during cinematographic films degradation. This was possible thanks to the selection of the two MOS sensors, one based on tungsten oxide, the other based on tin oxide. It is known from literature [
34] that MOS sensors employing SnO
2 as thin layer are responsive towards oxidable vapors, particularly alcohols. This is due to the formation of an oxygen layer in proximity with the SnO
2 particles. This interaction causes a shift in the electron distribution in the SnO
2 particles, with consequent variation of the conductivity of the thin layer. When an oxidable gas is introduced in the system, oxygen leaves the proximity of the tin oxide particles to oxidize the gas, causing a reorganization of the electrons in the tin oxide particles, with consequent resistance variation. On the other hand, tungsten oxide thin films do not show these phenomena [
35], proving responsive to both oxidizing and reducing gasses.
In the examined case, the two compounds that influenced the response of the employed sensors were 1-butanol (an oxidable vapor) and acetic acid (a vapor without marked oxidizing or reducing properties). The chosen sensors responded to both gases but with markedly different profiles. When exposed to butanol, the tin oxide sensor recorded a reduction of 90% of resistance when exposed to 1 ppm, while when exposed to acetic acid it showed a similar reduction only when exposed to concentrations exceeding 20 ppm. On the other hand, the tungsten oxide sensor shows an overall lower decrease of resistance, reaching a 60% decrease when exposed to 1 ppm of butanol or when exposed to 6 ppm of acetic acid.
The developed mathematical system leverages these different resistance reduction profiles in order to accurately calculate the acetic acid concentration in a mixed gas system employing the resistance values provided by the two sensors. In this way, it was possible to achieve a LOD for acetic acid of 30 ppb, after an exposition time of the sensors to the vapor mixture of only 10 min. The system proved to be stable even under constant exposition to the released gases: after 1 month of exposition, the results remained constant with less than 3% overall variation.
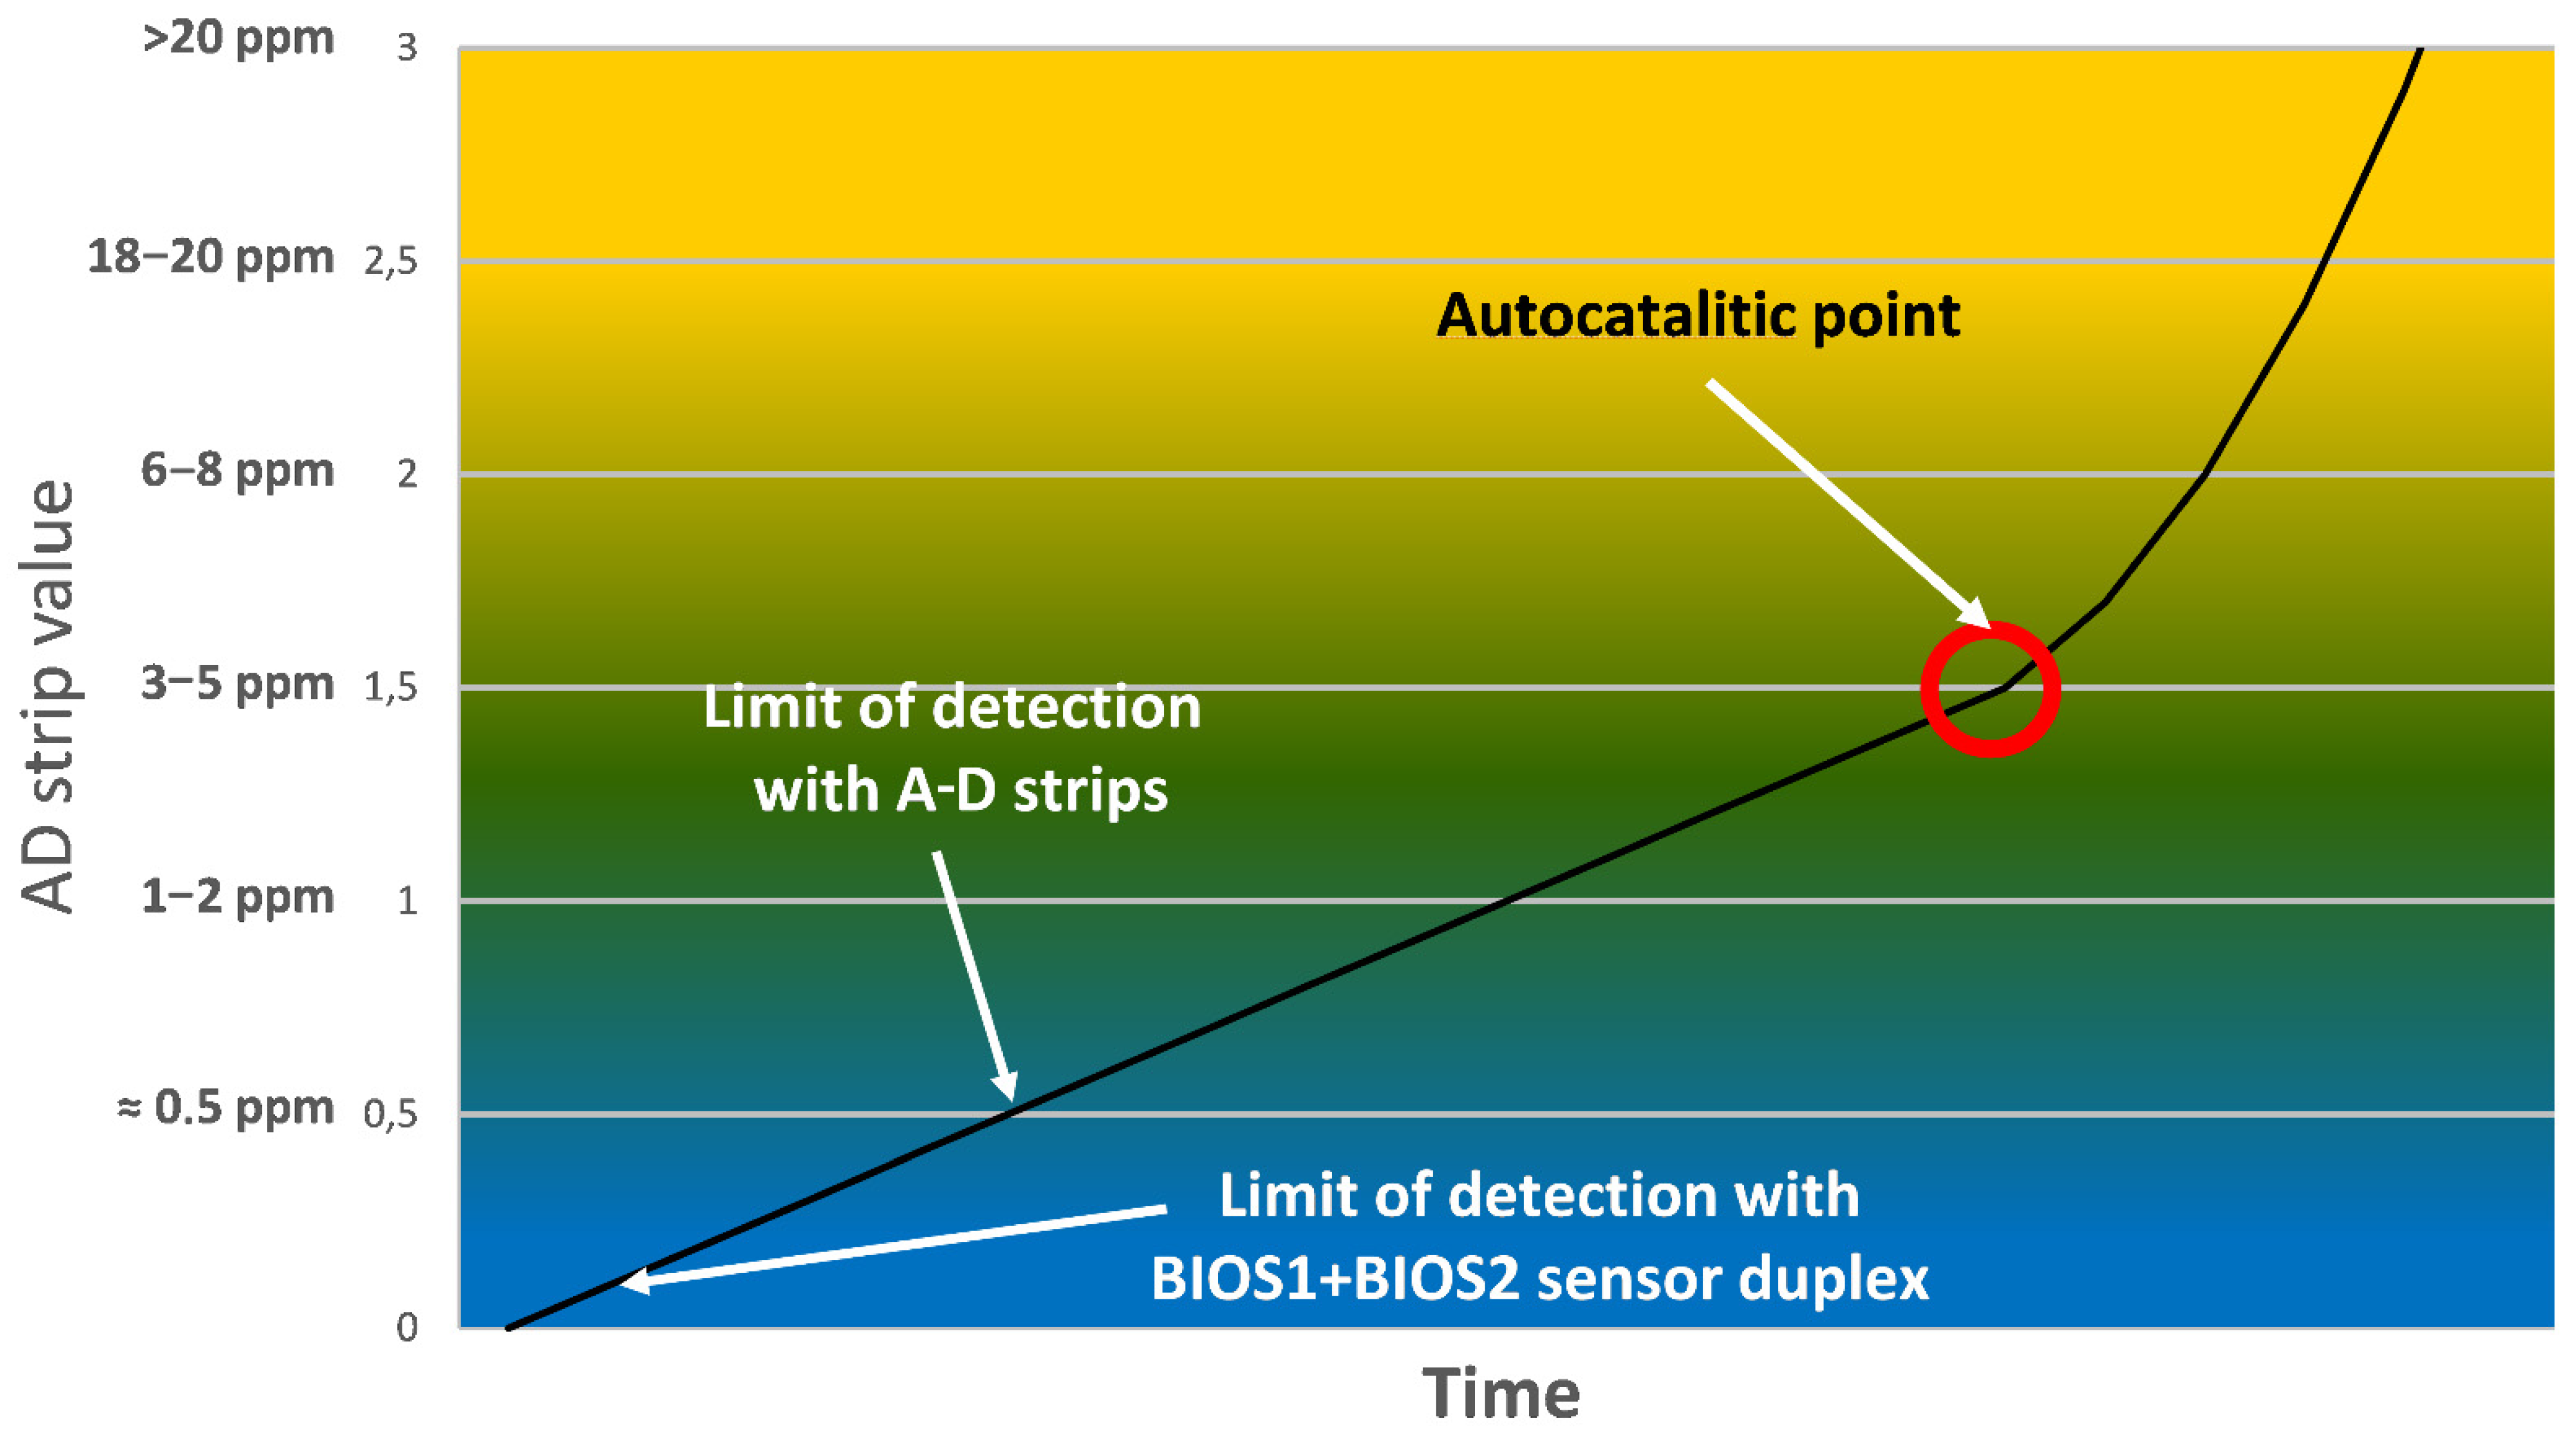
The currently used method to evaluate the acetic acid released by films in conservation institutes are A-D strips. These are small paper strips, imbibed with a pH-sensitive dye which initially is blue and progressively turns first green, then orange-yellow when exposed to increasing concentrations of acetic acid. In order to provide an accurate measurement, A-D strips need to be put in intimate contact with the film for a period of time depending on the storage temperature (at least 24 h at room temperature, 3 weeks or more if stored in a refrigerated room at 4 °C). For historical archives, where there is a need to monitor thousands to hundreds of thousands of independently stored film rolls, this means having a large staff dedicated solely to periodically checking and changing the strips. Furthermore, being a colorimetric method based on naked eye comparison with a provided reference, it may be affected by subjective interpretation and/or recognition of the color change, which may lead to false alarms or tardy action. A well-trained staff could theoretically recognize variations in the color change of A-D strips corresponding to acetic acid concentrations of 500 ppb but, usually, it is difficult to reliably detect concentrations lower than 1 ppm.
On the other hand, the developed MOS sensor duplex has a limit of detection for acetic acid of 30 ppb, which is independent of human subjectivity. Furthermore, the MOS sensor can provide an accurate evaluation of the acetic acid concentration after only 15 min since the introduction of the film in the box. Further measurements, require even shorter time (about 5 min), needed for the warm-up of the MOS sensor. Having both the sensors and the Arduino processing unit integrated in the film box allows for periodic measurements on the cinematographic film, without need for human intervention and a consequent risk of human exposure to the gases accumulating in the film box. Finally, the system can be fully automatized by connecting the Arduino boards using cables to a central unit, from which the state of all cinematographic films subjected to monitoring can be checked. In
Figure 5, a comparison of the (theoretical) LOD for A-D strips and the LOD of the developed MOS sensor duplex is illustrated.


 ,
, 


