
Self-Referenced Optical Fiber Sensor Based on LSPR Generated by Gold and Silver Nanoparticles Embedded in Layer-by-Layer Nanostructured Coatings †

 , , and
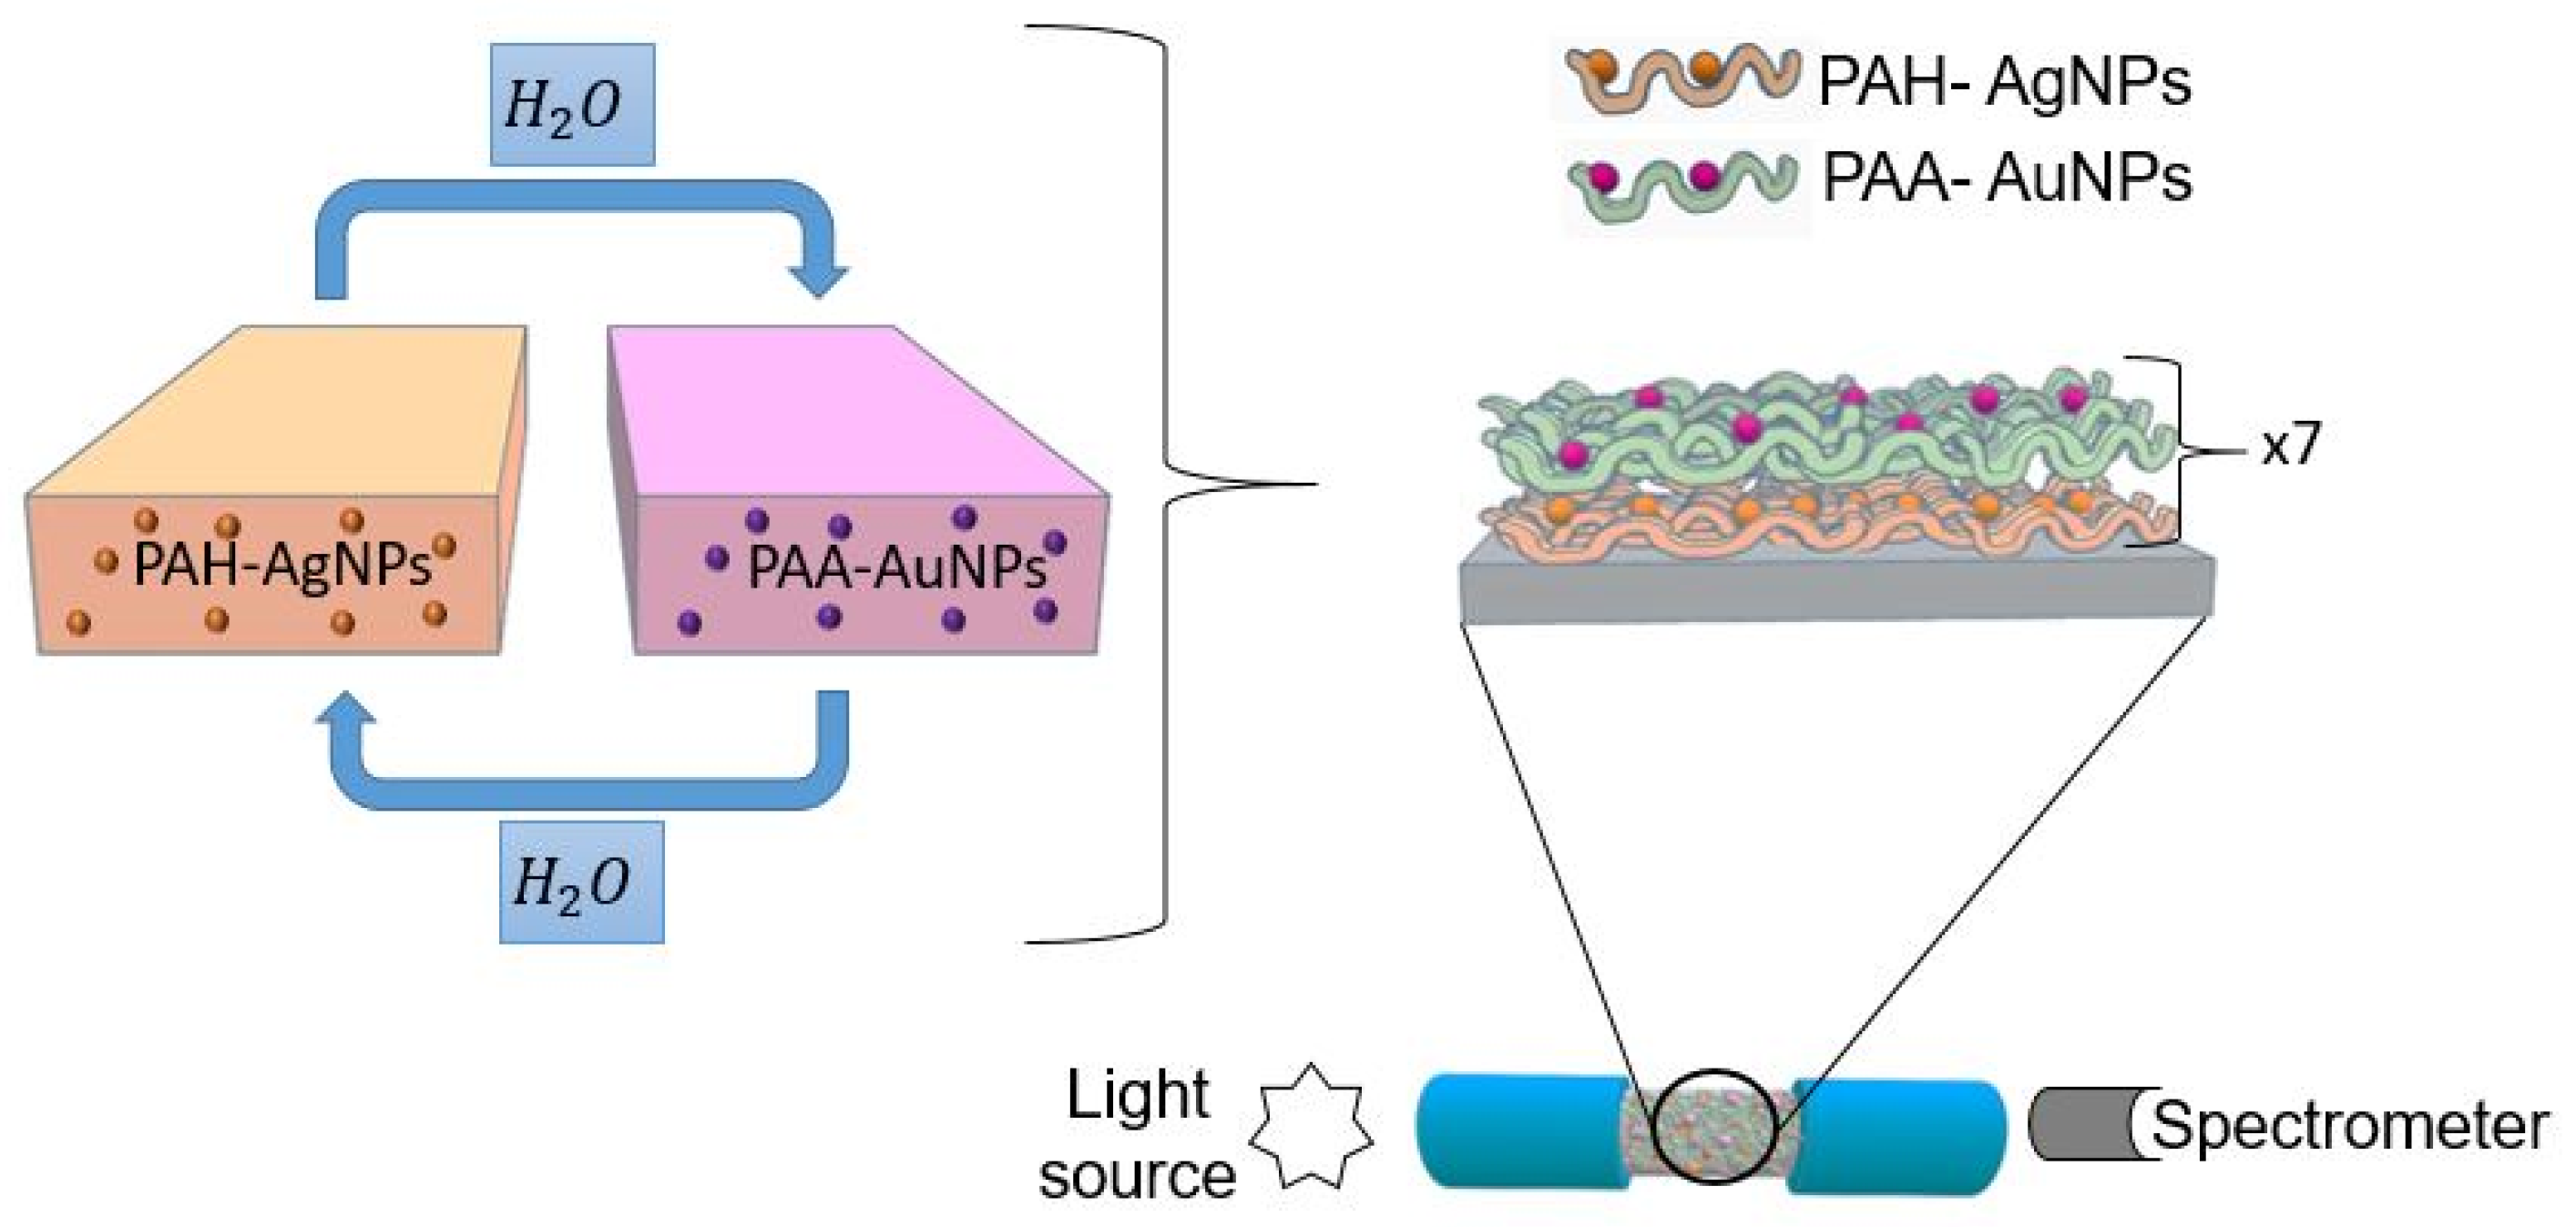
Abstract
:1. Introduction
2. Experimental Section
2.1. Materials
2.2. Synthesis of the Metallic Nanoparticles
2.3. Fabrication of the Layer-by-Layer Films
2.4. Characterization Techniques
2.5. Optical Fiber Detection Setup
2.6. Analyte Samples Preparation
3. Results and Discussion
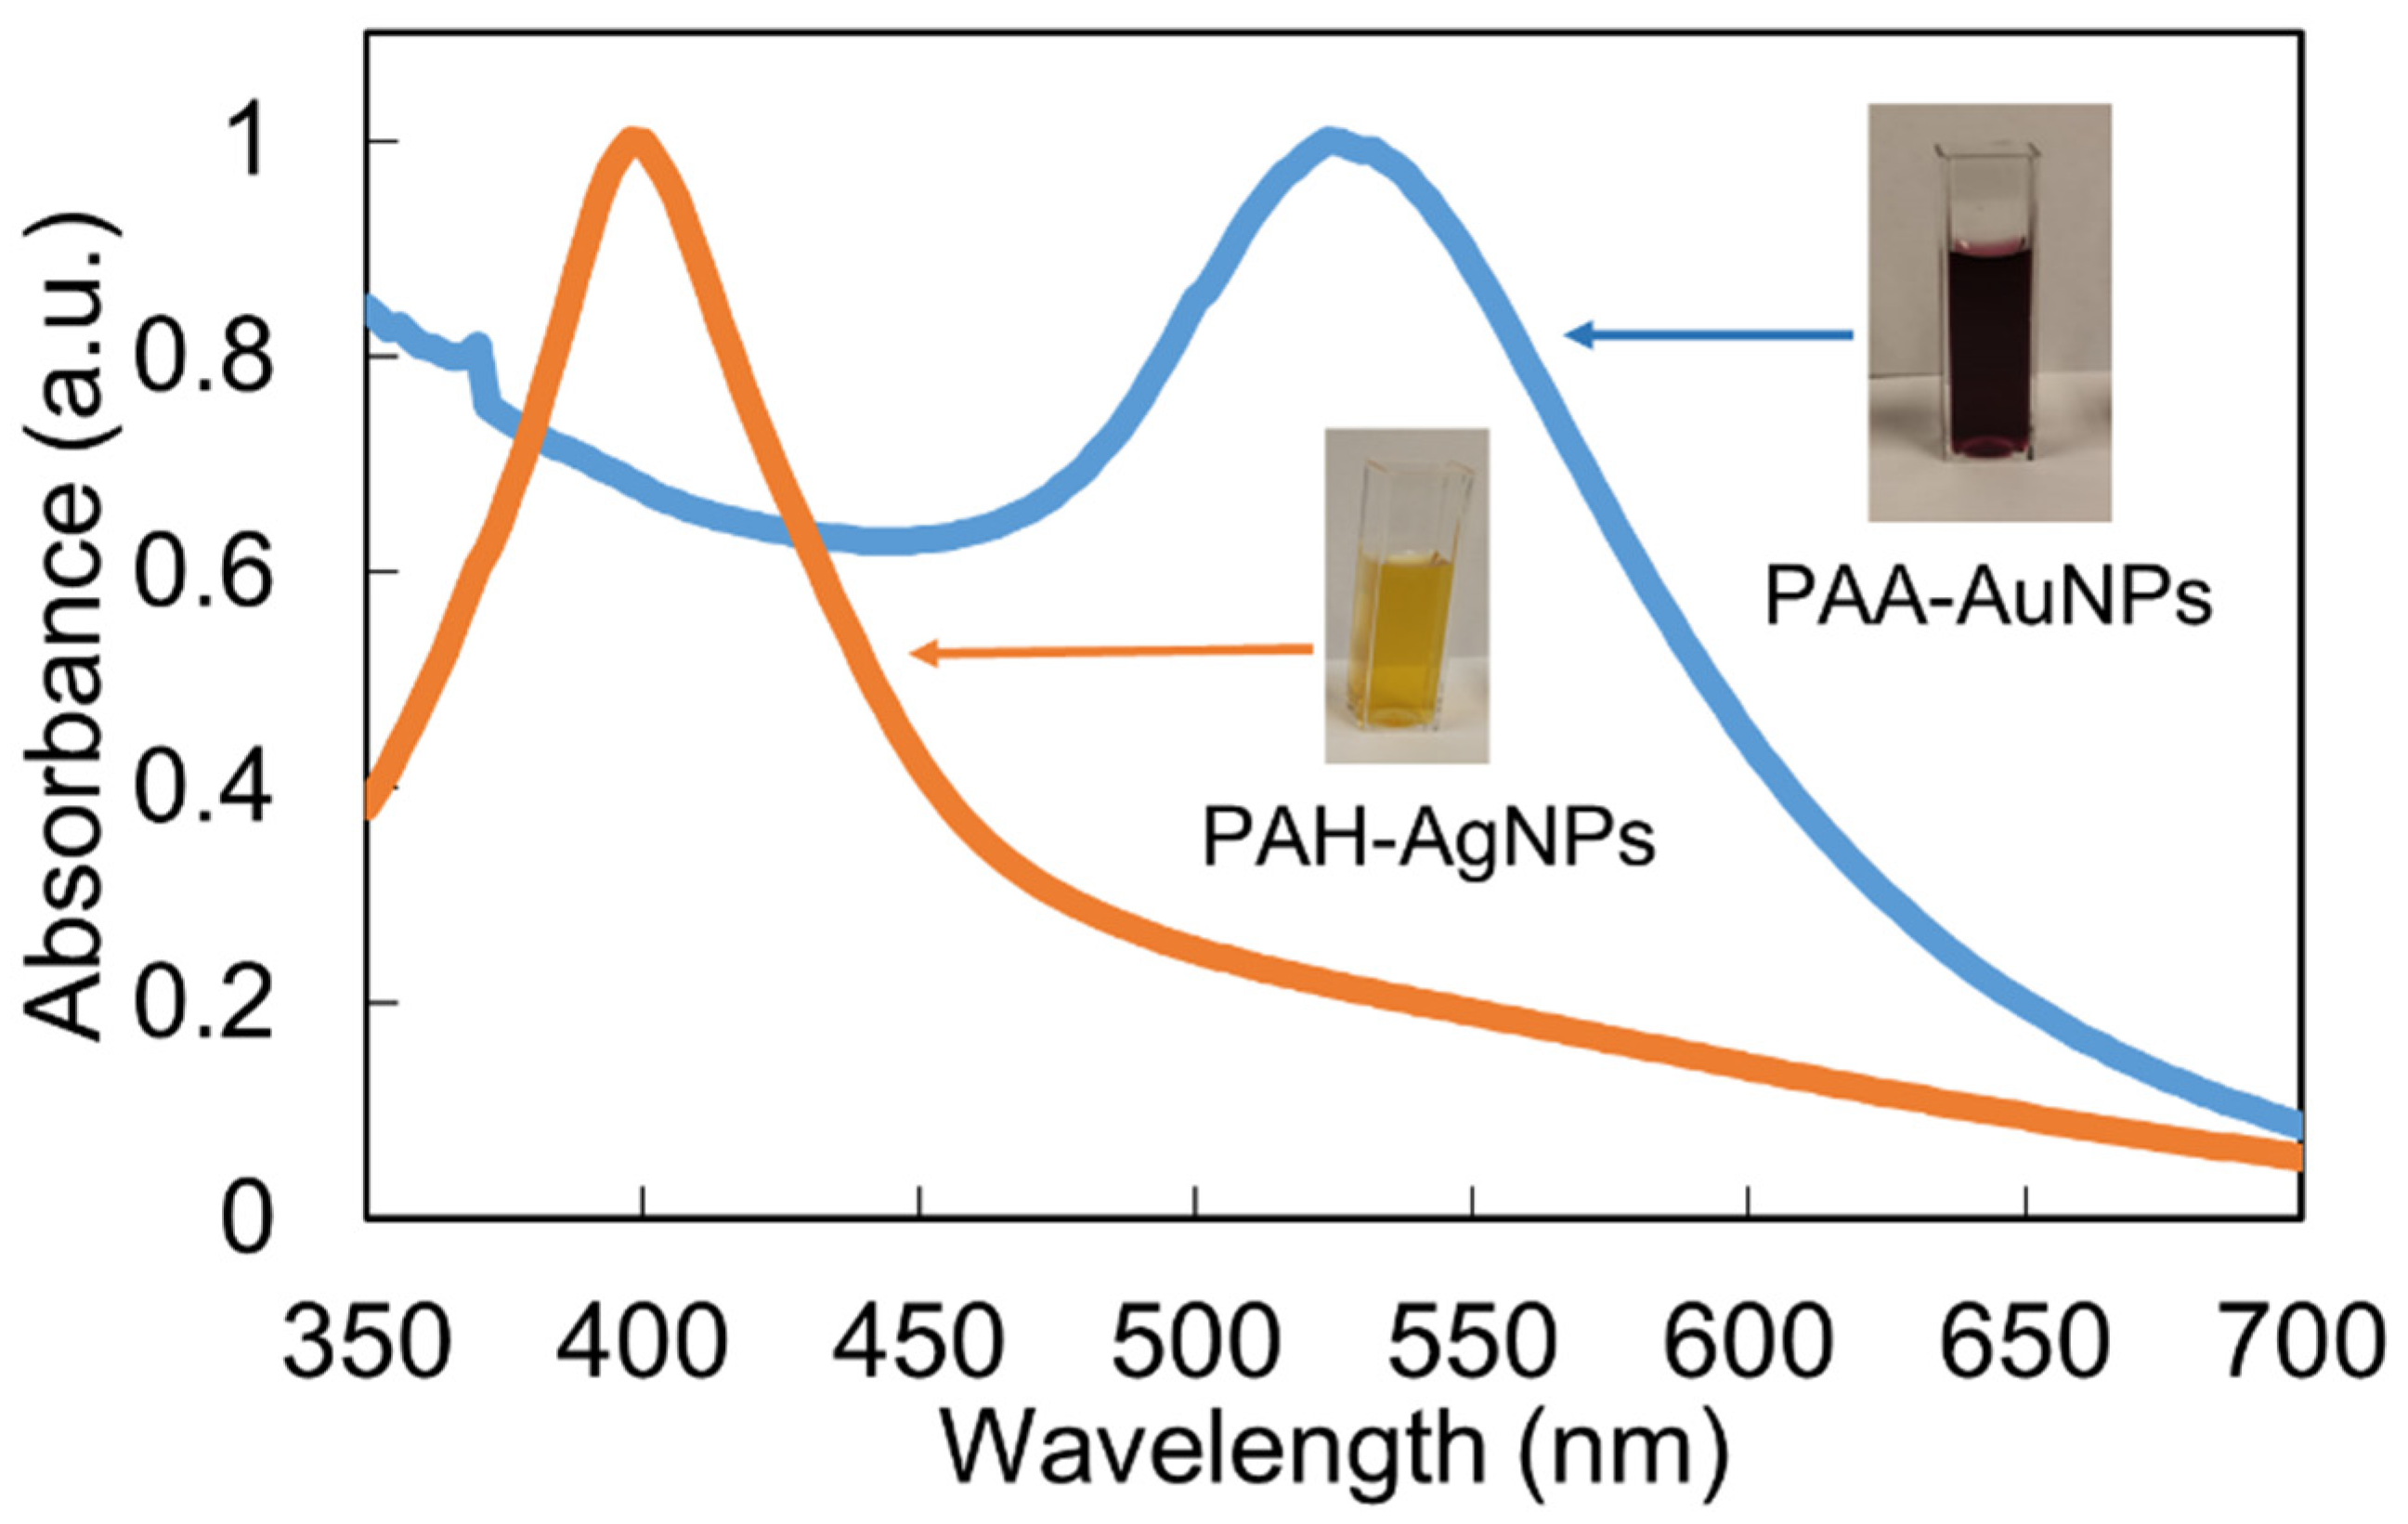
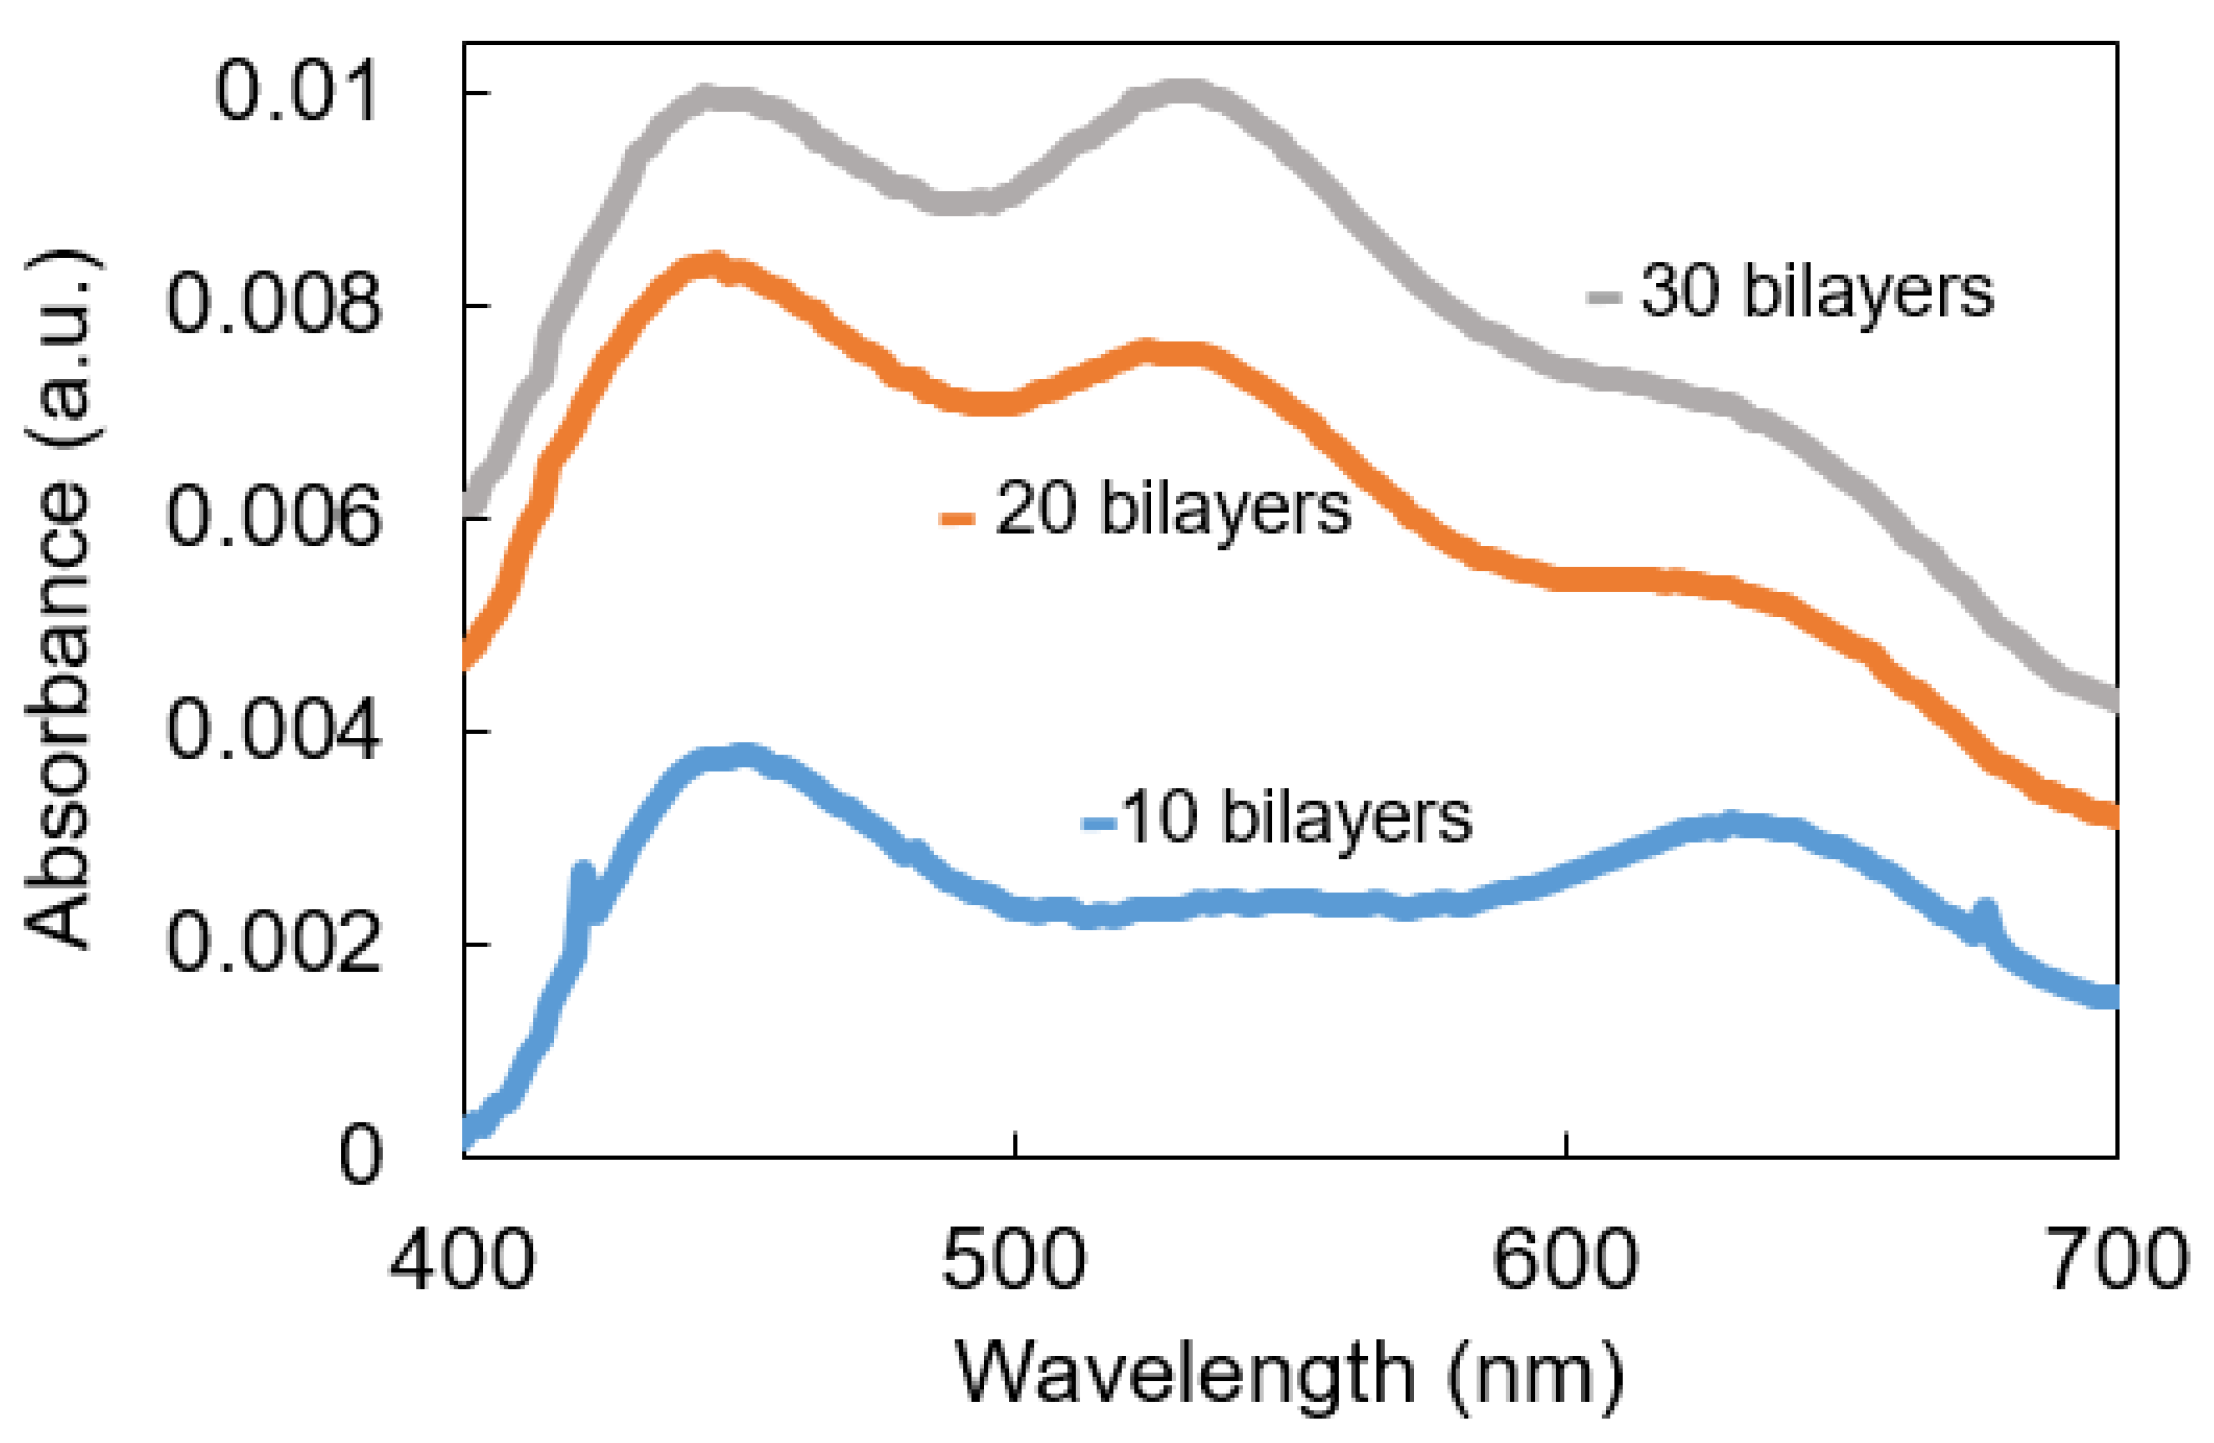
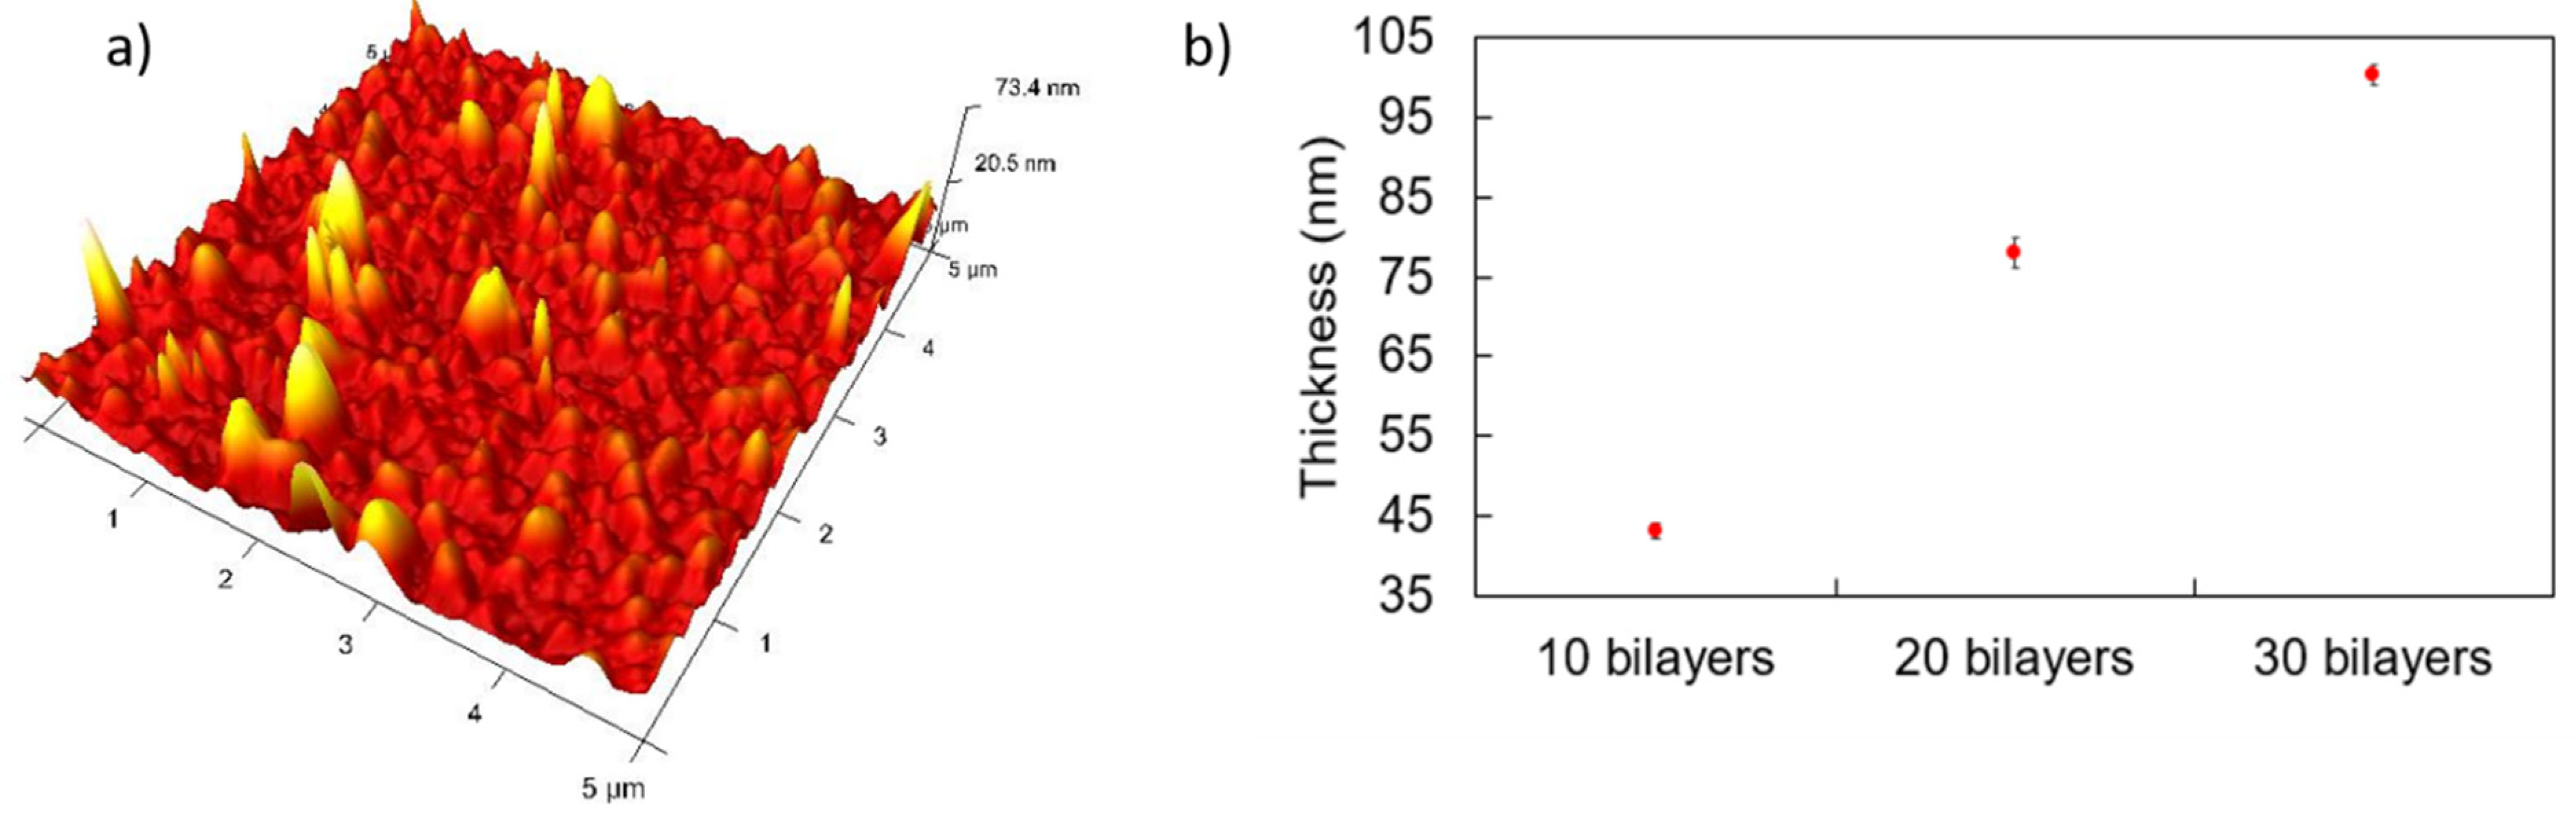
3.1. Synthesis of the Metallic Nanoparticles and Their Incorporation into LbL Films
3.2. Optical Fiber Setup Fabrication
3.3. Mercury Ions Detection
3.4. H2O2 Detection
4. Conclusions
Author Contributions
Funding
Institutional Review Board Statement
Informed Consent Statement
Data Availability Statement
Conflicts of Interest
References
- Järup, L. Hazards of Heavy Metal Contamination. Br. Med. Bull. 2003, 68, 167–182. [Google Scholar] [CrossRef] [Green Version]
- Jia, S.; Bian, C.; Sun, J.; Tong, J.; Xia, S. A Wavelength-Modulated Localized Surface Plasmon Resonance (LSPR) Optical Fiber Sensor for Sensitive Detection of Mercury(II) Ion by Gold Nanoparticles-DNA Conjugates. Biosens. Bioelectron. 2018, 114, 15–21. [Google Scholar] [CrossRef]
- Abu-Ali, H.; Nabok, A.; Smith, T.J. Development of Novel and Highly Specific SsDNA-Aptamer-Based Electrochemical Biosensor for Rapid Detection of Mercury (II) and Lead (II) Ions in Water. Chemosensors 2019, 7, 27. [Google Scholar] [CrossRef] [Green Version]
- Bansod, B.K.; Kumar, T.; Thakur, R.; Rana, S.; Singh, I. A Review on Various Electrochemical Techniques for Heavy Metal Ions Detection with Different Sensing Platforms. Biosens. Bioelectron. 2017, 94, 443–455. [Google Scholar] [CrossRef]
- Deshmukh, M.A.; Celiesiute, R.; Ramanaviciene, A.; Shirsat, M.D.; Ramanavicius, A. EDTA_PANI/SWCNTs Nanocomposite Modified Electrode for Electrochemical Determination of Copper (II), Lead (II) and Mercury (II) Ions. Electrochim. Acta 2018, 259, 930–938. [Google Scholar] [CrossRef]
- Zhang, X.; Liu, W.; Li, X.; Zhang, Z.; Shan, D.; Xia, H.; Zhang, S.; Lu, X. Ultrahigh Selective Colorimetric Quantification of Chromium(VI) Ions Based on Gold Amalgam Catalyst Oxidoreductase-like Activity in Water. Anal. Chem. 2018, 90, 14309–14315. [Google Scholar] [CrossRef]
- Chen, Z.; Zhang, C.; Gao, Q.; Wang, G.; Tan, L.; Liao, Q. Colorimetric Signal Amplification Assay for Mercury Ions Based on the Catalysis of Gold Amalgam. Anal. Chem. 2015, 87, 10963–10968. [Google Scholar] [CrossRef]
- Priyadarshini, E.; Pradhan, N. Gold Nanoparticles as Efficient Sensors in Colorimetric Detection of Toxic Metal Ions: A Review. Sens. Actuators B Chem. 2017, 238, 888–902. [Google Scholar] [CrossRef]
- Martínez-Hernández, M.E.; Goicoechea, J.; Arregui, F.J. Hg2+ Optical Fiber Sensor Based on LSPR Generated by Gold Nanoparticles Embedded in LBL Nano-Assembled Coatings. Sensors 2019, 19, 4906. [Google Scholar] [CrossRef] [Green Version]
- Cao, J.; Sun, T.; Grattan, K.T.V. Gold Nanorod-Based Localized Surface Plasmon Resonance Biosensors: A Review. Sens. Actuators B Chem. 2014, 195, 332–351. [Google Scholar] [CrossRef]
- James, J.Z.; Lucas, D.; Koshland, C.P. Gold Nanoparticle Films as Sensitive and Reusable Elemental Mercury Sensors. Environ. Sci. Technol. 2012, 46, 9557–9562. [Google Scholar] [CrossRef] [PubMed]
- Zhao, J.; Yan, Y.; Zhu, L.; Li, X.; Li, G. An Amperometric Biosensor for the Detection of Hydrogen Peroxide Released from Human Breast Cancer Cells. Biosens. Bioelectron. 2013, 41, 815–819. [Google Scholar] [CrossRef] [PubMed]
- Luo, Y.; Liu, H.; Rui, Q.; Tian, Y. Detection of Extracellular H2O2 Released from Human Liver Cancer Cells Based on TiO2 Nanoneedles with Enhanced Electron Transfer of Cytochrome C. Anal. Chem. 2009, 81, 3035–3041. [Google Scholar] [CrossRef] [PubMed]
- Magyar, M.; Rinyu, L.; Janovics, R.; Berki, P.; Hernádi, K.; Hajdu, K.; Szabó, T.; Nagy, L. Real-Time Sensing of Hydrogen Peroxide by Ito/Mwcnt/Horseradish Peroxidase Enzyme Electrode. J. Nanomater. 2016, 2016. [Google Scholar] [CrossRef] [Green Version]
- Mao, J.; Jacob, D.J.; Evans, M.J.; Olson, J.R.; Ren, X.; Brune, W.H.; St. Clair, J.M.; Crounse, J.D.; Spencer, K.M.; Beaver, M.R.; et al. Chemistry of Hydrogen Oxide Radicals (HOx) in the Arctic Troposphere in Spring. Atmos. Chem. Phys. 2010, 10, 5823–5838. [Google Scholar] [CrossRef] [Green Version]
- Martínez-Huitle, C.A.; Brillas, E. Decontamination of Wastewaters Containing Synthetic Organic Dyes by Electrochemical Methods: A General Review. Appl. Catal. B Environ. 2009, 87, 105–145. [Google Scholar] [CrossRef]
- Chen, W.; Cai, S.; Ren, Q.Q.; Wen, W.; Zhao, Y.D. Recent Advances in Electrochemical Sensing for Hydrogen Peroxide: A Review. Analyst 2012, 137, 49–58. [Google Scholar] [CrossRef]
- Hrapovic, S.; Liu, Y.; Male, K.B.; Luong, J.H.T. Platinum Nanoparticles and Carbon Nanotubes Interactions with Pt Nanoparticles to Form a Network That Connected Pt Nanoparticles to the Electrode Surface. TEM Nanoparticles on Carbon Nanotubes Whereas Cyclic Volta. Anal. Chem. 2004, 76, 1083–1088. [Google Scholar] [CrossRef]
- Erel, O. A New Automated Colorimetric Method for Measuring Total Oxidant Status. Clin. Biochem. 2005, 38, 1103–1111. [Google Scholar] [CrossRef]
- Chen, S.; Hai, X.; Chen, X.W.; Wang, J.H. In Situ Growth of Silver Nanoparticles on Graphene Quantum Dots for Ultrasensitive Colorimetric Detection of H2O2 and Glucose. Anal. Chem. 2014, 86, 6689–6694. [Google Scholar] [CrossRef]
- Chen, Y.; Zhong, Q.; Wang, Y.; Yuan, C.; Qin, X.; Xu, Y. Colorimetric Detection of Hydrogen Peroxide and Glucose by Exploiting the Peroxidase-like Activity of Papain. RSC Adv. 2019, 9, 16566–16570. [Google Scholar] [CrossRef] [Green Version]
- Tagad, C.K.; Dugasani, S.R.; Aiyer, R.; Park, S.; Kulkarni, A.; Sabharwal, S. Green Synthesis of Silver Nanoparticles and Their Application for the Development of Optical Fiber Based Hydrogen Peroxide Sensor. Sens. Actuators B Chem. 2013, 183, 144–149. [Google Scholar] [CrossRef]
- Lobnik, A.; Ajlakovi, M. Sol-Gel Based Optical Sensor for Continuous Determination of Dissolved Hydrogen Peroxide. Sens. Actuators B Chem. 2001, 74, 194–199. [Google Scholar] [CrossRef]
- Bhatia, P.; Yadav, P.; Gupta, B.D. Surface Plasmon Resonance Based Fiber Optic Hydrogen Peroxide Sensor Using Polymer Embedded Nanoparticles. Sens. Actuators B Chem. 2013, 182, 330–335. [Google Scholar] [CrossRef]
- Jorgenson, R.C.; Yee, S.S. A Fiber-Optic Chemical Sensor Based on Surface Plasmon Resonance. Sensors Actuators B. Chem. 1993, 12, 213–220. [Google Scholar] [CrossRef]
- Elosua, C.; Arregui, F.J.; Del Villar, I.; Ruiz-Zamarreño, C.; Corres, J.M.; Bariain, C.; Goicoechea, J.; Hernaez, M.; Rivero, P.J.; Socorro, A.B.; et al. Micro and Nanostructured Materials for the Development of Optical Fibre Sensors. Sensors 2017, 17, 2132. [Google Scholar] [CrossRef] [PubMed] [Green Version]
- Bao, X.; Chen, L. Recent Progress in Distributed Fiber Optic Sensors. Sensors 2012, 12, 8601–8639. [Google Scholar] [CrossRef] [Green Version]
- Sharma, S.; Kumari, R.; Varshney, S.K.; Lahiri, B. Optical Biosensing with Electromagnetic Nanostructures. Rev. Phys. 2020, 5, 100044. [Google Scholar] [CrossRef]
- Liz-marza, L.M. In V Ited Feature Article. Langmuir 2006, 22, 32–41. [Google Scholar]
- Schopf, C.; Martín, A.; Iacopino, D. Plasmonic Detection of Mercury via Amalgam Formation on Surface-Immobilized Single Au Nanorods. Sci. Technol. Adv. Mater. 2017, 18, 60–67. [Google Scholar] [CrossRef] [Green Version]
- Schopf, C.; Martín, A.; Schmidt, M.; Iacopino, D. Investigation of Au-Hg Amalgam Formation on Substrate-Immobilized Individual Au Nanorods. J. Mater. Chem. C 2015, 3, 8865–8872. [Google Scholar] [CrossRef]
- Goicoechea, J.; Rivero, P.J.; Sada, S.; Arregui, F.J. Self-Referenced Optical Fiber Sensor for Hydrogen Peroxide Detection Based on LSPR of Metallic Nanoparticles in Layer-by-Layer Films. Sensors 2019, 19, 3872. [Google Scholar] [CrossRef] [PubMed] [Green Version]
- Rivero, P.J.; Goicoechea, J.; Arregui, F.J. Layer-by-Layer Nano-Assembly: A Powerful Tool for Optical Fiber Sensing Applications. Sensors 2019, 19, 683. [Google Scholar] [CrossRef] [PubMed] [Green Version]
- Decher, G. Fuzzy Nanoassemblies: Toward Layered Polymeric Multicomposites. Science 1997, 277, 1232–1237. [Google Scholar] [CrossRef]
- Rivero, P.J.; Goicoechea, J.; Urrutia, A.; Matias, I.R.; Arregui, F.J. Multicolor Layer-by-Layer Films Using Weak Polyelectrolyte Assisted Synthesis of Silver Nanoparticles. Nanoscale Res. Lett. 2013, 8, 438. [Google Scholar] [CrossRef] [Green Version]
- Decher, G.; Eckle, M.; Schmitt, J.; Struth, B. Layer-by-Layer Assembled Multicomposite Films. Curr. Opin. Colloid Interface Sci. 1998, 3, 32–39. [Google Scholar] [CrossRef]
- Shiratori, S.S.; Rubner, M.F. PH-Dependent Thickness Behavior of Sequentially Adsorbed Layers of Weak Polyelectrolytes. Macromolecules 2000, 33, 301, 4213–4219. [Google Scholar] [CrossRef]
- Martínez-Hernández, M.E.; Sandua, X.; Rivero, P.J.; Goicoechea, J.; Arregui, F.J. An Optical Fiber Sensor for Hg2+ Detection Based on the LSPR of Silver and Gold Nanoparticles Embedded in a Polymeric Matrix as an Effective Sensing Material. Chem. Proc. 2021, 5, 73. [Google Scholar] [CrossRef]
- Rivero, P.J.; Goicoechea, J.; Matias, I.R.; Arregui, F.J. A Comparative Study of Two Different Approaches for the Incorporation of Silver Nanoparticles into Layer-by-Layer Films. Nanoscale Res. Lett. 2014, 9, 301. [Google Scholar] [CrossRef] [Green Version]
- Rivero, P.J.; Goicoechea, J.; Hernaez, M.; Socorro, A.B.; Matias, I.R.; Arregui, F.J. Optical Fiber Resonance-Based PH Sensors Using Gold Nanoparticles into Polymeric Layer-by-Layer Coatings. Microsyst. Technol. 2016, 22, 1821–1829. [Google Scholar] [CrossRef]
- Rivero, P.J.; Urrutia, A.; Goicoechea, J.; Arregui, F.J. Optical Fiber Humidity Sensors Based on Localized Surface Plasmon Resonance (LSPR) and Lossy-Mode Resonance (LMR) in Overlays Loaded with Silver Nanoparticles. Sens. Actuators B. Chem. 2012, 173, 244–249. [Google Scholar] [CrossRef]
- Sanchez, P.; Zamarreño, C.R.; Hernaez, M.; Matias, I.R.; Arregui, F.J. Optical fiber refractometers based on Lossy Mode Resonances by means of SnO2 sputtered coatings. Sens. Actuators B Chem. 2014, 202, 154–159. [Google Scholar] [CrossRef]
- Zhong, X.; Ma, L.; Yin, G.; Gan, M.; Wei, Y. Hg2+ Optical Fiber Sensor Based on LSPR with PDDA-Templated AuNPs and CS/PAA Bilayers. Appl. Sci. 2020, 10, 4845. [Google Scholar] [CrossRef]
- Endo, T.; Yanagida, Y.; Hatsuzawa, T. Quantitative Determination of Hydrogen Peroxide Using Polymer Coated Ag Nanoparticles. Meas. J. Int. Meas. Confed. 2008, 41, 1045–1053. [Google Scholar] [CrossRef]
- Tsanova, P.; Donkova, B.; Karadjova, I.; Dushkin, C. Synthesis of Starch-Stabilized Silver Nanoparticles and Their Application as a Surface Plasmon Resonance-Based Sensor of Hydrogen Peroxide. Colloids Surfaces A Physicochem. Eng. Asp. 2011, 382, 203–210. [Google Scholar] [CrossRef]


Publisher’s Note: MDPI stays neutral with regard to jurisdictional claims in published maps and institutional affiliations. |
© 2022 by the authors. Licensee MDPI, Basel, Switzerland. This article is an open access article distributed under the terms and conditions of the Creative Commons Attribution (CC BY) license (https://creativecommons.org/licenses/by/4.0/).
Share and Cite
Martínez-Hernández, M.E.; Sandúa, X.; Rivero, P.J.; Goicoechea, J.; Arregui, F.J. Self-Referenced Optical Fiber Sensor Based on LSPR Generated by Gold and Silver Nanoparticles Embedded in Layer-by-Layer Nanostructured Coatings. Chemosensors 2022, 10, 77. https://0-doi-org.brum.beds.ac.uk/10.3390/chemosensors10020077
Martínez-Hernández ME, Sandúa X, Rivero PJ, Goicoechea J, Arregui FJ. Self-Referenced Optical Fiber Sensor Based on LSPR Generated by Gold and Silver Nanoparticles Embedded in Layer-by-Layer Nanostructured Coatings. Chemosensors. 2022; 10(2):77. https://0-doi-org.brum.beds.ac.uk/10.3390/chemosensors10020077
Chicago/Turabian StyleMartínez-Hernández, María Elena, Xabier Sandúa, Pedro J. Rivero, Javier Goicoechea, and Francisco J. Arregui. 2022. "Self-Referenced Optical Fiber Sensor Based on LSPR Generated by Gold and Silver Nanoparticles Embedded in Layer-by-Layer Nanostructured Coatings" Chemosensors 10, no. 2: 77. https://0-doi-org.brum.beds.ac.uk/10.3390/chemosensors10020077