Article

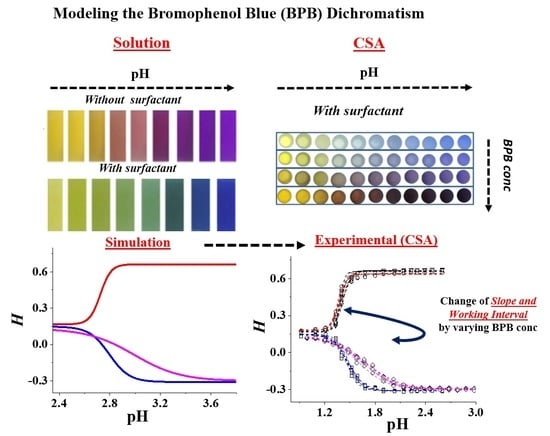
Modeling the Dichromatic Behavior of Bromophenol Blue to Enhance the Analytical Performance of pH Colorimetric Sensor Arrays

Department of Chemical Sciences, University of Padua, Via Marzolo 1, 35131 Padua, Italy
*
Author to whom correspondence should be addressed.
Submission received: 24 January 2022 / Revised: 15 February 2022 / Accepted: 17 February 2022 / Published: 19 February 2022
(This article belongs to the Special Issue Progress of Nanomaterials for Colorimetric Sensing)

Abstract

:
The dichromatism of Bromophenol blue (BPB) was investigated by varying its concentration in the absence and presence of surfactant. A model of the indicator behavior was carried out, justifying the experimental shapes of the sigmoidal profiles of the hue (H) coordinate. The model applied to the solution was compared with the performance of colorimetric sensor arrays (CSAs) with increasing BPB concentrations. The H shape and the prediction errors of the CSAs were very similar to those predicted. The experimental results enable the changing of the slope of the calibration profiles, at will, by varying only the BPB concentration.

Graphical Abstract

1. Introduction

A colorimetric sensor array (CSA) [1,2,3,4,5,6] consists of an array of spots made up of a polymer encapsulating a pH indicator [7,8,9,10,11]. A camera acquires the pictures of the array as the pH changes. Through software, color coordinates extrapolation is possible. In the RGB additive color model, each color is the sum of the three spectral components related to red, green, and blue. The difficulty in correlating RGB colors with spectroscopic changes can be solved using the hue, saturation, and value color space (HSV) [12,13]. The H coordinate [14,15,16,17] is the most suitable, since it is an analytical signal characterized by high robustness. Its value is separated from the V coordinate linked to the lighting conditions and the variability of the background of the acquired image. Despite these characteristics, the H coordinate can still undergo variations, for the same substance used, linked to a change in temperature, crystalline structure, illumination direction, or thickness of the polymer layer used to encapsulate the chromophore [18,19]. In this regard, dichromatism is the phenomenon that implies the H variation by tailoring the thickness of the solution or the polymer encapsulating the colored substance [20,21]. The concentration change also produces a similar effect. This phenomenon takes place when there are two relative minima in the absorption spectrum: one wide and shallow, and one deep and narrow [18,22]. The dichromaticity index (DI) is a relevant parameter defined by Kreft [20] as the difference in hue angle, ∆Hab, between the sample color where chrominance is largest (a), and the color of the same sample four times more diluted (thinner) or four times more concentrated (thicker) (b). The two differences in hue angle are called the dichromaticity index towards the lighter (DIL) and the dichromaticity index towards the darker (DID), respectively [18]. The Kreft DIL and DID indexes for pumpkin seed oil, which is one of the most dichromatic substances, are −9 and −44, respectively. This implies that pumpkin seed oil changes color from green–yellow to red–orange when the thickness of the observed layer increases from about 0.5 mm to 2 mm, and it changes slightly towards green if its thickness is reduced four times.
Bromophenol blue is an acid-base indicator with a p K A of 4.15 in an aqueous solution [23,24,25] and, among the acid-base indicators, it is characterized by the largest dichromatic index. However, its dichromatic behavior when embedded in polymeric matrices, as CSAs, and the influence of its dichromaticity on the repeatability and accuracy of a CSA have not been yet discussed in the literature [24,25,26]. For this reason, the colorimetric sensors proposed in the literature so far must be calibrated each time, because the sigmoidal calibration profile varies according to the thickness [25], leading to a serious limit. If the model does not correctly interpret the experimental data, a systematic error is introduced. The ideal calibration shape would be a mono-sigmoid characterized by a working interval >0.5 pH units. The spots having no gradual variation of H vs. pH, seem to be ideal, but they are characterized by a very narrow interval. For this reason, a very large number of spots must be necessary to obtain a full range sensor with a precision comparable to the glass electrode.
In the present paper, the dichromatic behavior of Bromophenol blue (BPB), both in solution and in a CSA made of a tetra-orthosilicate-based (TEOS) matrix will be investigated, also in the presence of a suitable cationic surfactant. The observed BPB dichromatism affects the shape of the H calibration curve, in terms of slope variation and working interval, upon changing the concentration of the indicator used. The modelization of that behavior will be proposed and used to set up a CSA with improved precision. The starting point is the acquisition of the Vis BPB absorption spectra in solution, in the presence and the absence of the surfactant, to calculate the CIE-xy coordinates. The parametric map of the solutions CIE-xy diagrams will be then used to locate the experimental data in a wide pH interval and indicator concentration. The CSA analytical responses will be compared with the solution ones so that the optimal choice will be determined from the shape of the H (analytical signal) of the calibration profile and the prediction error on the pH measurement.

2. Materials and Methods

2.1. Reagents and Instrumentation

Bromophenol blue (BPB), TEOS (tetra-orthosilicate, ≥99%), Hexadecyltrimethylammonium p-toluenesulfonate (T), acetic acid, and NaOH were provided by Sigma Aldrich. Sodium di-hydrogen phosphate, sodium hydrogen carbonate (99.8%), and ethanol were purchased from Carlo Erba. The white PVDF sheets (thickness 101.0 ± 0.1 µm; porosity of 0.45 µm) were provided from Merck. All regressions were performed through MATLAB, using the iterative “Levenberg Marquardt” algorithm [27]. The pH measurements were carried out at 25 °C with a Hanna Instruments HI11310 glass electrode, calibrated with two Hanna Instruments standard solutions at pH 7.00 and 4.01, respectively. pH measurements, with a colorimetric sensor used for the first time, required a reject cycle of approximately 10 min. After immersing the spots for 50 s, the color acquisition was completed. The total concentration of the buffer solutions was constant and equal to 0.08 M. The color was sampled in a homogeneous central portion of the spot (≈105 pixels), and the background was detected in an external area close to the spot. Appropriate programs written with MATLAB were used to extrapolate the RGB, xyz, and HSV coordinates. The absorbance measurements were carried out with an Agilent Cary 60 UV-Vis spectrometer equipped with a glass cell with an optical path-p-of 1 cm. The BPB solutions were prepared by dissolving the indicator in a 6.1% v/v hydro-alcoholic solution at 25 ± 1 °C. The thickness of the CSAs was measured with a digital Micrometer (Microtech, 0–25 mm, 0.0001 mm).

2.2. Preparation of the CSA

The sol was prepared by the acidic hydrolysis of 13.20 g of TEOS (6.62 g of Milli-Q water + 0.168 g of HClaq 1 N). The initial cloudy solution became clear after 45 min of magnetic stirring at room temperature. The CTApTs surfactant was then added (81 mg/portion). After this step, in each portion, 0.433 g of the ethanolic solution with increasing concentration of BPB, CI, (solution 1: 17.3 mg in 5.02 g of EtOH; solution 2: 32.3 mg in 5.00 g of EtOH; solution 3: 64.0 mg in 5.20 g of EtOH; solution 4: 140.9 mg in 5.00 g of EtOH) was added to 0.520 g of TEOS-sol. The deposition of the polymeric matrix on the PVDF (Polyvinylidene Fluoride) was carried out with a steel bar (diameter, 1.6 mm) at 20 ± 2 °C. Each spot had an average diameter of 3 mm and a weight of 90 μg (mean value of 32 spots). The CSA was then left to age at least 3 days before use. The impregnation with the sol matrix occurred onto the whole thickness of the PVDF support. For this reason, the optical pathway of the CSA, p, corresponded to the thickness of the PVDF support.

2.3. Transduction of Color from “Analogic” to “Digital”

The correct analytical response of a CSA is based on the correct transduction of the “analogic” color of the real solution, into the “digital” one detected by a CCD camera or similar. For this purpose, we resorted to a color space reproducing the human eye perception, the CIE-xy plane, over which the sRGB domain [28], typical of the electronic devices, was overlapped. The sRGB domain was contained in the CIE-xy plane, and therefore was limited because the colors outside the sRGB gamut were not displayed correctly. The calculation of the CIE-xy coordinates through MATLAB was performed using, as input, the experimental BPB absorption spectra—as a function of the BPB concentration and pH—taking into account the tristimulus equations [29,30].

3. Results and Discussion

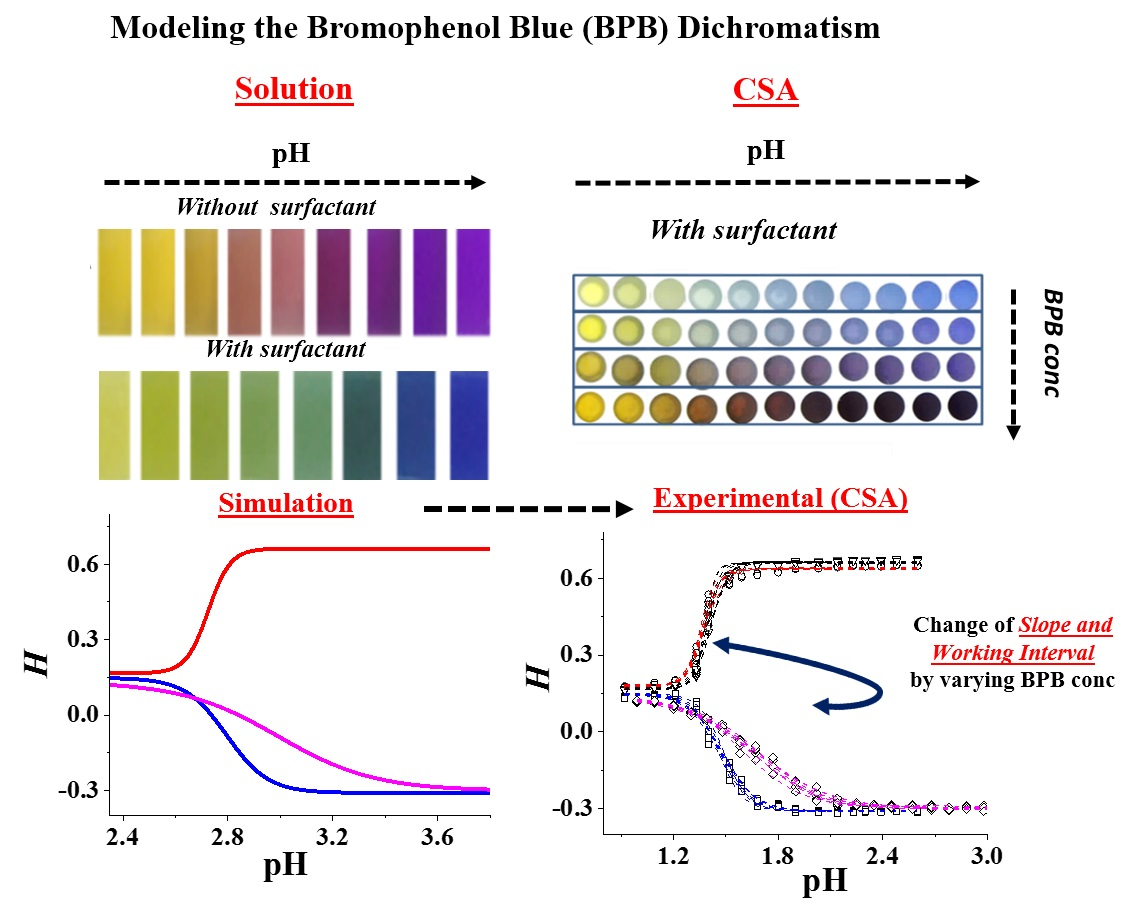
3.1. Absorption Spectra of the Solutions of BPB

To locate the colors of BPB in the CIE-xy plane, the Vis absorption spectra of BPB in solution -considered as a monoprotic weak acid, HI—in the presence and absence of surfactant, were acquired as a function of pH. Figure 1 reports the two situations.
From the absorption spectra, p K A = 4.19 (0.03) and p K A = 2.76 (0.09) were obtained in the absence (a) and the presence (b) of the surfactant, respectively. The surfactant concentration was CT = 0.0123 M, close to its solubility limit in the chosen environment. The increase in εmax2) and the acidic shift of the conditional pKA from 4.19 to 2.76 indicated a clear interaction of the anionic species of the indicator with the cationic head group of CTApTs. As described elsewhere [31,32], the formation of the I||T+ ion pair in solution occurred. The isosbestic point, occurring in the presence of an excess of T, showed that in these conditions only two species were at equilibrium (HI and T+||I) as [I] was negligible. Consequently, the mass balance was CHI ≅ [HI] + [T+||I]. In the solution, the absorption peak of HI shifted in the presence of surfactant by 14.5 nm towards the blue, while the basic peak increased by 14.1 nm towards the red. Table 1 summarizes all the parameters useful for understanding the behavior of the indicator in the solution.
The colors of the BPB solutions, as a function of pH, are shown in Figure 2 without T (a), with (b) T, and with three concentrations of BPB (1, 2, 3). In series (a), the color changed from yellow–orange to purple, and in (b) from yellow–green to blue. Close to the p K A values (4.19 (a), and 2.76 (b)) the color was purple without T and green–blue in its presence.
The addition of T to a BPB solution was responsible not only for the color transition between complementary colors, but also for a larger color variation near the p K A value (effect depending on the BPB concentration). The formation of the I||T+ ion pair in solution had, therefore, a dichromatic behavior larger than the I- alone. This is a novel clue to prepare a CSA with better precision.

3.2. Color Transduction from “Analogic” (Experimental) to “Digital” (s-RGB) for BPB Solutions

The experimental calibrations without and with the surfactant, and at three CI values are reported in Figure 3a,b, respectively, together with the simulated curves that match the experiments quite well. In the absence of T (a), as the concentration of the indicator increases, the shape of the calibration profile changes from mono-sigmoidal to double-sigmoidal. The effect is caused by the route of the calibration in the color-space domain. The results of the same experiments are located in the CIE-xy plane containing the s-RGB domain (CCD), reported in Figure 3c,d. The grid was simulated by using the absorption spectra previously reported. The vertical curves are iso-CI and variable pH, while the horizontal curves are iso-pH and variable CI. The arrows indicate the direction of the BPB concentration and pH changes. Symbols, l o g C I · p = −4.54 (□), −4.24 (○), −3.91 (●), represent the experimental points corresponding to the colors of the solutions of Figure 2 acquired with the camera. The pH values are: 1.19, 2.20, 3.01, 3.61, 3.80, 4.21, 4.59, 5.38, and 6.59 in (a); 1.19, 1.59, 1.79, 2.00, 2.20, 2.39, 3.01, and 3.61 in (b).
In Figure 3c the iso- C I curve relative to (○) is perfectly matched by the simulated values. The iso- C I curve, relative to (●), is characterized by very saturated colors at the most basic pH values (last three values). Those colors belong to the CIE-xy domain but are out the edges of the sRGB triangle (color space adopted by the camera). Outside the edges of the sRGB triangle, the camera does not discern any color variation and puts the outer value on the edge. Experimental data relative to (□) are more uncertain as, at that dilution, the acquisition of the x and y coordinates is cumbersome owing to the presence of the background color (not perfectly white), which may alter the colors. In the presence of surfactant (Figure 3d), the indicator color transition always remains in the region of the s-RGB triangle indicating that the camera reads the “real” color of the solutions and realizes the ideal condition of detection. It must be noted that all the experimental data start and end at the same colors; namely, they have a color variation from yellow–orange to purple (Figure 2a) and yellow–green to blue (Figure 2b).

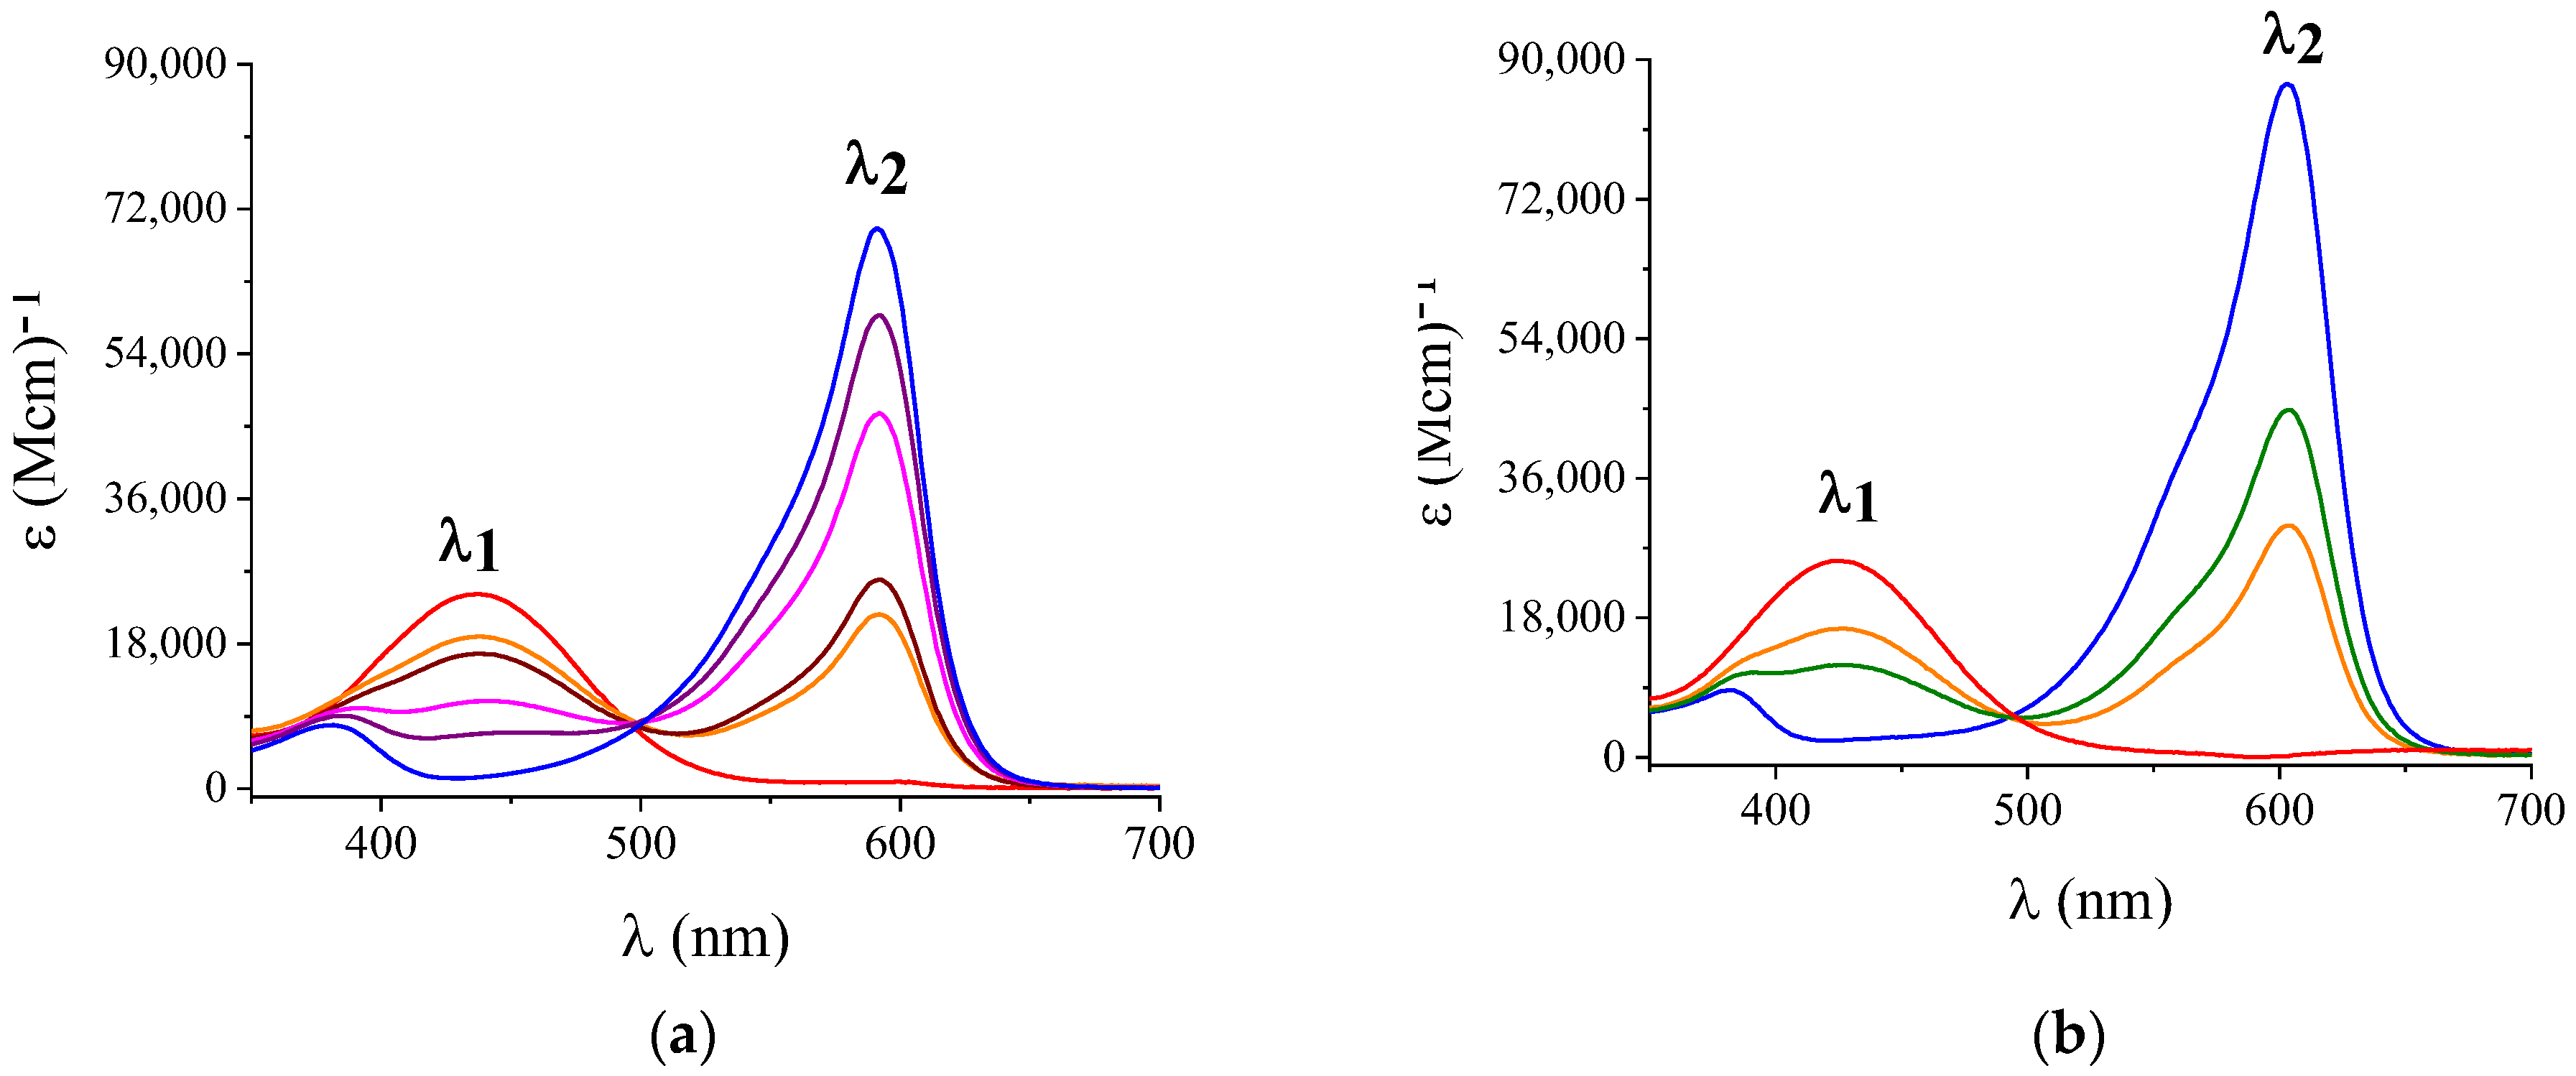
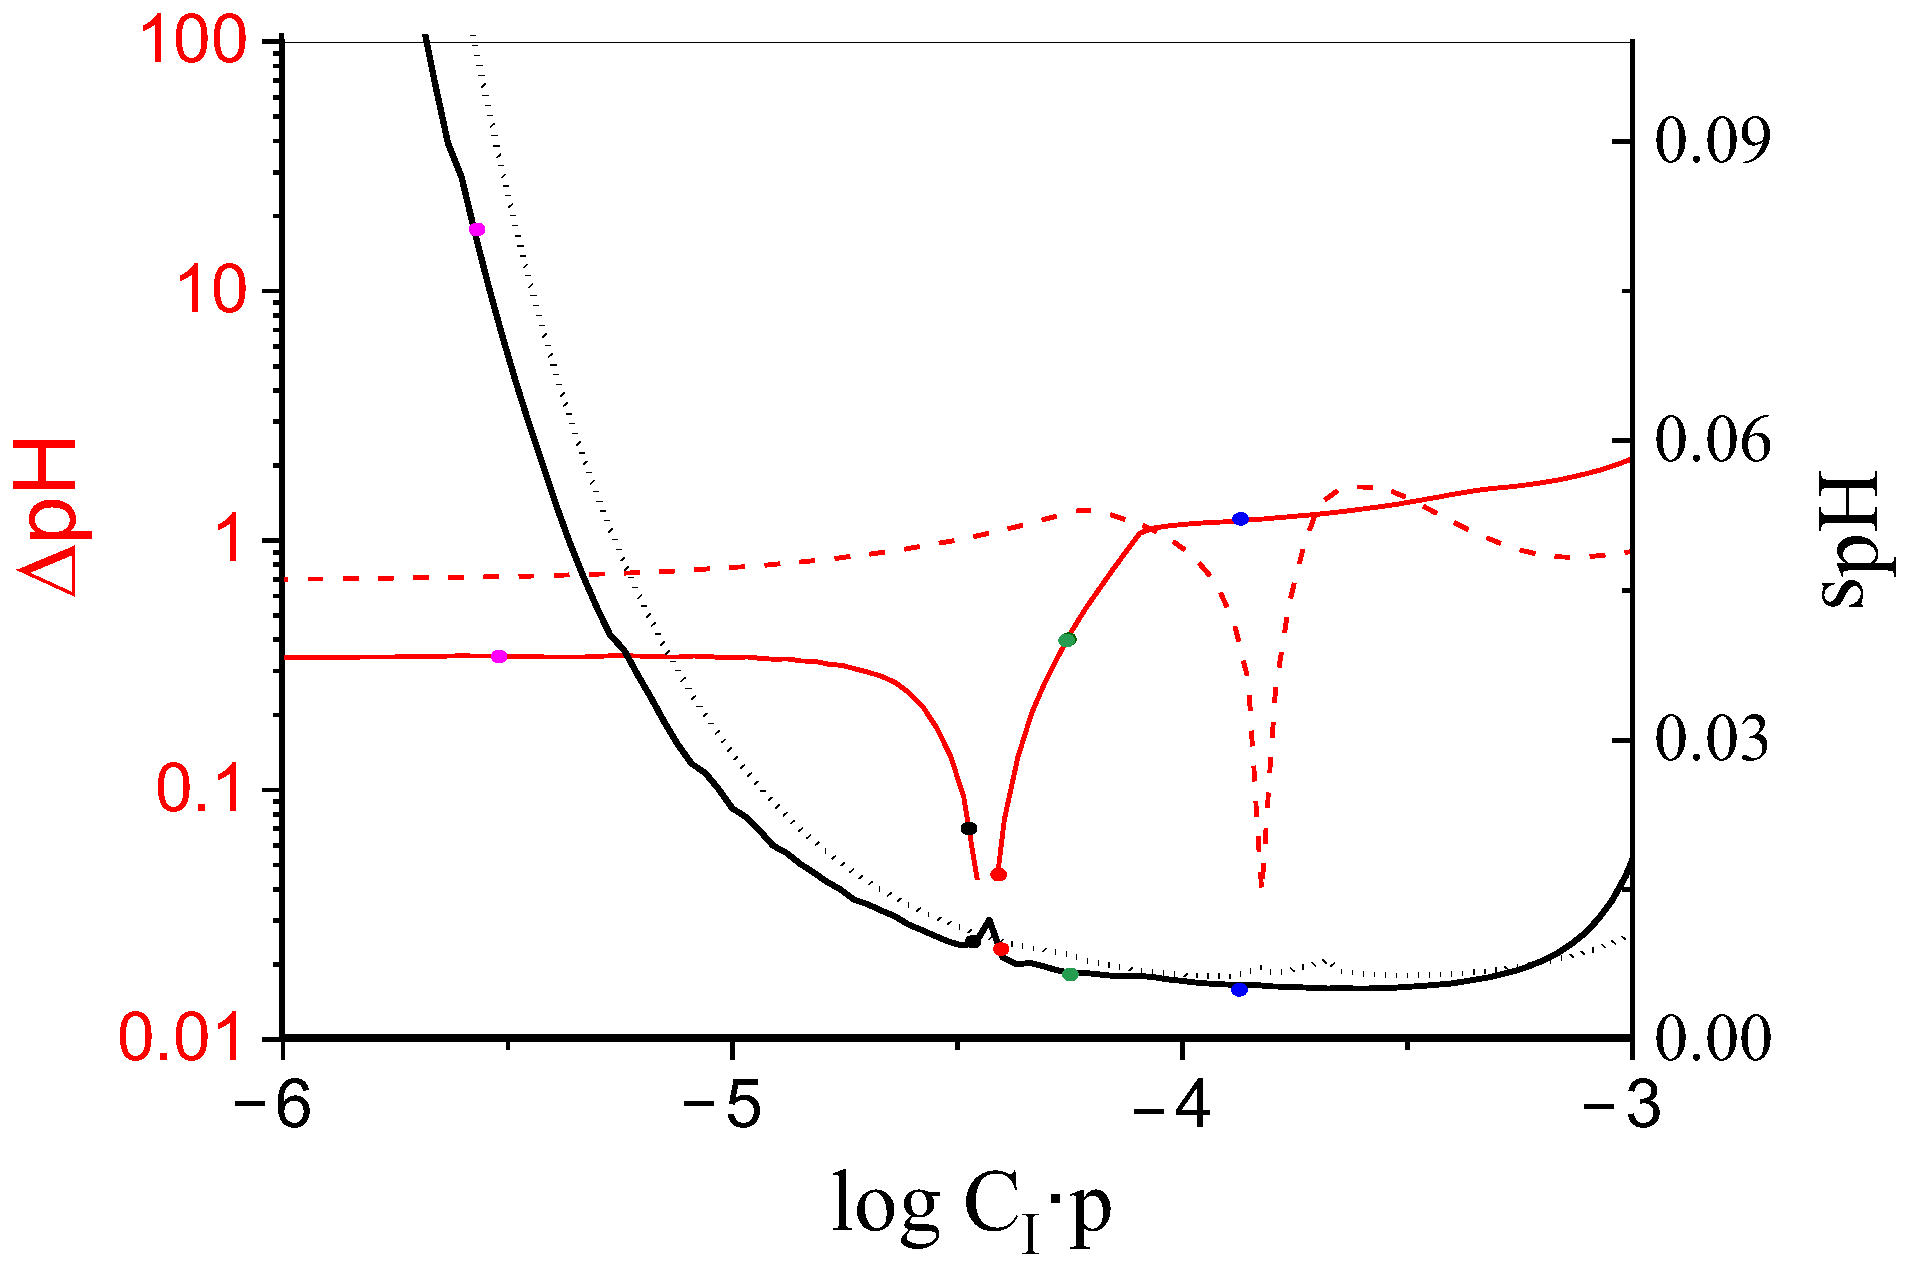
3.3. Simulated H Profiles in the Solution and Associated pH Prediction Error

The good agreement of the experimental data in the CIE-xy plane with the simulation enables the use of the model to predict the shape of the H curves vs. pH in the absence and presence of the surfactant as a function of CI, as demonstrated in Figure 3. Literature data [33] report that the prediction error, s pH , associated with the pH measurement is:
s pH s H Δ S H
where sH is a constant and represents the instrumental error, SH is the slope of the H sigmoid as a function of pH, and ∆ is the product of the saturation, S, by the value, V. The minimum value of s pH is obtained when the product of ∆SH is maximum.
Figure 4 reports the simulated H profiles from the VIS spectra of solutions without (a) and with (b) T, respectively. In Figure 4a, curves 1 and 2 are both sigmoidal, although characterized by different slopes. Curves 3 and 4 indicate an inversion of the direction of the H variation, and they are essentially specular compared to the former two. Curve 5 points out the double-sigmoidal shape having an overall lower slope, as already experimentally seen in Figure 3a. The shape of this last curve is due to its location in the CIE-xy (s-RGB) plane. In that area, the three central circles of the calibration lie in a strong curvature, where the color variation is very limited. In Figure 4b, the inversion of the slope of the simulated profiles is shifted toward larger CI values. When T is present in the solution, the s-RGB area involved is different so that the H profile remains mono-sigmoidal in a larger CI interval.
The shapes of the reported calibrations determine the entity of the error. Figure 5 shows the trend of the parameters spH (precision error), and ∆pH (working interval) in the absence (full curves) and presence of surfactant (dashed curves) vs. l o g C I · p . The colored symbols refer to the curves of Figure 4a. In general, spH decreases with the increase in C I , since ∆ increases with the concentration more than the slope decreases. It occurs up to a value of l o g C I · p close to −3.82. At larger C I values of spH increase as the color saturates approach black. The prediction error between l o g C I = −4.45 and −4.00 is minimum and approximately constant. Between −4.43 and −4.31, the inversion takes place so that spH slightly increases passing close to the achromatic point—where the color is absent and S = 0.
Another important parameter—see Figure 5—is the working interval of each spot, ∆pH. This parameter, here represented for solutions, is very important in view of the CSA preparation. In particular, a large ∆pH enables the use of a lower number of spots. For l o g C I < −4.76, the ∆pH assumes a constant value and the H profiles are sigmoidal (curve 1 in Figure 4). From −4.10 to −3.51, ∆pH increases (lower slope of the calibration), but the precision improves. It occurs because the product ∆ = S∙V increases more than the slope decreases. Furthermore, in this part, the shape of the H profile gradually changes from mono-sigmoidal to double-sigmoidal (blue curve in Figure 4a). In the presence of T (dashed curves of Figure 5), the concentration at which the inversion of the H profile occurs is shifted towards larger values. Therefore, the profile remains mono-sigmoidal in a wider working range, with an inherent advantage in terms of simplicity of processing and calculation.

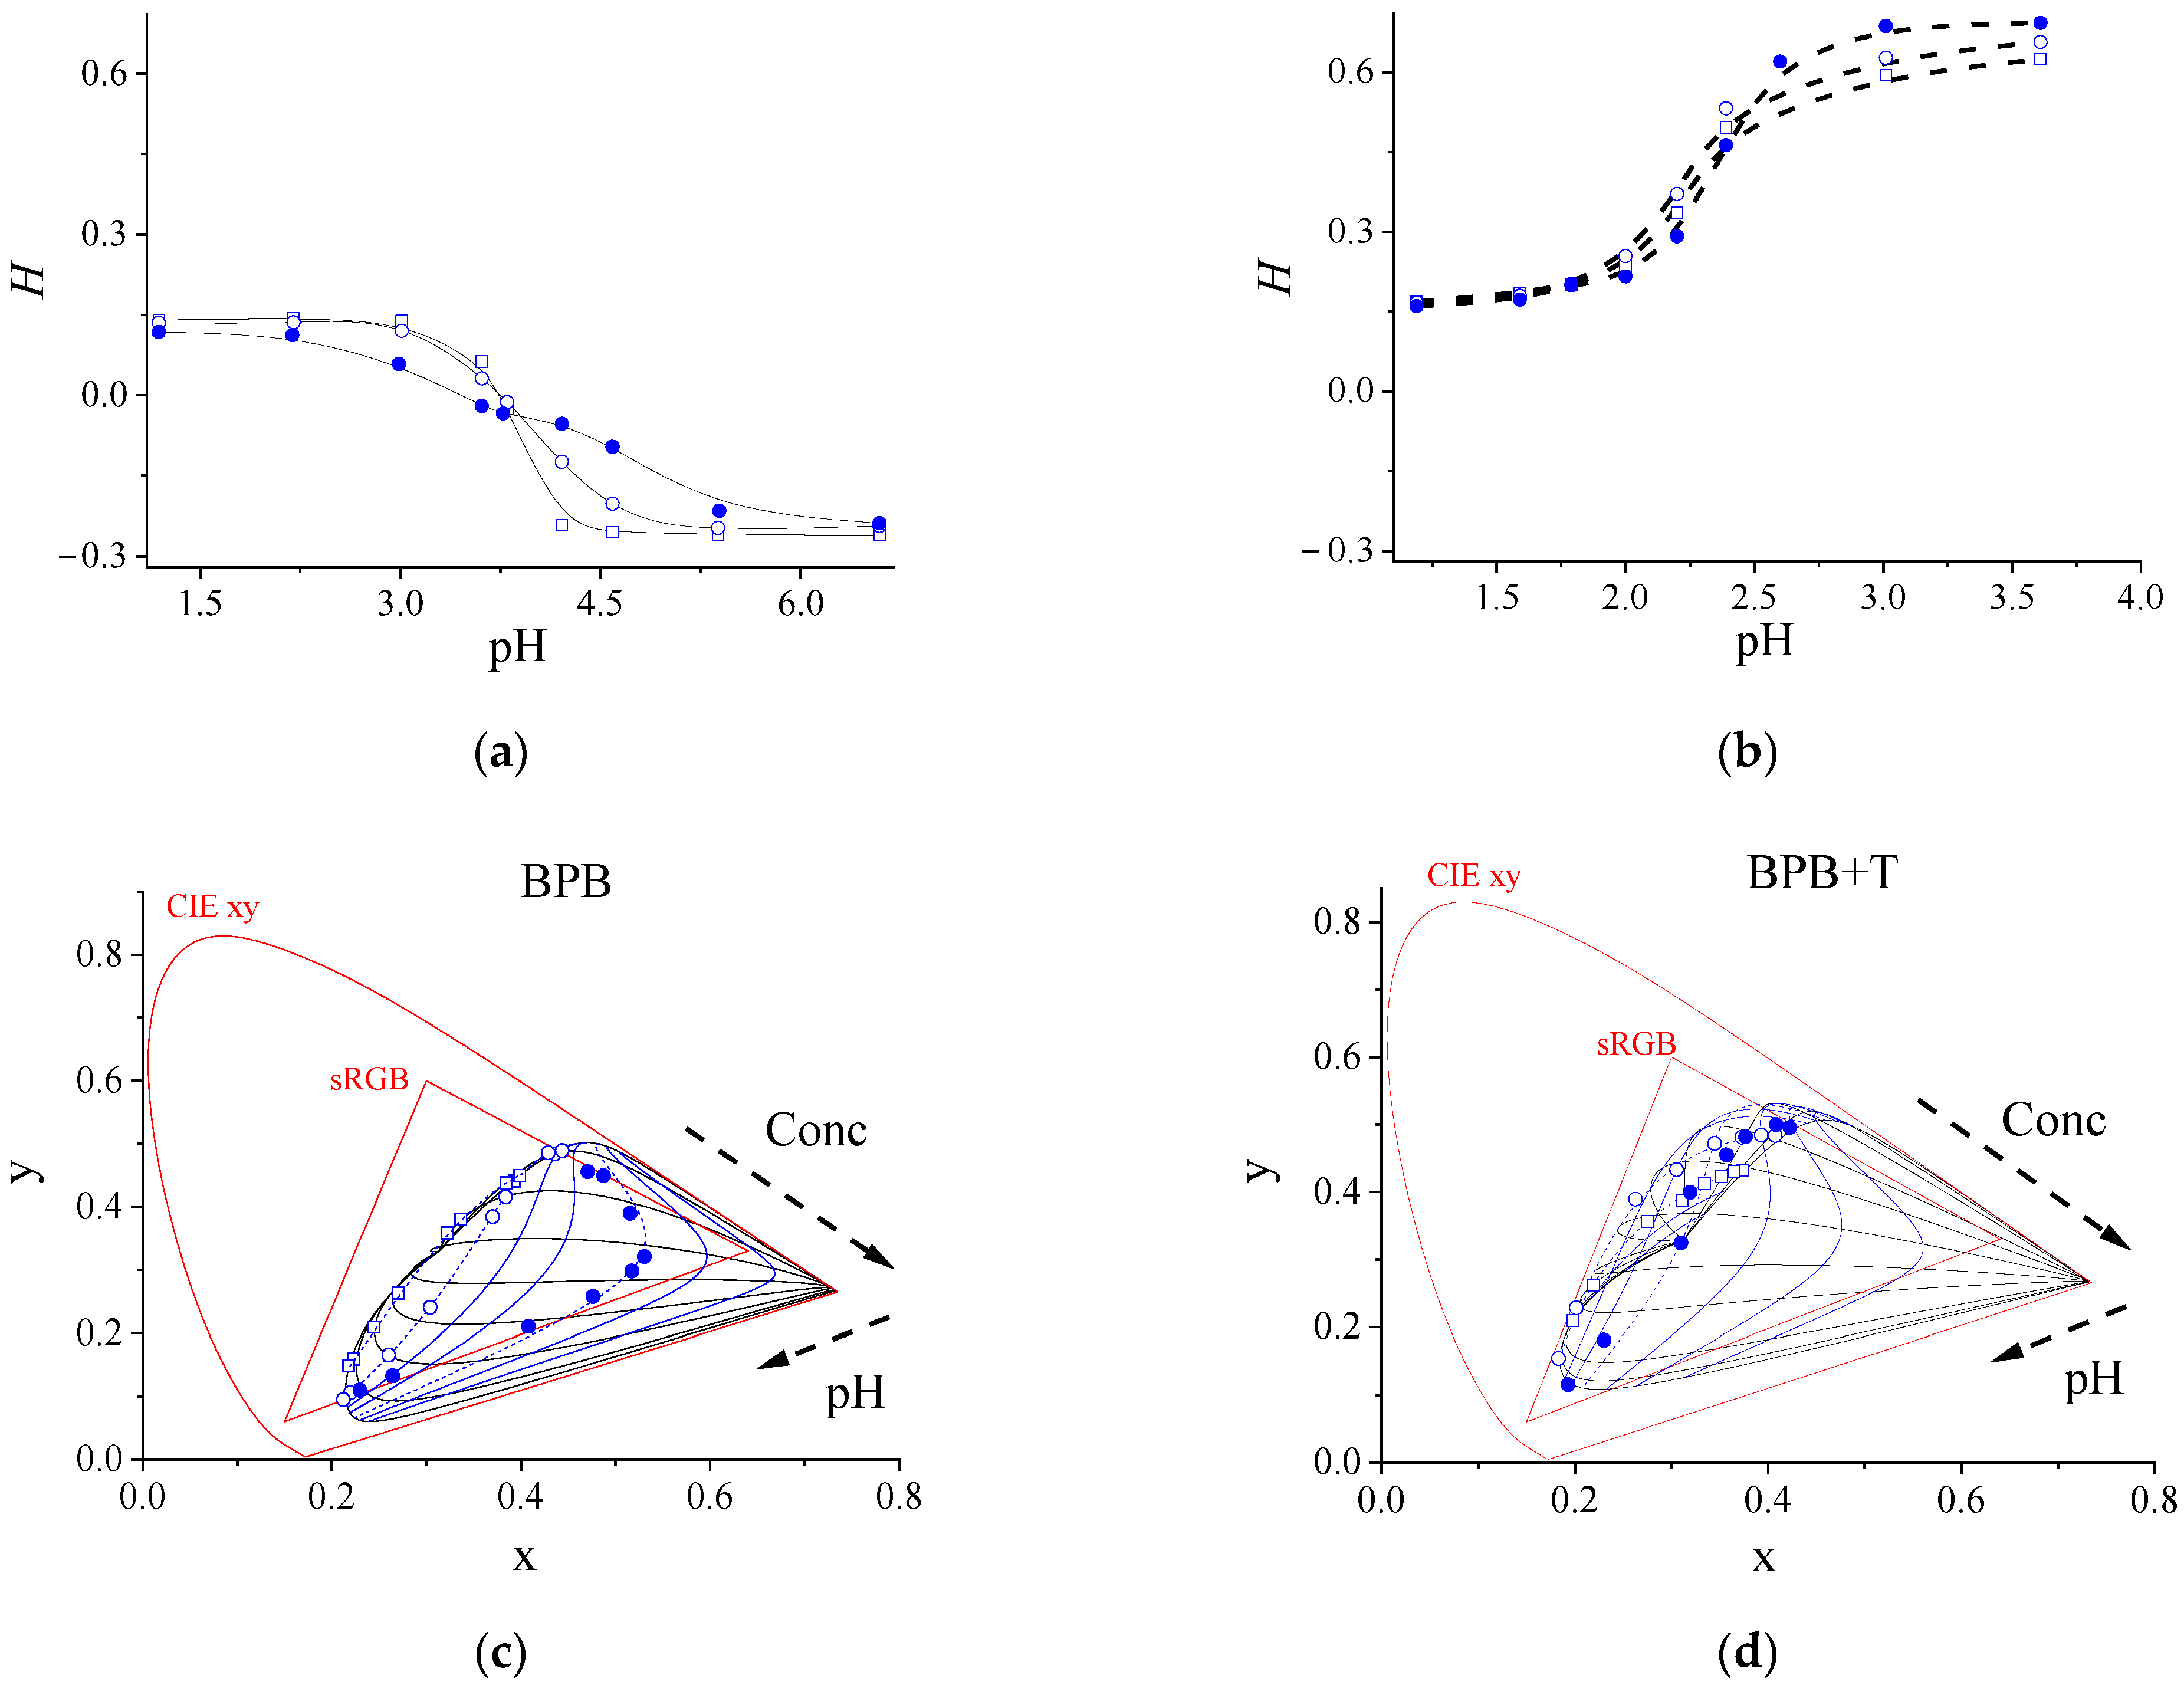
3.4. Experimental H Profiles of the CSAs

The CSA prepared for this experiment is composed of four spots, with increasing BPB concentrations and the same ratio 0.236 gCTApTs/gprecursor. When immersed in solutions, characterized by pH values from 0.90 to 3.00, the colors of the spots change according to the picture in Figure 6a. The squares indicated the p K A values of BPB in the four experimental conditions. As the indicator concentration increases (from top to bottom), the color of the spots corresponding to pH close to the conditional p K A changes from green to brown, indicating the dichromatic behavior of BPB even inside the polymeric layer, and it moves toward a more basic pH. The upper two spots express almost the same p K A as they have similar colors, even though the concentration ratio is doubled in the second. Figure 6b illustrates the four experimental H vs. pH profiles of the CSA just described. The dashed lines are the result of the curve fitting of each spot. The red and black sigmoids describe the upper two spots and the p K A close to the inflection points are almost the same as described by the colors. The blue curve corresponds to the third spot. The sigmoid shape is quite similar to the previous ones, but the slope is negative and lower according to the behavior of the solution. The inversion was achieved for a concentration of BPB larger than in solution 2 (see Section 2.2). The purple curve, the fourth spot, has again a negative and still lower slope, indicating a calibration located in an s-RGB area, where the color changes more gradually.
The regression variance was estimated by using 8 sensors for a total of 32 spots. Their signals were used to obtain the data reported in Figure 6b. To more easily calculate the precision error, the sigmoids were linearized as represented in Figure 6c. The linearization F was obtained according to the following formula:
F = l n H H I n H H H I n = a + S · pH
where a and S are intercept and slope from which it was possible to estimate Δ pH = 4 / S and pH i = a / S , respectively. The H values corresponding to the acidic and the basic plateau of the sigmoidal profile are H H I n and H I n . In [33], we demonstrated that the precision error s p H of the entire domain of each spot can be estimated in a good way by the ratio s y / x b , where s y / x is the regression standard deviation. Table 2 reports the parameters a (intercept), S (slope), RSS (residual sum of squares), Adj. R-Square, pHi (inflection point), ∆pH (working interval), s y / x (variance of regression), and s pH (pH prediction error).
For the BPB, the error increases when approaching the inversion point, from the red curve to the black one. After the inversion, it decreases and then gradually rises again. It can be noted that the purple curve in Figure 6b has a precision value of 0.014 pH units coupled to ∆pH = 0.24 pH units and the purple one of 0.035 pH units coupled to ∆pH = 0.79 pH units. To achieve the same precision in the same working interval, a larger number of spots with the composition of the red curve would be necessary. For this reason, curve 4 is preferable.
The present paper is dedicated to the study of a specific property of the indicator molecule, the variation of its dichromatic behavior under specific conditions. For this reason, real applications were not considered. A specific solution was anyway used, and it can be considered as a real solution: the NIST standard provided by Reagecon. It has a nominal pH = 1.68 (±0.01). The pH value determined with the used CSA was 1.67 ± 0.02. This result is included in the H profiles of Figure 6b. CSAs working in the entire pH interval with a precision comparable to the glass electrode were already prepared. A device working in low ion strength media (surface water, and spring water, for instance) is already available, and applications to real matrices such as seawater, fermented beverages, fruit juice, and others, will start as soon as CSAs can be prepared for the specific task.

4. Conclusions

This paper investigated the behavior of Bromophenol blue (BPB), both in solution and in a tetra-orthosilicate-based CSA to enhance the analytical performance of the CSA. The error value, estimated for the pH measurements, increased from 0.014 pH units to 0.026 pH units as the BPB approached the condition of inversion of the slope calibration profile (negative slope). After the inversion, it decreased to 0.025 pH units, and then gradually rose again up to 0.035 pH units. This last condition, apparently worse for a larger error, is preferable since the working interval associated with a single spot is larger (0.79 pH units) than the other spots (0.24, 0.26, and 0.48 pH units, respectively). For this reason, a lower number of spots would be necessary to achieve the same precision in the same working interval. The CSA is reversible, reusable, and stable. Leaching phenomena are absent, even at strongly acidic pH values, where the glass electrodes usually fail.

5. Patents

An international patent (pH colorimetric sensor Arrays; IT102019000013878) is pending. The Italian license has already been successfully granted.

Author Contributions

Investigation, A.P.; conceptualization, D.B. and L.C.; data curation, D.B. and A.P.; writing—original draft preparation, A.P.; writing—review and editing, P.P., D.B. and L.C.; supervision, P.P. All authors have read and agreed to the published version of the manuscript.

Funding

This research received no external funding.

Institutional Review Board Statement

Not applicable.

Informed Consent Statement

Not applicable.

Data Availability Statement

Not applicable.

Acknowledgments

Lorenzo Dainese (technical support) prepared the measurement cell.

Conflicts of Interest

The authors declare no conflict of interest.

References

  1. Ko, Y.; Jeong, H.Y.; Kwon, G.; Kim, D.; Lee, C.; You, J. pH-responsive polyaniline/polyethylene glycol composite arrays for colorimetric sensor application. Sens. Actuators B Chem. 2020, 305, 127447. [Google Scholar] [CrossRef]
  2. Chen, H.; Ding, F.; Zhou, Z.; He, X.; Shen, J. FRET-based sensor for visualizing pH variation with colorimetric/ratiometric strategy and application for bioimaging in living cells, bacteria and zebrafish. Analyst 2020, 145, 4283–4294. [Google Scholar] [CrossRef] [PubMed]
  3. Capel-Cuevas, S.; Cuéllar, M.P.; de Orbe-Payá, I.; Pegalajar, M.C.; Capitán-Vallvey, L.F. Full-range optical pH sensor array based on neural networks. Microchem. J. 2011, 97, 225–233. [Google Scholar] [CrossRef]
  4. Caldara, M.; Colleoni, C.; Guido, E.; Re, V.; Rosace, G. Development of a textile-optoelectronic pH meter based on hybrid xerogel doped with Methyl Red. Sens. Actuators B Chem. 2012, 171–172, 1013–1021. [Google Scholar] [CrossRef]
  5. Martinez-Olmos, A.; Capel-Cuevas, S.; López-Ruiz, N.; Palma, A.J.; De Orbe, I.; Capitán-Vallvey, L.F. Sensor array-based optical portable instrument for determination of pH. Sens. Actuators B Chem. 2011, 156, 840–848. [Google Scholar] [CrossRef]
  6. Li, H.; Zhang, B.; Hu, W.; Liu, Y.; Dong, C.; Chen, Q. Monitoring black tea fermentation using a colorimetric sensor array-based artificial olfaction system. J. Food Processing Preserv. 2018, 42, e13348. [Google Scholar] [CrossRef] [Green Version]
  7. Li, Z.; Suslick, K.S. Colorimetric Sensor Array for Monitoring CO and Ethylene. Anal. Chem. 2019, 91, 797–802. [Google Scholar] [CrossRef]
  8. Gotor, R.; Ashokkumar, P.; Hecht, M.; Keil, K.; Rurack, K. Optical pH Sensor Covering the Range from pH 0–14 Compatible with Mobile-Device Readout and Based on a Set of Rationally Designed Indicator Dyes. Anal. Chem. 2017, 89, 8437–8444. [Google Scholar] [CrossRef] [Green Version]
  9. Fairclough, S.M.; Giannetti, C.; Wagner, I.; Shakeel, H. Colorimetric sensor for pH monitoring of liquid samples using bubble wrap and mobile phone camera. In Proceedings of the 2020 IEEE International Conference on Flexible and Printable Sensors and Systems (FLEPS), Manchester, UK, 16–19 August 2020; pp. 2020–2023. [Google Scholar] [CrossRef]
  10. Kuswandi, B.; Asih, N.P.N.; Pratoko, D.K.; Kristiningrum, N.; Moradi, M. Edible pH sensor based on immobilized red cabbage anthocyanins into bacterial cellulose membrane for intelligent food packaging. Packag. Technol. Sci. 2020, 33, 321–332. [Google Scholar] [CrossRef]
  11. Huang, X.-w.; Zou, X.-b.; Shi, J.-y.; Li, Z.-h.; Zhao, J.-w. Colorimetric sensor arrays based on chemo-responsive dyes for food odor visualization. Trends Food Sci. Technol. 2018, 81, 90–107. [Google Scholar] [CrossRef]
  12. Ragain, J.C. A Review of Color Science in Dentistry: Colorimetry and Color Space. J. Dent. Oral Disord. Ther. 2016, 4, 1–5. [Google Scholar] [CrossRef]
  13. Pastore, A.; Badocco, D.; Pastore, P. High accuracy OrMoSil (Polyvinylidene Fluoride)-supported colorimetric sensor: Novel approach for the calculation of the pH prediction error. Talanta 2020, 213, 120840. [Google Scholar] [CrossRef] [PubMed]
  14. Shalaby, A.A.; Mohamed, A.A. Determination of acid dissociation constants of Alizarin Red S, Methyl Orange, Bromothymol Blue and Bromophenol Blue using a digital camera. RSC Adv. 2020, 10, 11311–11316. [Google Scholar] [CrossRef] [Green Version]
  15. Cantrell, K.; Erenas, M.M.; De Orbe-Payá, I.; Capitán-Vallvey, L.F. Use of the hue parameter of the hue, saturation, value color space as a quantitative analytical parameter for bitonal optical sensors. Anal. Chem. 2010, 82, 531–542. [Google Scholar] [CrossRef] [PubMed]
  16. Pastore, A.; Badocco, D.; Bogialli, S.; Cappellin, L.; Pastore, P. Ph colorimetric sensor arrays: Role of the color space adopted for the calculation of the prediction error. Sensors 2020, 20, 6036. [Google Scholar] [CrossRef] [PubMed]
  17. Pastore, A.; Badocco, D.; Pastore, P. Kinetic response of pH colorimetric sensors: Role of the cationic surfactant concentration and amount and type of solvent used in the preparation of the sensing spot. Microchem. J. 2020, 157, 104891. [Google Scholar] [CrossRef]
  18. Kreft, S.; Kreft, M. Quantification of dichromatism: A characteristic of color in transparent materials. J. Opt. Soc. Am. A 2009, 26, 1576. [Google Scholar] [CrossRef] [PubMed]
  19. Smith, S.D. Quantifying Color Variation: Improved Formulas for Calculating Hue with Segment Classification. Appl. Plant Sci. 2014, 2, 1300088. [Google Scholar] [CrossRef]
  20. Kreft, S.; Kreft, M. Physicochemical and physiological basis of dichromatic colour. Naturwissenschaften 2007, 94, 935–939. [Google Scholar] [CrossRef]
  21. Huertas, R.; Yebra, A.; Pérez, M.M.; Melgosa, M.; Negueruela, A.I. Color Variability for a Wine Sample Poured into a Standard Glass Wine Sampler. Color Res. Appl. 2003, 28, 473–479. [Google Scholar] [CrossRef]
  22. Richer, S.P.; Little, A.C.; Adams, A.J. Effect of ophthalmic filter thickness on predicted monocular dichromatic luminance and chromaticity discrimination. Am. J. Optom. Physiol. Opt. 1984, 61, 666–673. [Google Scholar] [CrossRef]
  23. Sabnis, R.W. Handbook of Acid-Base Indicators; CRC Press: Boca Raton, FL, USA, 2007; pp. 1–416. [Google Scholar]
  24. Sun, W.; Li, H.; Wang, H.; Xiao, S.; Wang, J.; Feng, L. Sensitivity enhancement of pH indicator and its application in the evaluation of fish freshness. Talanta 2015, 143, 127–131. [Google Scholar] [CrossRef] [PubMed]
  25. Suah, F.B.M.; Ahmad, M.; Taib, M.N. Applications of artificial neural network on signal processing of optical fibre pH sensor based on bromophenol blue doped with sol-gel film. Sens. Actuators B Chem. 2003, 90, 182–188. [Google Scholar] [CrossRef]
  26. Zhang, J.; Zhou, L. Preparation and optimization of optical pH sensor based on sol-gel. Sensors 2018, 18, 3195. [Google Scholar] [CrossRef] [Green Version]
  27. Marquardt, D.W. An Algorithm for Least-Squares Estimation of Nonlinear Parameters. J. Soc. Ind. Appl. Math. 2019, 11, 431–441. [Google Scholar] [CrossRef]
  28. Harris, A.C.; Weatherall, I.L. Objective evaluation of colour variation in the sandburrowing beetle chaerodes trachyscelides white (Coleoptera: Tenebrionidae) by instrumental determination of CIELAB values. J. R. Soc. N. Z. 1990, 20, 253–259. [Google Scholar] [CrossRef] [Green Version]
  29. Otsu, H.; Yamamoto, M.; Hachisuka, T. Reproducing Spectral Reflectances From Tristimulus Colours. Comput. Graph. Forum 2018, 37, 370–381. [Google Scholar] [CrossRef]
  30. Lee, H.-C. Colorimetry. In Introduction to Color Imaging Science; Cambridge University Press: Cambridge, UK, 2010; pp. 89–131. [Google Scholar] [CrossRef]
  31. Rottman, C.; Grader, G.; De Hazan, Y.; Melchior, S.; Avnir, D. Surfactant-induced modification of dopants reactivity in sol-gel matrixes. J. Am. Chem. Soc. 1999, 121, 8533–8543. [Google Scholar] [CrossRef]
  32. Kodeh, F.S.; El-Nahhal, I.M.; Abd el-salam, F.H. Sol–Gel Encapsulation of Thymol Blue in Presence of Some Surfactants. Chem. Afr. 2019, 2, 67–76. [Google Scholar] [CrossRef] [Green Version]
  33. Pastore, A.; Badocco, D.; Pastore, P. Reversible and high accuracy pH colorimetric sensor array based on a single acid-base indicator working in a wide pH interval. Talanta 2020, 219, 121251. [Google Scholar] [CrossRef]
Figure 1. VIS spectra of BPB solutions at various pH values: (a) pH = 1.19 (red); 3.80 (orange); 3.99 (brown); 4.59 (magenta); 4.87 (violet); 6.59 (blue); (b) pH = 1.19 (red); 2.39 (orange); 2.60 (olive); and 4.47 (blue). The total concentration of the buffer solutions is constant and equal to ≈0.08 M. In (b) CT = 0.0123 M CTApTs.
Chemosensors 10 00087 g001
Figure 2. BPB solutions vs. pH without (a) and with (b) CTApTs (0.0123 M), with increasing concentrations of indicator: (1) 1.42 × 10⁻⁵ M; (2) 2.91 × 10⁻⁵ M; (3) 5.72 × 10⁻⁵ M.
Chemosensors 10 00087 g002
Figure 3. BPB calibration curves H vs. pH without (a) and with T (b). Symbols and lines are the experimental (solutions of Figure 2) and the simulated data, respectively. pH values: 1.19, 2.20, 3.01, 3.61, 3.80, 4.21, 4.59, 5.38, 6.59 in (a) and 1.19, 1.59, 1.79, 2.00, 2.20, 2.39, 3.01, 3.61 in (b). l o g C I · p = −4.54 (□), −4.24 (○), −3.91 (●). (c) and (d) same data as (a) and (b) located in the CIE-xy and s-RGB color-spaces domains. The arrows indicate the direction of the BPB concentration and pH changes.
Chemosensors 10 00087 g003
Figure 4. Simulated H profiles vs. pH, parametric in log CI, in the absence (a) and presence of surfactant (b). (a) l o g C I · p = −5.51 (purple, 1), −4.46 (black, 2), −4.43 (red, 3), −4.25 (green, 4), −3.80 (blue, 5). (b) l o g C I · p = −3.90 (blue, 1′), −3.71 (red, 2′), −3.50 (green, 3′).
Chemosensors 10 00087 g004
Figure 5. Trend of spH and ∆pH in the absence (solid curves) and presence of surfactant (dashed curves). The colored symbols refer to the curves of Figure 4a.
Chemosensors 10 00087 g005
Figure 6. (a) CSA vs. pH and BPB concentration. Only one spot was reported for each BPB concentration, at 11 pH values. The squares highlight the color variation from green to brown near the p K A . (b) H profiles vs. pH of the CSAs prepared with solutions with increasing BPB concentration (8 repeated spots for each concentration): 1 (red curve; ○); 2 (black curve; ▽); 3 (blue curve; □); 4 (purple curve; ◊) of Section 2.2. (c) Corresponding linearization profile F of (a) vs. pH.
Chemosensors 10 00087 g006
Table 1. Spectroscopic parameters, for BPB (concentration = 0.06 mM), with (CT = 0.0123 M) and without surfactant, εmax1) and εmax2) for the acidic and basic form, εmax2)/εmax1), and ∆λ(nm).
CT (M)εmax1) (Mcm)−1λ1 (nm)εmax2) (Mcm)−1λ2 (nm)εmax2)/εmax1)∆λ (nm)
024,15743769,6375902.6153
0.012325,51242385,9186053.4182
Table 2. Parameters a, S, RSS, Adj. R-Square, pHi, ∆pH, s y / x , and s pH of the CSAs obtained at different CI values. The mean thickness (p) of each sensor is 101.0 ± 0.1 µm.
CurveRedBlackBluePurple
CI (M)0.00640.01200.02300.0530
log C I · p −4.18−3.91−3.63−3.27
a−11.35−10.47−6.11−4.23
S8.297.444.162.52
RSS0.3090.7950.4080.472
Adj. R-Square0.970.910.970.98
pHi1.3681.4091.4701.680
∆pH0.2410.2690.4810.795
s y / x 0.1190.1900.1050.087
s pH 0.0140.0260.0250.035
Publisher’s Note: MDPI stays neutral with regard to jurisdictional claims in published maps and institutional affiliations.

