
A Label-Free Colorimetric Assay Based on Gold Nanoparticles for the Detection of H2O2 and Glucose

1
Key Laboratory of Colloid and Interface Chemistry, Shandong University, Ministry of Education, Jinan 250100, China
2
Petroleum Engineering Technology Research Institute of Shengli Oilfield, Sinopec, Dongying 257000, China
*
Author to whom correspondence should be addressed.
†
These authors contributed equally to this work.
Chemosensors 2022, 10(3), 100; https://0-doi-org.brum.beds.ac.uk/10.3390/chemosensors10030100
Submission received: 15 January 2022
/
Revised: 28 February 2022
/
Accepted: 3 March 2022
/
Published: 5 March 2022
(This article belongs to the Special Issue Feature Papers on Luminescent Sensing)
Abstract
:The significance of sensing hydrogen peroxide (H2O2) is due to its ubiquity, being a potential biomarker as well as an end-product of several oxidation reactions. Herein, based on gold nanoparticles (AuNPs) and coupled with single-stranded DNA (ssDNA) and ceria nanoparticles (CeO2), we developed a novel colorimetric method to detect H2O2 and glucose in NaCl solutions. In the presence of H2O2, ssDNA adsorbed on the surface of CeO2 could be released and subsequently decorated AuNPs, resulting in a distinct color change of the aqueous solution from purple to red, which could be observed by the naked eye. Since H2O2 can be produced in the process of glucose oxidation by glucose oxidase (GOx), this approach can also be employed to detect glucose. By employing this sensing system, the detection limits for H2O2 and glucose are about 0.21 μM and 3.01 µM, respectively. Additionally, monitoring the content of glucose in blood serum samples was successfully achieved by the proposed strategy. This work opens a potential avenue for the quantitative detection of H2O2 and glucose in clinical diagnostics.
1. Introduction
The detection of physiologically important species plays a pivotal role in clinical diagnosis and medical research. H2O2, as a crucial biomarker, is of practical significance in chemical, biological, and clinical fields [1,2,3]. In addition, H2O2 is the final product in oxidation reactions and is catalyzed by glucose oxidase (GOx), cholesterol oxidase, and lactate oxidase, etc. [4,5]. It is essential to maintain the normal level of H2O2 for various biological processes and the assessment of human health hazards. An excess of H2O2 can induce various kinds of neurodegenerative diseases and biological damages in the human body; thus, accurate and rapid detections of H2O2 are necessary to prevent further impacts on human health. Currently, although a number of existing methods such as PtPd-Fe3O4 nanoparticles [6], boric-acid-functional [7], enzyme mimetics [8], hollow and porous Fe3C-NC nanoballoons (Fe3C-NC-NBs) [9], which are based on electrochemical approaches or fluorescence methods, have accomplished this goal, however, there are still challenges to develop neoteric techniques more adaptable to reliably detect H2O2, which do not rely upon advanced instruments and elaborately designed labels.
In recent years, nanomaterials have gained much attention in colorimetric biosensing and diagnostics on account of their unique physical or chemical properties [10,11,12,13,14,15,16,17]. Some nanomaterials such as graphene quantum dots (GQDs)/AgNPs hybrids and Pt nanoclusters [5,18] have been synthesized for the colorimetric detection of H2O2, but they generally require complex synthesis procedures or time-consuming operations. By comparison, AuNPs can be easily fabricated. It also possesses the ability to absorb ssDNA [10,19,20,21,22]. Moreover, it has a large surface-to-volume ratio and high extinction coefficient. Therefore, they have attracted extensive attention in colorimetric biosensors and diagnostics. In the past decades, a variety of AuNPs-based colorimetric assays for H2O2 has been developed [23,24]. However, many of these methods lack sufficient sensitivity and simple operation. Thus, making great efforts in seeking a novel approach for H2O2 monitoring is indispensable.
CeO2, as one of the most reactive rare earth materials, possesses many attractive properties that make it highly promising for special applications in photocatalysis, conversion catalysts, three-way catalysts (TWCs), solar cells, gates for metal-oxide semiconductor devices and phosphors, and colorimetric sensors [25,26,27,28,29,30,31]. Moreover, due to a great affinity of CeO2 for H2O2, it may be considered for use in H2O2 sensing systems with high sensitivity and selectivity [32].
As previously mentioned, H2O2 is a product of glucose oxidation; thus, generally, the assays that monitor H2O2 can be utilized for glucose detection. On the other hand, blood glucose concentration is the main basis for diabetes diagnosis, and it is also the main index of the patient’s condition and degree of diabetes. For this reason, the detection of glucose is of great significance, resulting in the development of a variety of methods for the detection of glucose, such as mass spectrometry [33], electrochemistry [34,35,36], fluorescence [37,38], and colorimetric methods over the years. Among all of these methods, colorimetric methods have been investigated extensively due to their benefits such as simplicity, fast analysis speed, relatively low cost, sensitivity, and selectivity. Therefore, we developed a novel colorimetric method to detect H2O2 and glucose based on AuNPs, ssDNA, and CeO2.
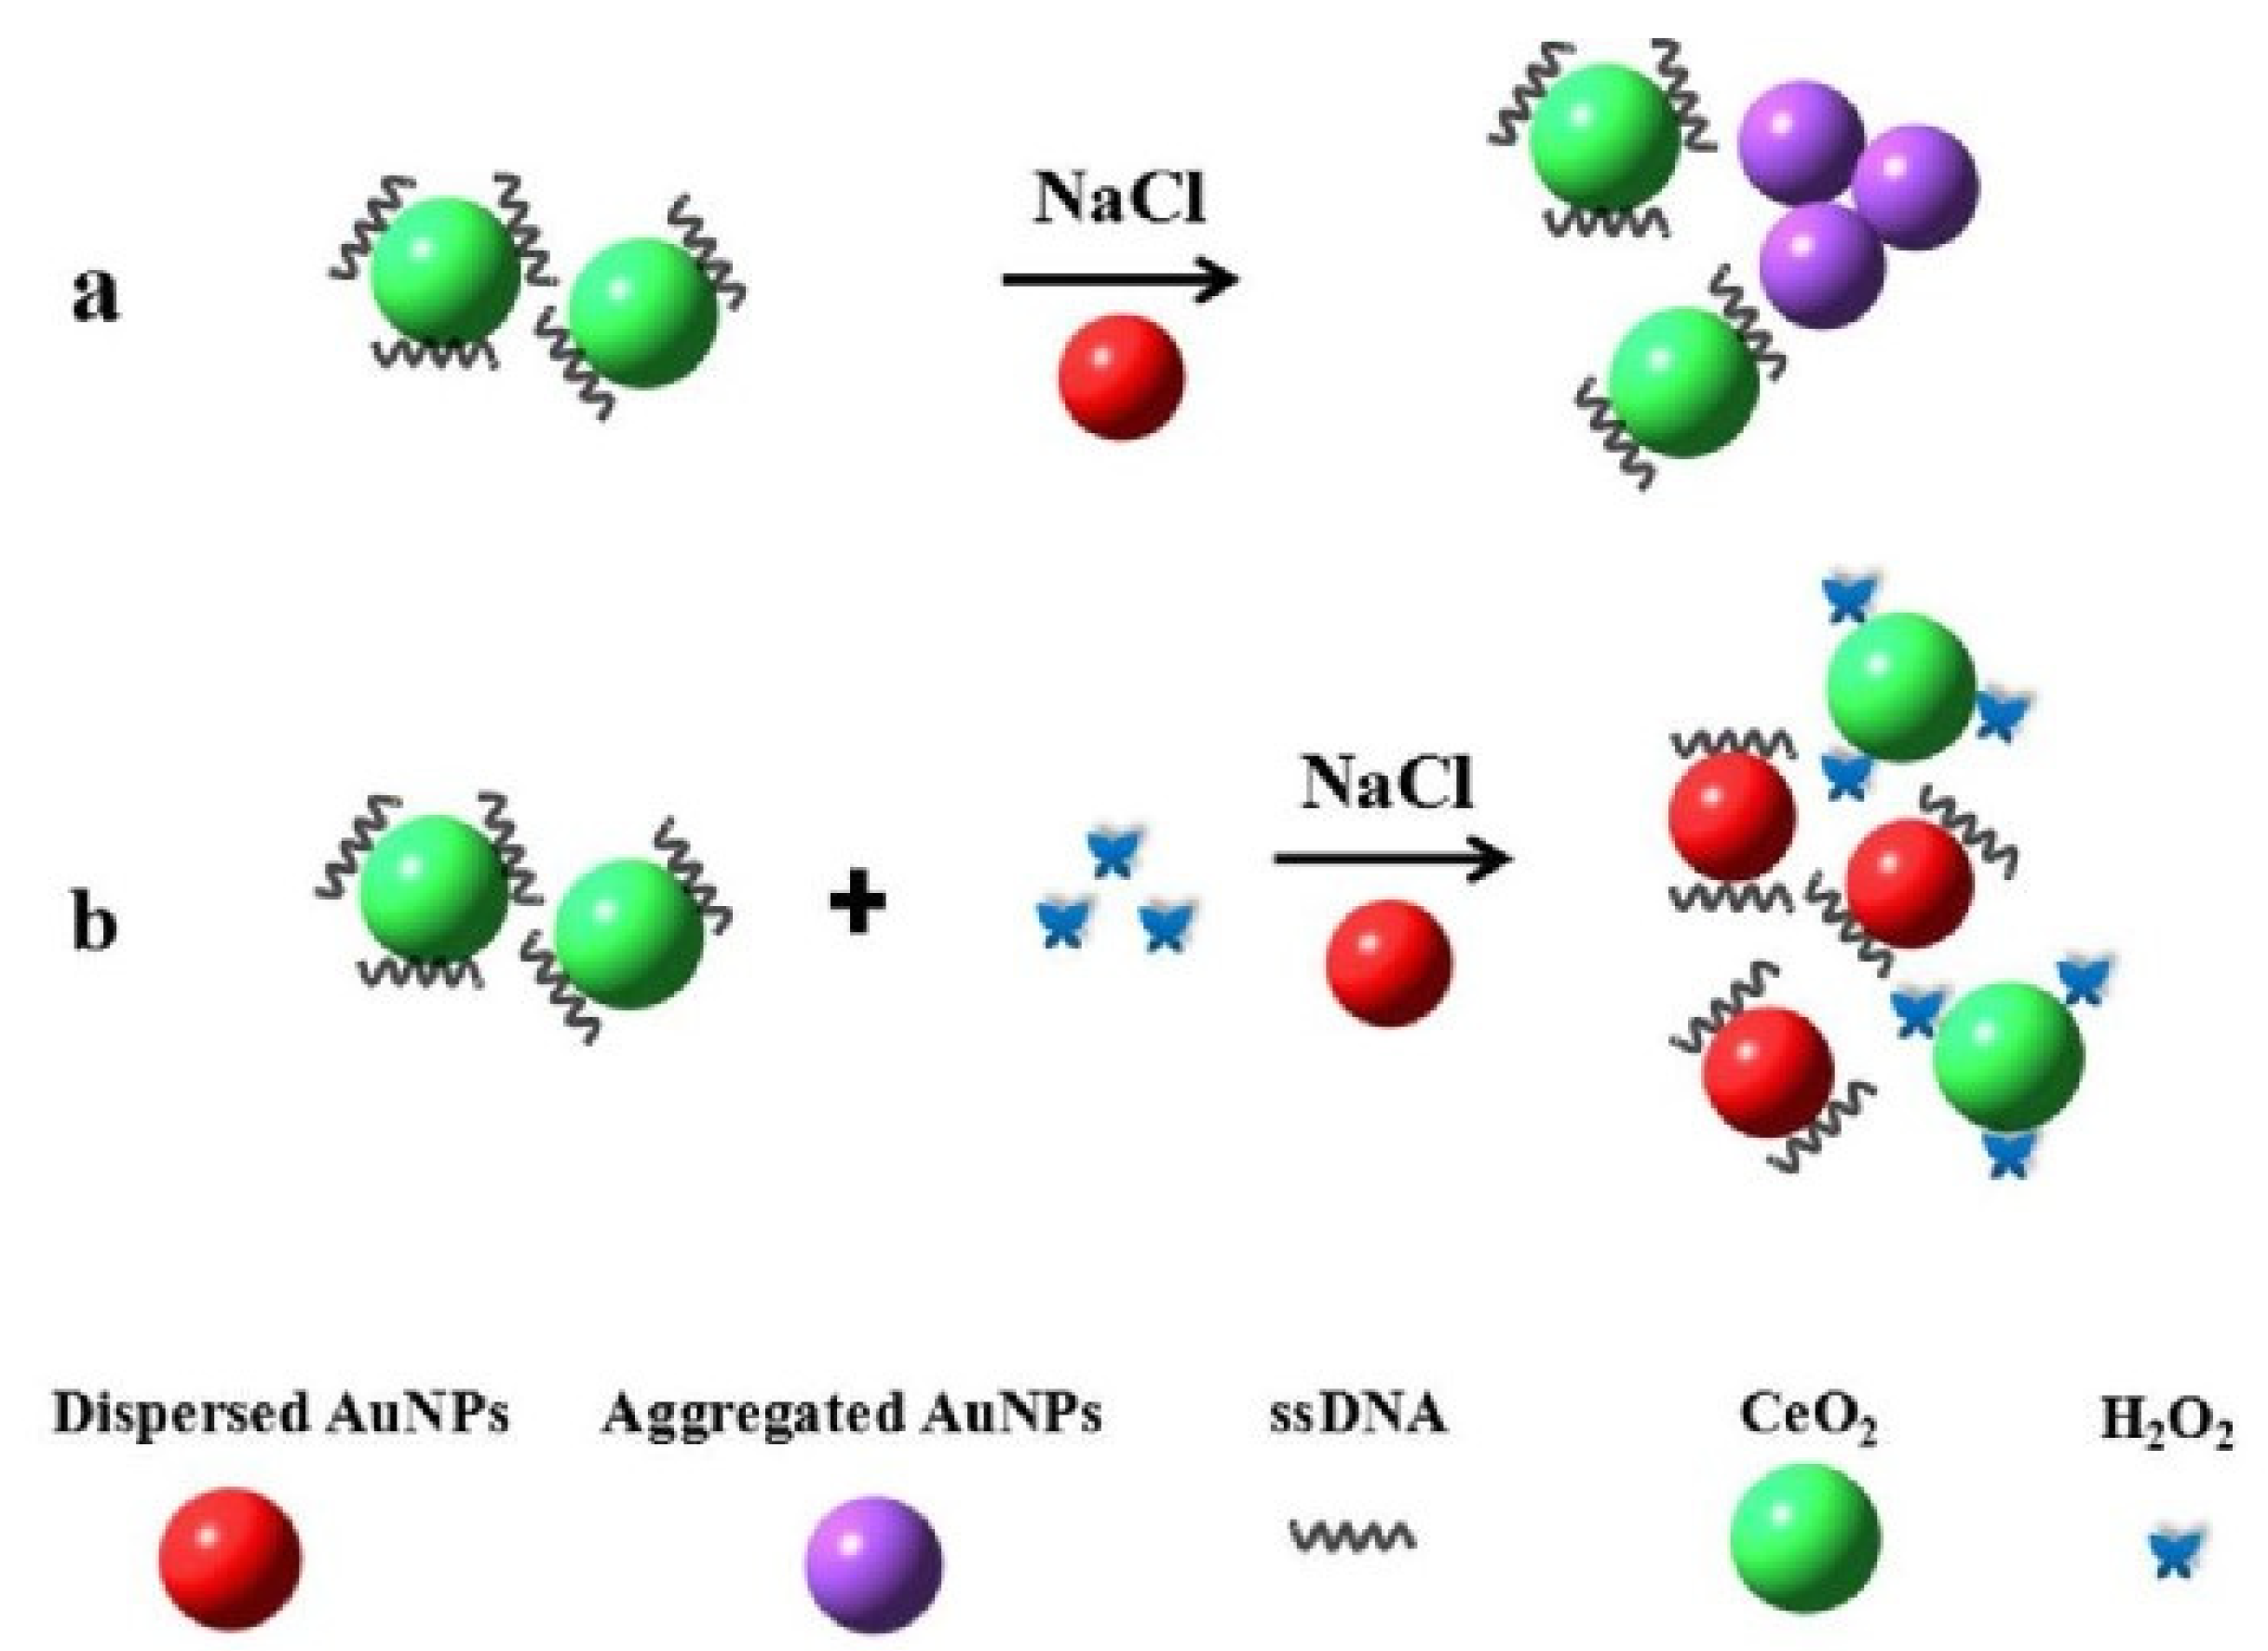
In the current study, we investigated interactions between H2O2 and CeO2, combined with ssDNA and AuNPs in a high salt solution (Scheme 1). As illustrated in Scheme 1a, initially, ssDNA adsorbs on the surface of CeO2 [32,39] when the ssDNA solution is mixed with a CeO2 solution. Thereafter, in the addition of AuNPs solution and high concentration salt solutions, the aggregation of AuNPs occurs [40] due to there being no protection of ssDNA (presenting the macroscopical purple color. Upon the introduction of target H2O2, it induces ssDNA desorption from CeO2 and binds to the surface of AuNPs, resulting in disaggregation and color change [24,41]. Hence ssDNA-decorated AuNPs can be finely dispersed (Scheme 1b), corresponding to the red color solution. When adding GOx, it is possible to monitor glucose even in blood serum samples. Thus, H2O2 and glucose can be easily detected using the colorimetric method via the observation of remarkable color change, and their detection limits can reach 0.21 μM and 3.01 μM, respectively. Due to the use of biocompatible AuNPs and nonpolluting CeO2, the proposed strategy is relatively environmentally friendly. Moreover, it highlights a very promising strategy for the design of a new cost-effective and label-free family of H2O2 and glucose colorimetric sensors.
2. Materials and Methods
2.1. Materials
Chloroauric acid hydrated (HAuCl4·3H2O) was obtained from Sahn chemical technology (Shanghai, China) Co., Ltd. of China. Carboxyfluorescein (FAM)-labeled ssDNA (5′ to 3′ FAM-AGAAAAAACTTCGTGC) and ssDNAs with a random sequence (CAG GAT CAT GGT GAT GCT CTA CG) were purchased from Sangon Biotech Co., Ltd., Shanghai, China. 4-(2-hydroxyethyl)-piperazine-1-ethane sulfonic acid (HEPES, pH = 7.0) was purchased from Shanghai Yuanye Biotechnology Co., Ltd. Shanghai, China. GOx (≥155,000 units/g, aspergillus niger) was supplied by Sigma-Aldrich. Glucose, CeO2 nanoparticle suspension (conveniently shorted to CeO2, particle size 10~20 nm), fructose, ascorbic acid, dopamine, cysteine, alanine, galactose, and sucrose were commercially available from J&K Scientific Co., Ltd., China. Hydrogen peroxide (H2O2, ≥30.0%), KCl, ZnCl2, NaCl (≥99.5%), and trisodium citrate (≥99.0%) were procured from Sinopharm Chemical Reagent Co., Ltd., Beijing, China. All chemicals were used without further purification. Ultrapure water was used in experiments. ssDNA, FAM-labeled ssDNA, and GOx were diluted in HEPES buffer, respectively. The other chemicals were dissolved in water.
2.2. Instruments
UV-vis absorption spectra of samples were measured by a Cary-5000 UV-vis spectrometer (Agilent) in a quartz cell (light path of 5 mm). The water signal, as the background signal, was taken away from the sample signal. Transmission electron microscopy (TEM) images were obtained by an HT-7700 instrument. The accelerating voltage was 120 kV. The particle size distribution diagram was obtained by Laser Particle Size and a Zeta Potential Analyzer. A FluoroMax-4 fluorescence spectrophotometer was used to determine the fluorescence spectra of samples. Under the condition of excitation at 490 nm with an Xe lamp, the fluorescence signals were recorded in the range of 505~640 nm. Slits for both excitation and emission measurements were 1.2 nm.
2.3. Preparation Procedures of AuNPs
AuNPs were fabricated by using trisodium citrate reductions in HAuCl4, following the procedures reported earlier [42,43,44]:
- (1)
- Ultrapure water (98 mL) and 50 mM HAuCl4 (2 mL) were mixed in a three-neck flask and then heated to boil under stirring.
- (2)
- An amount of 38.8 mM trisodium citrate (10 mL) was transferred into the above flask rapidly. The mixture was heated in the condition of reflux with vigorous stirring for 15 min. During this process, the color of the solution changed from pale yellow to deep red gradually, which indicates the formation of AuNPs.
- (3)
- Centrifuge the solution for 15 min at a speed of 8000 r/min. The as-prepared AuNPs were redispersed with ultrapure water and stored at 4 °C for later use.
2.4. Detection Assays of H2O2 and Glucose
The process for H2O2 detection was carried out as described below: ssDNA (200 μL, 1 μM) was firstly mixed with CeO2 (200 μL, 200 mg/mL). Then, 200 μL of H2O2 solution (0.1, 1 × 10⁻³, 1 × 10⁻⁴, 1 × 10⁻⁶, 1 × 10⁻⁷ and 1 × 10⁻⁸ M) was introduced to the above-mentioned mixture. After that, AuNPs (200 μL, 17 nM) were slowly added in 1 min, followed by introducing NaCl (200 μL, 0.2 M) over the course of 1 min at room temperature. The absorption spectra ranging from 350 to 700 nm was measured by a spectrophotometer.
For the detection of glucose, the details were as followed: 100 μL of glucose solution with various concentrations (5, 0.5, 0.1, 0.05, 0.01, and 0.001 mM) was separately cultivated with GOx (100 μL, 0.05 mg/mL) at 37 °C for 40 min, which was subsequently introduced into the mixture of ssDNA and CeO2. Then, AuNPs (200 μL, 17 nM) and NaCl (200 μL, 0.2 M) solutions were successively added to the above solution. Finally, the resulting mixture was applied to spectroscopic measurements. In addition, 0.01 mM glucose was replaced by sucrose, galactose, and fructose with the same concentration to verify the specificity of this strategy.
2.5. Detection of Glucose in Diluted Serum Samples
The blood samples, collected from healthy adults (provided by a local hospital), were firstly centrifuged at 8000 r/min for 10 min to remove large aggregates and then diluted 500 times with HEPES buffer (pH = 7, 10 mM) without any other treatment before further experiments. HEPES (pKa at 20 °C: 7.45–7.65) is a zwitterionic, piperazinic buffer that is useful for a pH range of 6.8–8.2. In order to detect the content of glucose in diluted serum samples, the standard addition method was used [45]. Firstly, diluted serum (10 μL) and glucose solution (10 μL) with different concentrations were added into HEPES (80 μL) buffer. Then, the samples were utilized to detect glucose according to the same steps as mentioned above.
3. Results and Discussion
3.1. Characterizations of AuNPs and CeO2
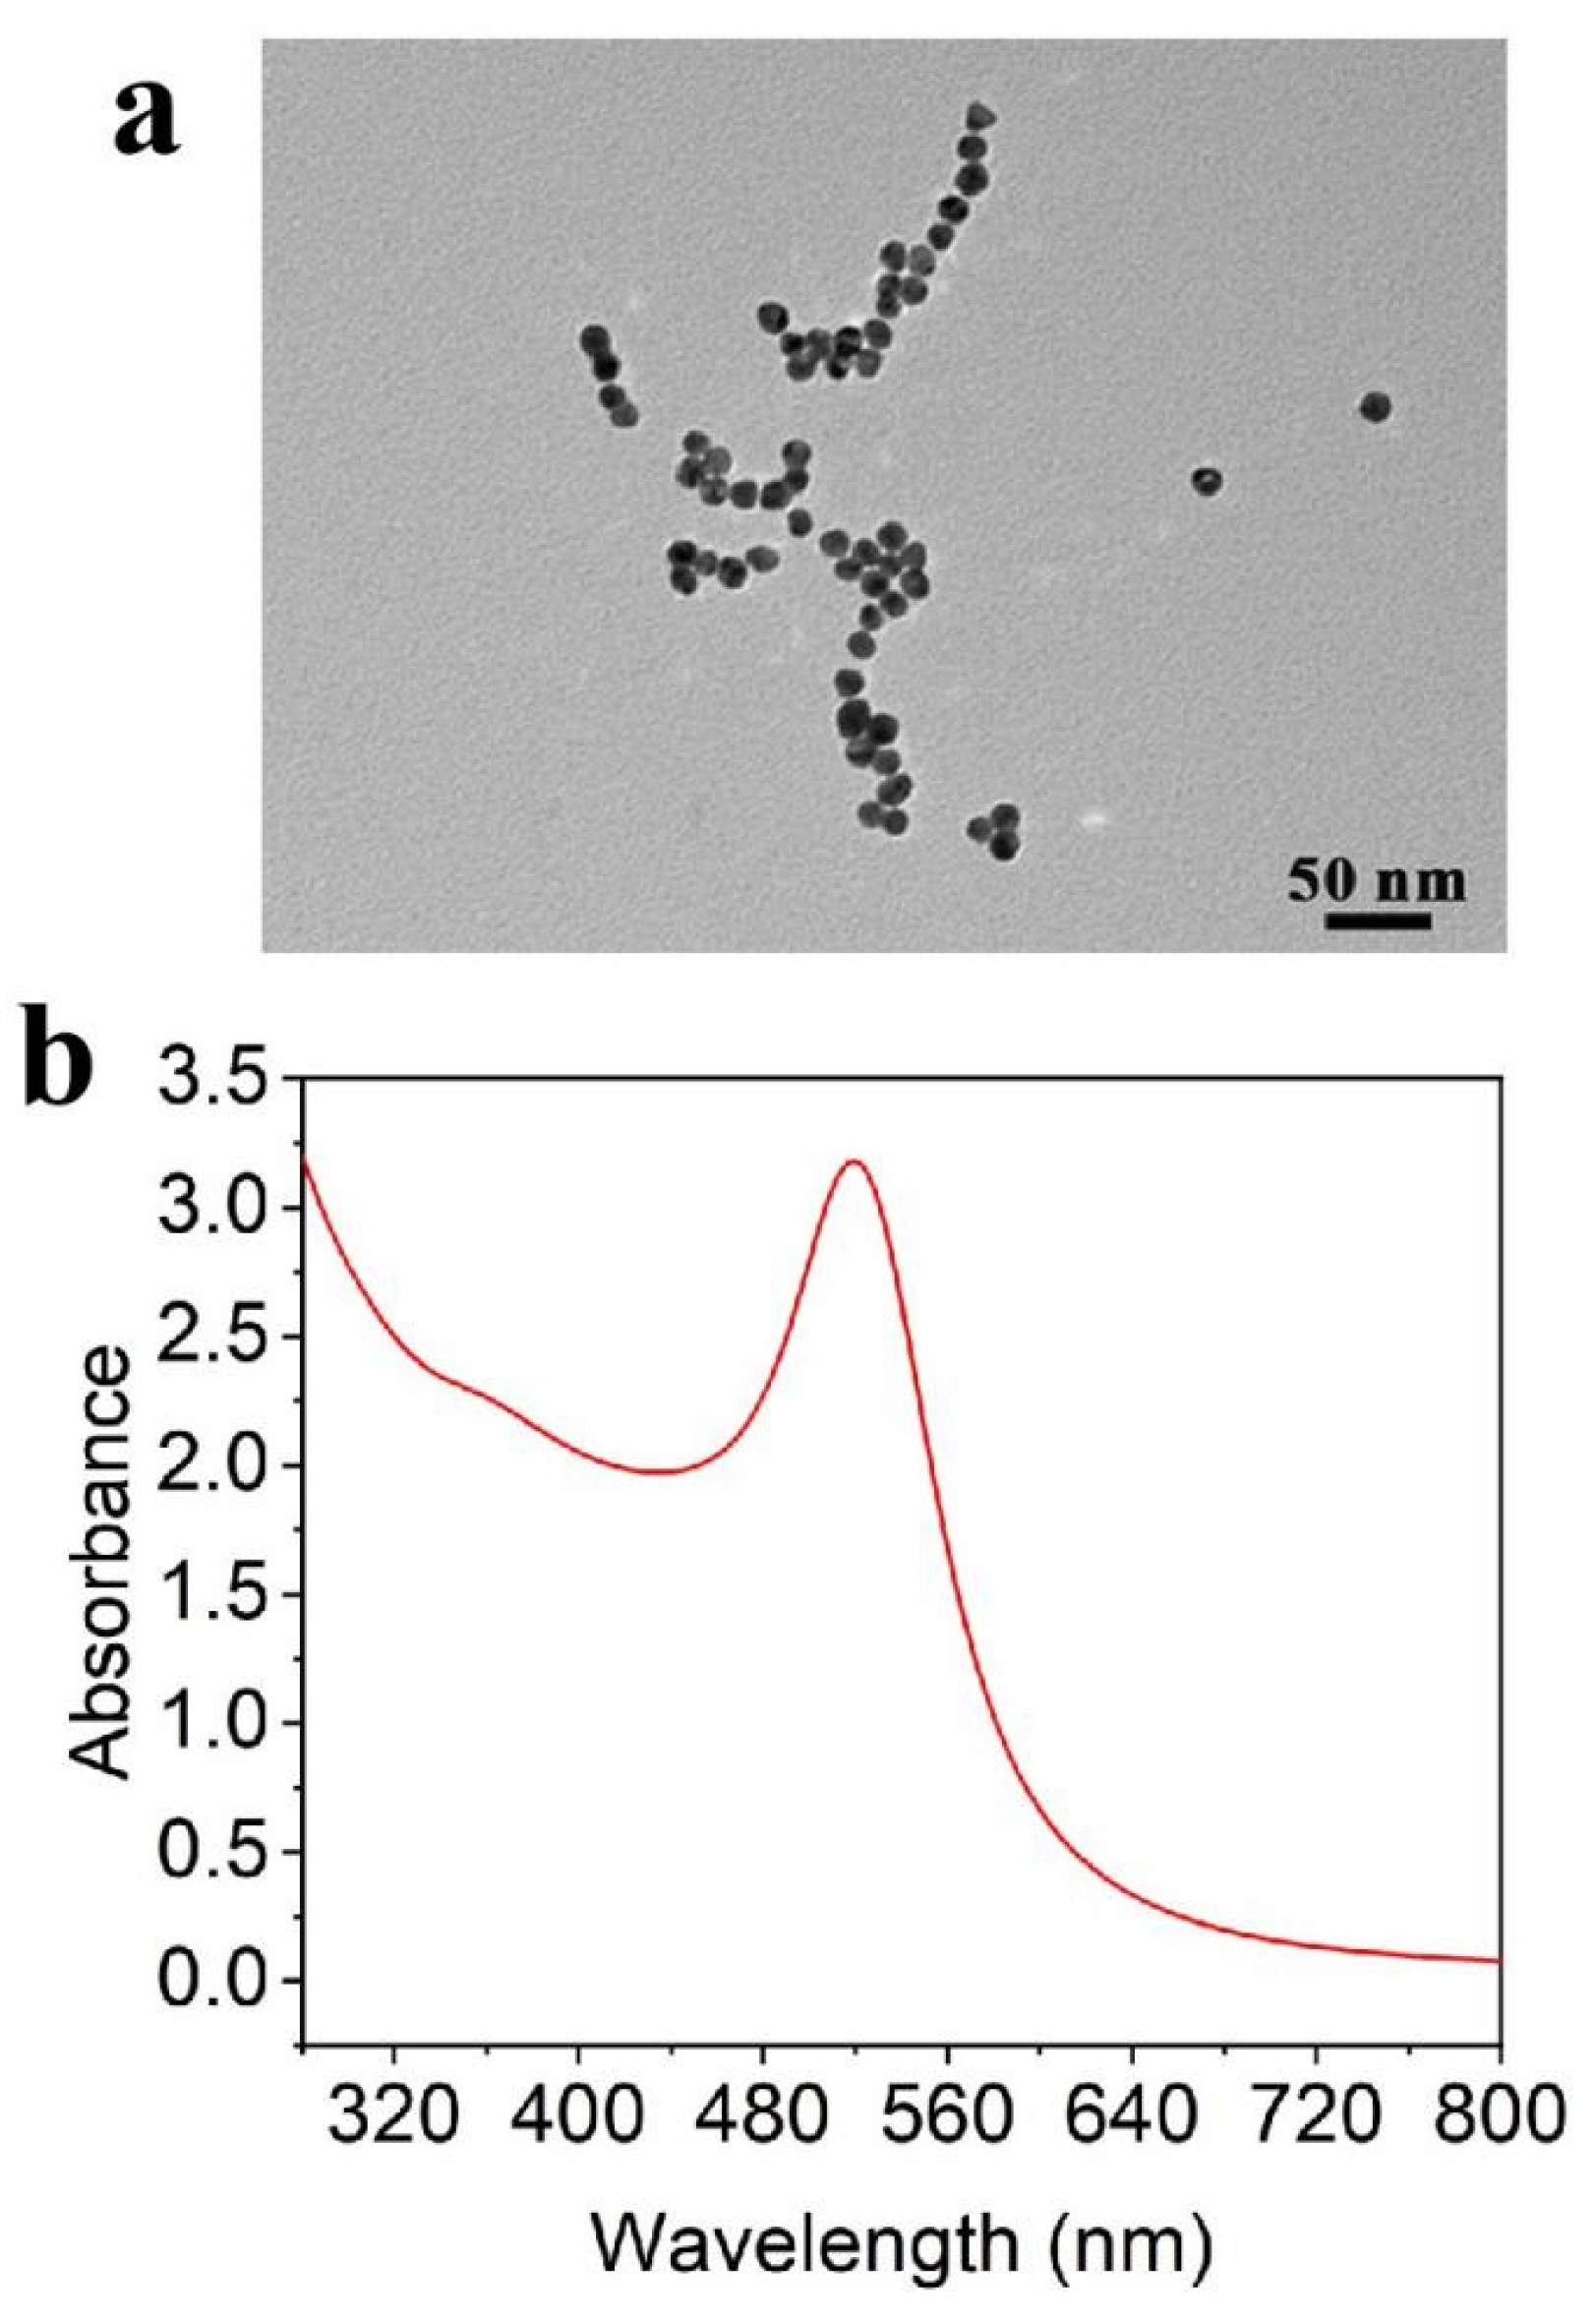
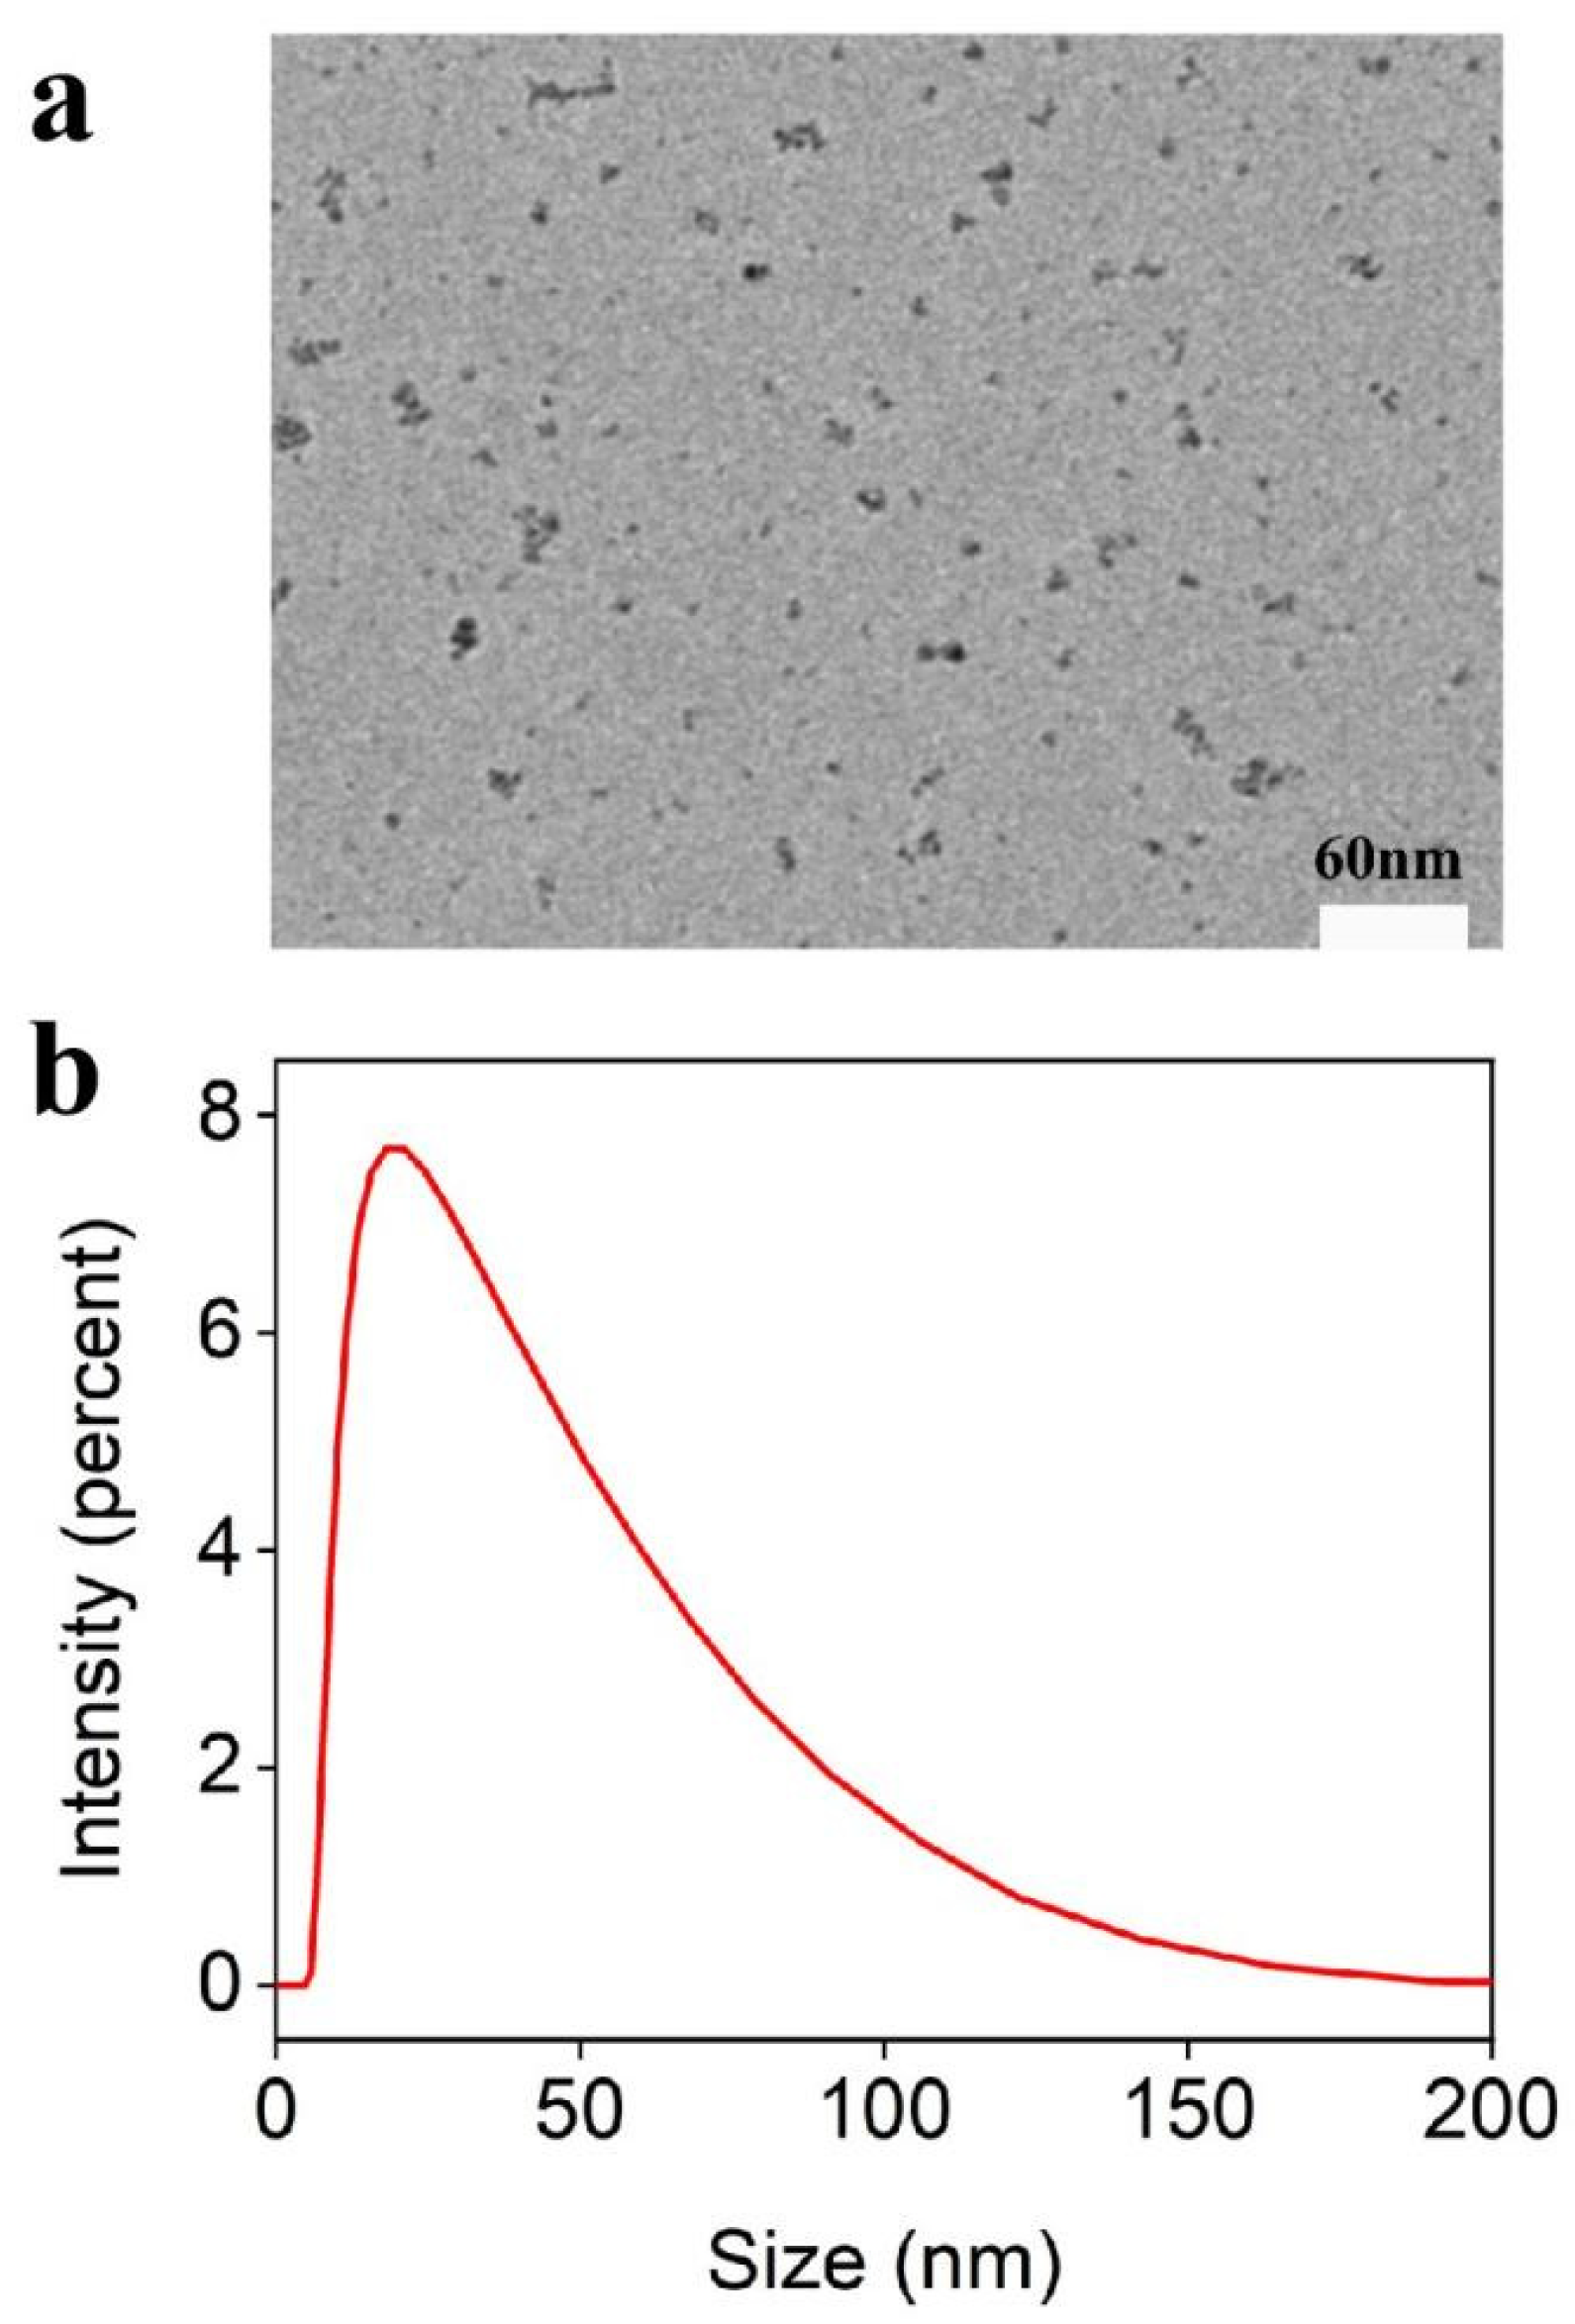
AuNPs fabricated by the trisodium citrate reaction method have an average diameter of ~13 nm [42] (Figure 1a) and their solution displayed a distinct wine-red color with a distinctive absorption peak at approximately 523 nm (Figure 1b). Therefore, the concentration of the AuNPs solution was evaluated to be about 17 nM according to the Lambert–Beer law with an extinction coefficient of 2.78 × 10⁸ M−1·cm−1 for 13 nm AuNPs [46]. Some information on the size and morphology of CeO2 can be obtained from Figure 2. TEM images indicate that CeO2 was dispersed relatively well (Figure 2a). The size distribution determined by DLS illustrates that the average diameter of CeO2 is ~20 nm (Figure 2b).
3.2. Mechanism of the Visual Assay for H2O2
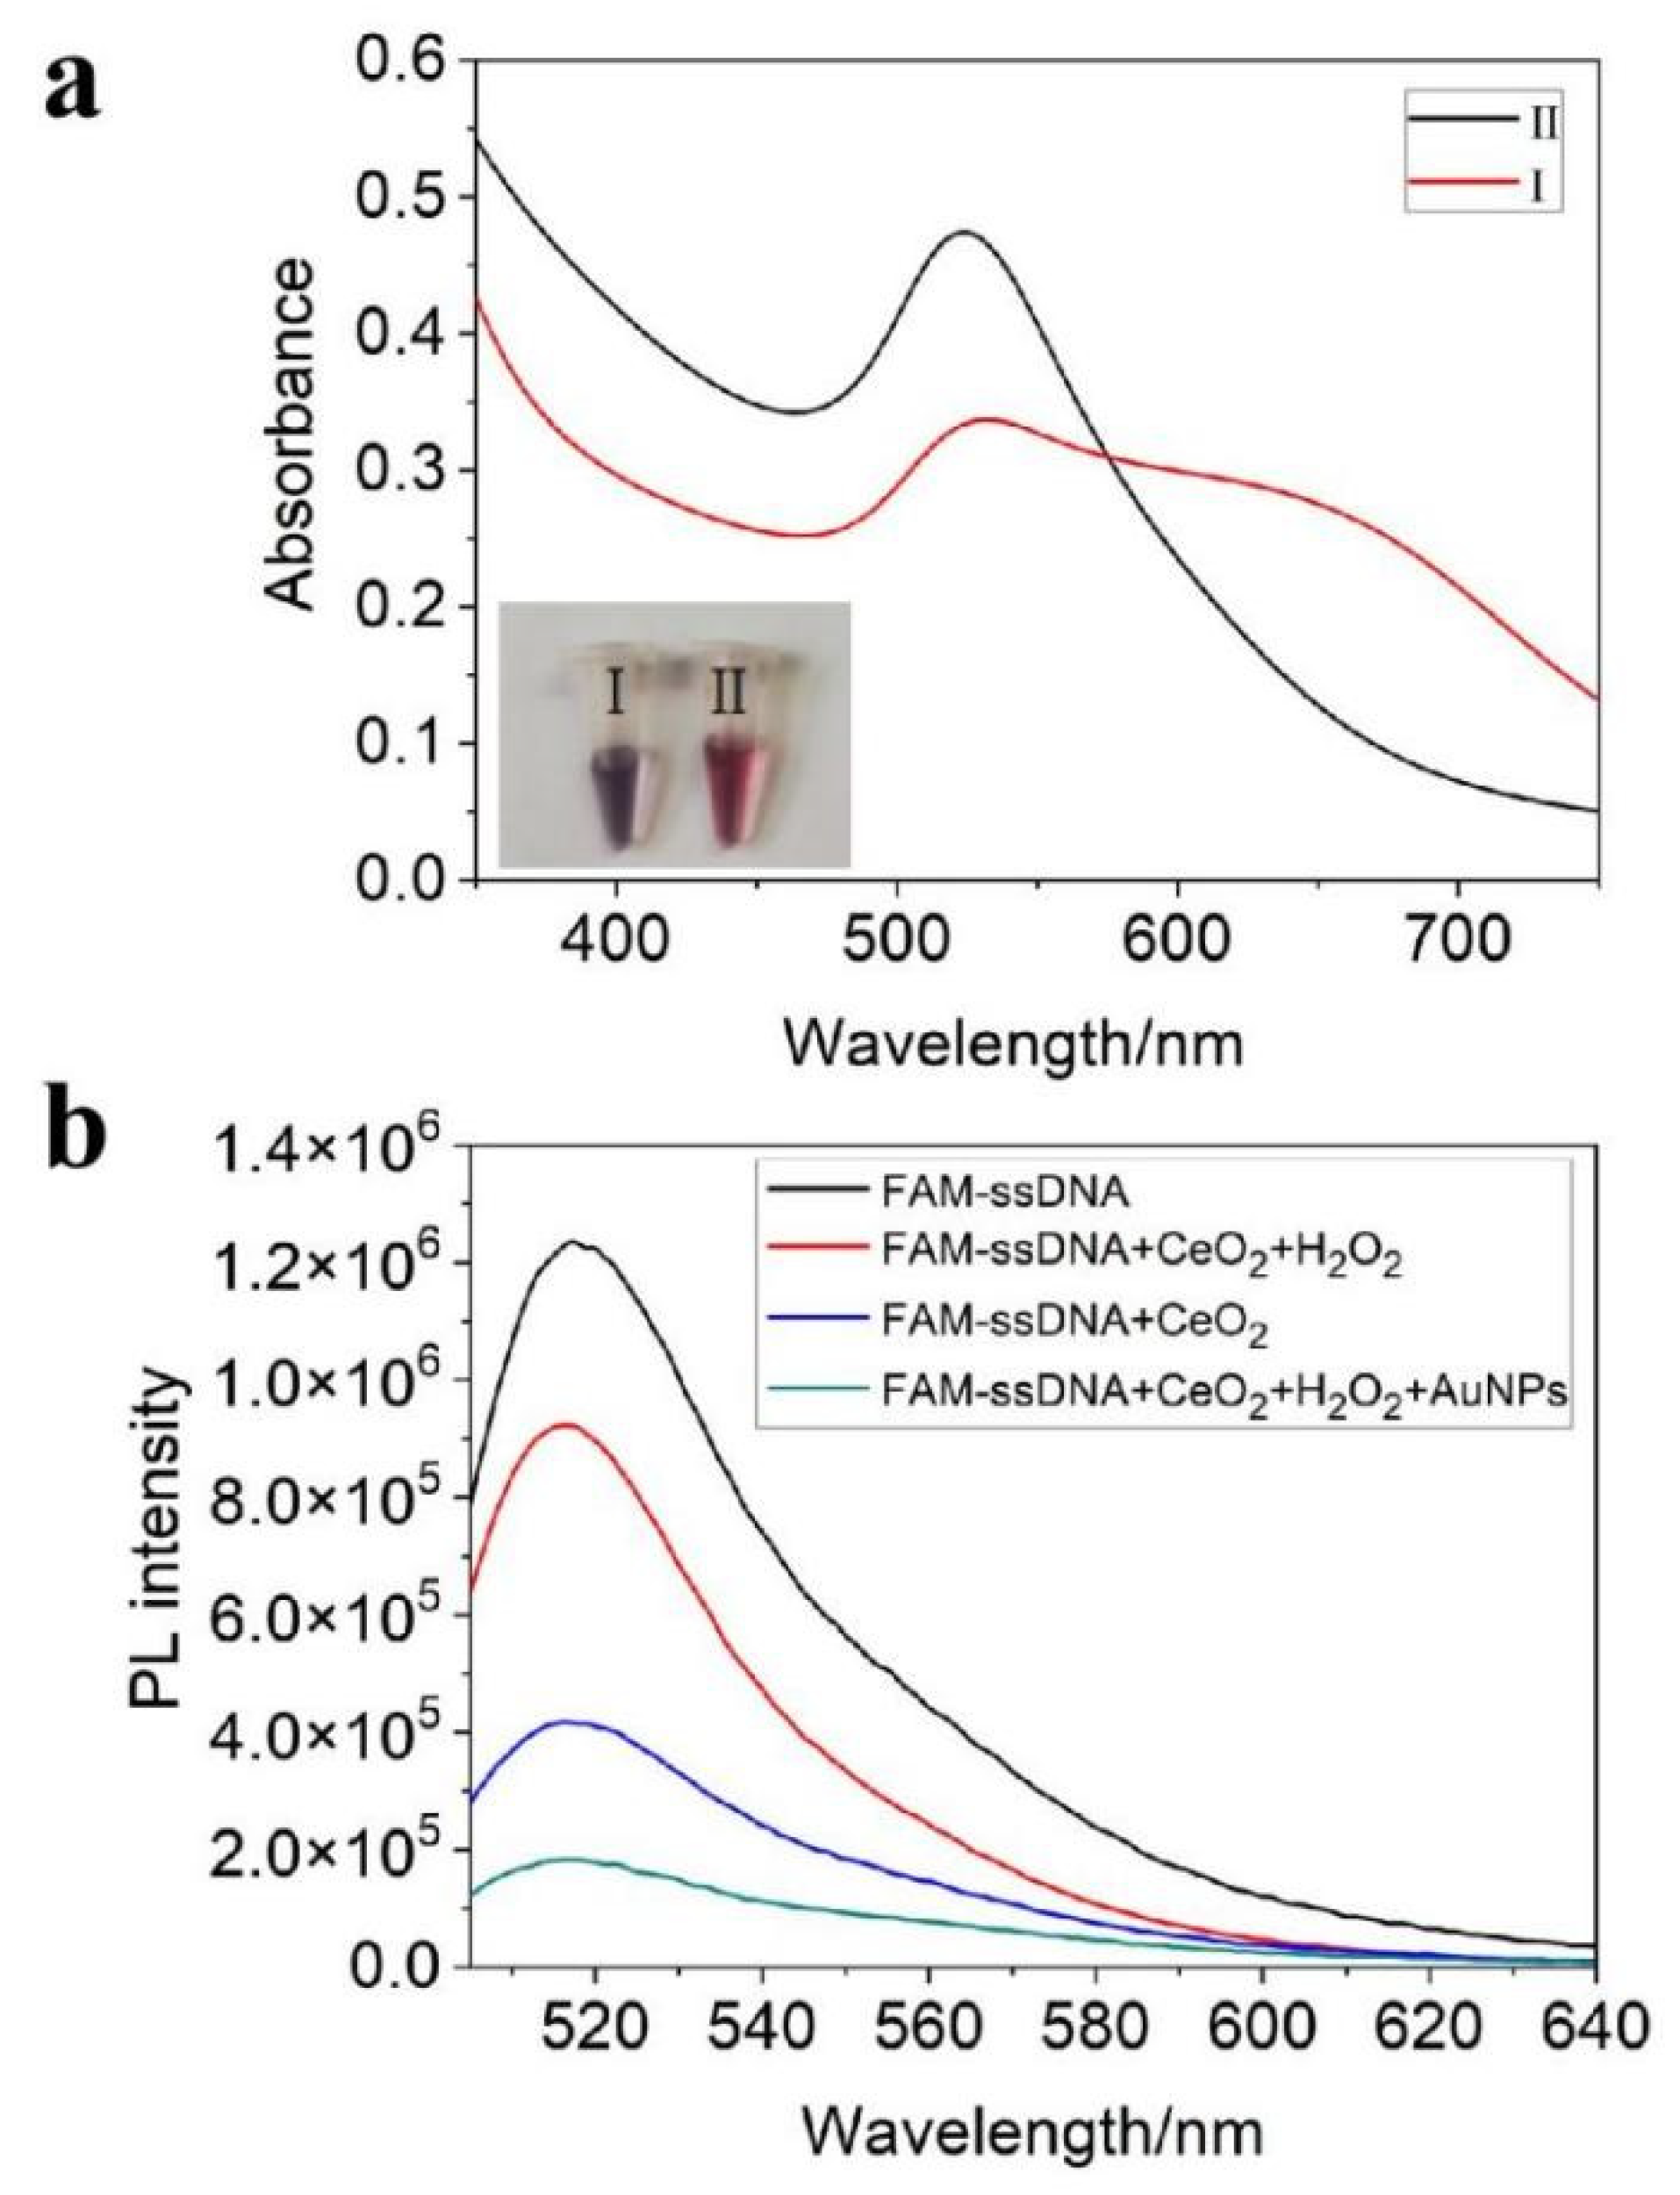
In ordre to investigate the feasibility of the visual method for H2O2 sensing, AuNPs were used as a colorimetric substrate because of their low cost, nontoxicity, and ease of unaided visual detection. As observed from Figure 3a(I), the intensity of absorbance spectrum of the (ssDNA + CeO2 + AuNPs + NaCl) system at about 523 nm is clearly reduced, and a new peak emerges at around 625 nm. While adding H2O2, there only exists a strong absorption peak at 523 nm (Figure 3a(II)). Concomitantly, the color of the mixed solution changes from purple to red in the case of H2O2 (Figure 3a). Thus, in the presence of H2O2 and high concentration salt solution, the adsorption of ssDNA on the surface of AuNPs will cause good dispersion of AuNPs along with red color solution. These data demonstrate the possibility of using (ssDNA + CeO2) to directly detect H2O2 using AuNPs in high concentration salt solutions.
To elucidate the mechanism of this sensing system for H2O2, FAM-labeled ssDNA was employed to determine the fluorescence spectrum. As shown in Figure 3b, it exhibits a distinct emission peak at ~520 nm. Furthermore, the fluorescence of FAM-ssDNA was quenched obviously upon the introduction of CeO2, which may be due to adsorption of FAM-ssDNA. Significant fluorescence recovery was observed after adding H2O2. Since it was demonstrated by a previous study that H2O2 binds to CeO2 more strongly than FAM-ssDNA [32], we speculate that, in the presence of H2O2, FAM-ssDNA is desorbed from the surface of CeO2 and released to the aqueous solution. Interestingly, when adding AuNPs into the mixed solution mentioned above, fluorescence quenching occurred immediately as a result of FAM-ssDNA adsorption on the surface of AuNPs [47].
3.3. Optimal Doses of ssDNA and CeO2 for the Assay
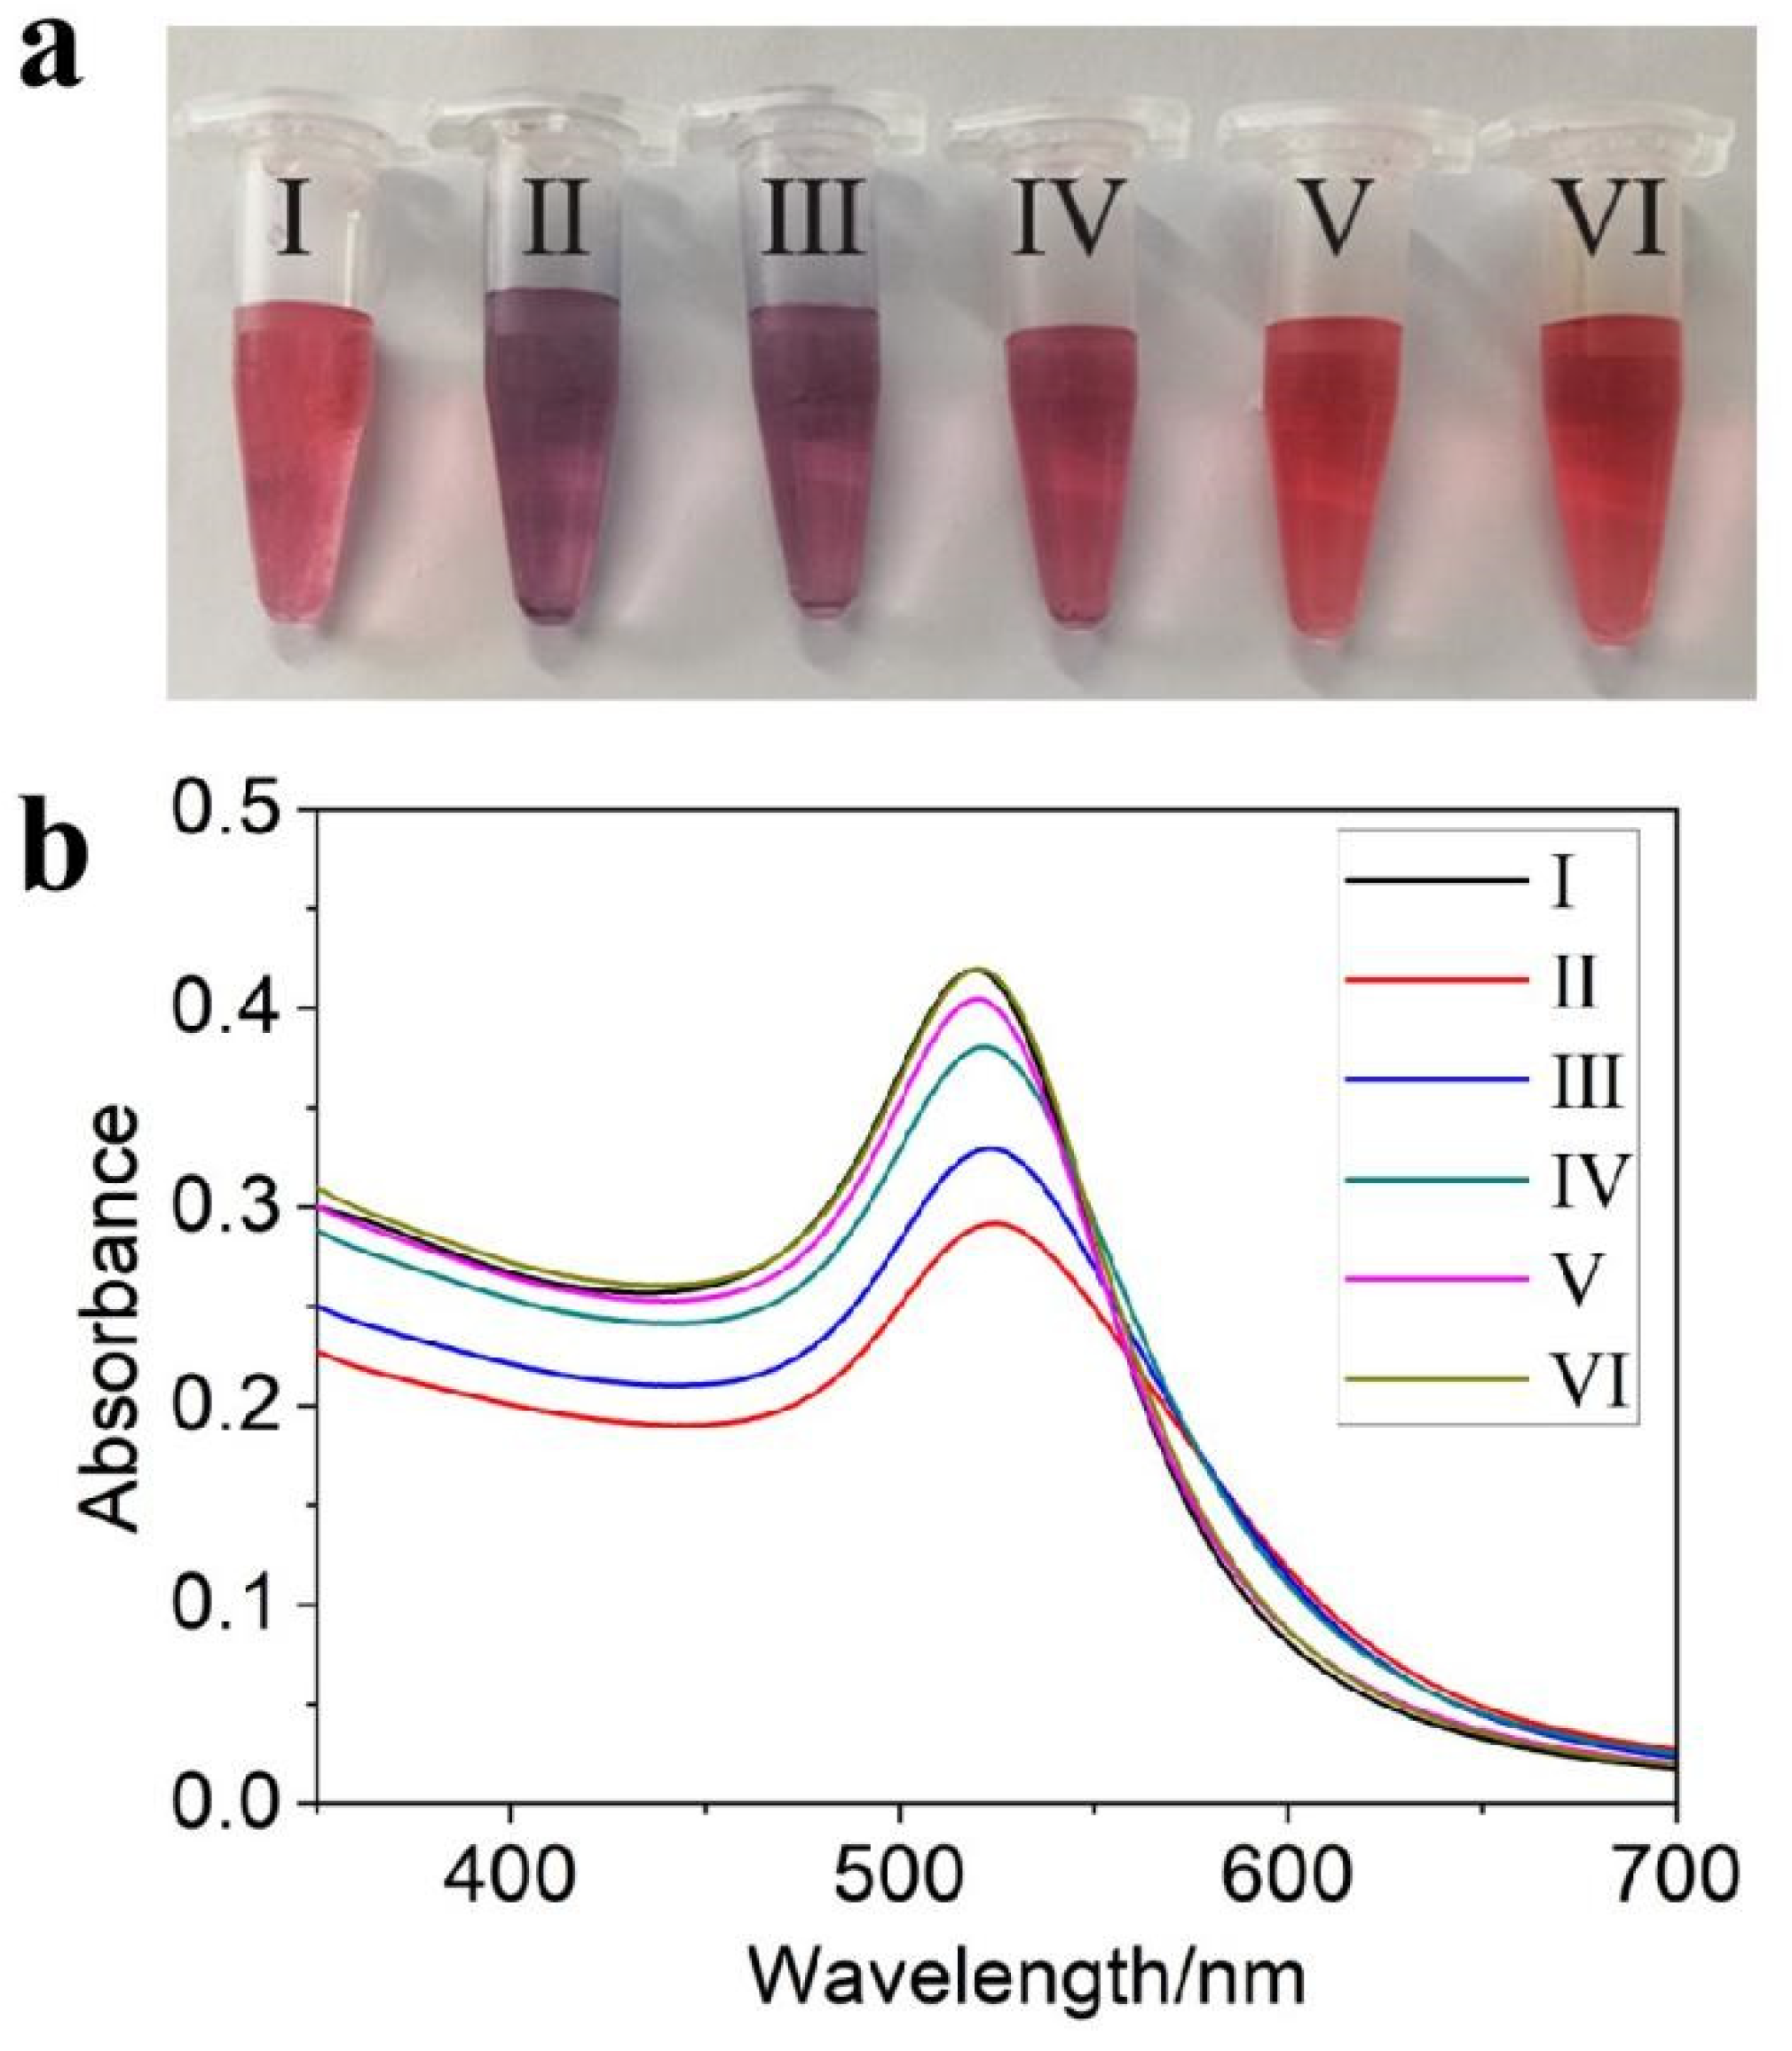
Previous studies have proven that AuNPs decorated with ssDNA can be finely dispersed when 0.2 M NaCl is introduced [20]. It is necessary to investigate the optimum concentration of ssDNA solution required to be adsorbed on the surface of AuNPs in NaCl aqueous solution. In Figure 4a,b, the stability of AuNPs was investigated over ssDNA concentration gradient within the range of 0.2~1.0 µM in the presence of 17 nM AuNPs and 0.2 M NaCl. With the increasing concentration of ssDNA, a visual color of mixed solution changed from purple to red (Figure 4a) and a descent in the UV-vis absorption intensity at 523 nm were observed. When the concentration of ssDNA increased to 1.0 µM, the color and UV-vis spectrum of the mixed solution were almost similar to those of the AuNP solutions. Thus, 1.0 µM of ssDNA was employed to carry out the subsequent experiments.
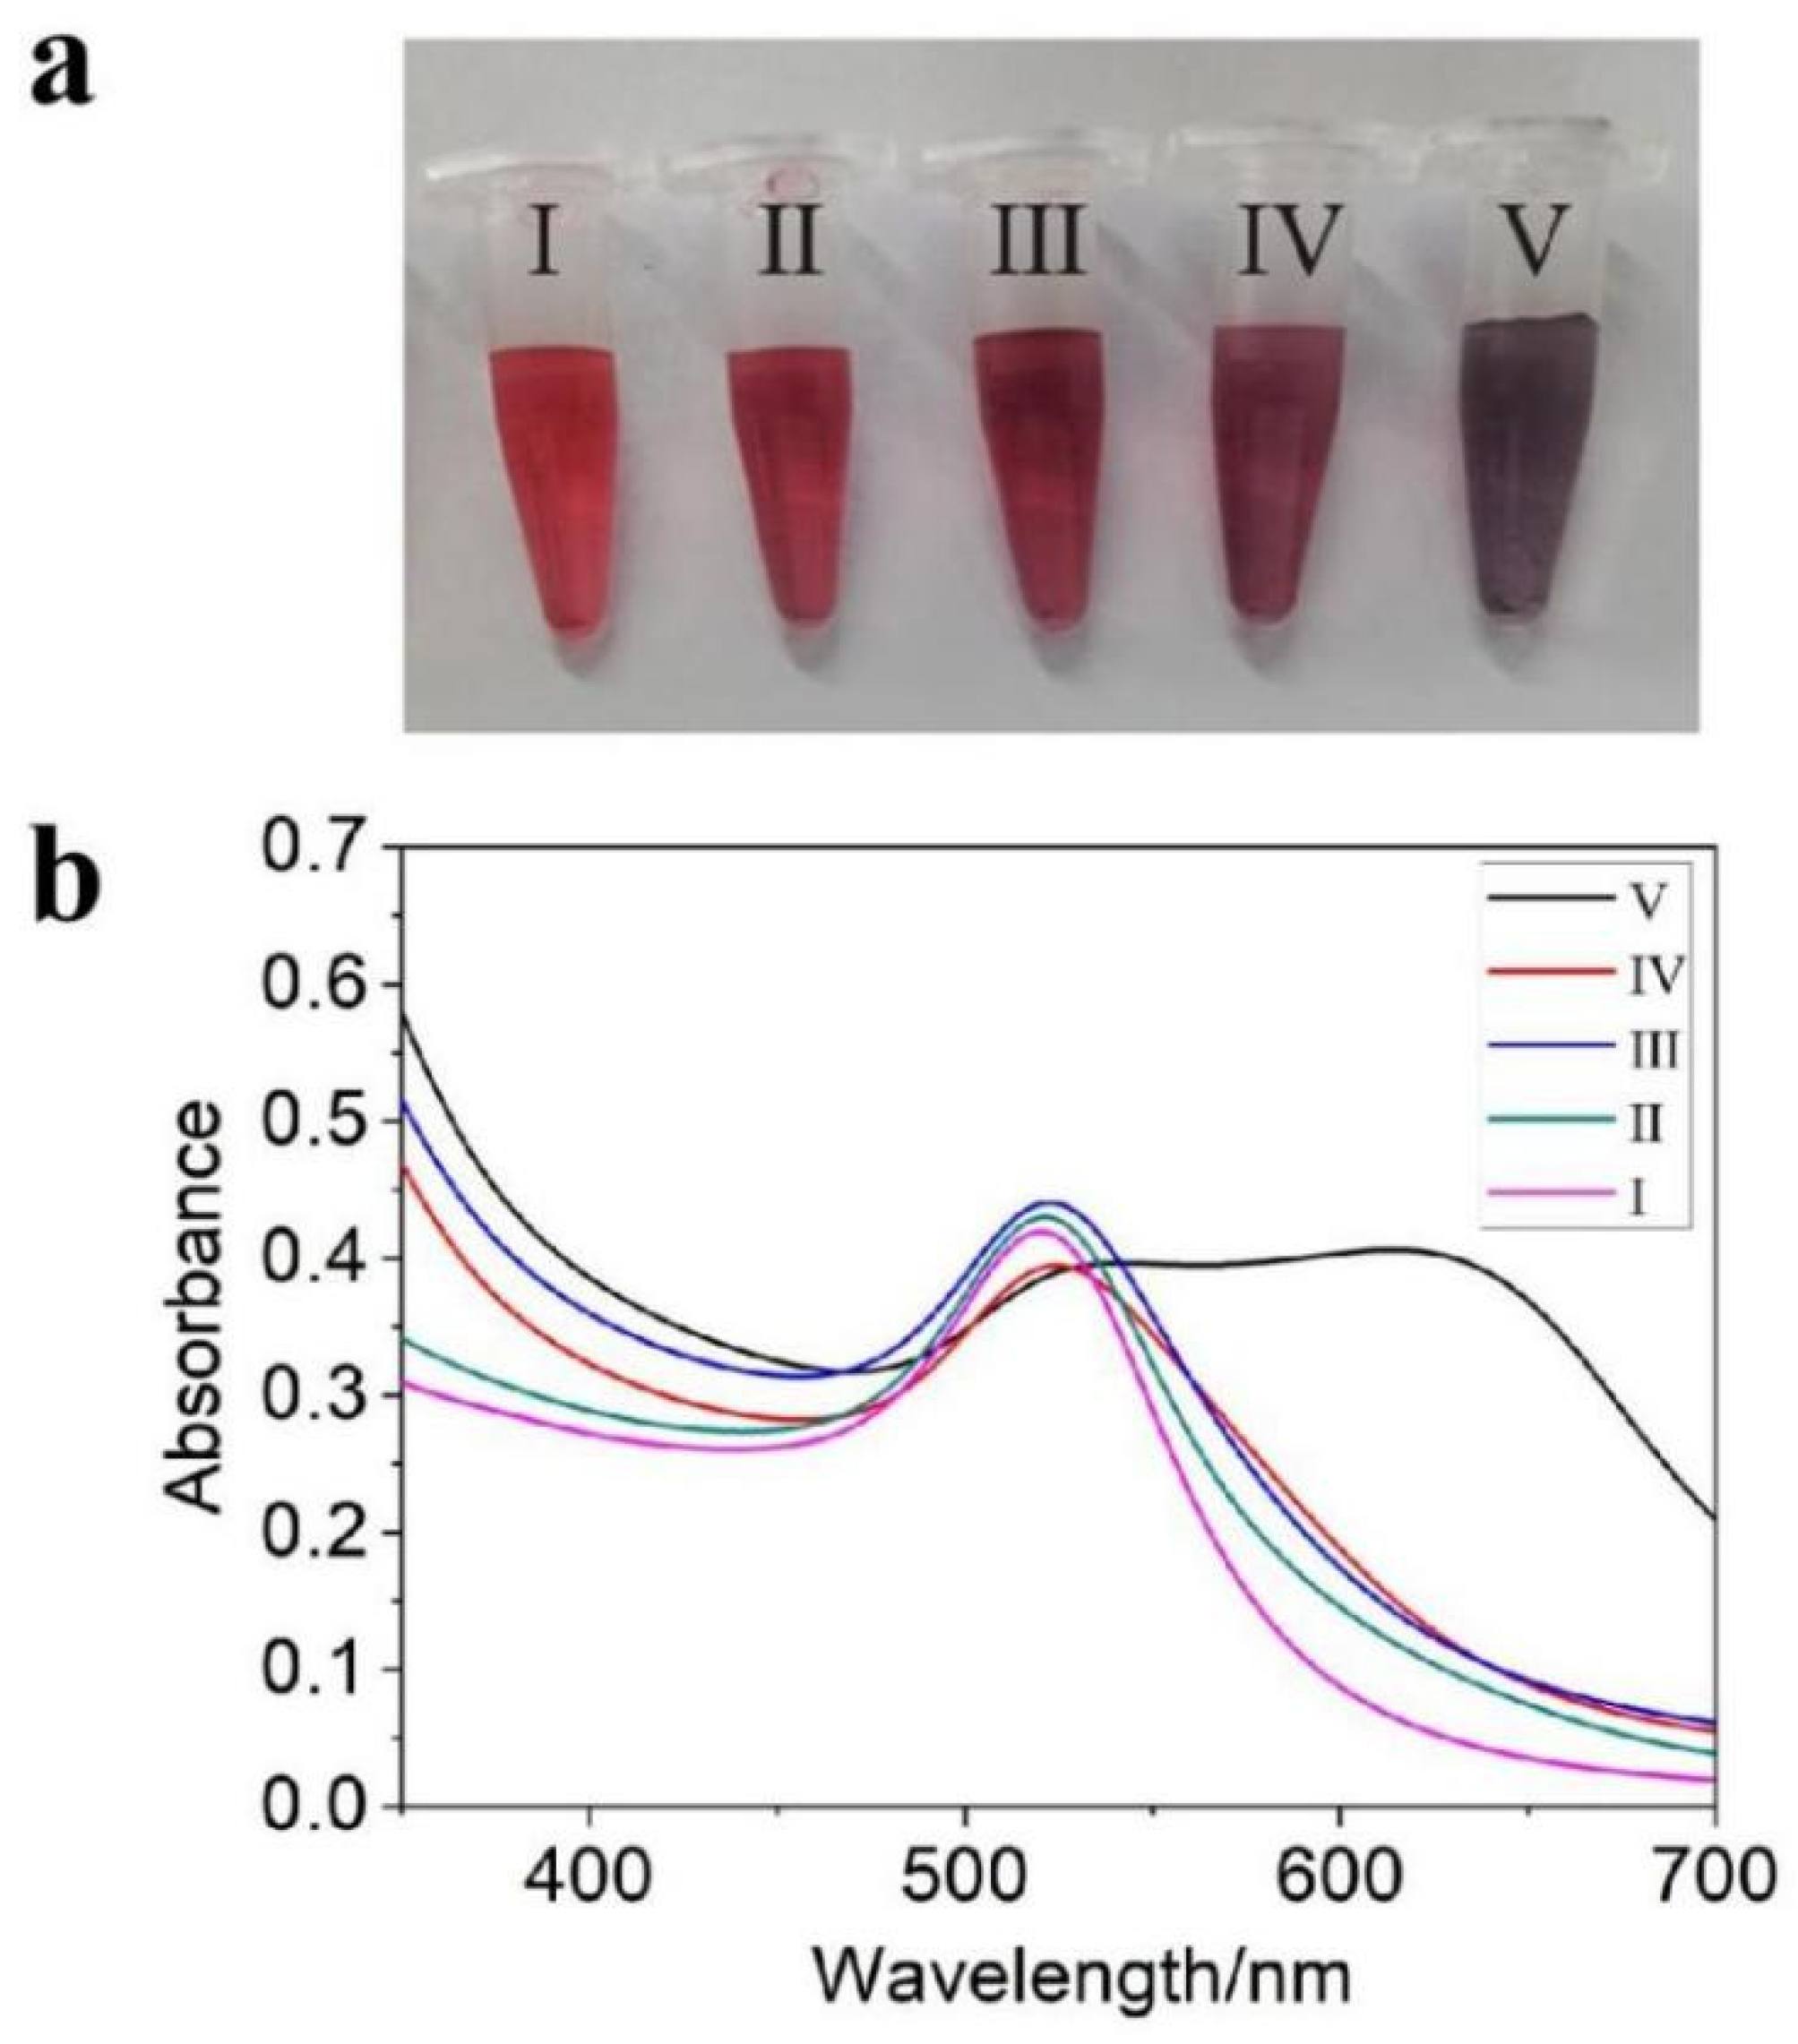
The effect of (ssDNA + CeO2) on the existence state of AuNPs in 0.2 M NaCl solution was explored in the concentration range of 50~200 μg/mL CeO2. As shown in Figure 5a, when the concentration of CeO2 increased to 200 μg/mL, the color of mixed solution transformed from red to purple. As observed in Figure 5b, compared to the absorption spectra of a relatively low concentration of CeO2, for 200 μg/mL CeO2, a new peak emerges at around 625 nm. These results suggest that AuNPs aggregation could occur in (ssDNA + CeO2 + NaCl) system as CeO2 was modified by ssDNA due to the coordination interaction between the ssDNA backbone and CeO2 [48]. Based on this, 1.0 μM ssDNA and 0.2 M NaCl with a fixed concentration of CeO2 (namely 200 μg/mL) can be utilized for the following experiments.
3.4. Colorimetric Detection of H2O2 and Glucose Using the Assay
According to the above results, we proposed a label-free and colorimetric method to monitor H2O2. In the presence of different concentrations of H2O2, the concentration-dependent color changes and the corresponding absorption spectra are exhibited in Figure 6a,b, respectively. The visual color of solutions undergoes a red-to-purple transformation, accompanied by an increased absorption at 523 nm (A523) and a decreased absorption at 625 nm (A625) with increasing concentrations of H2O2. Additionally, as observed from Figure 6c, the ratio of A625/A523 shows a linear relationship (the linear relationship is Y = 0.3242 − 0.0538X, correlation coefficient of R2 = 0.991) within the H2O2 concentration range of 1 × 10⁻⁸~0.1 M. The limit of detection (LOD) of H2O2 was calculated, using standard methods (LOD = 3 S/slope), to be 0.21 μΜ. S is the standard deviation of the blank sample. The slope was obtained from the standard curve (Figure 6c). As illustrated in Table 1, the linear range of our strategy for H2O2 detection is wider than that of the current methods. Moreover, the correlation coefficient of the linear equation for this method is higher than that of some reported approaches. Moreover, the sensitivity of our strategy is better than most of the current methods (Table 1). Although the LODs of nanostructured polysaccharide (cellulose nanowhiskers) CNW-AgNPs film [49], GQDs-AgNPs film [50], and Eu-MOF film [35] are lower than this work, there exist some aspects to improve. For example, the synthesis procedures of CNW and Eu-MOF are complex and the GQDs-AgNPs film contains AgNPs, which has higher biological toxicity. Therefore, the strategy proposed in this work has some obvious advantages to detect H2O2.
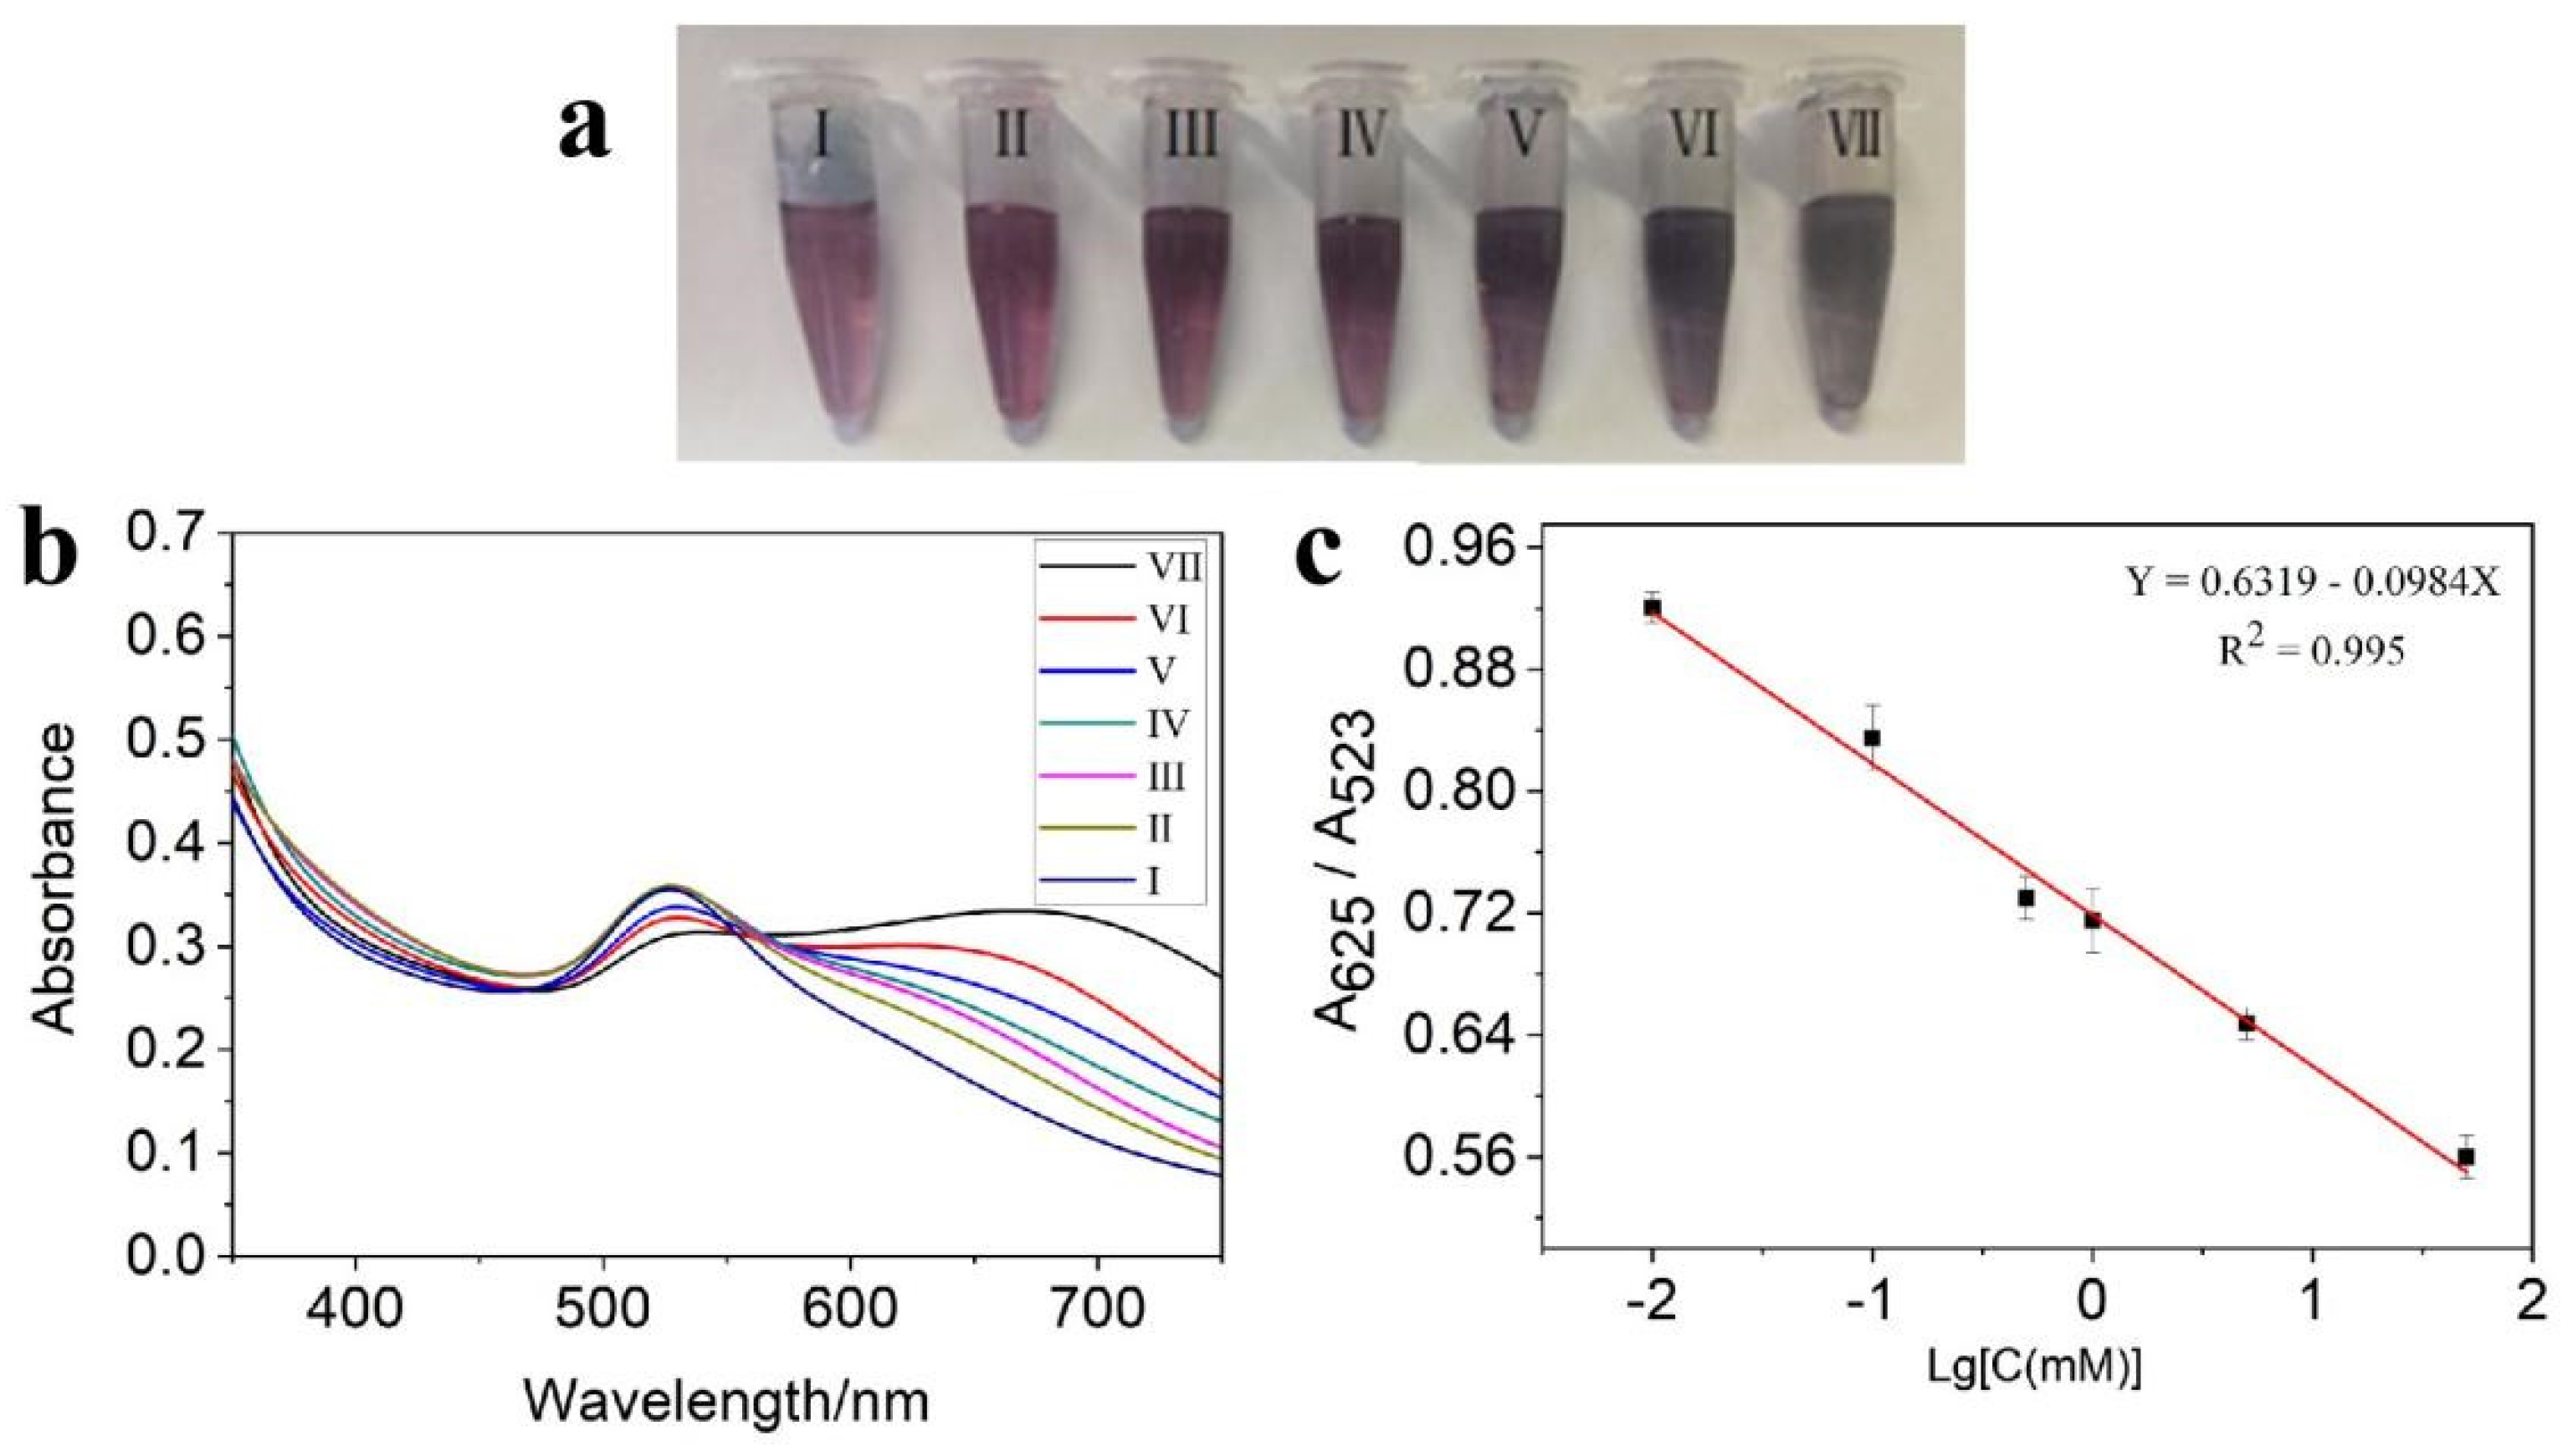
Glucose could be oxidized to produce H2O2 and gluconic acid after the reaction of GOx and O2. Thus, this H2O2 sensing assay was further used to monitor glucose. The results of glucose detection are presented in Figure 7a. As shown, visual color changes (red color to purple color) were observed with an increase in the content of glucose (0~5 mM). The corresponding UV-vis absorption spectra were determined and displayed in Figure 7b. As presented in Figure 7c, the A625/A523 value decreases linearly (the linear relationship is Y = 0.6319 − 0.0984X, R2 = 0.995) with the logarithm of glucose concentration (0.001~5 mM), based on which the LOD for glucose is estimated to be around 3.01 μM. In contrast, the correlation coefficient of the linear equation and the detection sensitivity of this assay is predominant over most other glucose-responsive detective methods (Table 2).
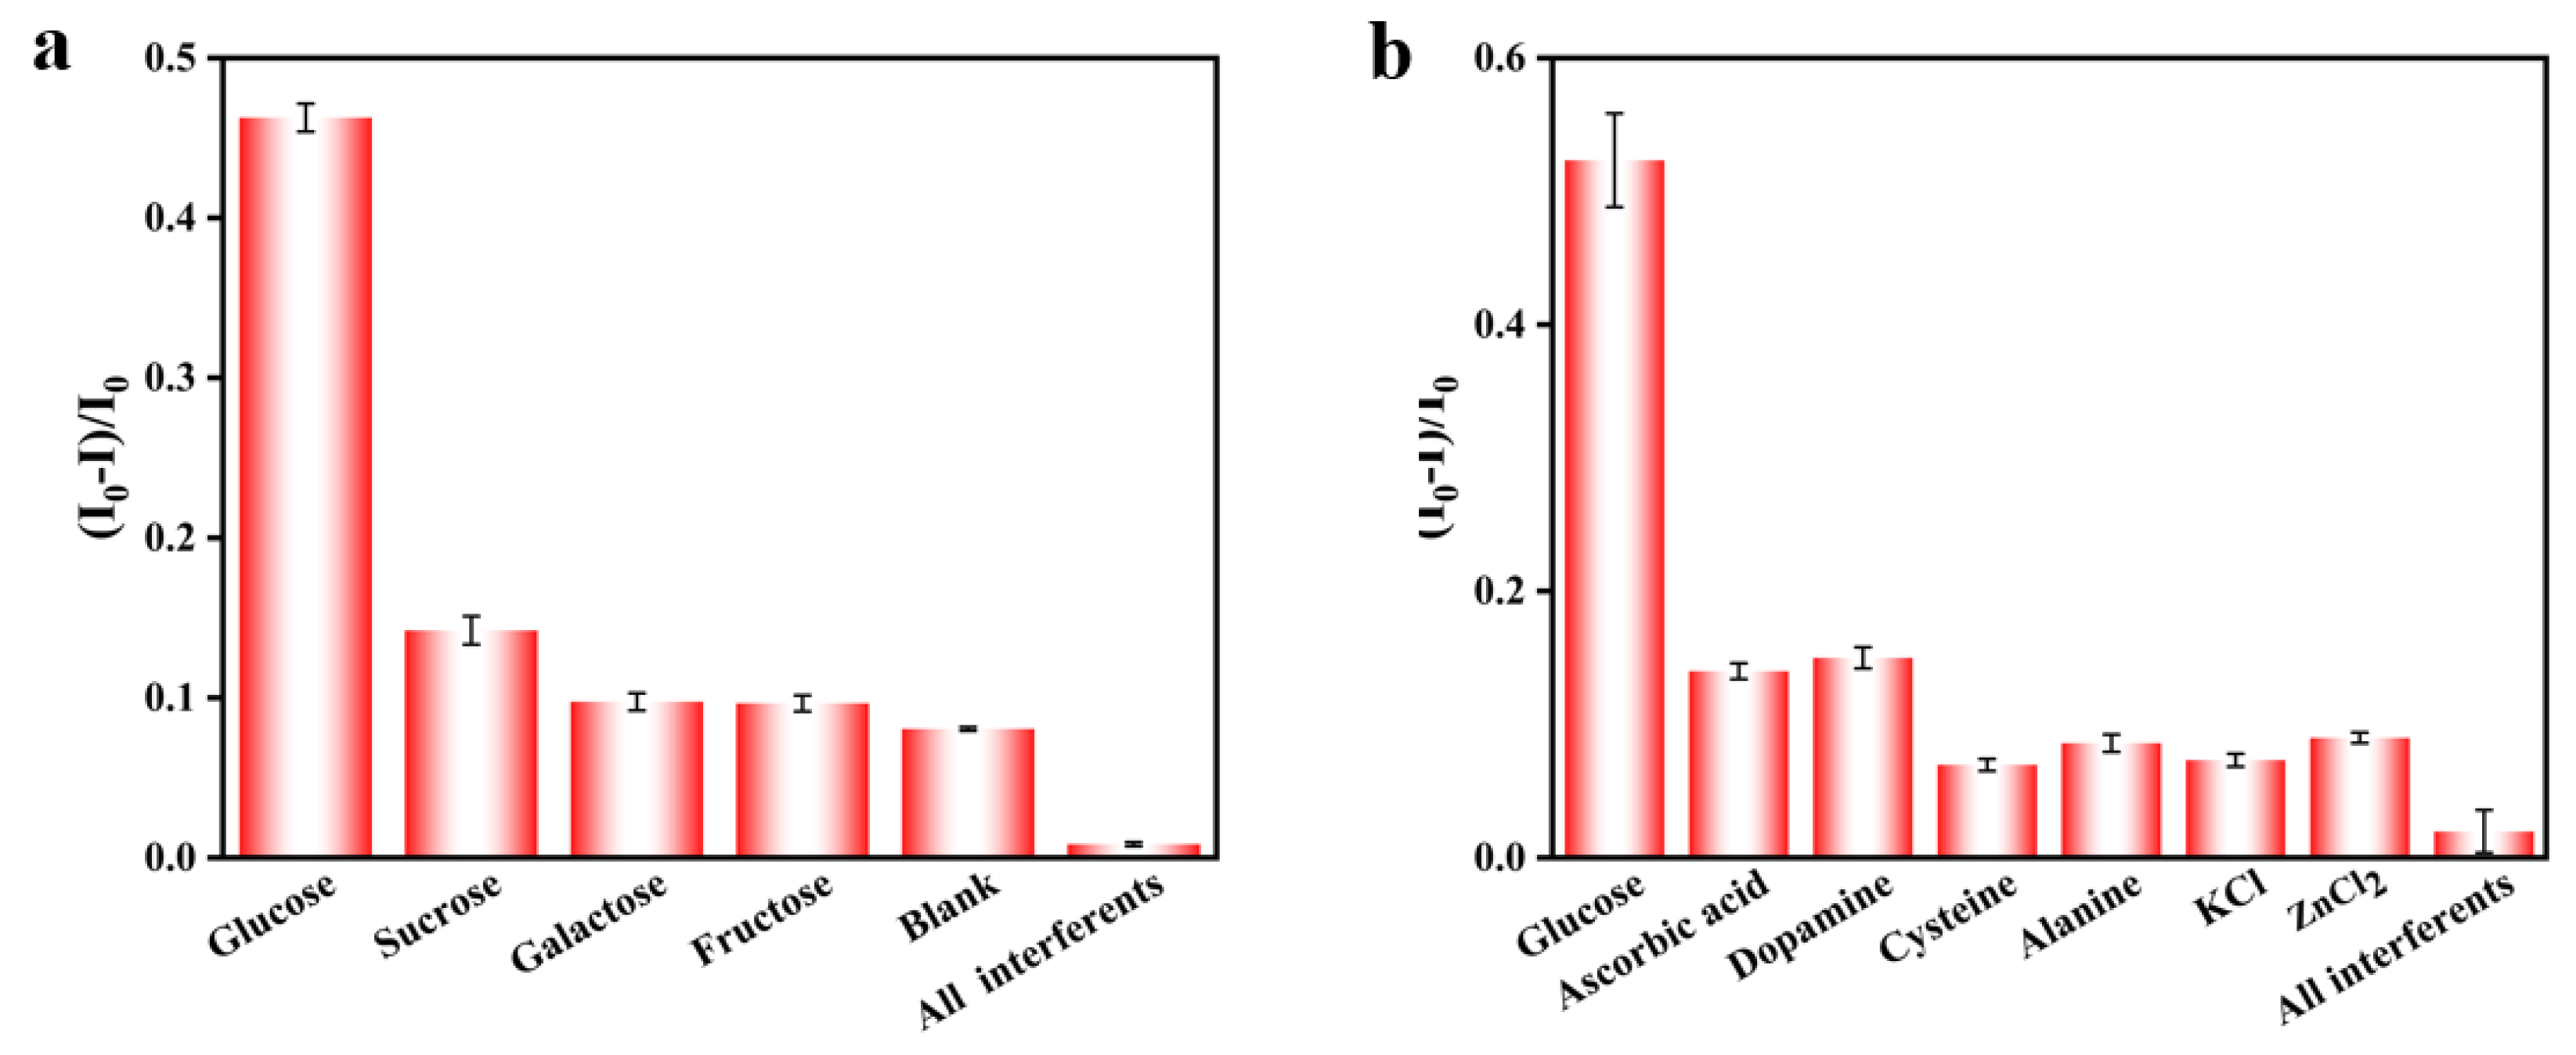
The specificity of this assay for glucose detection in the HEPES buffer was also evaluated under the same conditions by adding some individual possible interfering species (including sucrose, galactose, and fructose) and their mixture. As illustrated in Figure 8, only glucose can trigger obvious relative absorbance (I-I0)/I0, and I and I0 refer to the absorbance ratio of A625/A523 of the system with and without glucose, respectively. This demonstrates that the strategy proposed here shows considerable specificity for glucose detection in HEPES buffers.
To test the feasibility of the proposed method, the analysis of glucose in human serum samples was carried out by the standard addition method. The glucose concentration in blood samples measured by a commercial glucose meter is 4.3 ± 0.15 mM. The selectivity of the assay for glucose in diluted serum is shown in Figure 8. The mimetic samples contain the normal diluted serum and different concentrations of glucose. The recoveries range from 81.1% to 118% with the relative standard deviations (RSD) of 1.42%~1.98% (Table 3), indicating the potential applicability of this strategy for glucose detection in diluted human serum samples. RSD is calculated based on the results of three experiments, according to the following equation.
In Equation (1), S is the standard deviation of found concentrations in the three experiments, and denotes the average value of the found concentration.
4. Conclusions
To summarize, a label-free and visual colorimetric assay was developed for the sensitive detection of H2O2 based on the interaction between it and CeO2. Without H2O2, ssDNA decorates the surface of CeO2 and, almost simultaneously, AuNPs aggregate in the high salt solution. While introducing H2O2, it can combine with CeO2 more firmly. In the presence of H2O2, ssDNA bound to CeO2 is released to bind aggregated AuNPs, causing them to disaggregate, resulting in a purple-to-red color change that can be easily observed by the naked eye. In addition, since H2O2 could be generated from the oxidization of glucose by GOx, this strategy could be also utilized to detect glucose even in blood serum samples. Compared with most other methods, this method has higher sensitivity, wider detection range, and lower LOD. This work provides a novel method to monitor H2O2 and glucose, which has a promising application in the early diagnosis of some related diseases.
Author Contributions
Conceptualization and writing—original draft, C.Z.; methodology, investigation, and validation, T.W.; methodology, investigation, and validation, J.X.; data analysis and writing—review and editing, D.W.; conceptualization, visualization, supervision, and funding acquisition, L.Y. All authors have read and agreed to the published version of the manuscript.
Funding
This research was funded by the National Natural Science Foundation of China (21972074).
Institutional Review Board Statement
Not applicable.
Informed Consent Statement
Not applicable.
Data Availability Statement
Not applicable.
Conflicts of Interest
The authors declare no conflict of interest.
References
- Albers, A.E.; Okreglak, V.S.; Chang, C.J. A FRET-Based approach to ratiometric fluorescence detection of hydrogen peroxide. J. Am. Chem. Soc. 2006, 128, 9640–9641. [Google Scholar] [CrossRef] [PubMed]
- Karyakin, A.A.; Puganova, E.A.; Budashov, I.A.; Kurochkin, I.N.; Karyakina, E.E.; Levchenko, V.A.; Matveyenko, V.N.; Varfolomeyev, S.D. Prussian blue based nanoelectrode arrays for H2O2 detection. Anal. Chem. 2004, 76, 474–478. [Google Scholar] [CrossRef] [PubMed]
- Wang, T.; Zhu, H.; Zhuo, J.; Zhu, Z.; Papakonstantinou, P.; Lubarsky, G.; Lin, J.; Li, M. Biosensor based on ultrasmall MoS2 nanoparticles for electrochemical detection of H2O2 released by cells at the nanomolar level. Anal. Chem. 2013, 85, 10289–10295. [Google Scholar] [CrossRef] [PubMed]
- Hua, L.; Yuan, Y.; Zhang, L.; Zhao, J.; Majeed, S.; Xu, G. Copper nanoclusters as peroxidase mimetics and their applications to H2O2 and glucose detection. Anal. Chim. Acta 2013, 762, 83–86. [Google Scholar] [CrossRef]
- Chen, S.; Hai, X.; Chen, X.W.; Wang, J.H. In situ growth of silver nanoparticles on graphene quantum dots for ultrasensitive colorimetric detection of H2O2 and glucose. Anal. Chem. 2014, 86, 6689–6694. [Google Scholar] [CrossRef]
- Bracamonte, M.V.; Melchionna, M.; Giuliani, A.; Nasi, L.; Tavagnacco, C.; Prato, M.; Fornasiero, P. H2O2 sensing enhancement by mutual integration of single walledcarbon nanohorns with metal oxide catalysts: The CeO2 case. Sens. Actuators B 2017, 239, 923–932. [Google Scholar] [CrossRef]
- Sun, X.; Guo, S.; Liu, Y.; Sun, S. Dumbbell-like PtPd-Fe3O4 nanoparticles for enhanced electrochemical detection of H2O2. Nano Lett. 2012, 12, 4859–4863. [Google Scholar] [CrossRef]
- Zong, L.; Ruan, L.; Li, J.; Marks, R.S.; Wang, J.; Cosnier, S.; Zhang, X.; Shan, D. Fe-MOGs-based enzyme mimetic and its mediated electrochemiluminescence for in situ detection of H2O2 released from Hela cells. Biosens. Bioelectron. 2021, 184, 113–216. [Google Scholar] [CrossRef]
- Xie, B.; Yang, X.; Zhang, R.; Guo, J.; Chen, Z.; He, Y. Hollow and porous Fe3C-NC nanoballoons nanozymes for cancer cell H2O2 detection. Sens. Actuators B 2021, 347, 130597. [Google Scholar] [CrossRef]
- Huo, Y.; Qi, L.; Lv, X.J.; Lai, T.; Zhang, J.; Zhang, Z.Q. A sensitive aptasensor for colorimetric detection of adenosine triphosphate based on the protective effect of ATP-aptamer complexes on unmodified gold nanoparticles. Biosens. Bioelectron. 2016, 78, 315–320. [Google Scholar] [CrossRef]
- Lu, N.; Zhang, M.; Ding, L.; Zheng, J.; Zeng, C.; Wen, Y.; Liu, G.; Aldalbahi, A.; Shi, J.; Song, S.; et al. Yolk–shell nanostructured Fe3O4@C magnetic nanoparticles with enhanced peroxidase-like activity for label-free colorimetric detection of H2O2 and glucose. Nanoscale 2017, 9, 4508–4515. [Google Scholar] [CrossRef] [PubMed]
- Zhang, R.; Lu, N.; Zhang, J.; Yan, R.; Li, J.; Wang, L.; Wang, N.; Lv, M.; Zhang, M. Ultrasensitive aptamer-based protein assays based on one-dimensional core-shell nanozymes. Biosens. Bioelectron. 2020, 150, 111881. [Google Scholar] [CrossRef] [PubMed]
- Li, J.; Lu, N.; Han, S.; Li, X.; Wang, M.; Cai, M.; Tang, Z.; Zhang, M. Construction of bio-nano interfaces on nanozymes for bioanalysis. ACS Appl. Mater. Interfaces 2021, 13, 21040–21050. [Google Scholar] [CrossRef] [PubMed]
- Guo, Y.; Deng, L.; Li, J.; Guo, S.; Wang, E.; Dong, S. Hemin-graphene hybrid nanosheets with intrinsic peroxidase-like activity for label-free colorimetric detection of single-nucleotide polymorphism. ACS Nano 2011, 5, 1282–1290. [Google Scholar] [CrossRef] [PubMed]
- Dong, Y.; Zhang, H.; Rahman, Z.U.; Su, L.; Chen, X.; Hu, J.; Chen, X. Graphene oxide-Fe3O4 magnetic nanocomposites with peroxidase-like activity for colorimetric detection of glucose. Nanoscale 2012, 4, 3969–3976. [Google Scholar] [CrossRef] [PubMed]
- Chen, J.; Jackson, A.A.; Rotello, V.M.; Nugen, S.R. Colorimetric detection of escherichia coli based on the enzyme-induced metallization of gold nanorods. Small 2016, 12, 2469–2475. [Google Scholar] [CrossRef] [Green Version]
- Ju, J.; Zhang, R.; Chen, W. Photochemical deposition of surface-clean silver nanoparticles onnitrogen-doped graphene quantum dots for sensitive colorimetricdetection of glutathione. Sens. Actuators B 2016, 228, 66–73. [Google Scholar] [CrossRef]
- Jin, L.; Meng, Z.; Zhang, Y.; Cai, S.; Zhang, Z.; Li, C.; Shang, L.; Shen, Y. Ultrasmall Pt nanoclusters as robust peroxidase mimics for colorimetric detection of glucose in human serum. ACS Appl. Mater. Interfaces 2017, 9, 10027–10033. [Google Scholar] [CrossRef]
- Zhao, M.; Wang, X.; Ren, S.; Xing, Y.; Wang, J.; Teng, N.; Zhao, D.; Liu, W.; Zhu, D.; Su, S.; et al. Cavity-type DNA origami-based plasmonic nanostructures for raman enhancement. ACS Appl. Mater. Interfaces 2017, 9, 21942–21948. [Google Scholar] [CrossRef]
- Li, H.; Rothberg, L. Colorimetric detection of DNA sequences based on electrostatic interactions with unmodified gold nanoparticles. Proc. Natl. Acad. Sci. USA 2004, 101, 14036–14039. [Google Scholar] [CrossRef] [Green Version]
- Xia, F.; Zuo, X.; Yang, R.; Xiao, Y.; Kang, D.; Bélisle, A.V.; Gong, X.; Yuen, J.D.; Hsu, B.B.; Heeger, A.J.; et al. Colorimetric detection of DNA, small molecules, proteins, and ions using unmodified gold nanoparticles and conjugated polyelectrolytes. Proc. Natl. Acad. Sci. USA 2010, 107, 10837–10841. [Google Scholar] [CrossRef] [PubMed] [Green Version]
- Khavani, M.; Izadyar, M.; Housaindokht, M.R. A combined MD/QM study on the sensing mechanism of Pb2+ by glutathione functionalized gold nanoparticles. J. Mol. Liq. 2019, 280, 120–127. [Google Scholar] [CrossRef]
- Jv, Y.; Li, B.; Cao, R. Positively-charged gold nanoparticles as peroxidiase mimic and their application in hydrogen peroxide and glucose detection. Chem. Commun. 2010, 46, 8017–8019. [Google Scholar] [CrossRef]
- Jiang, Y.; Zhao, H.; Lin, Y.; Zhu, N.; Ma, Y.; Mao, L. Colorimetric detection of glucose in rat brain using gold nanoparticles. Angew. Chem. Int. Ed. 2010, 49, 4800–4804. [Google Scholar] [CrossRef]
- Prathap Kumar, M.; Suganya Josephine, G.A.; Sivasamy, A. Oxidation of organic dye using nanocrystalline rare earth metal ion doped CeO2 under UV and Visible light irradiations. J. Mol. Liq. 2017, 242, 789–797. [Google Scholar] [CrossRef]
- Alhumaimess, M.; Aldosari, O.; Alshammari, H.; Kamel, M.M.; Betiha, M.A.; Hassan, H.M.A. Ionic liquid green synthesis of CeO2 nanorods and nano-cubes: Investigation of the shape dependent on catalytic performance. J. Mol. Liq. 2019, 279, 649–656. [Google Scholar] [CrossRef]
- Montini, T.; Melchionna, M.; Monai, M.; Fornasiero, P. Fundamentals and catalytic applications of CeO2-based materials. Chem. Rev. 2016, 116, 5987–6041. [Google Scholar] [CrossRef]
- Yang, S.; Gao, L. Controlled synthesis and self-assembly of CeO2 Nanocubes. J. Am. Chem. Soc. 2006, 128, 9330–9331. [Google Scholar] [CrossRef]
- Sun, L.; Ding, Y.; Jiang, Y.; Liu, Q. Montmorillonite-loaded ceria nanocomposites with superiorperoxidase-like activity for rapid colorimetric detection of H2O2. Sens. Actuators B 2017, 239, 848–856. [Google Scholar] [CrossRef]
- Liu, Q.; Yang, Y.; Lv, X.; Ding, Y.; Zhang, Y.; Jing, J.; Xu, C. One-step synthesis of uniform nanoparticles of porphyrinfunctionalized ceria with promising peroxidase mimetics for H2O2 and glucose colorimetric detection. Sens. Actuators B 2017, 240, 726–734. [Google Scholar] [CrossRef]
- Devaiah, D.; Reddy, L.H.; Park, S.; Reddy, B.M. Ceria–zirconia mixed oxides: Synthetic methods and applications. Catal. Rev. 2018, 60, 177–277. [Google Scholar] [CrossRef]
- Liu, B.; Sun, Z.; Huang, P.J.; Liu, J. Hydrogen peroxide displacing DNA from nanoceria: Mechanism and detection of glucose in serum. J. Am. Chem. Soc. 2015, 137, 1290–1295. [Google Scholar] [CrossRef] [PubMed]
- Chen, S.; Zheng, H.; Wang, J.; Hou, J.; He, Q.; Liu, H.; Xiong, C.; Kong, X.; Nie, Z. Carbon nanodots as a matrix for the analysis of low-molecularweight molecules in both positive- and negative-ion matrix-assisted laser desorption/ionization time-of-flight mass spectrometry and quantification of glucose and uric acid in real samples. Anal. Chem. 2013, 85, 6646–6652. [Google Scholar] [CrossRef] [PubMed]
- Yuan, J.; Cen, Y.; Kong, X.J.; Wu, S.; Liu, C.L.; Yu, R.Q.; Chu, X. MnO2-nanosheet-modified upconversion nanosystem for sensitive turn-on fluorescence detection of H2O2 and glucose in blood. ACS Appl. Mater. Interfaces 2015, 7, 10548–10555. [Google Scholar] [CrossRef]
- Cui, Y.; Chen, F.; Yin, X. A ratiometric fluorescence platform based on boric-acid-functional Eu-MOF for sensitive detection of H2O2 and glucose. Biosens. Bioelectron. 2019, 135, 208–215. [Google Scholar] [CrossRef]
- Adeel, M.; Asif, K.; Rahman, M.M.; Daniele, S.; Canzonieri, V.; Rizzolio, F. Glucose detection devices and methods based on metal–organic frameworks and related materials. Adv. Funct. Mater. 2021, 31, 2106023. [Google Scholar] [CrossRef]
- Sun, Q.; Liu, Q.; Gao, W.; Xing, C.; Shen, J.; Liu, X.; Kong, X.; Li, X.; Zhang, Y.; Chen, Y. A high-performance photoelectrochemical sensor for the specific detection of H2O2 and glucose based on an organic conjugated microporous polymer. J. Mater. Chem. A 2021, 9, 26216–26225. [Google Scholar] [CrossRef]
- Liang, T.; Zou, L.; Guo, X.; Ma, X.; Zhang, C.; Zou, Z.; Zhang, Y.; Hu, F.; Lu, Z.; Tang, K.; et al. Rising mesopores to realize direct electrochemistry of glucose oxidase toward highly sensitive detection of glucose. Adv. Funct. Mater. 2019, 29, 1903026. [Google Scholar] [CrossRef]
- Liu, B.; Liu, J. Comprehensive screen of metal oxide nanoparticles for DNA adsorption, fluorescence quenching, and anion discrimination. ACS Appl. Mater. Interfaces 2015, 7, 24833–24838. [Google Scholar] [CrossRef]
- Xua, M.; Gao, Z.; Zhou, Q.; Lin, Y.; Lu, M.; Tang, D. Terbium ion-coordinated carbon dots for fluorescent aptasensing of adenosine 5’-triphosphate with unmodified gold nanoparticles. Biosens. Bioelectron. 2016, 86, 978–984. [Google Scholar] [CrossRef] [Green Version]
- Liu, P.; Yang, X.; Wang, Q.; Wang, K. Enzyme-free colorimetric detection of DNA by using gold nanoparticles and hybridization chain reaction amplification. Anal. Chem. 2013, 85, 7689–7695. [Google Scholar] [CrossRef] [PubMed]
- Chen, H.; Zhang, J.; Wu, H.; Koh, K.; Yin, Y. Sensitive colorimetric assays for a-glucosidase activity and inhibitor screening based on unmodified gold nanoparticles. Anal. Chim. Acta 2015, 875, 92–98. [Google Scholar] [CrossRef] [PubMed]
- Ramezani, M.; Danesh, N.M.; Abnous, P.L.; Taghdisi, S.M. A selective and sensitive fluorescent aptasensor for detection of kanamycin based on catalytic recycling activity of exonuclease III and gold nanoparticles. Sens. Actuators 2016, 222, 1–7. [Google Scholar] [CrossRef]
- Haiss, W.; Thanh, N.T.; Aveyard, J.; Fernig, D.G. Determination of size and concentration of gold nanoparticles from UV-vis spectra. Anal. Chem. 2007, 79, 4215–4221. [Google Scholar] [CrossRef] [PubMed]
- Azmi, N.E.; Ramli, N.I.; Abdullah, J.; Hamid, M.A.; Sidek, H.; Rahman, S.A.; Ariffin, N.; Yuso, N.A. A simple and sensitive fluorescence based biosensor for the determination of uric acid using H2O2-sensitive quantum dots/dual enzymes. Biosens. Bioelectron. 2015, 67, 129–133. [Google Scholar] [CrossRef] [PubMed]
- Liu, X.; Atwater, M.; Wang, J.; Huo, Q. Extinction coefficient of gold nanoparticles with different sizes and different capping ligands. Colloids Surf. B 2007, 58, 3–7. [Google Scholar] [CrossRef] [PubMed]
- Lv, L.; Jin, Y.; Kang, X.; Zhao, Y.; Cui, C.; Guo, Z. PVP-coated gold nanoparticles for the selective determination of ochratoxin a via quenching fluorescence of the free aptamer. Food Chem. 2018, 249, 45–50. [Google Scholar] [CrossRef]
- Wang, L.; Cao, H.X.; Pan, C.G.; He, Y.S.; Liu, H.F.; Zhou, L.H.; Li, C.Q.; Liang, G.X. A fluorometric aptasensor for bisphenol a based on the inner filter effect of gold nanoparticles on the fluorescence of nitrogen-doped carbon dots. Microchim. Acta 2019, 28, 186. [Google Scholar] [CrossRef]
- Teodoroa, K.B.R.; Migliorini, F.L.; Christinelli, W.A.; Correa, D.S. Detection of hydrogen peroxide (H2O2) using a colorimetric sensor based on cellulose nanowhiskers and silver nanoparticles. Carbohydr. Polym. 2019, 212, 235–241. [Google Scholar] [CrossRef]
- Nguyen, N.D.; Nguyen, T.V.; Chu, A.D.; Tran, H.V.; Tran, L.T.; Huynh, C.D. A label-free colorimetric sensor based on silver nanoparticles directed to hydrogen peroxide and glucose. Arab. J. Chem. 2018, 11, 1134–1143. [Google Scholar] [CrossRef]
- Luo, Y.; Liu, H.; Rui, Q.; Tian, Y. Detection of extracellular H2O2 released from human liver cancer cells based on TiO2 nanoneedles with enhanced electron transfer of cytochromec. Anal. Chem. 2009, 81, 3035–3041. [Google Scholar] [CrossRef] [PubMed]
- Wang, H.; Bo, X.; Bai, J.; Wang, L.; Guo, L. Electrochemical applications of platinum–palladium alloy nanoparticles/large mesoporous carbon. J. Electroanal. Chem. 2011, 662, 281–287. [Google Scholar] [CrossRef]
- Kang, X.; Wang, J.; Tang, Z.; Wu, H.; Lin, Y. Direct electrochemistry and electrocatalysis of horseradish peroxidase immobilized in hybrid organic–inorganic film of chitosan/sol–gel/carbon nanotubes. Talanta 2009, 78, 120–125. [Google Scholar] [CrossRef] [PubMed]
- Zhao, X.; Mai, Z.; Kang, X.; Zou, X. Direct electrochemistry and electrocatalysis of horseradish peroxidase based on clay–chitosan-gold nanoparticle nanocomposite. Biosens. Bioelectron. 2008, 23, 1032–1038. [Google Scholar] [CrossRef] [PubMed]
- Xiao, F.; Li, Y.; Zan, X.; Liao, K.; Xu, R.; Duan, H. Growth of metal–metal oxide nanostructures on freestanding graphene paper for flexible biosensors. Adv. Funct. Mater. 2012, 22, 2487–2494. [Google Scholar] [CrossRef]
- Mu, J.; Wang, Y.; Zhao, M.; Zhang, L. Intrinsic peroxidase-like activity and catalase-like activity of Co3O4 nanoparticles. Chem. Commun. 2012, 48, 2540–2542. [Google Scholar] [CrossRef]
- Ju, Y.; Kim, J. Dendrimer-encapsulated Pt nanoparticles with peroxidase-mimetic activity as biocatalytic labels for sensitive colorimetric analyses. Chem. Commun. 2015, 51, 13752–13755. [Google Scholar] [CrossRef]
- Li, Y.; Song, Y.Y.; Yang, C.; Xia, X.H. Hydrogen bubble dynamic template synthesis of porous gold for nonenzymatic electrochemical detection of glucose. Electrochem. Commun. 2007, 9, 981–988. [Google Scholar] [CrossRef]
- Zhang, X.; Liu, M.; Liu, H.; Zhang, S. Low-toxic Ag2S quantum dots for photoelectrochemical detection glucose and cancer cells. Biosens. Bioelectron. 2014, 56, 307–312. [Google Scholar] [CrossRef]
Scheme 1.
Schematic illustration of AuNPs from aggregation (a) to dispersion (b) in the absence or presence of H2O2, respectively.
Scheme 1.
Schematic illustration of AuNPs from aggregation (a) to dispersion (b) in the absence or presence of H2O2, respectively.

Figure 1.
TEM image (a) and UV−vis absorption spectrum (b) of the synthesized AuNPs.

Figure 2.
TEM image (a) and DLS (b) of the nano−CeO2 sample used in this work.

Figure 3.
(a) UV−vis absorption spectra of (I) ssDNA + CeO2 + AuNPs + NaCl and (II) H2O2 + ssDNA + CeO2 + AuNPs + NaCl (the inset, corresponding optical photographs). (b) Fluorescence spectra of different systems. (The concentrations of CeO2, ssDNA, FAM−ssDNA, H2O2, AuNPs, and NaCl were 200 μg/mL, 1 μM, 1 μM, 0.1 M, 17 nM, and 0.2 M, respectively.)

Figure 4.
(a) Visual color changes of AuNPs (I) and (AuNPs + NaCl) in different concentrations of ssDNA: (II) 0.2 μM, (III) 0.4 μM, (IV) 0.6 μM, (V) 0.8 μM, and (VI) 1.0 μM. (b) UV−vis absorption spectra corresponding with samples in (a).
Figure 4.
(a) Visual color changes of AuNPs (I) and (AuNPs + NaCl) in different concentrations of ssDNA: (II) 0.2 μM, (III) 0.4 μM, (IV) 0.6 μM, (V) 0.8 μM, and (VI) 1.0 μM. (b) UV−vis absorption spectra corresponding with samples in (a).

Figure 5.
(a) The color changes and (b) UV−vis absorption spectra of (AuNPs + ssDNA + NaCl) in different concentrations of CeO2: (I) 0, (II) 50 μg/mL, (III) 100 μg/mL, (IV) 150 μg/mL, and (V) 200 μg/mL.
Figure 5.
(a) The color changes and (b) UV−vis absorption spectra of (AuNPs + ssDNA + NaCl) in different concentrations of CeO2: (I) 0, (II) 50 μg/mL, (III) 100 μg/mL, (IV) 150 μg/mL, and (V) 200 μg/mL.

Figure 6.
(a) Visual color changes of CeO2 + ssDNA + AuNPs + NaCl in the presence of different concentrations of H2O2: (I) 0.1 M, (II) 1 × 10⁻³ M, (III) 1 × 10⁻⁴ M, (IV) 1 × 10⁻⁶ M, (V) 1 × 10⁻⁷ M, (VI) 1 × 10⁻⁸ M, and (VII) 0 M. (b) UV−vis absorption spectra change corresponding with (a). (c) The linear fitted curve presenting the A625/A523 absorbance ratio at different concentrations of H2O2; error bars indicate S (n = 3).

Figure 7.
(a) Photographs showing the colorimetric detection of glucose with the naked eye: (I) 5 mM, (II) 0.5 mM, (III) 0.1 mM, (IV) 0.05 mM, (V) 0.01 mM, (VI) 0.001 mM, and (VII) 0. (b) UV−vis absorption spectra change corresponding with (a). (c) The linear fitted curve presenting the absorbance ratio of A625/A523 at different concentrations of glucose; error bars indicate S (n = 3).

Figure 8.
Selectivity of the assay for glucose detection in HEPES buffer (a) and diluted serum (b).


Table 1.
Comparison of this work with other methods for H2O2 detection.
| Detection Type | Linear Relationship | Linear Range/μM | LOD/μM | Reference |
|---|---|---|---|---|
| Nanostructured polysaccharide-AgNPs | Y = 0.6632 − 0.052X (R2 = 0.9801) | 0.01–30 | 0.014 | [49] |
| GQDs-AgNPs | Y = 1734 X + 2.74412 (R2 = 0.98615) | 0.5–50 | 0.162 | [50] |
| TiO2-cytochrome c | - | 0.85–24,000 | 0.26 | [51] |
| PtPd-mesoporous carbon | - | 0.5–27,000 | 0.30 | [52] |
| HRP-CNT-chitsan-sol-gel | I−1 = 0.03454 + 0.22497C−1 (R2 = 0.9970) | - | 1.40 | [53] |
| HRP-Au-chitosan-clay | I−1 = − 0.06955 + 1.6098C−1 (R2 = 0.9964) | 39–3100 | 9.00 | [54] |
| Pt-MnO-graphene | - | 2.0–13,330 | 5.00 | [55] |
| Eu-MOF | Y = 3.1823 + 0.0732X (R2 = 0.9815) | 0.05–2 | 0.0335 | [35] |
| AuNPs | Y = 0.3242–0.0538X (R2 = 0.991) | 0.01–100,000 | 0.21 | This work |
Table 2.
Comparison of this work with other methods for glucose detection.
| Detection Type | Linear Relationship | Liner Range/μM | LOD/μM | Reference |
|---|---|---|---|---|
| BSA-Cu NCs | - | 100–2000 | 100 | [4] |
| Co3O4 NPs | - | - | 5 | [56] |
| Pt NPs | - | 1–50 | 1 | [57] |
| Gold films | - | 2000–10,000 | 5 | [58] |
| Ag2S QDs | Y = 0.277X + 4.534 (R2 = 0.9945) | 100–12,200 | 32 | [59] |
| GQDs-AgNPs | Y = 7.061X + 3.0547 (R2 = 0.9770) | 500–8000 | 30 | [50] |
| Eu-MOF | Y = 1.564X + 0.1315 (R2 = 0.9824) | 0.1–4 | 0.0643 | [35] |
| AuNPs | Y = 0.6319 − 0.0984X (R2 = 0.995) | 1–5000 | 3.01 | This work |
Table 3.
Detection performance for glucose in healthy human blood serum.
| Sample | Spiked Concentration (mM) | Found Concentration (mM) | Recovery (%) | RSD (%) |
|---|---|---|---|---|
| 1 | 5 | 4.055 | 81.1 | 1.42 |
| 2 | 0.5 | 0.439 | 87.8 | 1.64 |
| 3 | 0.1 | 0.118 | 118.0 | 1.98 |
Publisher’s Note: MDPI stays neutral with regard to jurisdictional claims in published maps and institutional affiliations. |
© 2022 by the authors. Licensee MDPI, Basel, Switzerland. This article is an open access article distributed under the terms and conditions of the Creative Commons Attribution (CC BY) license (https://creativecommons.org/licenses/by/4.0/).
Share and Cite
MDPI and ACS Style
Zheng, C.; Wu, D.; Wang, T.; Xiao, J.; Yu, L. A Label-Free Colorimetric Assay Based on Gold Nanoparticles for the Detection of H2O2 and Glucose. Chemosensors 2022, 10, 100. https://0-doi-org.brum.beds.ac.uk/10.3390/chemosensors10030100
AMA Style
Zheng C, Wu D, Wang T, Xiao J, Yu L. A Label-Free Colorimetric Assay Based on Gold Nanoparticles for the Detection of H2O2 and Glucose. Chemosensors. 2022; 10(3):100. https://0-doi-org.brum.beds.ac.uk/10.3390/chemosensors10030100
Chicago/Turabian StyleZheng, Cong, Da Wu, Tao Wang, Jianhong Xiao, and Li Yu. 2022. "A Label-Free Colorimetric Assay Based on Gold Nanoparticles for the Detection of H2O2 and Glucose" Chemosensors 10, no. 3: 100. https://0-doi-org.brum.beds.ac.uk/10.3390/chemosensors10030100
Note that from the first issue of 2016, this journal uses article numbers instead of page numbers. See further details here.