
The SnO2/MXene Composite Ethanol Sensor Based on MEMS Platform


Materials Genome Institute, Department of Chemistry, Shanghai University, Shanghai 200444, China
*
Authors to whom correspondence should be addressed.
Chemosensors 2022, 10(3), 109; https://0-doi-org.brum.beds.ac.uk/10.3390/chemosensors10030109
Submission received: 21 January 2022
/
Revised: 23 February 2022
/
Accepted: 9 March 2022
/
Published: 11 March 2022
(This article belongs to the Special Issue 2D Materials for Gas Sensing)
Abstract
:In recent years, two-dimensional layered material MXene has attracted extensive attention in the fields of sensors due to its large specific surface area and rich active sites. So, we employed multilayer Ti3C2TX and SnO2 microspheres to prepare SnO2/MXene composites for enhancing gas-sensing properties of pristine SnO2. The composite was brushed on a microelectromechanical system (MEMS) platform to make resistance-type gas sensors with low power consumption. The gas-sensing results show that the SnO2/MXene sensor with the best composite ratio (SnO2: MXene mass ratio is 5:1, named SM-5) greatly improves gas sensitivity of SnO2 sensor, among which the sensitivity to ethanol gas is the highest. At the same time, the composite also speeds up the response recovery speed of the sensor. When the SM-5 sensor worked at its optimal temperature 230 °C, its response value to 10 ppm ethanol reaches 5.0, which is twice that of the pristine SnO2 sensor. Its response and recovery time are only 14 s and 26 s, respectively. The sensing mechanism of the composite is discussed according to the classical the space charge or depletion layer model. It is concluded that the Schottky barrier of composites and the metal properties of Ti3C2Tx are responsible for improvement of the gas-sensing properties of the composite.
1. Introduction
Volatile organic compounds (VOCs) not only pollute the environment, but also cause acute and chronic effects on human health through respiratory and skin pollution. VOCs exist in common items, such as air fresheners, paints, cleaners and disinfectants, wood preservatives and automotive products [1,2]. Excessive intake will stimulate and excite people. When ethanol reaches a certain concentration in human blood, people’s reaction ability and control ability to judge the external situation will decline. In recent years, there are more and more traffic accidents caused by drunk driving [3,4,5]. Gas sensors can not only monitor the atmospheric environment in real-time, but also prevent public safety accidents [6]. They play a more and more important role in life. The commonly used ethanol-detection methods include Raman spectrum, electrochemical sensor and amperometry biosensor. Nowadays, the more rapid, more timely and more accurate detection method is semiconductor gas sensors. Semiconductor gas sensors are widely concerned by the market and the public because of their low cost and easy manufacture [7,8,9,10]. Although the traditional semiconductor gas sensor has good response value, its disadvantages such as large volume, high power consumption and high cost could not be ignored. In recent years, with the rapid development of microelectromechanical system (MEMS) technology, gas sensors have a new research direction [11,12,13,14,15]. The fabrication of MEMS micro hot plate gas sensors with small volume, low power consumption, easy integration and mass production have become the focus of research [11,16,17,18]. Tin dioxide (SnO2) is one of the most widely used gas-sensing materials up to now since its excellent conductivity, wide bandgap (Eg = 3.6 eV), adjustable resistance, sensitivity to a variety of gases and adjustable selectivity [19]. In order to meet the detection standards of specific places and the development requirements of intelligence, optimizing the morphology, specific surface area, etc. of SnO2 has been studied to further improve the gas-sensing performance of SnO2 [20]. Many methods can be used to improve the performance of SnO2 gas sensors, such as mechanical mixing of mesoporous materials with high specific surface area, precious metals composite, preparation of nanomaterials with heterojunctions, etc. For example, Li et al., modified the sensitivity and selectivity of SnO2 gas sensor by mechanically mixing a novel high surface area mesoporous material [20], and Wang et al., prepared Au-SnO2 composite nanoparticles to increase the sensitivity of the hydrogen sensor [21]. Additionally, NiO/SnO2 hollow spheres and constructed p-n heterojunction were synthesized to improve the sensitivity of the triethylamine sensor [22].
MXene (the general formula of MXene is Mn+1XnTx, in which M represents transition metal elements, such as Sc, Ti, Zr, Hf, V, Nb, Ta, Cr, Mo, etc.; X is carbon or nitrogen element, Tx is a terminal functional group composed of O, H, F and Cl. Generally, hydroxyl, oxygen(O2), fluorine and a small amount of chlorine exist on the surface of MXene [23,24,25,26,27,28,29,30,31], and play a role in linking other nanomaterials or directly use as active sites for mass-type sensor [32]. Single layer Ti3C2Tx and V2CTx have been successfully developed as gas-sensitive materials [24,26,30,33,34,35,36,37]. Furthermore, multilayer MXene can also improve the gas-sensing performance. Angga et al., compounded multilayer Ti3C2Tx with CuO through electrostatic self-assembly, which greatly improved the sensitivity to toluene gas of CuO nanoparticles [38]. Yang et al., prepared the Ti3C2Tx/ZnO crinkle ball by spray pyrolysis, which included a large number of oxygen vacancy and p-n heterojunction. The device effectively improves the selectivity and response value of Ti3C2Tx to NO2 gas [39]. The above reports are all non-tin oxides, as so far, few studies have involved the combination of multilayer Ti3C2Tx and SnO2 for gas detection.
In this paper, SnO2/MXene composites were prepared by a solvothermal method from the precursor of K2SnO3·3H2O and synthesized multilayer Ti3C2Tx etc. Then, we coated the composite on the MEMS platform for the gas-sensing test. The gas-sensing test results show that the SnO2/MXene sensor with the best composite ratio greatly improves the sensitivity of the SnO2 sensor to gases (ammonia, nitrogen dioxide, hydrogen sulfide, paraxylene, toluene, benzene, methanal, acetone and ethanol), among them the sensitivity to ethanol gas is the highest. Meanwhile, the composite also speeds up the response/recovery rate of the sensor. In addition, the sensing mechanism of the composite are discussed according to the classical the space charge or depletion layer model. It is concluded that the Schottky barrier of composites and the metal properties of Ti3C2Tx are responsible for the improvement of the gas-sensing properties of the composite.
2. Experiment
2.1. Chemicals
All reagents and solvents received from designated suppliers were used without further purification. Ti3AlC2 (325 mesh) was purchased from Shanghai Bohan Chemical Technology Co., Ltd. (Shanghai, China) Hydrofluoric acid, Potassium stannate, Urea, Polyvinylpyrrolidone and absolute ethanol were purchased from Sinopharm Chemical Reagent Co., Ltd. (Beijing, China).
2.2. Preparation of Materials
2.2.1. Preparation of Multilayer Ti3C2Tx
In total, 15 mL of 40% hydrofluoric acid solution was measured with a plastic measuring cylinder and was added into the polytetrafluoroethylene reactor as an etchant. In total, 1 g of commercial Ti3AlC2 powder was added slowly (within 10 min, mainly to prevent a large amount of gas overflow). Then, the solution was stirred vigorously at 60 °C for 48 h. After etching, the solution was washed with a large amount of deionized water until the pH of the supernatant was greater than 5, and then ethanol was used to wash the solution for three times. After that, the fewer layered powder was dried in vacuum at 60 °C for 12 h. The obtained black powder is multilayer Ti3C2Tx, which has a multilayer structure of MXene. We called it multilayer MXene (ML-Ti3C2Tx).
2.2.2. Preparation of SnO2 and SnO2/MXene Composites
Three mixed solutions with 30 mL ethanol and 50 mL deionized water were prepared. In total, 0.198 g K2SnO3·3H2O was then added to the mixed solution under a continuous stirring. Then, 0.3 g urea and 1g polyvinylpyrrolidone (PVP) were added to control the morphology of SnO2. After that, a certain amount of ML-Ti3C2Tx was added into the mixed solution and stirred at 25 °C for 30 min. The black solution was quickly transferred to a 100 mL polytetrafluoroethylene reactor and reacted in a blast oven at 200 °C for 18 h. The obtained product was centrifuged and washed repeatedly with ethanol, deionized water. Finally, the sample was dried at 60 °C for 12 h. The products were named as SM-10, SM-5 and SM-2 for different weight amounts of added MXene, which were 10 wt %, 20 wt % and 50 wt %, respectively. In the last step of the synthesis of single-phase SnO2, ML-Ti3C2Tx was not added.
2.3. Material Characterization
In this paper, DX-2700 X-ray diffractometer (XRD) of Liaoning Dandong Haoyuan Instrument Co., Ltd. (Dandong, China) is used with CuKα1 radiation (λ = 1.54056 Å), the step scanning is adopted, the scanning speed is 0.03 °/s, the range is 5–90°, the tube voltage is 40 kV and the tube current is 40 mA. The samples were analyzed by scanning electron microscope (SEM, SU5000, accelerating voltage 1 kV–30 kV, negative magnification 10–500,000×) and transmission electron microscope (TEM, JEM-200CX, accelerating voltage 160 kV) of Hitachi high-tech company in Japan. The adsorption desorption isotherm was measured at 77 K and a certain pressure by ASAP-2020 nitrogen adsorption specific surface area tester of American micromeritics company, and the specific surface area of the MXene material was calculated by multilayer adsorption theory.
2.4. Fabrication of Gas Sensor
The MEMS used in this study is shown in Figure 1a. The whole test platform is based on MEMS microdevices (The fabrication process of the device is detailed in Supplementary Materials Figure S1). The sensitive characteristics of the sensors are detected through the computer-controlled LP-002A test system (Shanghai Lingpan Electronic Technology Co., Ltd., Shanghai, China). By adjusting the plus and minus keys, the heating voltage (Vh) can be changed to make the sensor obtain different working temperatures. The voltage of the whole test circuit (VC) is 5 V, and the output voltage (Vout) is the voltage at both ends of the load resistance. The simplified circuit diagram is shown in Figure 1b. At a certain operating temperature, we first record the stable voltage (Va) of the sensor in the air. The resistance of the sensor is marked as R.
When the gas to be tested is injected into the cavity from the small hole above the test chamber and mixed evenly with the air, the mixed gas will gradually diffuse and adsorb on the sensor surface. At this time, the test system will record the output voltage Vg. After the adsorption is complete, we opened the upper cover of the test chamber, released the test gas, and exposed the sensor to the air again. Then, the sensor voltage value returns to Va. According to the formula:
The resistance of the sensor in different states can be calculated. Then, the resistance values resistance in air (Ra) and resistance in gas (Rg) of the sensor in air and detection gas can be calculated, and the response value s of the sensor is defined, that is, the ratio of resistance
and the response time is the time required to reach 90% of the maximum response value.
MEMS gas sensor is prepared by a drop-coating method through mixing the sensing material with ethanol solution. The MEMS device structure is shown in Figure 1c, including a heater coated with a supporting film and an isolation film, and an interdigital electrode for conducting electricity. The composite materials generally need to be electrified and aged for 72 h at a voltage of at least 1.3 V (corresponding to the working temperature of 180 °C) to ensure the sensors with good stability. In addition, the ambient temperature tested in this paper is 25 °C and the ambient humidity is 45% RH (relative humidity is defined as ambient humidity) [7,40,41,42]. It is necessary to stabilize the baseline for more than 5 min before all tests.
3. Results and Discussion
3.1. Characterization of Materials
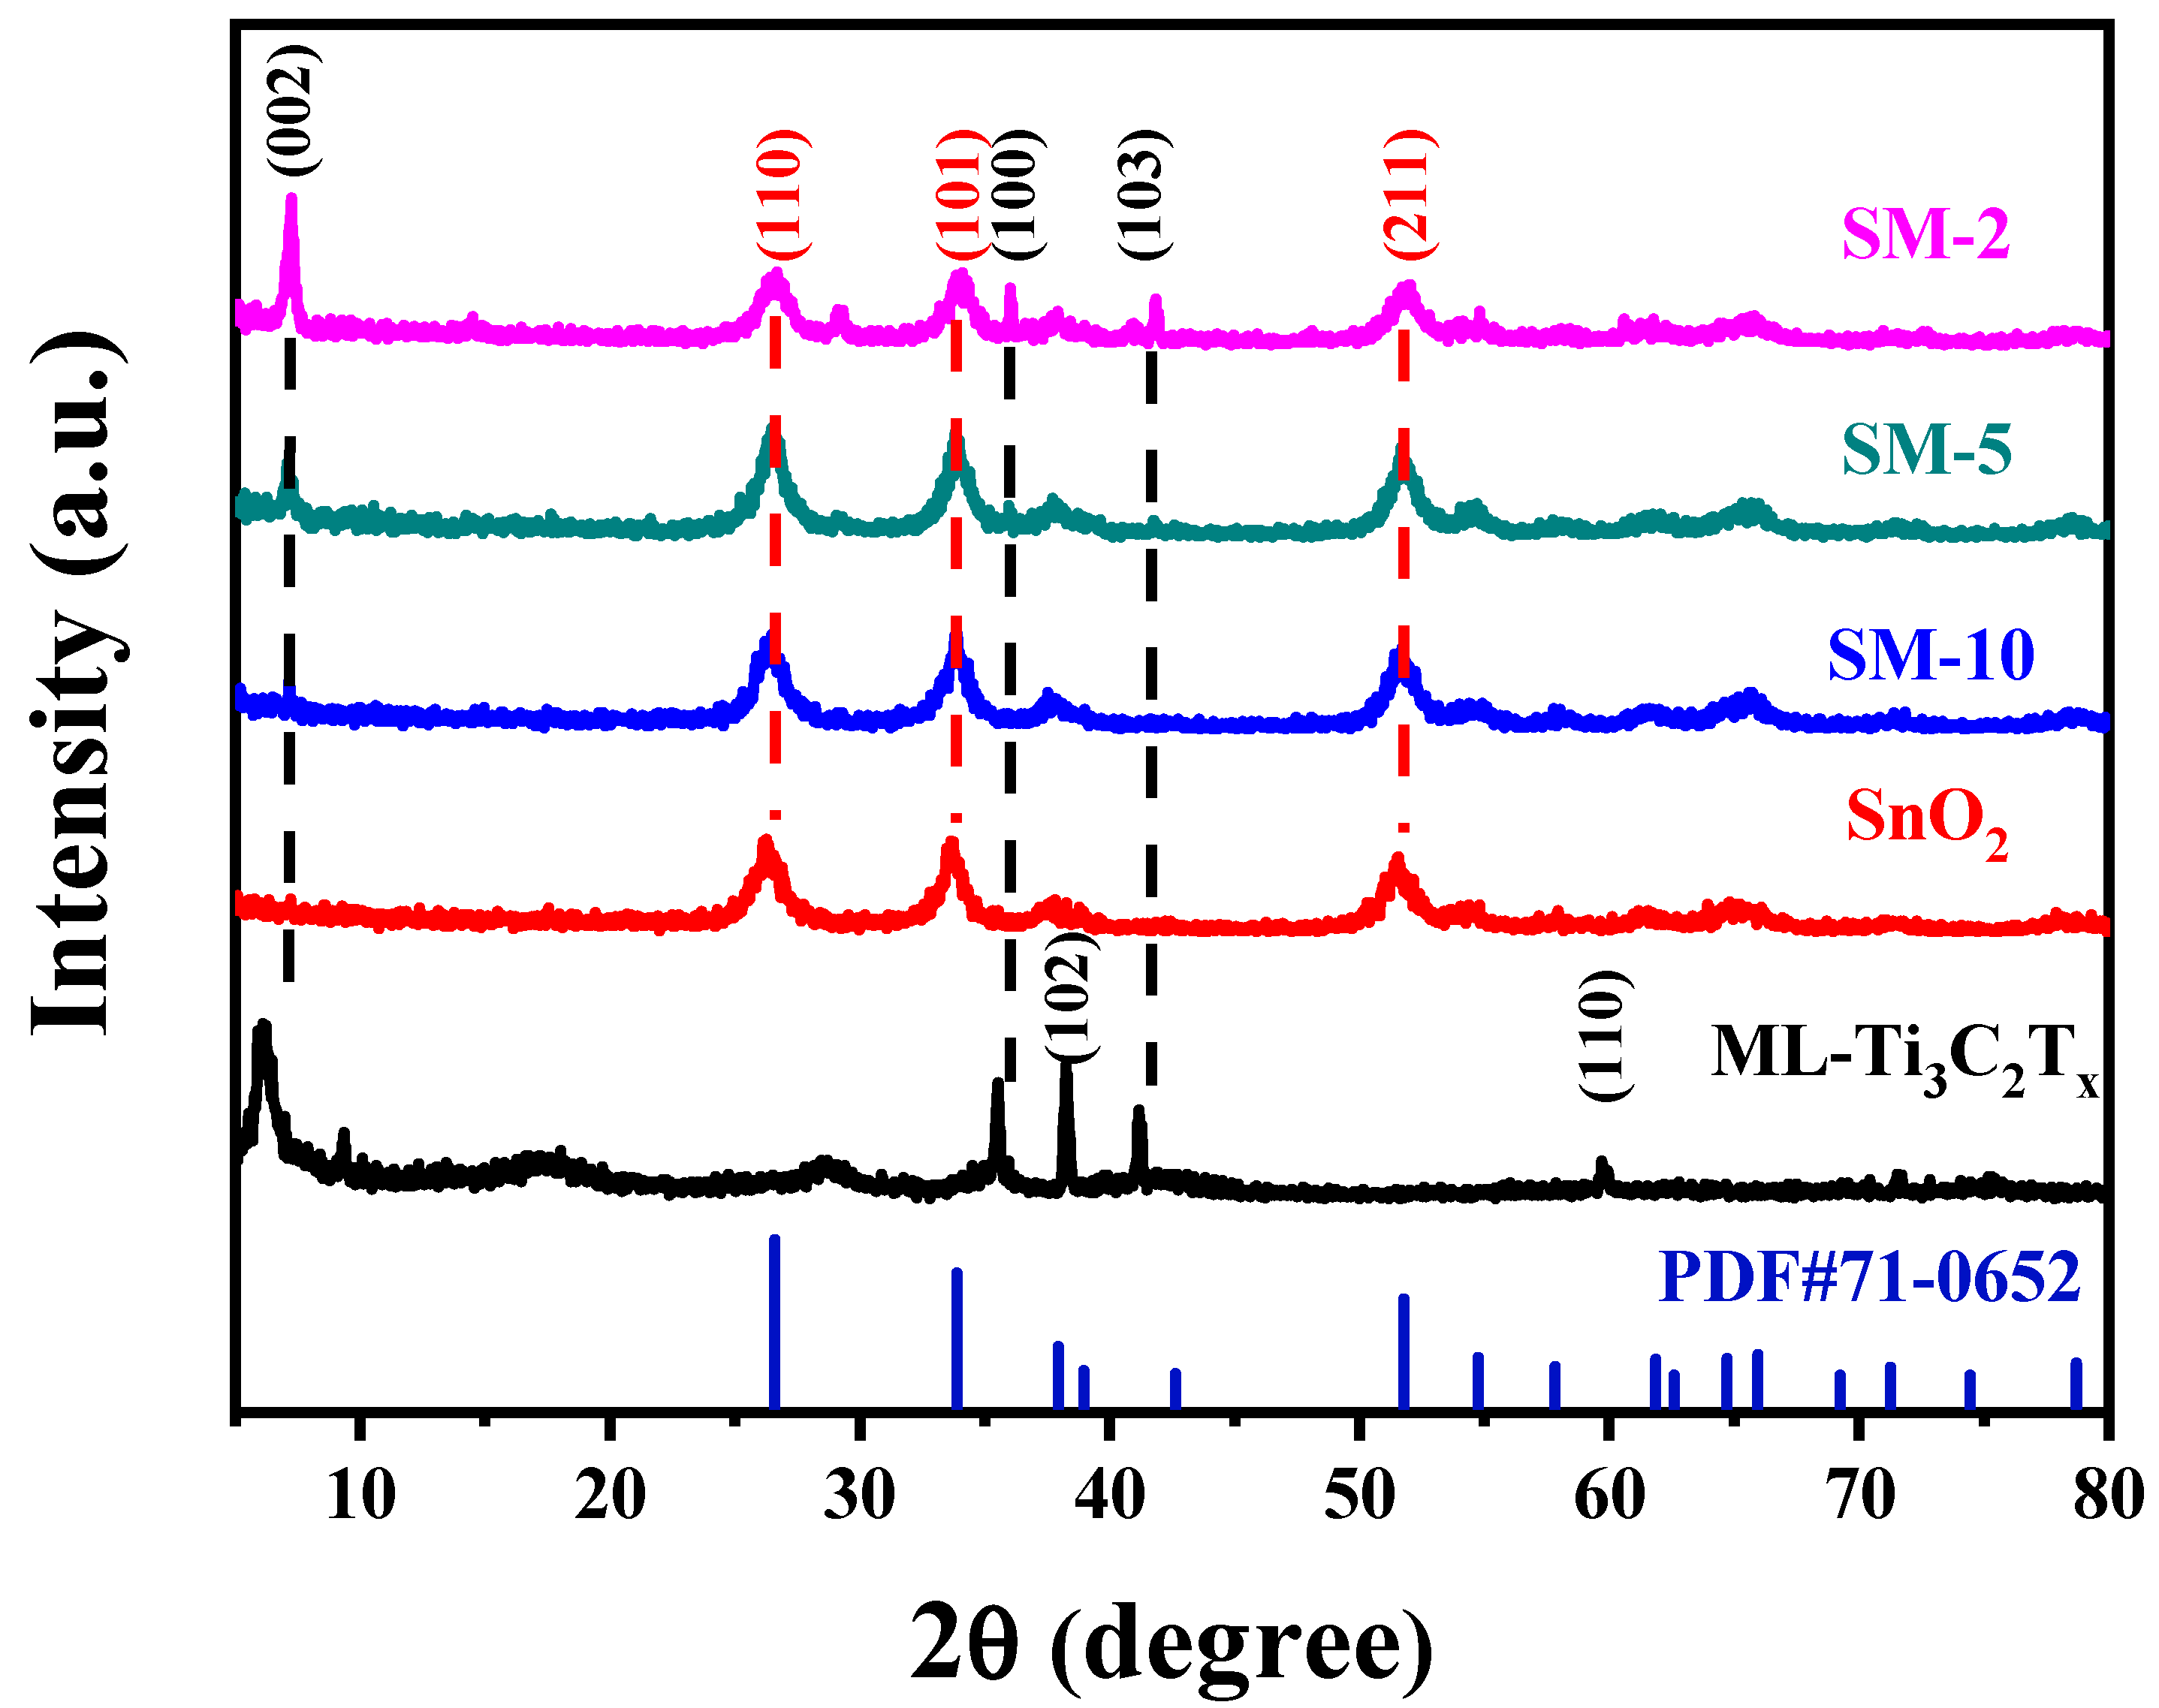
The crystal structure, phase purity and composition of as-synthesized samples were well analyzed and determined by X-ray powder diffraction. Figure 2 shows the XRD patterns of the five samples. The etched multilayer MXene has a standard peak at a low angle, corresponding to the (002) crystal plane of ML-Ti3C2Tx. The three standard peaks at 36.06°, 38.96° and 41.84° can be indexed to the standard card JCPDS-52-0875 of the original phase. The diffraction peak of the obtained SnO2 is sharp and free of other impurities, which can be completely consistent with the standard peak JCPDS: 41-1445, indicating that the SnO2 synthesized by solvothermal method is tetragonal structure and has the characteristics of high purity and good crystallinity. The diffraction pattern of the SnO2/MXene composites is basically consistent with that of SnO2, because the proportion of SnO2 in the composites is much larger than that of MXene. So, there is no obvious MXene diffraction peak in the patterns of SM-10. However, as the ratio of SnO2 and MXene gradually increases to 5:1 and 2:1, the standard peak intensity of MXene phase at a low angle gradually increases. Even several characteristic peaks of MXene near 40° can be seen in the SM-2 sample.
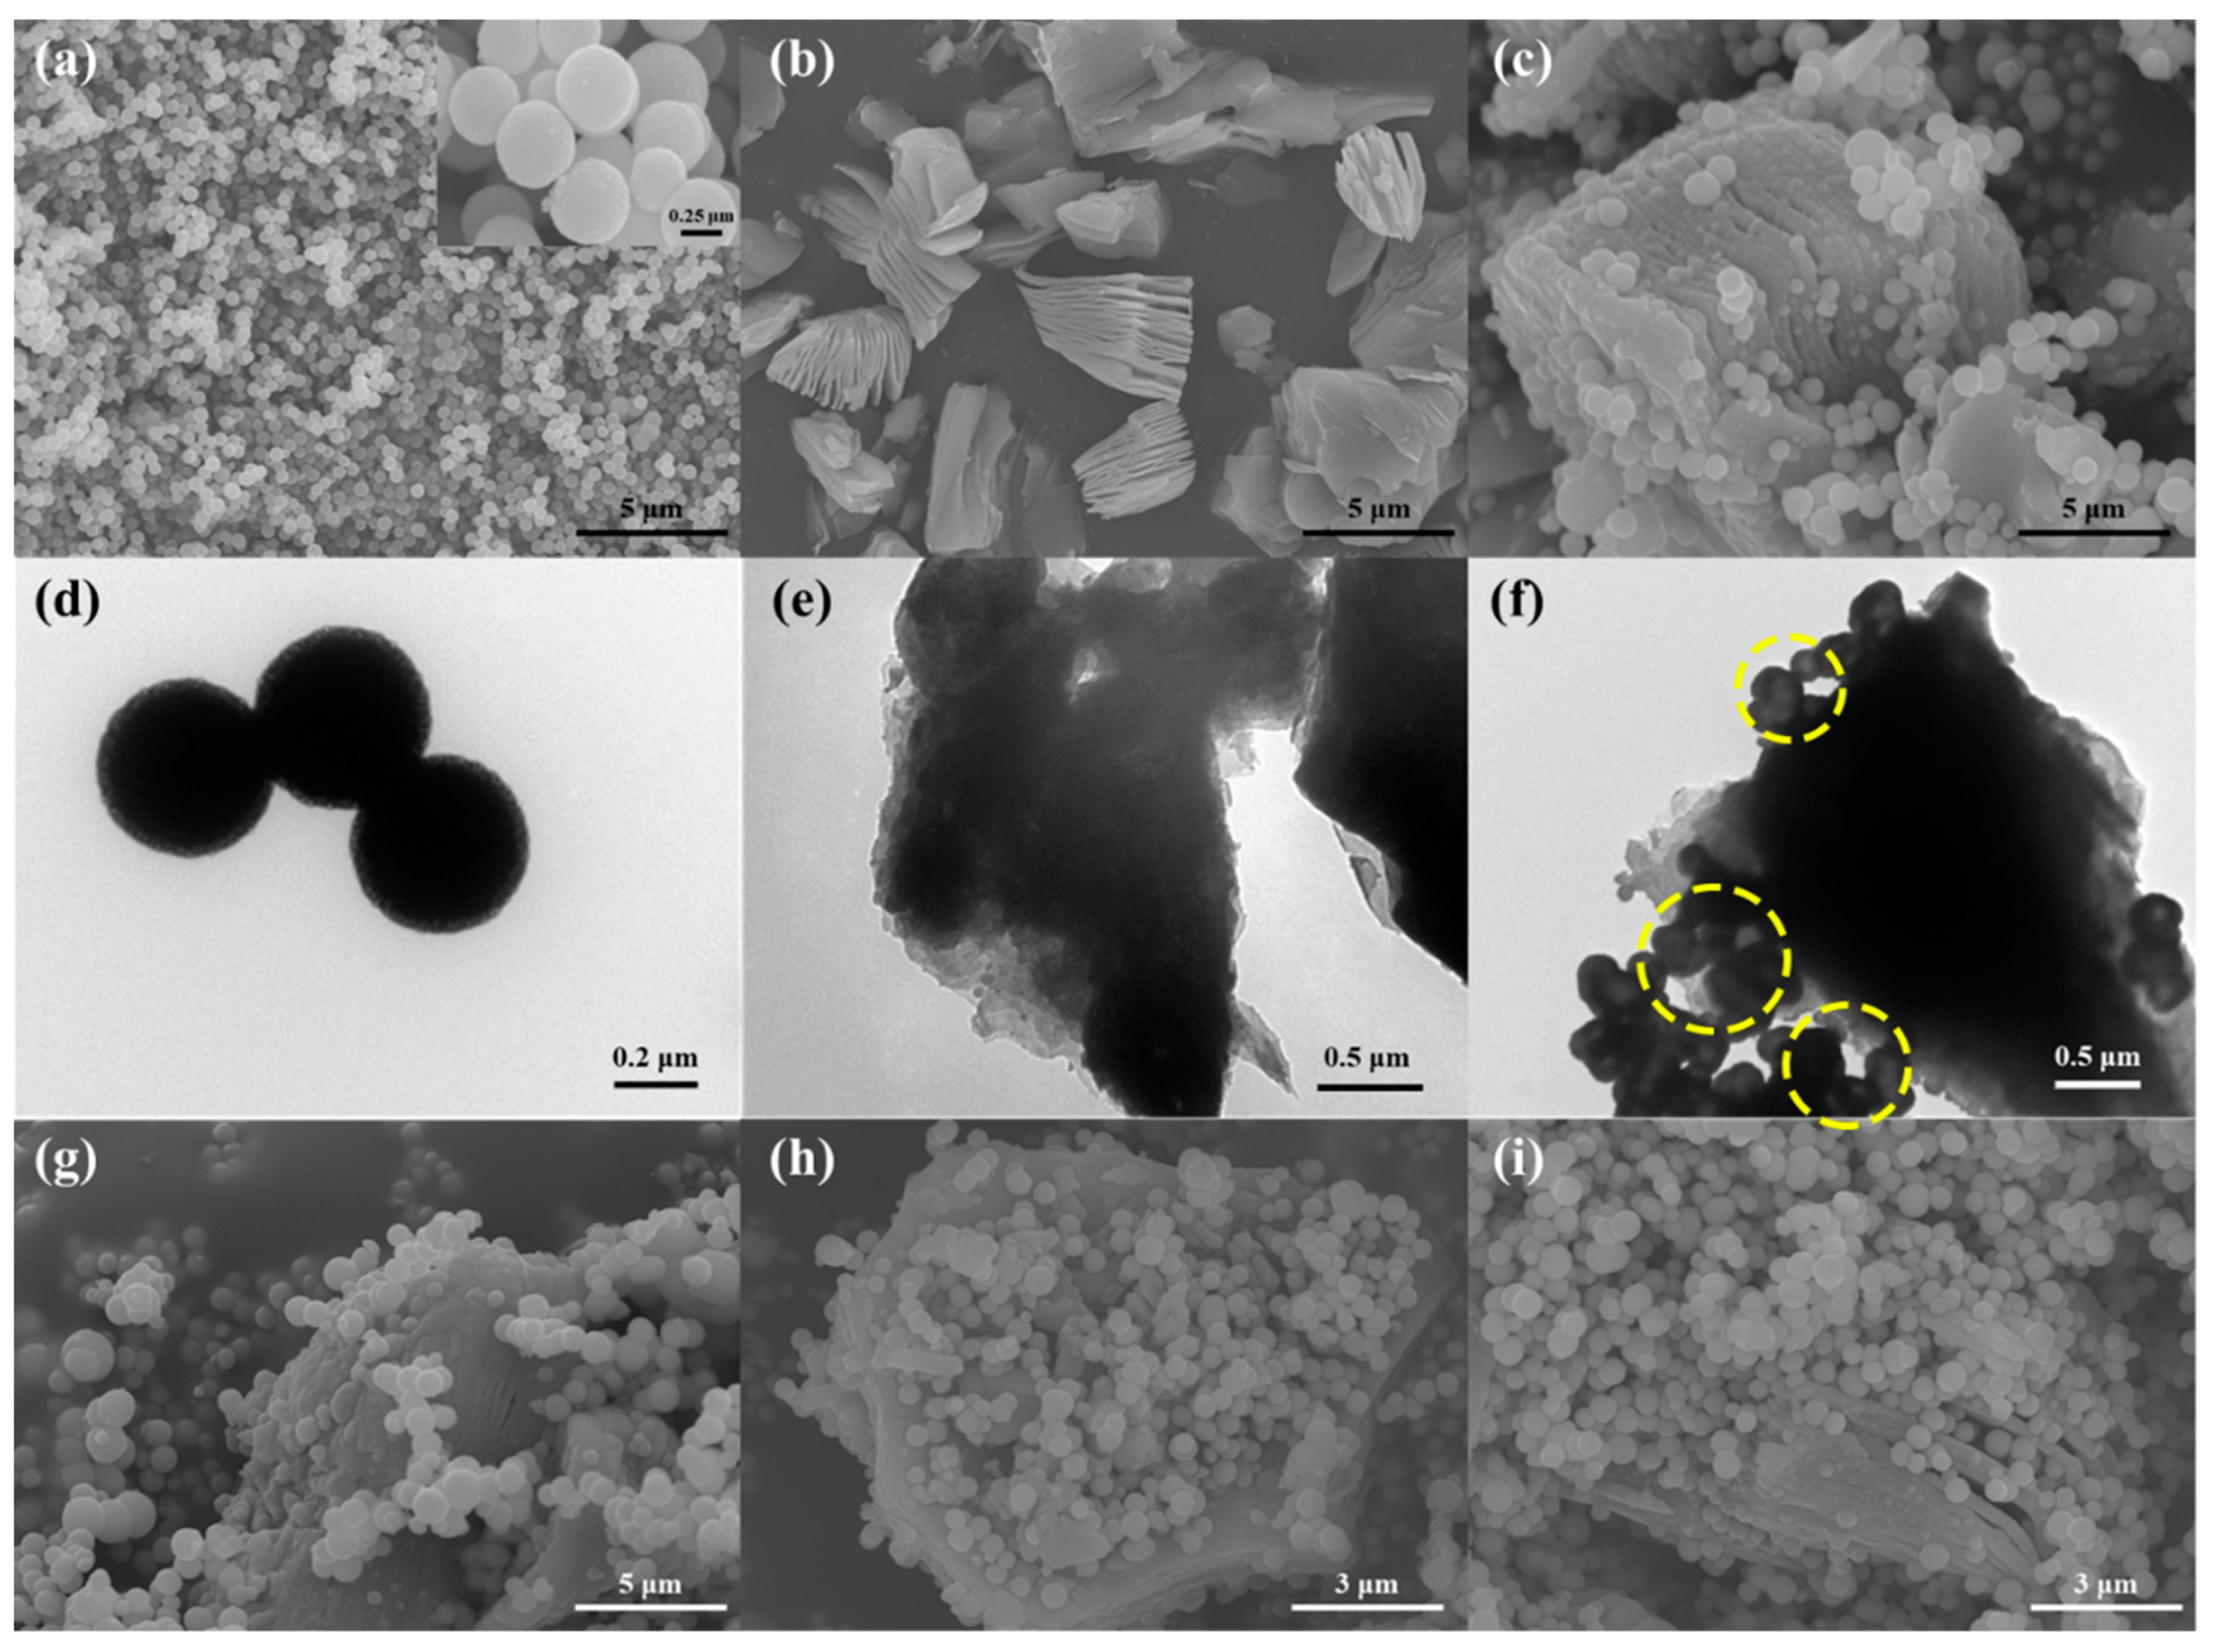
The morphology of the SnO2 and its composites was observed by SEM and TEM. Figure 3a–c exhibits the morphologies of SnO2, multilayer MXene and SM-5, while Figure 3d–f shows the TEM images corresponding to the three materials. It can be seen that from Figure 3a the SnO2 obtained by this method has a typical spherical structure, the morphology of all microspheres is relatively uniform and the sizes are basically same. The enlarged view in the upper right corner shows that the diameter of microspheres is about 350–500 nm. A consistent conclusion can also be obtained in the corresponding Figure 3d. It is also found that SnO2 microspheres are a solid structure with rough surface and loose pores from Figure 3d, which is conducive to gas adsorption. Figure 3b shows that the multilayer Ti3C2Tx has a good accordion shape and the transverse size is 3–5 μm. The larger layer spacing proves that the aluminum atomic layer has been removed thoroughly and the overall etching effect is good. Compared with the SEM Figure 3c of the composite, it is found that the layer spacing of the hydrothermal ML-Ti3C2Tx decreases due to the thermal condensation. The (002) standard peak in the XRD spectrum shifts to a high angle, and the lamellar surface becomes rough. It can also be seen from the Figure that SnO2 and ML-Ti3C2Tx can be combined under hydrothermal conditions well. A small amount of SnO2 was loaded between the edge of the layer and the gap between layers. Most SnO2 microspheres are bonded or stacked on the surface of large layers due to electrostatic attraction. From Figure 3e,f, the changes of ML-Ti3C2Tx after compositing the SnO2 are observed. The composite sites are consistent with those in the SEM diagram, which are, respectively, located on the surface of the lamella and the side of the overall structure, indicating the good morphology of the composite. The SEM morphologies of SM-10, SM-5 and SM-2 are exhibited, respectively, in Figure 3g–i under the same multiple. With the decrease in the amount of SnO2 content, the number of SnO2 microspheres is also significantly reduced and the stacking phenomenon is gradually improved. The spheres are evenly distributed on the surface and structural side of ML-Ti3C2Tx lamella, which is conducive to give full play to the adsorption of gas.
Figure 4a–d shows the nitrogen adsorption desorption isotherms of SnO2 microspheres and three composites with different proportions (SnO2: MXene is 10:1, 5:1 and 2:1). Through calculation, it is found that the specific surface area (SSA, the calculation method of SSA shows in Supplementary Materials.) of SnO2 microspheres is 28.47 m2 g−1, while the BET specific surface area test data of ML-Ti3C2Tx (The BET test data of ML-Ti3C2Tx is shown in Figure S2 of Supplementary Materials) is 13.54 m2 g−1. The specific surface areas of SM-10, SM-5 and SM-2 after compounding with ML-Ti3C2Tx are 61.53 m2 g−1, 65.01 m2 g−1 and 40.40 m2 g−1, respectively. It can be seen from the above data that the specific surface area of the composite increases as a whole, which is caused by the contact between SnO2 microspheres and ML-Ti3C2Tx and the structure of ML-Ti3C2Tx accordion. The result indicates that the addition of ML-Ti3C2Tx is helpful to improve the gas-sensing performance of SnO2 microspheres. For different proportions of composites, the specific surface area of SM-5 is greater than SM-10 and SM-2, so the performance of SM-5 sensor is expected to be the best.
3.2. Gas-Sensing Performance Test
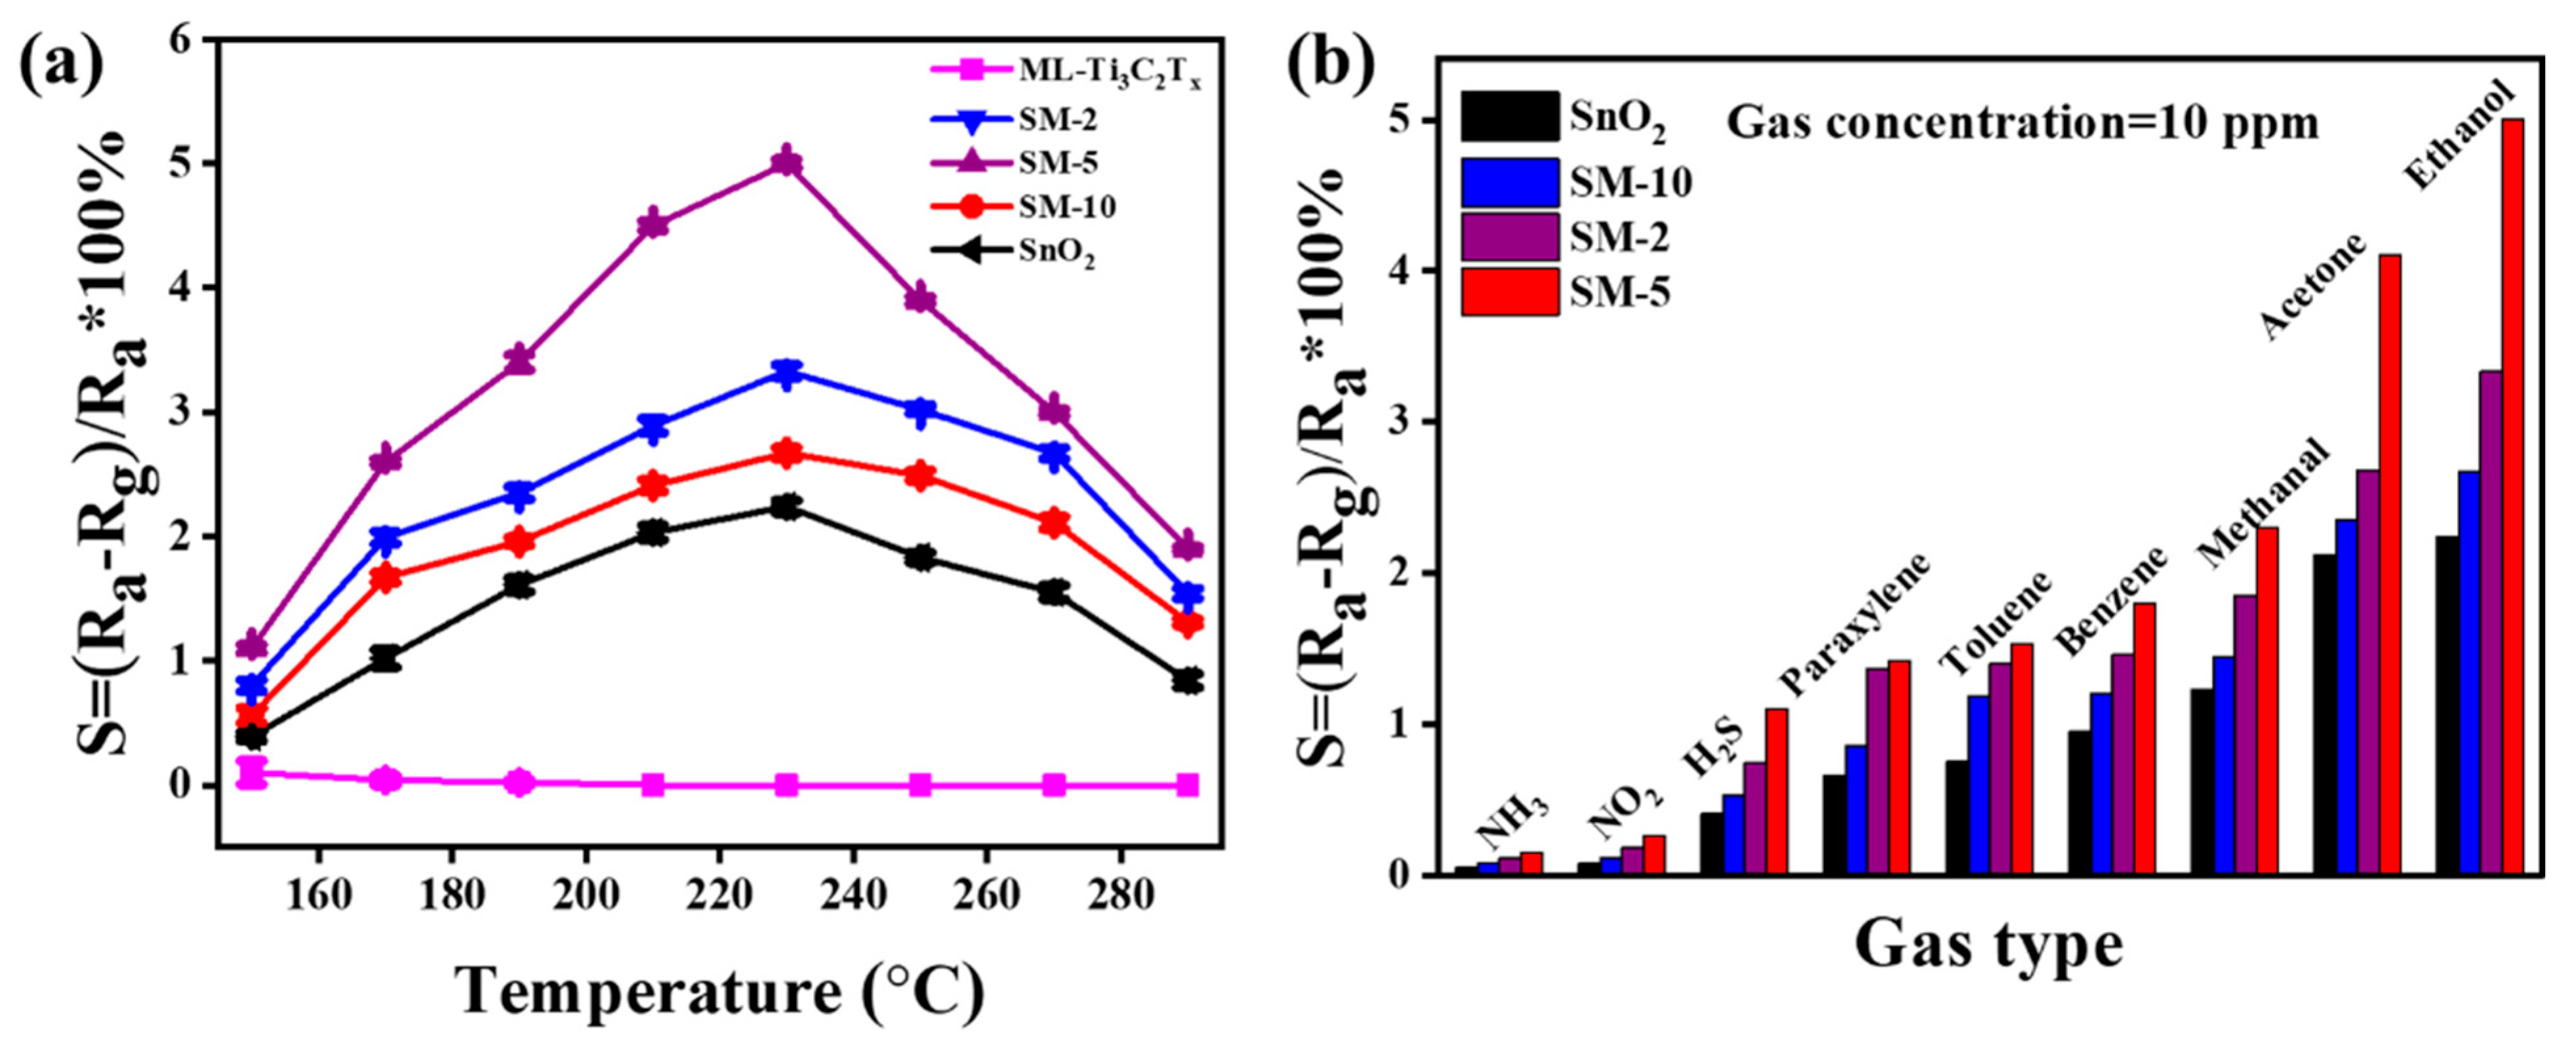
Generally, a metal oxide semiconductor needs a certain temperature to stimulate chemical reaction activity of surface adsorbed oxygen, so the optimal operating temperature should be found at first [43,44,45]. Compared with the reported works of SnO2, the best operating temperature is usually located between 160 °C and 260 °C (which are shown in Table 1) [46,47,48,49,50,51]. Within this range, the operating temperature was adjusted so as to reach the highest response of SnO2 and its composites. As shown in Figure 5a, when the temperature changes from 150 °C to 290 °C, the ML-Ti3C2Tx has little response (only 0~0.1) to ethanol gas, while the response values of SnO2 and all composites own a similar tendency first increase and then decrease, and reach a maximum response value at 230 °C. Among the tested samples, SM-5 has the highest response value about 5.0. It indicates that the best composite ratio of SnO2 microspheres to ML-Ti3C2Tx is 5:1. After determining the operating temperature of 230 °C, the selectivity of the samples was further tested. As shown in Figure 5b, 10 ppm ammonia, nitrogen dioxide, hydrogen sulfide, paraxylene, toluene, benzene, methanal, acetone and ethanol were included the test at 230 °C. It is found that SnO2 microspheres has almost no response to inorganic gas and only has low response to H2S. Most of the target gases with high response are VOCs. The response trend of the three composites to various gases is consistent with that of SnO2 microspheres. The response value of the best composite ratio SM-5 to ethanol is S = 5.0, which is about twice that of pristine SnO2 microspheres. Therefore, in the composites, the semiconductor metal oxide SnO2 microspheres play an important role in adsorbing gas as the main body, and an appropriate amount of ML-Ti3C2Tx plays the role of sensitizer.
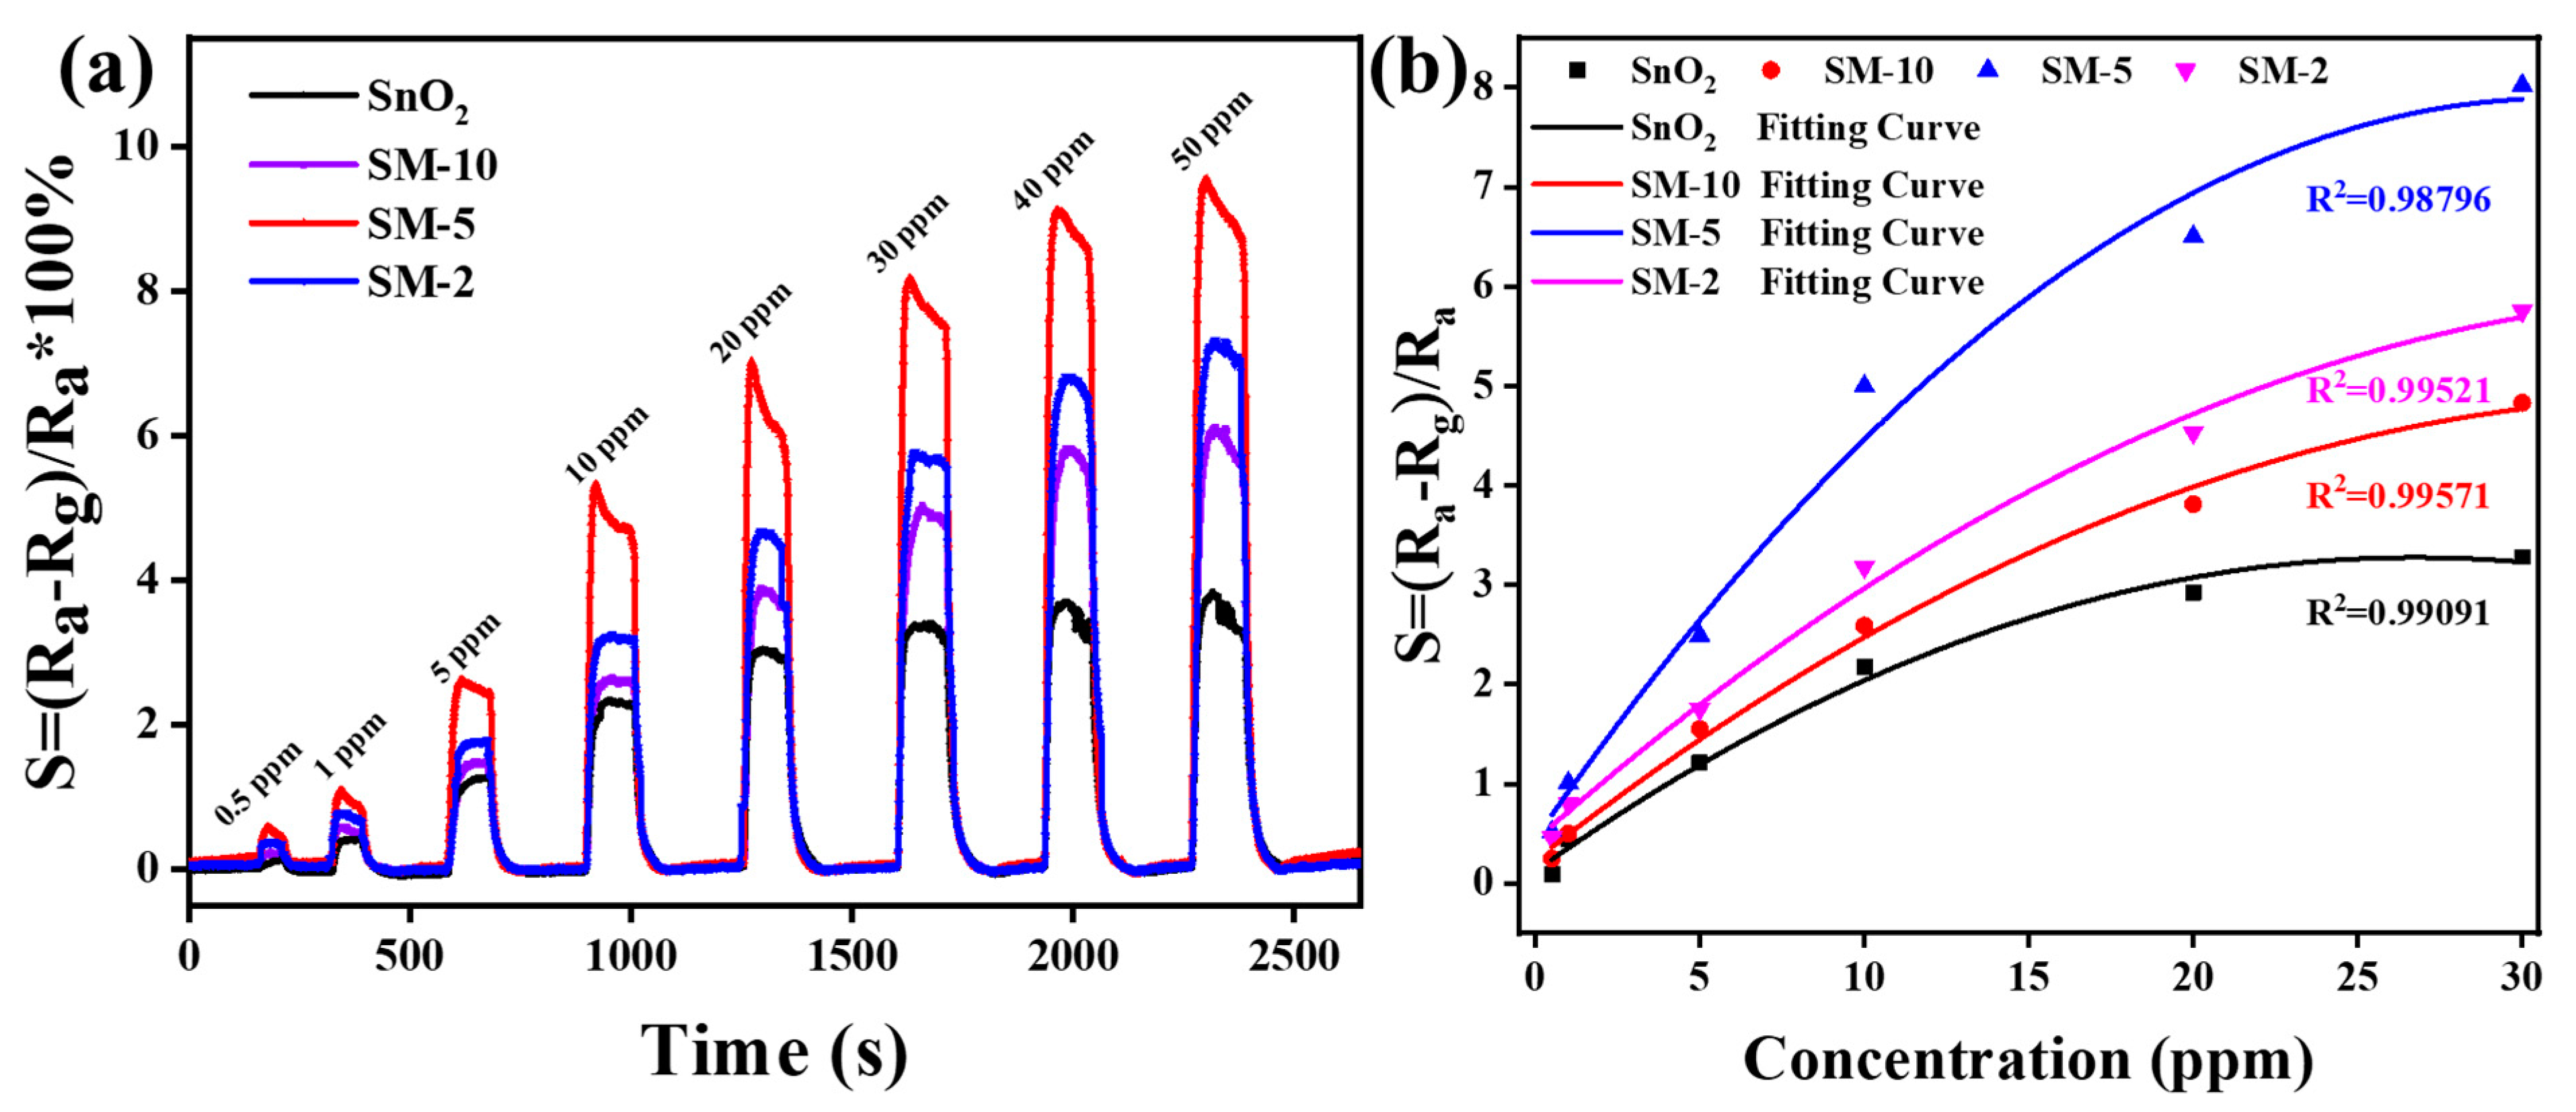
Figure 6a shows the dynamic response curves of the four gas sensors under different ethanol concentrations (0.5–50 ppm). It can be seen from Figure 6a that with the gradual increase in ethanol gas concentration, the response values of the four sensors also increase, and the four sensors show the ability of rapid response and recovery regardless of gas concentration. The gas adsorption of the four materials at a low concentration is in an unsaturated state, the response value increases rapidly. In a higher concentration of ethanol, that increases slowly owing to the adsorption near the saturation state. The response value of SM-5 to different ethanol concentrations is about 2–2.5 times that of SnO2, and the response values to 0.5 ppm, 1 ppm, 5 ppm, 10 ppm and 50 ppm ethanol gas are 0.5, 1.0, 2.5, 5.0 and 9.2, respectively. This result shows that SM-5 sensor can detect ethanol gas in a wide range of concentrations and has good detection ability for low concentration ethanol gas. Fitting curve of response value of four gas sensors to 0.5–30 ppm ethanol is shown in Figure 6b. The fitting formula for the four curves is
and the parameters are shown in Table 2. As can be seen from Figure 6b, the R2 value for pristine SnO2, SM-10, SM-5 and SM-2 is 0.99091, 0.99571, 0.98796 and 0.99521, respectively. It can be observed that the response of the sensor increases fast with the ethanol concentration increase from 1 ppm to 10 ppm. At 25 ppm or above, the responses tend to saturate.
The response and recovery time of the gas sensor is an important parameter for practical application. Generally, the time required for the sensor to reach 90% of the total resistance change is defined as the response or recovery time in the case of gas adsorption or desorption. After intercepting and amplifying the responses of SM-5 and SnO2 under 10 ppm ethanol gas shown in Figure 7, we can find the composite sensor SM-5 not only enhances the response value of SnO2, but also shortens the response and recovery time of SnO2 from 20 s/41 s to 14 s/26 s.
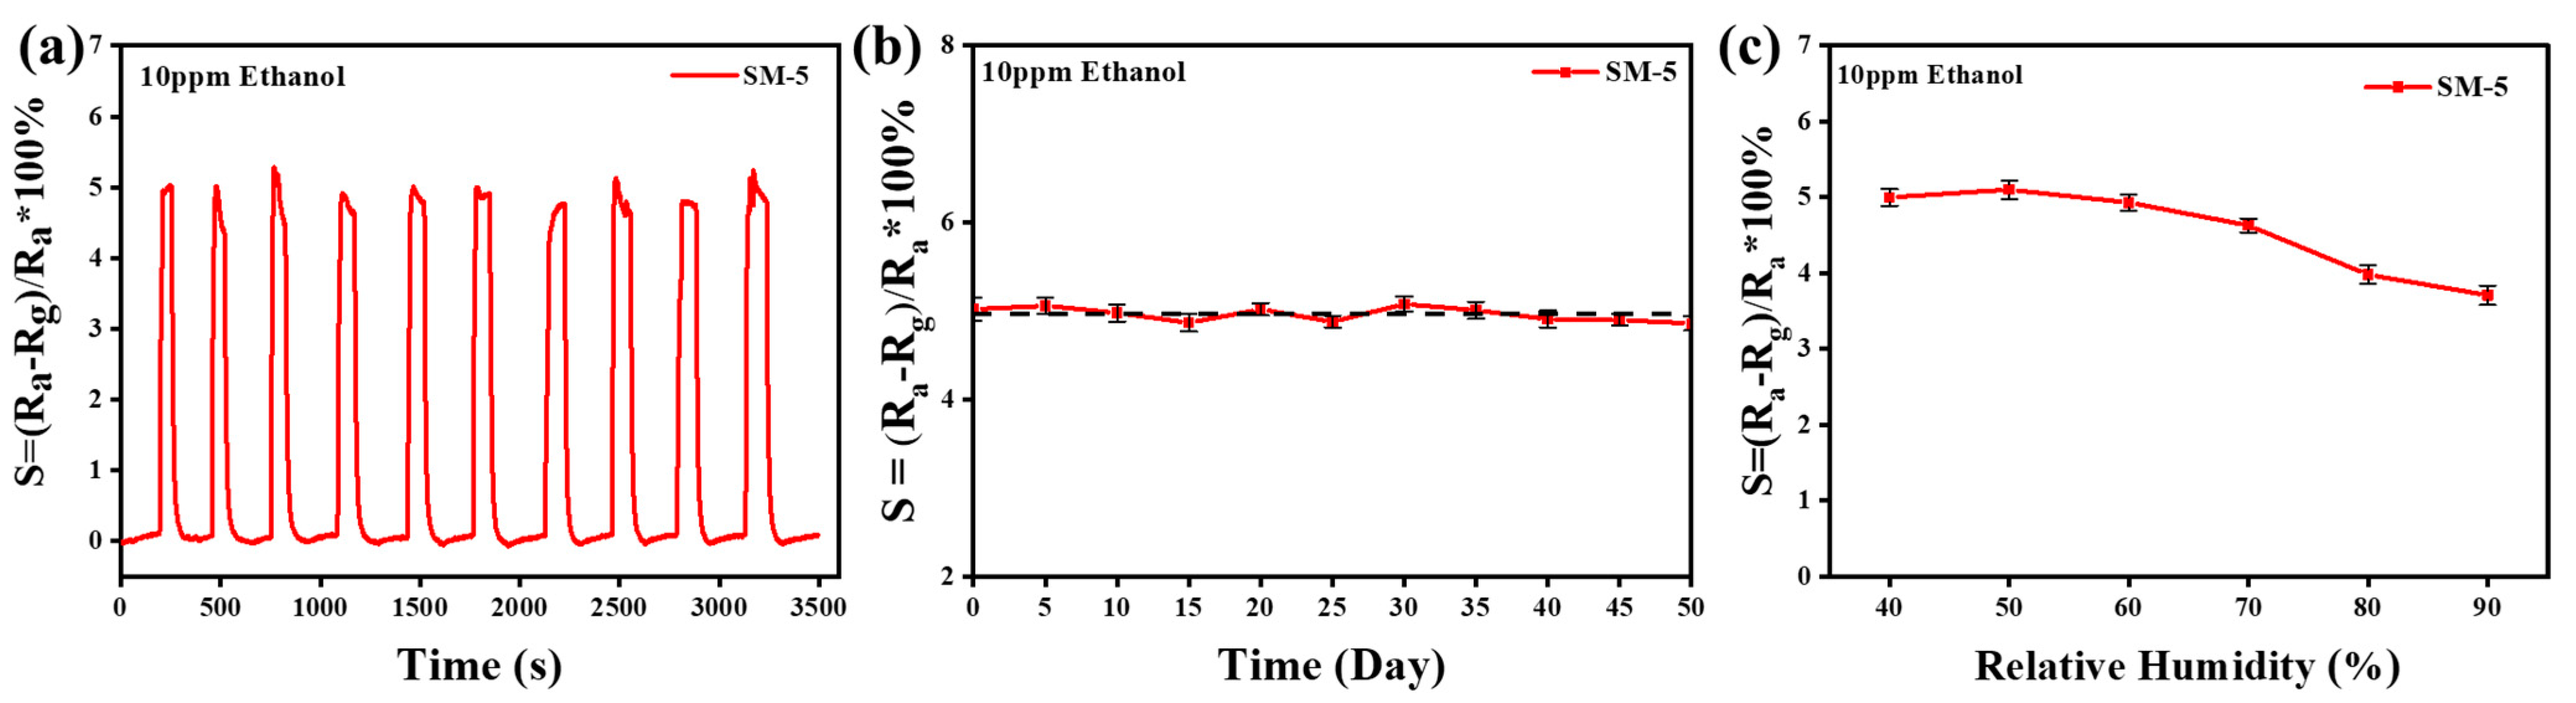
The stability tests are mainly divided into two types: short-term repeatability and long-term stability test. Here, we explored the stability of SM-5, and the test results are shown in Figure 8. Figure 8a shows the 10-cycle test of SM-5 on 10 ppm ethanol at 230 °C. It can be seen that there is no significant difference in the response values of several tests, indicating that the SM-5 sensor has excellent signal reproducibility and excellent short-term repeatability. Figure 8b reveals the long-term stability of SM-5 sensor tested every 5 days for 10 ppm ethanol under the same environmental conditions. It is found that even after 50 days, the signal of the sensor remains stable (S = 5.0 ± 0.14). Although there is little fluctuation during the period, there is no obvious drift or downward trend, implying its good long-term stability. Meanwhile the moisture resistance of the sensor has been tested. As shown in Figure 8c, the response value of the SM-5 sensor fluctuates slightly in the range of 40–60% RH, decreases significantly in the range of 60–80% RH and decreases slowly in the range of 80–90% RH. Even under the environmental conditions of 90% RH, the response value of SM-5 can still reach S = 3.7, which is only 1.3 lower than its maximum sensitivity, meaning that the sensor has certain moisture resistance.
3.3. Sensitive Mechanism
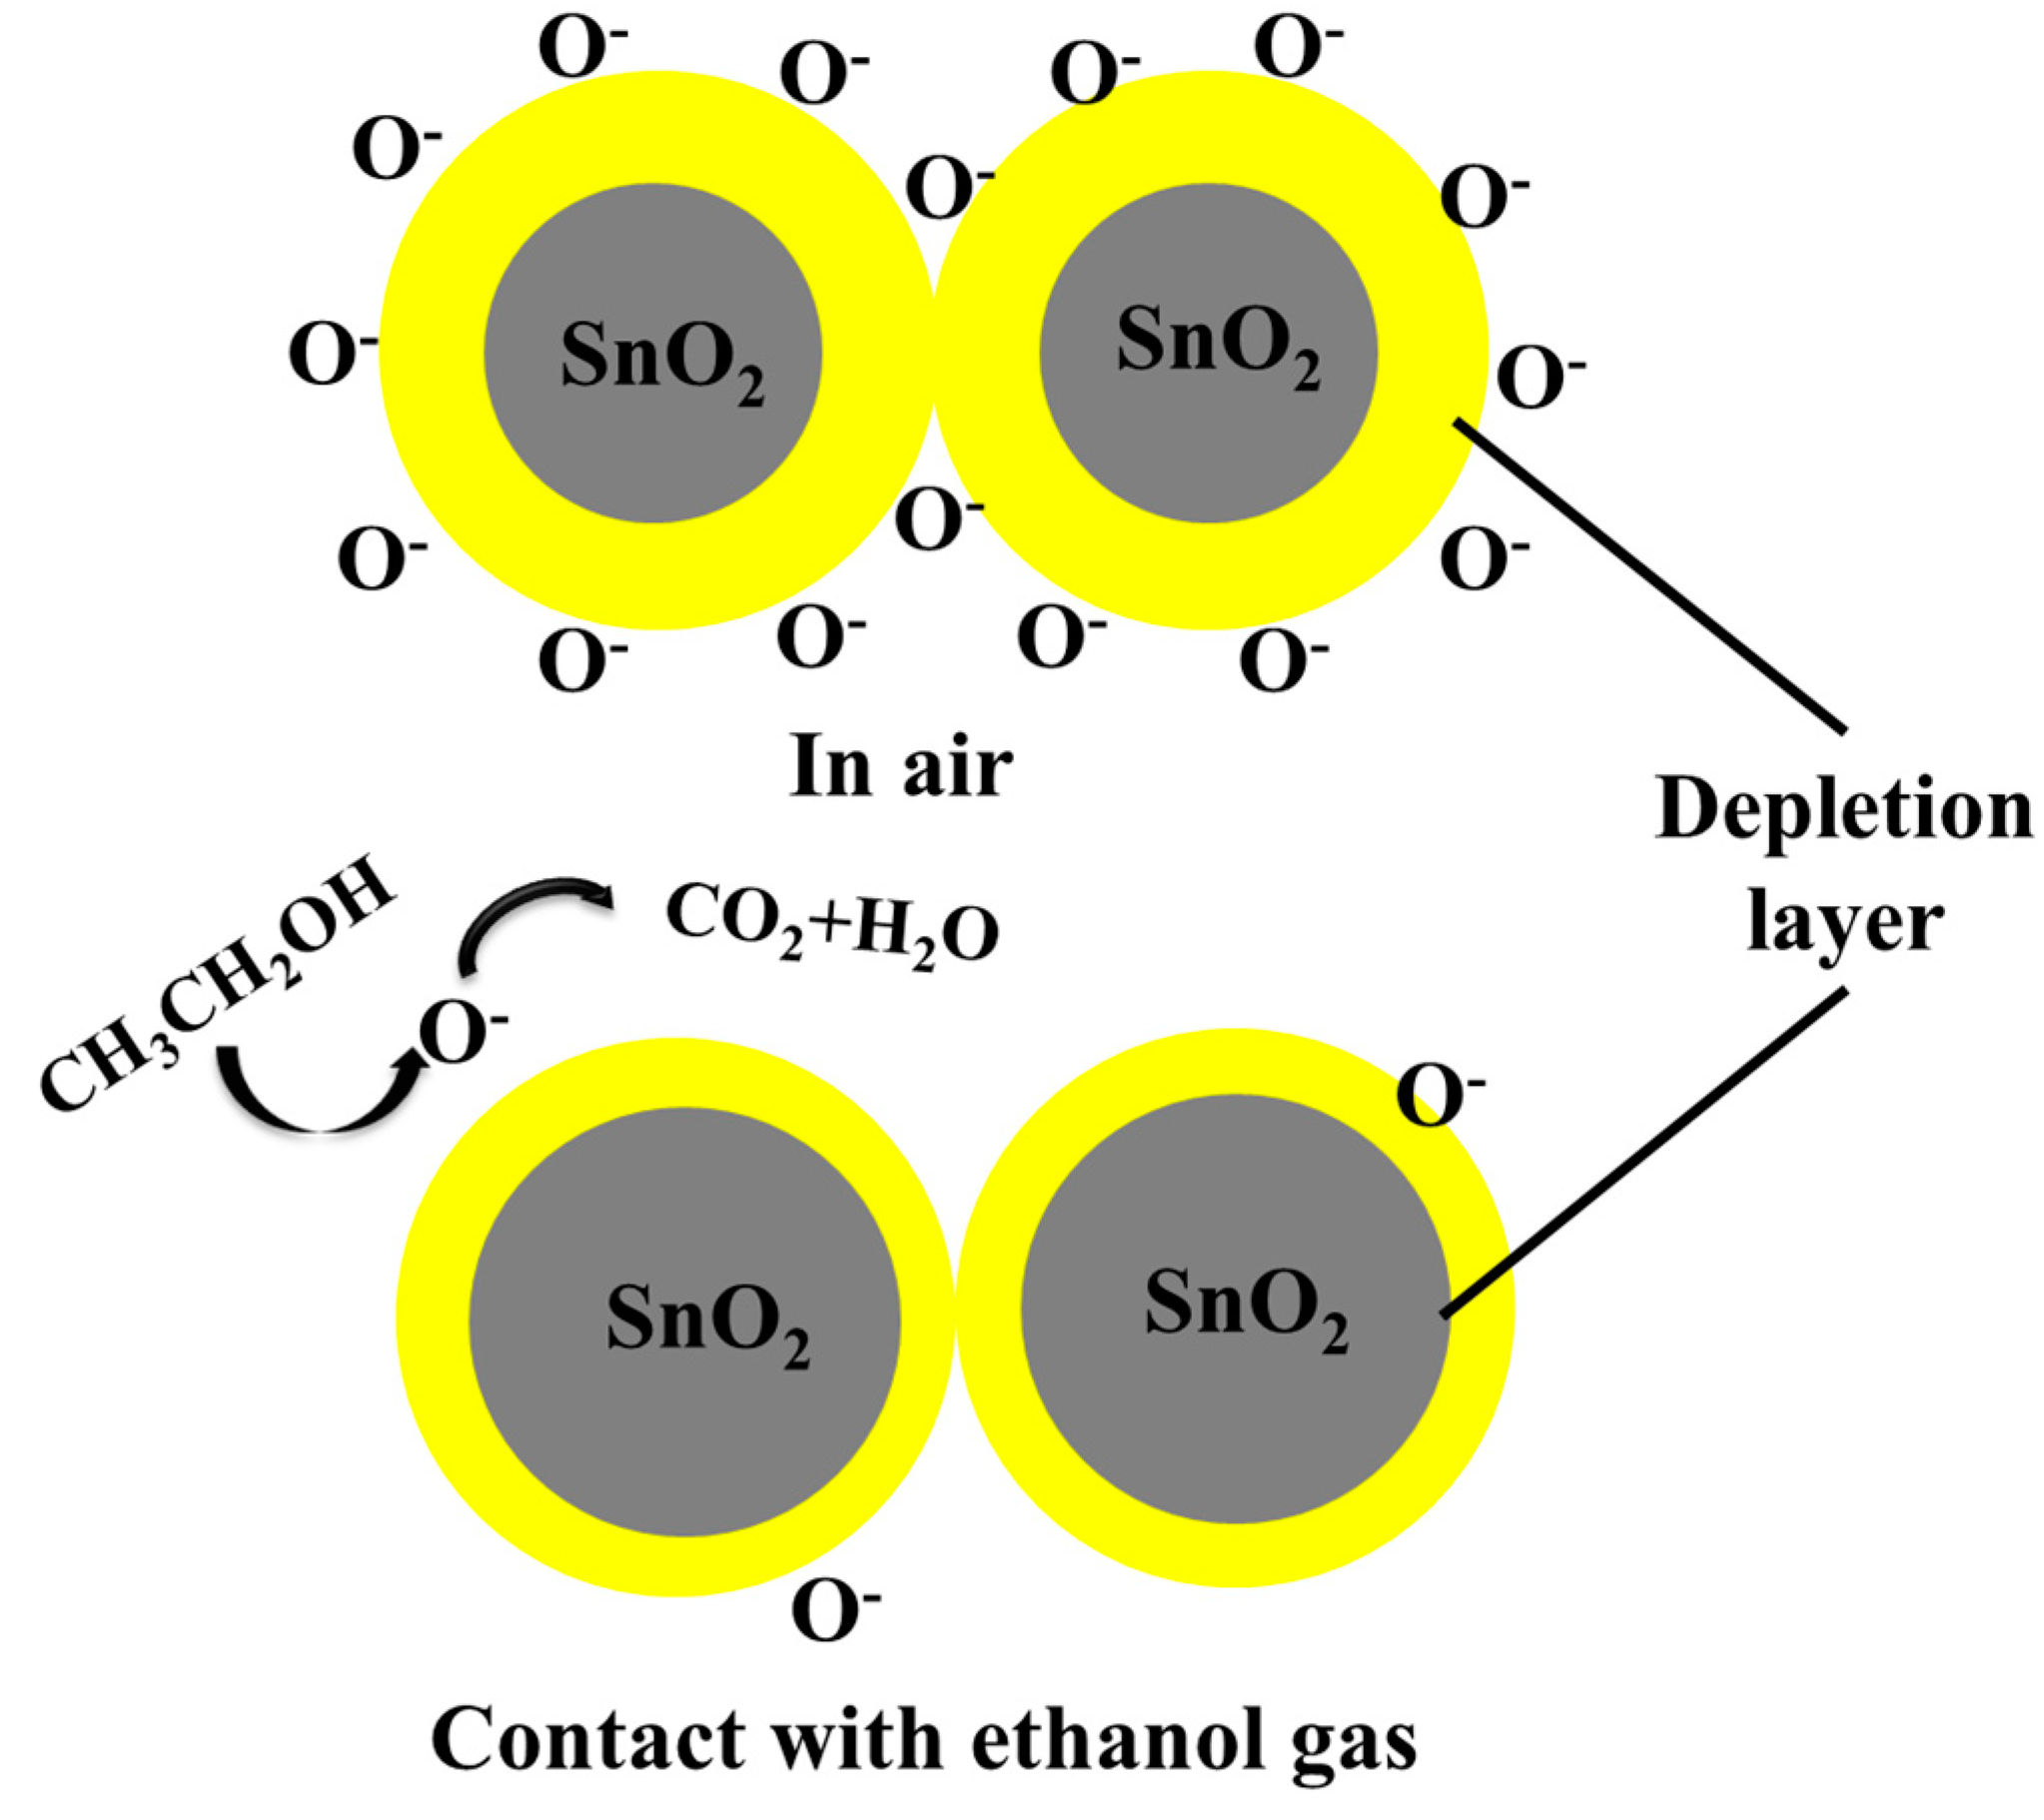
According to the above gas-sensing test results, the space charge or depletion layer model was used to explain and analyze the gas-sensing mechanism of SnO2. This is mainly due to the change of surface resistance caused by the adsorption and desorption of measured gas molecules. The simplified schematic diagram of the whole process is shown in Figure 9. SnO2 is a typical n-type semiconductor metal oxide. When SnO2 sensors are exposed in air, a large amount of O2 is adsorbed on the material surface. O2 molecules can capture electrons from the conduction band, further generate oxygen ions (O−) on the surface of SnO2 microspheres and form a thick space charge layer [52,53,54]. It caused the potential energy barrier of the material to increase and the material kept high resistance. When ethanol molecules react with O− on the surface of SnO2 microspheres to produce CO2 and H2O. Then, the electrons are released back to the conduction band of the sensor material, so that the space charge layer becomes thinner and the sensor resistance decreases. When the ethanol gas is completely separated from the sensor, O2 will re-adsorb on the SnO2 surface to restore its original high resistance. So far, the whole response recovery process is completed.
The contribution of ML-Ti3C2Tx to the ethanol-sensing performance of SnO2/MXene sensor can be explained as follows. Firstly, the surface of ML-Ti3C2Tx contains rich functional groups, such as -O, -OH and -F, which provides active sites for the nucleation and growth of SnO2. From SEM and TEM photographs, we can find that SnO2 microspheres are in close contact with the interlayer and surface of ML-Ti3C2Tx. Therefore, compared with SnO2 microspheres, SM-5 can provide more active sites, which is conducive to the adsorption of O2 and ethanol.
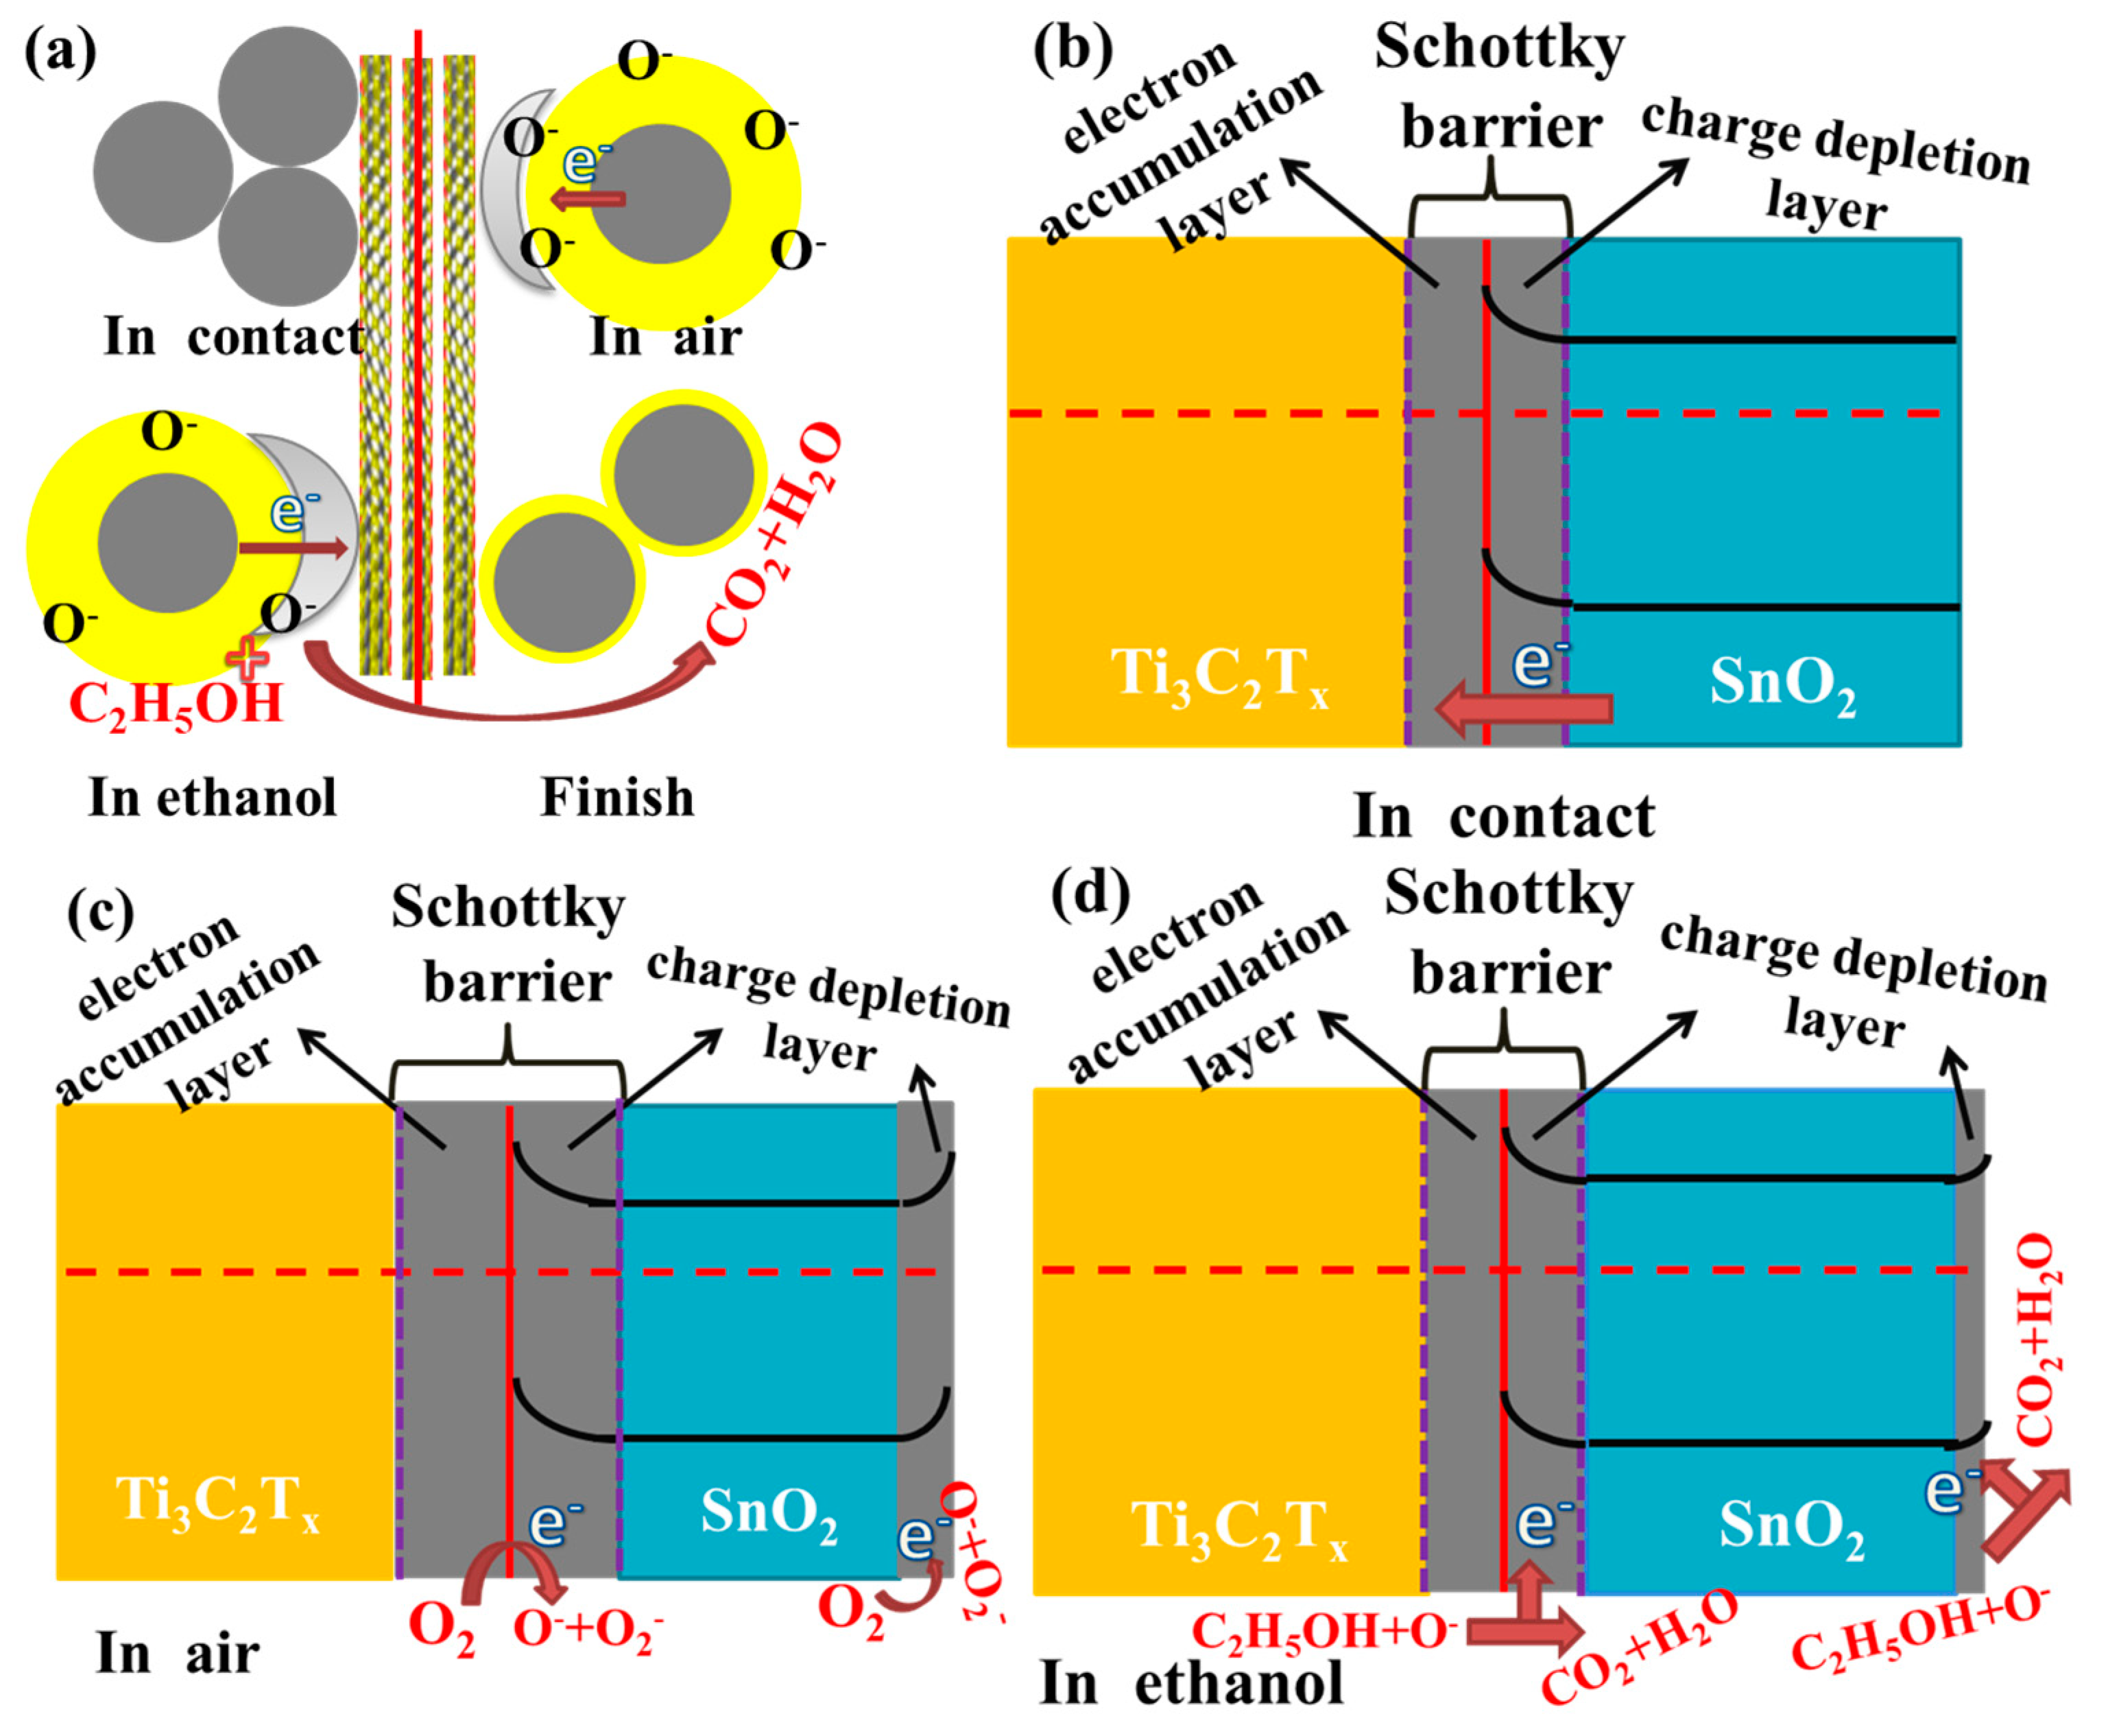
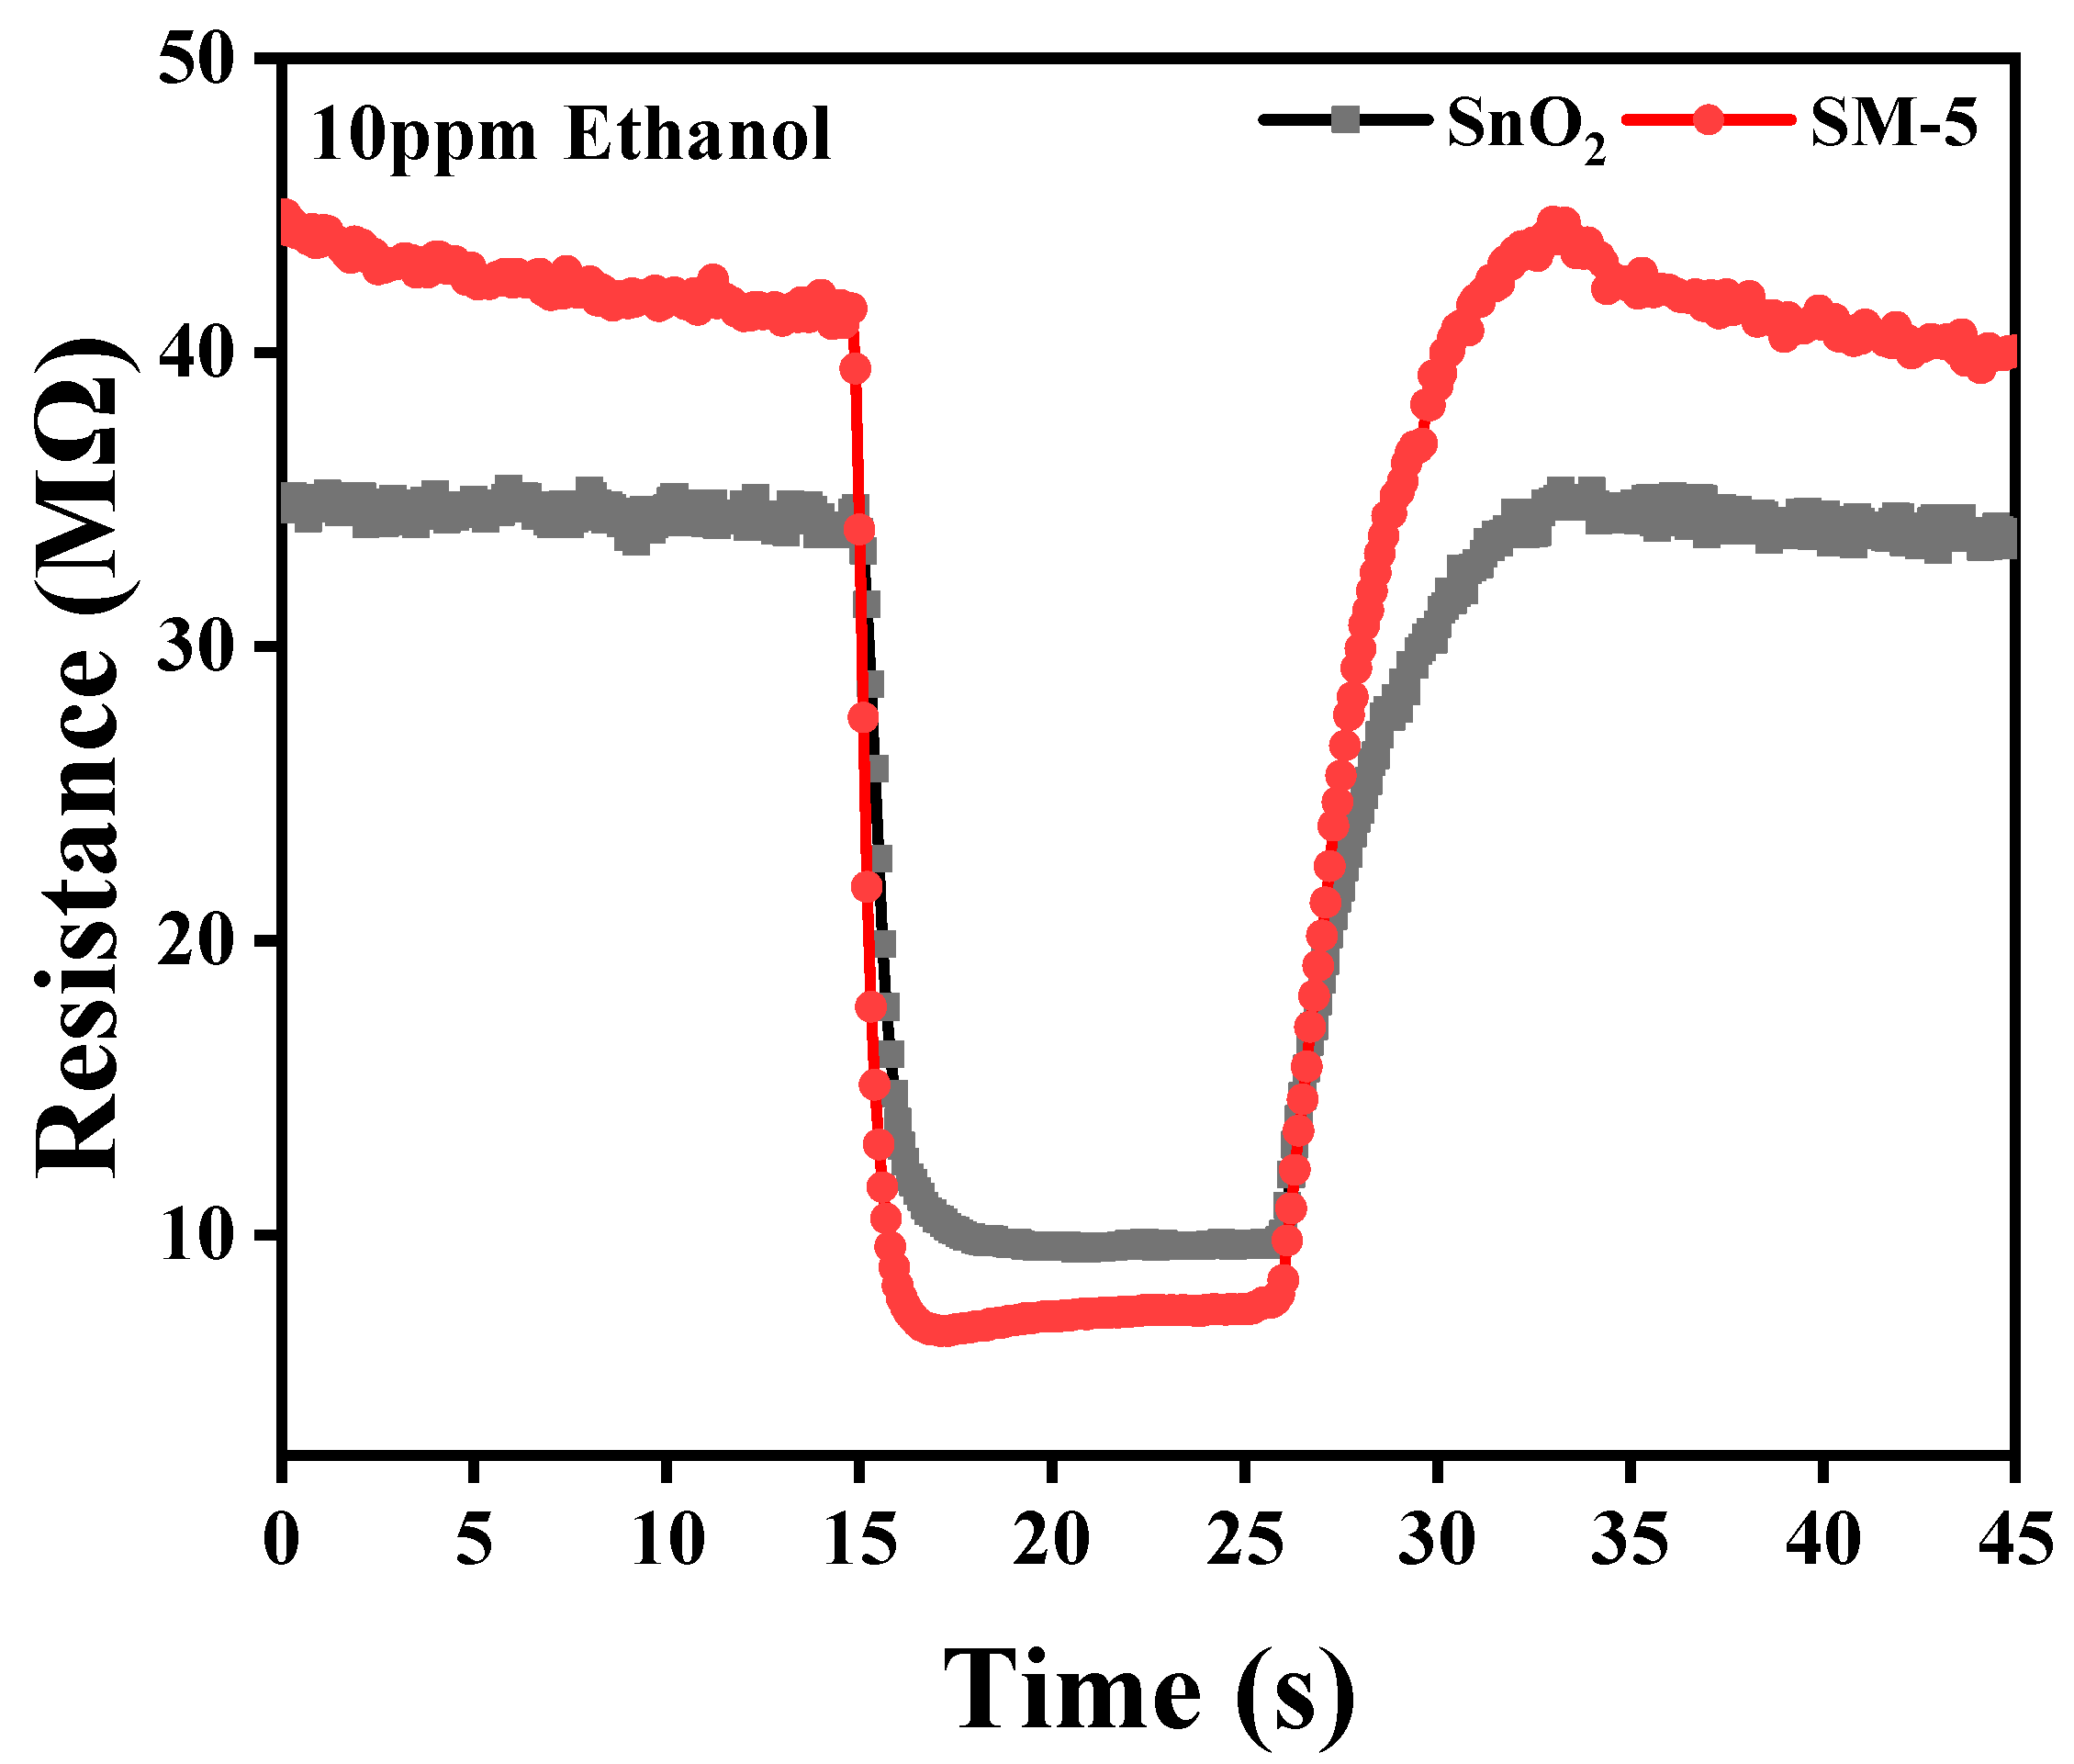
Secondly, as shown in Figure 10, a Schottky barrier can be formed between ML-Ti3C2Tx and SnO2 [55]. It is well known that Ti3C2Tx materials have high metal conductivity even in the presence of functional groups. In the composite, due to the metal properties and high work function of Ti3C2Tx, electrons from SnO2 conduction band migrate to Ti3C2Tx. Therefore, when they were contacted, a Schottky barrier will be established at the interface to make the Fermi energy levels equal, and the formation of the Schottky barrier may also lead to the bending of SnO2 energy band [55,56,57]. In the air, electrons will be captured by O2 molecules to form O− and O2−, which reduces the electron density at the SnO2/MXene [56,58,59,60]. This causes the Schottky barrier to thicken at the SnO2/MXene interface and due to the existence of Ti3C2Tx, the electron depletion layer of SnO2 becomes thicker, so that the resistance value of SM-5 sensor is larger than that of the SnO2 sensor (Figure 11). When the SnO2/MXene composites are exposed to ethanol gas, due to the reaction between ethanol molecules and oxygen ions, electrons will be released, and the electron depletion layer on the surface of SnO2 will become thinner, resulting in a reduction in the resistance of the SnO2/MXene sensor. Due to the existence of the Schottky barrier and the thinner electron depletion region of SnO2 when contacting the target gas, the SnO2/MXene sensor shows greater resistance change, leading to a higher response, compared with the SnO2 sensor exposed to ethanol.
In addition, the ML-Ti3C2Tx may support the conductive layer and make the charge carriers migrate faster from SnO2 on one side to SnO2 on the other side, which is conducive to rapid response and recovery speed, which is consistent with the experimental results. We also believe that the metal properties of Ti3C2Tx will play an important role in gas sensing, but excessive Ti3C2Tx will destroy the Schottky junction. Therefore, SM-5 sensors show better gas-sensing performance.
4. Conclusions
In summary, the multilayer MXene with an accordion-like structure was prepared successfully through an acid-etching process. Additionally, then SnO2/MXene composites were fabricated through a facile hydrothermal method. Microsphere SnO2 with uniform particle size is evenly distributed between the layers of MXene. The gas-sensing test results show that the gas response to ethanol of the SnO2 sensor is remarkably improved after combining MXene. Thereinto, the response value of the SM-5 sensor is over twice that of the pristine SnO2 sensor at 230 °C. Furthermore, the SM-5 sensor also has faster response and recovery speed. The enhanced gas-sensing performance of the SM-5 sensor can be attributed to the rich functional groups of MXene and the formation of the Schottky barrier. This solution could become guide ideas for new gas sensors in the future.
Supplementary Materials
The following supporting information can be downloaded at: https://0-www-mdpi-com.brum.beds.ac.uk/article/10.3390/chemosensors10030109/s1, Figure S1: MEMS gas sensor preparation flow chart; Figure S2: nitrogen adsorption desorption isotherms of ML-Ti3C2Tx.
Author Contributions
Conceptualization, methodology, validation, formal analysis, and visualization C.W. and R.L.; investigation, resources, data curation, writing—original draft preparation and writing—review and editing, C.W.; supervision, J.X. and L.F.; project administration, and funding acquisition, J.X. All authors have read and agreed to the published version of the manuscript.
Funding
Key Basic Research Program of Science and Technology Commission of Shanghai Municipality (20JC1415300).
Institutional Review Board Statement
Not applicable.
Informed Consent Statement
Not applicable.
Data Availability Statement
All data in this paper are obtained from the testing, analysis and calculation by the instruments described in this paper.
Acknowledgments
Thank you to Shenghao Wang for guiding some parts of the first manuscript and the students’ suggestions in the professional English class.
Conflicts of Interest
The authors declare no conflict of interest.
References
- Kadosaki, M.; Sakai, Y.; Tamura, I.; Matsubara, I.; Itoh, T. Development of an oxide semiconductor thick film gas sensor for the detection of total volatile organic compounds. Electron. Commun. Jpn. 2010, 93, 34–41. [Google Scholar] [CrossRef]
- Sheldon, R. Catalytic reactions in ionic liquids. Chem. Commun. 2001, 23, 2399–2407. [Google Scholar] [CrossRef] [PubMed]
- Whiteford, H.A.; Degenhardt, L.; Rehm, J.; Baxter, A.J.; Ferrari, A.J.; Erskine, H.E.; Charlson, F.J.; Norman, R.E.; Flaxman, A.D.; Johns, N.; et al. Global burden of disease attributable to mental and substance use disorders: Findings from the Global Burden of Disease Study 2010. Lancet 2013, 382, 1575–1586. [Google Scholar] [CrossRef]
- Rehm, J.; Mathers, C.; Popova, S.; Thavorncharoensap, M.; Teerawattananon, Y.; Patra, J. Global burden of disease and injury and economic cost attributable to alcohol use and alcohol-use disorders. Lancet 2009, 373, 2223–2233. [Google Scholar] [CrossRef]
- Matsuo, K. Gene-environment interaction between an aldehyde dehydrogenase-2 (ALDH2) polymorphism and alcohol consumption for the risk of esophageal cancer. Carcinogenesis 2001, 22, 913–916. [Google Scholar] [CrossRef] [Green Version]
- Luo, N.; Zhang, B.; Zhang, D.; Xu, J. Enhanced CO sensing properties of Pd modified ZnO porous nanosheets. Chin. Chem. Lett. 2020, 31, 2033–2036. [Google Scholar] [CrossRef]
- Wang, C.X.; Yin, L.W.; Zhang, L.Y.; Xiang, D.; Gao, R. Metal Oxide Gas Sensors: Sensitivity and Influencing Factors. Sensors 2010, 10, 2088–2106. [Google Scholar] [CrossRef] [Green Version]
- Korotcenkov, G. Metal oxides for solid-state gas sensors: What determines our choice? Mater. Sci. Eng. B 2007, 139, 1–23. [Google Scholar] [CrossRef]
- Barsan, N.; Koziej, D.; Weimar, U. Metal oxide-based gas sensor research: How to? Sens. Actuators B Chem. 2007, 121, 18–35. [Google Scholar] [CrossRef]
- Comini, E.; Baratto, C.; Faglia, G.; Ferroni, M.; Vomiero, A.; Sberveglieri, G. Quasi-one dimensional metal oxide semiconductors: Preparation, characterization and application as chemical sensors. Prog. Mater. Sci. 2009, 54, 1–67. [Google Scholar] [CrossRef]
- Asri, M.I.A.; Hasan, M.N.; Fuaad, M.R.A.; Yunos, Y.M.; Ali, M.S.M. MEMS Gas Sensors: A Review. IEEE Sens. J. 2021, 21, 18381–18397. [Google Scholar] [CrossRef]
- Luo, N.; Chen, Y.; Zhang, D.; Guo, M.; Xue, Z.; Wang, X.; Cheng, Z.; Xu, J. High-Sensitive MEMS Hydrogen Sulfide Sensor made from PdRh Bimetal Hollow Nanoframe Decorated Metal Oxides and Sensitization Mechanism Study. ACS Appl. Mater. Interfaces 2020, 12, 56203–56215. [Google Scholar] [CrossRef] [PubMed]
- Nazemi, H.; Joseph, A.; Park, J.; Emadi, A. Advanced Micro- and Nano-Gas Sensor Technology: A Review. Sensors 2019, 19, 1285. [Google Scholar] [CrossRef] [PubMed] [Green Version]
- Wang, J.; Yang, J.; Chen, D.; Jin, L.; Li, Y.; Zhang, Y.; Xu, L.; Guo, Y.; Lin, F.; Wu, F. Gas Detection Microsystem with MEMS Gas Sensor and Integrated Circuit. IEEE Sens. J. 2018, 18, 6765–6773. [Google Scholar] [CrossRef]
- Hasan, M.N.; Sahlan, S.; Osman, K.; Mohamed Ali, M.S. Energy Harvesters for Wearable Electronics and Biomedical Devices. Adv. Mater. Technol. 2021, 6, 6. [Google Scholar] [CrossRef]
- Bogue, R.; Du, H. MEMS sensors: Past, present and future. Sens. Rev. 2007, 27, 7–13. [Google Scholar] [CrossRef]
- Liu, H.; Zhang, L.; Li, K.H.H.; Tan, O.K. Microhotplates for Metal Oxide Semiconductor Gas Sensor Applications-Towards the CMOS-MEMS Monolithic Approach. Micromachines 2018, 9, 557. [Google Scholar] [CrossRef] [Green Version]
- Li, H.Y.; Lee, C.S.; Kim, D.H.; Lee, J.H. Flexible Room-Temperature NH3 Sensor for Ultrasensitive, Selective, and Humidity-Independent Gas Detection. ACS Appl. Mater. Interfaces 2018, 10, 27858–27867. [Google Scholar] [CrossRef]
- Batzill, M.; Diebold, U. The surface and materials science of tin oxide. Prog. Surf. Sci. 2005, 79, 47–154. [Google Scholar] [CrossRef]
- Li, G.; Kawi, S. MCM-41 modified SnO2 gas sensors: Sensitivity and selectivity properties. Sens. Actuators B Chem. 1999, 59, 1–8. [Google Scholar] [CrossRef]
- Wang, Y.; Zhao, Z.; Sun, Y.; Li, P.; Ji, J.; Chen, Y.; Zhang, W.; Hu, J. Fabrication and gas sensing properties of Au-loaded SnO2 composite nanoparticles for highly sensitive hydrogen detection. Sens. Actuators B Chem. 2017, 240, 664–673. [Google Scholar] [CrossRef]
- Ju, D.; Xu, H.; Xu, Q.; Gong, H.; Qiu, Z.; Guo, J.; Zhang, J.; Cao, B. High triethylamine-sensing properties of NiO/SnO2 hollow sphere P–N heterojunction sensors. Sens. Actuators B Chem. 2015, 215, 39–44. [Google Scholar] [CrossRef]
- Qiao, J.; Kong, L.; Xu, S.; Lin, K.; He, W.; Ni, M.; Ruan, Q.; Zhang, P.; Liu, Y.; Zhang, W.; et al. Research progress of MXene-based catalysts for electrochemical water-splitting and metal-air batteries. Energy Storage Mater. 2021, 43, 509–530. [Google Scholar] [CrossRef]
- Wu, M.; An, Y.; Yang, R.; Tao, Z.; Xia, Q.; Hu, Q.; Li, M.; Chen, K.; Zhang, Z.; Huang, Q.; et al. V2CTx and Ti3C2Tx MXenes Nanosheets for Gas Sensing. ACS Appl. Nano Mater. 2021, 4, 6257–6268. [Google Scholar] [CrossRef]
- Gogotsi, Y.; Anasori, B. The Rise of MXenes. ACS Nano 2019, 13, 8491–8494. [Google Scholar] [CrossRef] [Green Version]
- Zhao, Q.-N.; Zhang, Y.-J.; Duan, Z.-H.; Wang, S.; Liu, C.; Jiang, Y.-D.; Tai, H.-L. A review on Ti3C2Tx-based nanomaterials: Synthesis and applications in gas and humidity sensors. Rare Met. 2020, 40, 1459–1476. [Google Scholar] [CrossRef]
- Guo, Y.; Jin, S.; Wang, L.; He, P.; Hu, Q.; Fan, L.-Z.; Zhou, A. Synthesis of two-dimensional carbide Mo2CTx MXene by hydrothermal etching with fluorides and its thermal stability. Ceram. Int. 2020, 46, 19550–19556. [Google Scholar] [CrossRef]
- Wu, M.; He, Y.; Wang, L.; Xia, Q.; Zhou, A. Synthesis and electrochemical properties of V2C MXene by etching in opened/closed environments. J. Adv. Ceram. 2020, 9, 749–758. [Google Scholar] [CrossRef]
- Ghidiu, M.; Lukatskaya, M.R.; Zhao, M.Q.; Gogotsi, Y.; Barsoum, M.W. Conductive two-dimensional titanium carbide ‘clay’ with high volumetric capacitance. Nature 2014, 516, 78–81. [Google Scholar] [CrossRef]
- Lee, E.; VahidMohammadi, A.; Prorok, B.C.; Yoon, Y.S.; Beidaghi, M.; Kim, D.J. Room Temperature Gas Sensing of Two-Dimensional Titanium Carbide (MXene). ACS Appl. Mater. Interfaces 2017, 9, 37184–37190. [Google Scholar] [CrossRef]
- Li, R.; Fan, Y.; Ma, Z.; Zhang, D.; Liu, Y.; Xu, J. Controllable preparation of ultrathin MXene nanosheets and their excellent QCM humidity sensing properties enhanced by fluoride doping. Microchim. Acta 2021, 188, 81. [Google Scholar] [CrossRef] [PubMed]
- Yang, Z.J.; Zou, H.S.; Zhang, Y.Y.; Liu, F.M.; Wang, J.; Lv, S.Y.; Jiang, L.; Wang, C.G.; Yan, X.; Sun, P.; et al. The Introduction of Defects in Ti3C2Tx and Ti3C2Tx-Assisted Reduction of Graphene Oxide for Highly Selective Detection of ppb-Level NO2. Adv. Funct. Mater. 2021, 2108959. [Google Scholar] [CrossRef]
- Lee, E.; VahidMohammadi, A.; Yoon, Y.S.; Beidaghi, M.; Kim, D.J. Two-Dimensional Vanadium Carbide MXene for Gas Sensors with Ultrahigh Sensitivity Toward Nonpolar Gases. ACS Sens. 2019, 4, 1603–1611. [Google Scholar] [CrossRef] [PubMed]
- Zhang, Y.; Jiang, Y.; Duan, Z.; Huang, Q.; Wu, Y.; Liu, B.; Zhao, Q.; Wang, S.; Yuan, Z.; Tai, H. Highly sensitive and selective NO2 sensor of alkalized V2CTx MXene driven by interlayer swelling. Sens. Actuators B Chem. 2021, 334, 130150. [Google Scholar] [CrossRef]
- Wu, M.; Wang, B.; Hu, Q.; Wang, L.; Zhou, A. The Synthesis Process and Thermal Stability of V2C MXene. Materials 2018, 11, 2112. [Google Scholar] [CrossRef] [Green Version]
- Soomro, R.A.; Jawaid, S.; Zhu, Q.; Abbas, Z.; Xu, B. A mini-review on MXenes as versatile substrate for advanced sensors. Chin. Chem. Lett. 2020, 31, 922–930. [Google Scholar] [CrossRef]
- Wang, X.; Sun, K.; Li, K.; Li, X.; Gogotsi, Y. Ti3C2Tx/PEDOT:PSS hybrid materials for room-temperature methanol sensor. Chin. Chem. Lett. 2020, 31, 1018–1021. [Google Scholar] [CrossRef]
- Hermawan, A.; Zhang, B.; Taufik, A.; Asakura, Y.; Hasegawa, T.; Zhu, J.; Shi, P.; Yin, S. CuO Nanoparticles/Ti3C2Tx MXene Hybrid Nanocomposites for Detection of Toluene Gas. ACS Appl. Nano Mater. 2020, 3, 4755–4766. [Google Scholar] [CrossRef]
- Yang, Z.; Jiang, L.; Wang, J.; Liu, F.; He, J.; Liu, A.; Lv, S.; You, R.; Yan, X.; Sun, P.; et al. Flexible resistive NO2 gas sensor of three-dimensional crumpled MXene Ti3C2Tx/ZnO spheres for room temperature application. Sens. Actuators B Chem. 2021, 326, 128828. [Google Scholar] [CrossRef]
- Qi, Q.; Zhang, T.; Zheng, X.; Fan, H.; Liu, L.; Wang, R.; Zeng, Y. Electrical response of Sm2O3-doped SnO2 to C2H2 and effect of humidity interference. Sens. Actuators B Chem. 2008, 134, 36–42. [Google Scholar] [CrossRef]
- Qi, Q.; Zhang, T.; Wang, S.; Zheng, X. Humidity sensing properties of KCl-doped ZnO nanofibers with super-rapid response and recovery. Sens. Actuators B Chem. 2009, 137, 649–655. [Google Scholar] [CrossRef]
- Kim, H.-J.; Lee, J.-H. Highly sensitive and selective gas sensors using p-type oxide semiconductors: Overview. Sens. Actuators B Chem. 2014, 192, 607–627. [Google Scholar] [CrossRef]
- Kaneti, Y.V.; Zhang, Z.; Yue, J.; Zakaria, Q.M.D.; Chen, C.; Jiang, X.; Yu, A. Crystal plane-dependent gas-sensing properties of zinc oxide nanostructures: Experimental and theoretical studies. Phys. Chem. Chem. Phys. 2014, 16, 11471–11480. [Google Scholar] [CrossRef]
- Bhattacharyya, P.; Basu, P.K.; Mondal, B.; Saha, H. A low power MEMS gas sensor based on nanocrystalline ZnO thin films for sensing methane. Microelectron. Reliab. 2008, 48, 1772–1779. [Google Scholar] [CrossRef]
- Massie, C.; Stewart, G.; McGregor, G.; Gilchrist, J.R. Design of a portable optical sensor for methane gas detection. Sens. Actuators B Chem. 2006, 113, 830–836. [Google Scholar] [CrossRef]
- Tyagi, P.; Sharma, A.; Tomar, M.; Gupta, V. Low temperature operated NiO-SnO2 heterostructured SO2 gas sensor. AIP Conf. Proc. 2016, 1724, 020077. [Google Scholar]
- Li, W.; Ma, S.; Li, Y.; Yang, G.; Mao, Y.; Luo, J.; Gengzang, D.; Xu, X.; Yan, S. Enhanced ethanol sensing performance of hollow ZnO–SnO2 core–shell nanofibers. Sens. Actuators B Chem. 2015, 211, 392–402. [Google Scholar] [CrossRef]
- Bai, S.; Li, D.; Han, D.; Luo, R.; Chen, A.; Chung, C.L. Preparation, characterization of WO3–SnO2 nanocomposites and their sensing properties for NO2. Sens. Actuators B Chem. 2010, 150, 749–755. [Google Scholar] [CrossRef]
- Jin, W.X.; Ma, S.Y.; Tie, Z.Z.; Wei, J.J.; Luo, J.; Jiang, X.H.; Wang, T.T.; Li, W.Q.; Cheng, L.; Mao, Y.Z. One-step synthesis and highly gas-sensing properties of hierarchical Cu-doped SnO2 nanoflowers. Sens. Actuators B Chem. 2015, 213, 171–180. [Google Scholar] [CrossRef]
- Yang, X.; Li, H.; Li, T.; Li, Z.; Wu, W.; Zhou, C.; Sun, P.; Liu, F.; Yan, X.; Gao, Y.; et al. Highly efficient ethanol gas sensor based on hierarchical SnO2/Zn2SnO4 porous spheres. Sens. Actuators B Chem. 2019, 282, 339–346. [Google Scholar] [CrossRef]
- Bagal, L.K.; Patil, J.Y.; Mulla, I.S.; Suryavanshi, S.S. Influence of Pd-loading on gas sensing characteristics of SnO2 thick films. Ceram. Int. 2012, 38, 4835–4844. [Google Scholar] [CrossRef]
- Shaalan, N.M.; Rashad, M.; Abdel-Rahim, M.A. Repeatability of indium oxide gas sensors for detecting methane at low temperature. Mater. Sci. Semicond. Process. 2016, 56, 260–264. [Google Scholar] [CrossRef]
- Lee, D.-D.; Chung, W.-Y.; Sohn, B.-K. High sensitivity and selectivity methane gas sensors doped with Rh as a catalyst. Sens. Actuators B Chem. 1993, 13, 252–255. [Google Scholar] [CrossRef]
- Haridas, D.; Gupta, V. Enhanced response characteristics of SnO2 thin film based sensors loaded with Pd clusters for methane detection. Sens. Actuators B Chem. 2012, 166–167, 156–164. [Google Scholar] [CrossRef]
- Park, S.; Ko, H.; Kim, S.; Lee, C. Role of the interfaces in multiple networked one-dimensional core-shell nanostructured gas sensors. ACS Appl. Mater. Interfaces 2014, 6, 9595–9600. [Google Scholar] [CrossRef]
- Xu, Q.; Ju, D.; Zhang, Z.; Yuan, S.; Zhang, J.; Xu, H.; Cao, B. Near room-temperature triethylamine sensor constructed with CuO/ZnO P-N heterostructural nanorods directly on flat electrode. Sens. Actuators B Chem. 2015, 225, 16–23. [Google Scholar] [CrossRef]
- Miller, D.R.; Akbar, S.A.; Morris, P.A. Nanoscale metal oxide-based heterojunctions for gas sensing: A review. Sens. Actuators B-Chem. 2014, 204, 250–272. [Google Scholar] [CrossRef]
- Shaalan, N.M.; Hamad, D.; Aljaafari, A.; Abdel-Latief, A.Y.; Abdel-Rahim, M.A. Preparation and Characterization of Developed CuxSn1-xO2 Nanocomposite and Its Promising Methane Gas Sensing Properties. Sensors 2019, 19, 2257. [Google Scholar] [CrossRef] [Green Version]
- Tian, Y.; Li, J.; Xiong, H.; Dai, J. Controlled synthesis of ZnO hollow microspheres via precursor-template method and its gas sensing property. Appl. Surf. Sci. 2012, 258, 8431–8438. [Google Scholar] [CrossRef]
- Wei, S.; Zhou, M.; Du, W. Improved acetone sensing properties of ZnO hollow nanofibers by single capillary electrospinning. Sens. Actuators B Chem. 2011, 160, 753–759. [Google Scholar] [CrossRef]
Figure 1.
(a) Physical diagram of MEMS test platform, gas sensor and temperature control heating plate (b) schematic diagram of heating and test circuit (c) components and structure diagram of MEMS chip.
Figure 1.
(a) Physical diagram of MEMS test platform, gas sensor and temperature control heating plate (b) schematic diagram of heating and test circuit (c) components and structure diagram of MEMS chip.

Figure 2.
XRD diffraction patterns of as-prepared samples.

Figure 3.
(a–c) SEM of SnO2, multilayer MXene and SM-5; (d–f) Corresponding TEM diagrams of SnO2, multilayer MXene and SM-5; (g–i) SEM images of different material ratios SM-10, SM-5 and SM-2.
Figure 3.
(a–c) SEM of SnO2, multilayer MXene and SM-5; (d–f) Corresponding TEM diagrams of SnO2, multilayer MXene and SM-5; (g–i) SEM images of different material ratios SM-10, SM-5 and SM-2.

Figure 4.
(a–d) Nitrogen adsorption desorption isotherms of SnO2, SM-10, SM-5 and SM-2.

Figure 5.
Gas-sensing properties of SnO2 microspheres and their composites. (a) Response sensitivity to 10 ppm ethanol at different temperatures; (b) Response value to 10 ppm different gases at the optimal working temperature of 230 °C.
Figure 5.
Gas-sensing properties of SnO2 microspheres and their composites. (a) Response sensitivity to 10 ppm ethanol at different temperatures; (b) Response value to 10 ppm different gases at the optimal working temperature of 230 °C.

Figure 6.
(a) Dynamic response recovery curves of four gas sensors to 0.5–50 ppm ethanol. (b) Logarithmic fitting curve of response value of four gas sensors to 0.5–30 ppm ethanol.
Figure 6.
(a) Dynamic response recovery curves of four gas sensors to 0.5–50 ppm ethanol. (b) Logarithmic fitting curve of response value of four gas sensors to 0.5–30 ppm ethanol.

Figure 7.
(a,b) Response recovery curves of SnO2 and SM-5 to 10 ppm ethanol.

Figure 8.
Overall, 10 ppm ethanol for (a) the short-term stability test of SM-5 sensor. (b) The long-term stability test of SM-5 sensor. (c) The relative humidity of 40% to 90% test of SM-5 sensor.
Figure 8.
Overall, 10 ppm ethanol for (a) the short-term stability test of SM-5 sensor. (b) The long-term stability test of SM-5 sensor. (c) The relative humidity of 40% to 90% test of SM-5 sensor.

Figure 9.
Schematic diagram of surface resistance control model of SnO2 sensor.

Figure 10.
Schematic diagram of the sensitivity mechanism of the SnO2/MXene sensor. (a) An explanation of the whole process. (b) The formation and change process of composite materials. (c) Composite materials in the air. (d) Composite materials in the ethanol.
Figure 10.
Schematic diagram of the sensitivity mechanism of the SnO2/MXene sensor. (a) An explanation of the whole process. (b) The formation and change process of composite materials. (c) Composite materials in the air. (d) Composite materials in the ethanol.

Figure 11.
Schematic diagram of the sensitivity mechanism of the SnO2/MXene sensor.


Table 1.
Optimum working temperature of different SnO2 composites.
| Gas-Sensing Materials | Optimum Working Temperature | Measured Gas | Reference |
|---|---|---|---|
| SnO2 nanofibers | 160–180 °C | NO2 | [47] |
| ZnO–SnO2 core–shell nanofibers | 200 °C | Ethanol | [48] |
| WO3–SnO2 nanocomposites | 200 °C | NO2 | [49] |
| Cu-doped SnO2 nanoflowers | 260 °C | Acetone | [50] |
| SnO2/Zn2SnO4 porous spheres | 250 °C | Ethanol | [51] |
| Pd-loading SnO2 | 250 °C | Liquefied Petroleum Gas (LPG) | [52] |
Table 2.
The values of A, B, and C in Formula (3) of the fitting curves of different sensors.
| Gas Sensors | A | B | C |
|---|---|---|---|
| SnO2 | 0.242 | 0.259 | |
| SM10 | 0.349 | 0.283 | |
| SM5 | 0.767 | 0.542 | −0.00767 ± 0.0021 |
| SM2 | 0.571 | 0.320 |
Publisher’s Note: MDPI stays neutral with regard to jurisdictional claims in published maps and institutional affiliations. |
© 2022 by the authors. Licensee MDPI, Basel, Switzerland. This article is an open access article distributed under the terms and conditions of the Creative Commons Attribution (CC BY) license (https://creativecommons.org/licenses/by/4.0/).
Share and Cite
MDPI and ACS Style
Wang, C.; Li, R.; Feng, L.; Xu, J. The SnO2/MXene Composite Ethanol Sensor Based on MEMS Platform. Chemosensors 2022, 10, 109. https://0-doi-org.brum.beds.ac.uk/10.3390/chemosensors10030109
AMA Style
Wang C, Li R, Feng L, Xu J. The SnO2/MXene Composite Ethanol Sensor Based on MEMS Platform. Chemosensors. 2022; 10(3):109. https://0-doi-org.brum.beds.ac.uk/10.3390/chemosensors10030109
Chicago/Turabian StyleWang, Chen, Runlong Li, Lingyan Feng, and Jiaqiang Xu. 2022. "The SnO2/MXene Composite Ethanol Sensor Based on MEMS Platform" Chemosensors 10, no. 3: 109. https://0-doi-org.brum.beds.ac.uk/10.3390/chemosensors10030109
Note that from the first issue of 2016, this journal uses article numbers instead of page numbers. See further details here.