Article

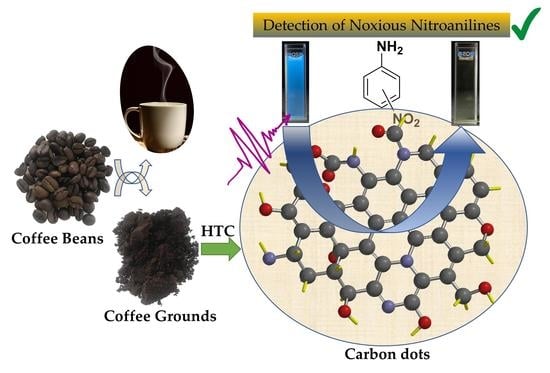
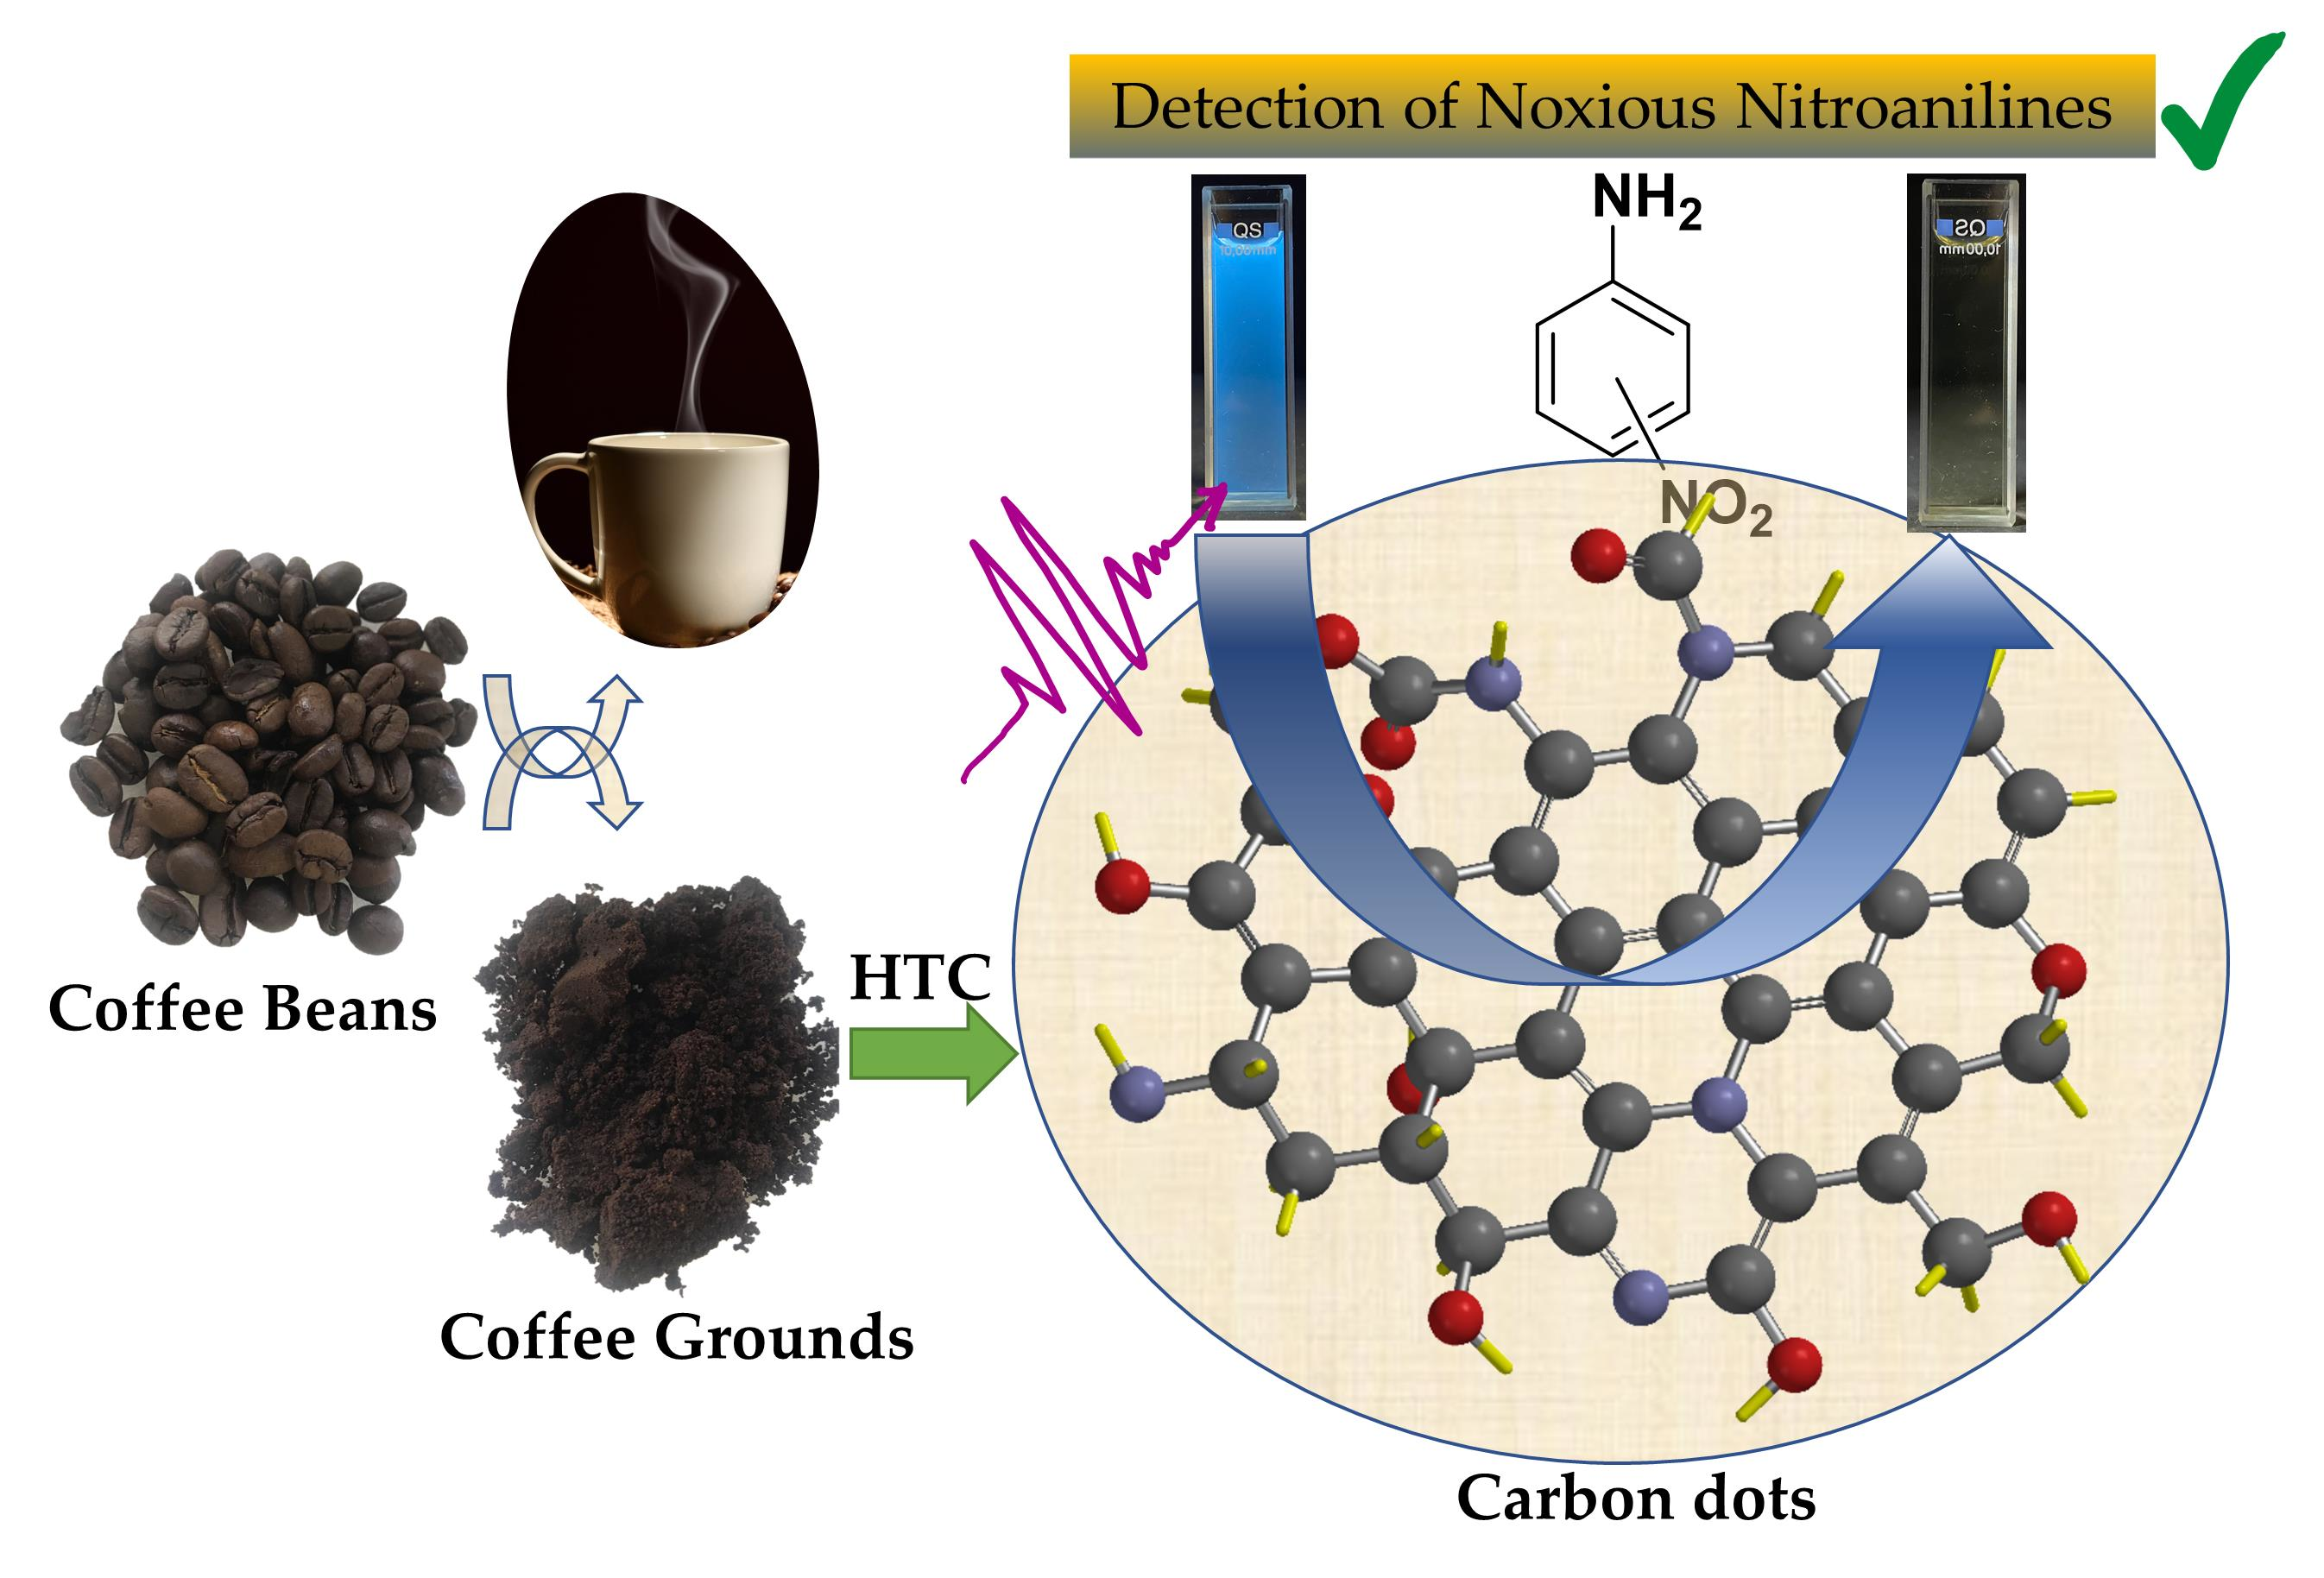
Carbon Dots from Coffee Grounds: Synthesis, Characterization, and Detection of Noxious Nitroanilines

by
Alexandra I. Costa
1,2,
Patrícia D. Barata
1,2,
Bianca Moraes
1,† and
José V. Prata
1,2,*
1
Departamento de Engenharia Química, Instituto Superior de Engenharia de Lisboa, Instituto Politécnico de Lisboa, R. Conselheiro Emídio Navarro 1, 1959-007 Lisboa, Portugal
2
Centro de Química-Vila Real, Universidade de Trás-os-Montes e Alto Douro, 5001-801 Vila Real, Portugal
*
Author to whom correspondence should be addressed.
Present address: Consultoria Técnica e Representações, Lda., 2135-325 Samora Correia, Portugal.
Submission received: 30 January 2022 / Revised: 10 March 2022 / Accepted: 11 March 2022 / Published: 15 March 2022

Abstract

:
Coffee ground (CG) waste is generated in huge amounts all over the world, constituting a serious environmental issue owing to its low biodegradability. Therefore, processes that simultaneously aim for its valorization while reducing its environmental impact are in great demand. In the current approach, blue luminescent carbon dots (C-dots) were produced in good chemical yields from CGs following hydrothermal carbonization methods under an extended set of reaction parameters. The remarkable fluorescent properties of the synthesized C-dots (quantum yields up to 0.18) allied to their excellent water dispersibility and photostability prompted their use for the first time as sensing elements for detection of noxious nitroanilines (NAs) in aqueous media. Very high levels of NA detection were achieved (e.g., limit of detection of 68 ppb for p-nitroaniline), being the regioisomeric selectivity attributed to its higher hyperpolarizability and dipole moment. Through ground–state and time-resolved fluorescence assays, a static fluorescence quenching mechanism was established. 1H NMR titration data also strongly suggested the formation of ground–state complexes between C-dots and NAs.

Graphical Abstract

1. Introduction

Environmental pollution continues to be one of the main global challenges resulting from the presence of contaminants with severe impact on human health and the environment. To improve strategies for polluted areas’ remediation, it is necessary to increase the efficiency of conventional detection/removal of pollutants methodologies or to create innovative approaches. In this context, luminescent carbon nanomaterials obtained from renewable agricultural, industrial, and urban wastes have been disclosed as important tools in several schemes of pollutant sensing in a diversity of environments [1,2,3,4,5].
Carbon dots (C-dots), a new kind of carbon-based fluorescent nanomaterials, were first serendipitously discovered during the purification of single-walled carbon nanotubes [6]. Considerable attention and interest has been devoted to such nanomaterials by the scientific community, and considerable progress has been accomplished in their synthesis and application over the last years [7,8,9]. C-dots are generally characterized as zero-dimensional carbon nanoparticles with sizes below 10 nm, endowed with outstanding optical properties, water solubility, good biocompatibility, and low cytotoxicity [9,10,11]. These features, allied to their flexibility of surface modification/functionalization, and, in some cases, to simple and inexpensive production processes from abundant low-cost carbon sources, have driven the study of many types of C-dots in the fields of biomedicine [12,13,14], (photo)catalysis [13,15], bio(sensing) [8,9,10,11,13,16], optoelectronics [17], and materials science [18].
Synthetic routes for C-dots are generally classified into two categories: bottom-up and top-down methodologies. In the former, C-dots are typically synthesized from small molecules (e.g., citric acid, glycerol, glucose, and aromatic amines) using solvopyrolytic processes; in the latter case, laser ablation, electrochemical oxidation, and arc discharge techniques are usually employed, having carbon materials (e.g., graphite, carbon fiber, carbon nanotubes, and carbon black) as precursors [19,20,21]. The first approach is also generally followed when wastes are employed as the main sources of C/N/S for C-dots synthesis [7]. Waste biomaterials (e.g., fruit and vegetables peels, seeds, and shells) [21,22], forestry and agricultural biomass [23], and industrial wastes (e.g., plastic, oil, and paper) [24] have been used for this purpose, in some cases contributing to an effective valorization of these residues. Many examples of carbon dots obtained from fruit peel and juice with direct application in transition metal cation detection, such as Fe(III), Cu(II), Hg(II), Pb(II), and Ni(II), can be found in the literature [7,25]. Fluorescent C-dots produced from plant cytoplasm have demonstrated high selectivity in the detection of p-nitroaniline in soil and groundwater [26], while the use of wastewaters from cork boiling [27,28] and olive oil industrial processing [29,30] in C-dots synthesis, with proven application in the detection of (bio)molecules (e.g., hemoglobin and cytochrome c), was recently demonstrated.
Another example of biomass material with a strong impact on waste production is that generated by the coffee industry and its derived products. Coffee is one of the most important agro-industrial products with a world estimated production of 10.2 million tons in 2021 [31]. It is one of the most consumed beverages all over the world, generating large amounts of waste with high contents of organic matter (e.g., caffeine, tannins, and free small phenolic compounds) of low biodegradability, and being noxious to many forms of life in addition to a global environmental issue [2,32,33]. The high consumption of brewed coffee generates large amounts of coffee ground (CG; also called spent coffee grounds) waste, reaching approximately 6 million tons per year [34]. From the growing concern about this environmental problem, efforts to reuse these wastes in diverse applications have been applied, for example, in the food industry (e.g., nutraceutical products, mushroom production), biogas production, and as organic fertilizers and animal feeds [32,33,35]. Removal of lead ions in drinking water by coffee beans (CBs) and CG wastes have been studied [34] as well as the use of porous carbons derived from CBs for the photocatalytic production of hydrogen and electrocatalytic oxygen reduction reactions [36].
The valorization of CGs aiming to produce carbon-based nanomaterials have also been investigated, although to a much lesser extent. The first report on this date back to 2012 [37], where blue luminescent C-dots having a quantum yield of 0.038 were used for cell imaging and detection of angiotensin I and insulin by surface-assisted laser desorption/ionization-mass spectrometry. The C-dots were prepared by carbonization of CG powders in air at 300 °C for 2 h. More recent reports include HeLa cell imaging and Fe(III)/Cu(II) detection [38,39], removal of water pollutants by C-dot-reduced graphene oxide (rGO) hybrids [40], detection of sodium cyclamate in food [41], and anti-counterfeiting applications [42].
Herein, we report the synthesis of C-dots from CGs originating from several CB brands following simple and sustainable hydrothermal carbonization (HTC) and microwave-assisted HTC approaches using a comprehensive set of reaction parameters and, for the first time, detailed studies concerning their use as photoluminescent sensors for detection of noxious nitroanilines in aqueous media.

2. Materials and Methods

2.1. Materials

Coffee grounds of several trademarks (Sical® Vending (CGsSV), Camelo® Qattara El Dorado (CGsCQ), and Nicola® Premium (CGsNP) blends) were collected from vending machines and coffee shops located at the Instituto Superior de Engenharia de Lisboa, Lisbon campus, Portugal. After collection, the CGs were dried in an oven at 60 °C until constant weight and stored refrigerated at −5 °C in polyethylene boxes until use. Virgin coffee beans (CBs; CBsSV, CBsCQ, and CBsNP, respectively) were also used for assessment.
Gallic acid (97.5%, Sigma, Sigma–Aldrich Corp., St. Louis, MO, USA), tannic acid (pure, Carlo Erba, Milan, Italy), vanillin (99%, Merck, Darmstadt, Germany), β-D-glucose monohydrate (for biochemistry and microbiology, Merck, Darmstadt, Germany), quercetin.2H2O (crystallized, Merck, Darmstadt, Germany), quinine hemisulphate monohydrate (>98%, Fluka, St. Louis, MO, USA), ethylenediamine (ED, >99.5%, Fluka, Sigma–Aldrich Corp., St. Louis, MO, USA), melamine (99%, Acros Organics, Bvba, Belgium), diethylenetriamine (DET, 99%, Sigma–Aldrich Corp., St. Louis, MO, USA), ortho-nitroaniline (o-NA; 98%, Acros Organics, Bvba, Belgium), meta-nitroaniline (m-NA; 99%, Acros Organics, Bvba, Belgium), and para-nitroaniline (p-NA; 99%, BDH, Poole, England) were used as received. Urea was recrystallized from ethanol. All other reagents and solvents were of analytical grade and were purified and/or dried by standard methods.
Ultrapure water (Milli-Q, Millipore; Merck KGaA, Darmstadt, Germany) was used in all experiments.

2.2. Characterization of CGs and CBs

CGs and CBs (20 g each) were subject to solid–liquid extraction (Soxhlet apparatus); the water extracts were evaporated to dryness and dried under vacuum at 105 °C for approximately 12 h, yielding the total solids in the aqueous extracts (TS-WE). The analytical determinations of total phenols, flavonoids, total carbohydrates, and proteins were conducted in triplicate using the above water extracts. The Folin–Ciocalteu method [43,44] was applied for total phenols evaluation using reference standards of gallic acid, tannic acid, and vanillin (concentration from 75 to 250 μg/mL). The flavonoids content was estimated by spectrometric procedure [45] using quercetin as the standard (concentration range 5–75 μg/mL). The total carbohydrates content was evaluated by a spectrometric method adapted from the literature, using β-D-glucose as a reference standard in a concentration range of 10–50 μg/mL [46]. Using bovine serum albumin (BSA) as a reference standard in a concentration range of 2–50 μg/mL, the proteins content was determined [47]. Lipids were quantified by Soxhlet extraction of CGs and CBs (16 g each) using n-hexane (300 mL) as a solvent. The n-hexane extract was dried over anhydrous magnesium sulphate, filtered, evaporated, and dried under vacuum at 25 °C. The ashes were quantified using a procedure from the literature [48], using a certain amount of dried CGs (or CBs). The samples (assays in triplicate) were heated at 600 °C for 6 h. The CHNS contents of CGs and CBs were determined by microanalysis (see below).

2.3. Instruments and Methods

The FTIR spectra were measured on a Bruker Vertex 70 (Bruker Optik GmbH, Ettlingen, Germany) as KBr pellets (transmission mode). Band assignments were made by indicating the nature of the vibration (stretching (str) and bending (ben)). The 1H NMR spectra were collected on a Brüker AVANCE II+ spectrometer (300 MHz; Bruker BioSpin AG, Fällanden, Switzerland) at 25 °C; chemical shifts (δ/ppm) were internally referenced to D2O (4.790 ppm).
Ground-state UV–Vis spectra were recorded on a VWR UV 3100PC (VWR International bvba, Leuven, Belgium), on a Jasco J-815 CD (Jasco Inc., Tokyo, Japan), or on a Jasco UV V-750 spectrophotometer (Jasco Inc., Tokyo, Japan) using 1 cm quartz cells at 25 °C. Steady-state fluorescence spectra were acquired on a Perkin Elmer LS45 fluorimeter using a 1 cm quartz cuvette in right angle (RA) observation arrangement at 25 °C in air-equilibrated conditions. Fluorescence quantum yields (ΦF) were measured in aqueous dispersions using quinine sulphate in 0.01 M H2SO4 (ΦF = 0.54; air equilibrated conditions, RA geometry) as a reference standard at 25 °C. The optical density (OD) of the samples and reference were kept below 0.05 at the excitation wavelength to prevent inner filter effects. The quantum yields were calculated by the slope method, according to a reported procedure [49]. Fluorescence (emission and excitation) spectra were recorded with the same operating settings.
Fluorimetric titration data of diluted aqueous dispersions of C-dots (0.01 mg/mL) with known amounts of the NAs were acquired in RA geometry. Correction of fluorescence intensities due to the hetero-inner filter effects was conducted by the expression: η = Ax0Ay0(1 − 10−Axi)(1 − 10−Ayi)/AxiAyi(1 − 10−Ax0)(1 − 10−Ay0), where Ax0 and Ay0 are the C-dots absorbances, and Axi = Ax0 + ∆Axi and Ayi = Ay0 + ∆Ayi are the total absorbances of the C-dots and the NAs (∆Axi and ∆Ayi) at the excitation and emission wavelengths, respectively [50]. The limit of detection (LOD) was determined in accordance with the 3σ IUPAC criteria [51]. Time-resolved fluorescence intensity decay data were obtained by the time-correlated single-photon counting (TCSPC) method using a mode-locked DPSS Nd:YVO4 green laser (Vanguard 2000-HM532, Spectra Physics Inc., Santa Clara, CA, USA) synchronously pumping a cavity dumped dye laser (701, Coherent, delivering frequency-doubled 3–4 ps pulses of approximately 40 nJ/pulse at 3.4 MHz) working with DCM. Emission light was detected by a Hamamatsu 2809U-01 microchannel plate photomultiplier. The excitation wavelength used was 340 nm. Experimental intensity decays were fitted to the multi-exponential model:
I t   = i α i exp t / τ i
Elemental analyses (CHNS) of CGs and CBs were determined in duplicate in a Carlo Erba EA 1108 analyser (Carlo Erba, Milan, Italy), being the combustion performed at 1013 °C with an oxygen flux of 15 mL/min, at C.A.C.T.I., Universidad de Vigo, Spain.
A high-pressure reactor (Parr model 4560, Parr Instrument Company, Illinois, USA) equipped with pressure, temperature, and stirring sensors/controllers (Parr, model 4843) with inox vessel was used in the HTC method, while the microwave-assisted hydrothermal carbonization (Mw-HTC) method was performed in a mono-mode microwave reactor CEM Discover (Matthews, Pittsburgh, PA, USA), using pressure-rated reaction vials with poly(tetrafluoroethylene)-silicon caps.
The pHs of aqueous dispersions or solutions were determined at approximately 25 °C with a pH VWR pHenomenal® UM 6100L equipped with a pH electrode phenomenal 221 (VWR International Bvba, Leuven, Belgium).

2.4. General Procedures for the Synthesis of C-Dots from Coffee Grounds

2.4.1. Hydrothermal Carbonization (HTC) Method

The CGs (approximately 3.7 g) were fed into a high-pressure reactor with 120 mL of Millipore® water with or without additives (e.g., ED, melamine, urea, or DET) under air-equilibrated conditions. The contents of the reactor were gradually heated until the desired temperature was reached and kept at that temperature for a certain time. After the thermochemical conversion, the reaction mixture was left to cool down to room temperature (rt) and filtered under vacuum through a 0.20 μm cellulose membrane, resulting in an insoluble residue and a dark brown filtrate. The filtrate was extracted with CH2Cl2 (approximately 2 × 100 mL) and AcOEt (approximately 2 × 100 mL) for removal of low to medium polarity molecular species. An aliquot (20 mL) of the aqueous phase (approximately 120 mL) was taken to dryness and dried under vacuum at 105 °C for quantification of C-dots in the aqueous dispersion. The residue from the membrane was quantified by direct weighing after drying. The organic extracts were also quantified after drying with anhydrous magnesium sulphate, evaporation to dryness, and vacuum drying at 105 °C.

2.4.2. Microwave-Assisted Hydrothermal Carbonization (Mw-HTC) Method

C-dots were synthesized from CGs (approximately 154 mg) dispersed in water (5 mL), using an amine as additive, at chosen temperatures in a closed vessel during a selected time. After cooling down to rt, the mixture was filtered through syringe filters of cellulose membrane (0.2 μm pore size), yielding a brown filtrate. Quantification of C-dots in the aqueous dispersions and the amounts of insoluble residue and organic extracts were carried out as outlined above, using proportionate volumes of organic solvents in the extraction.

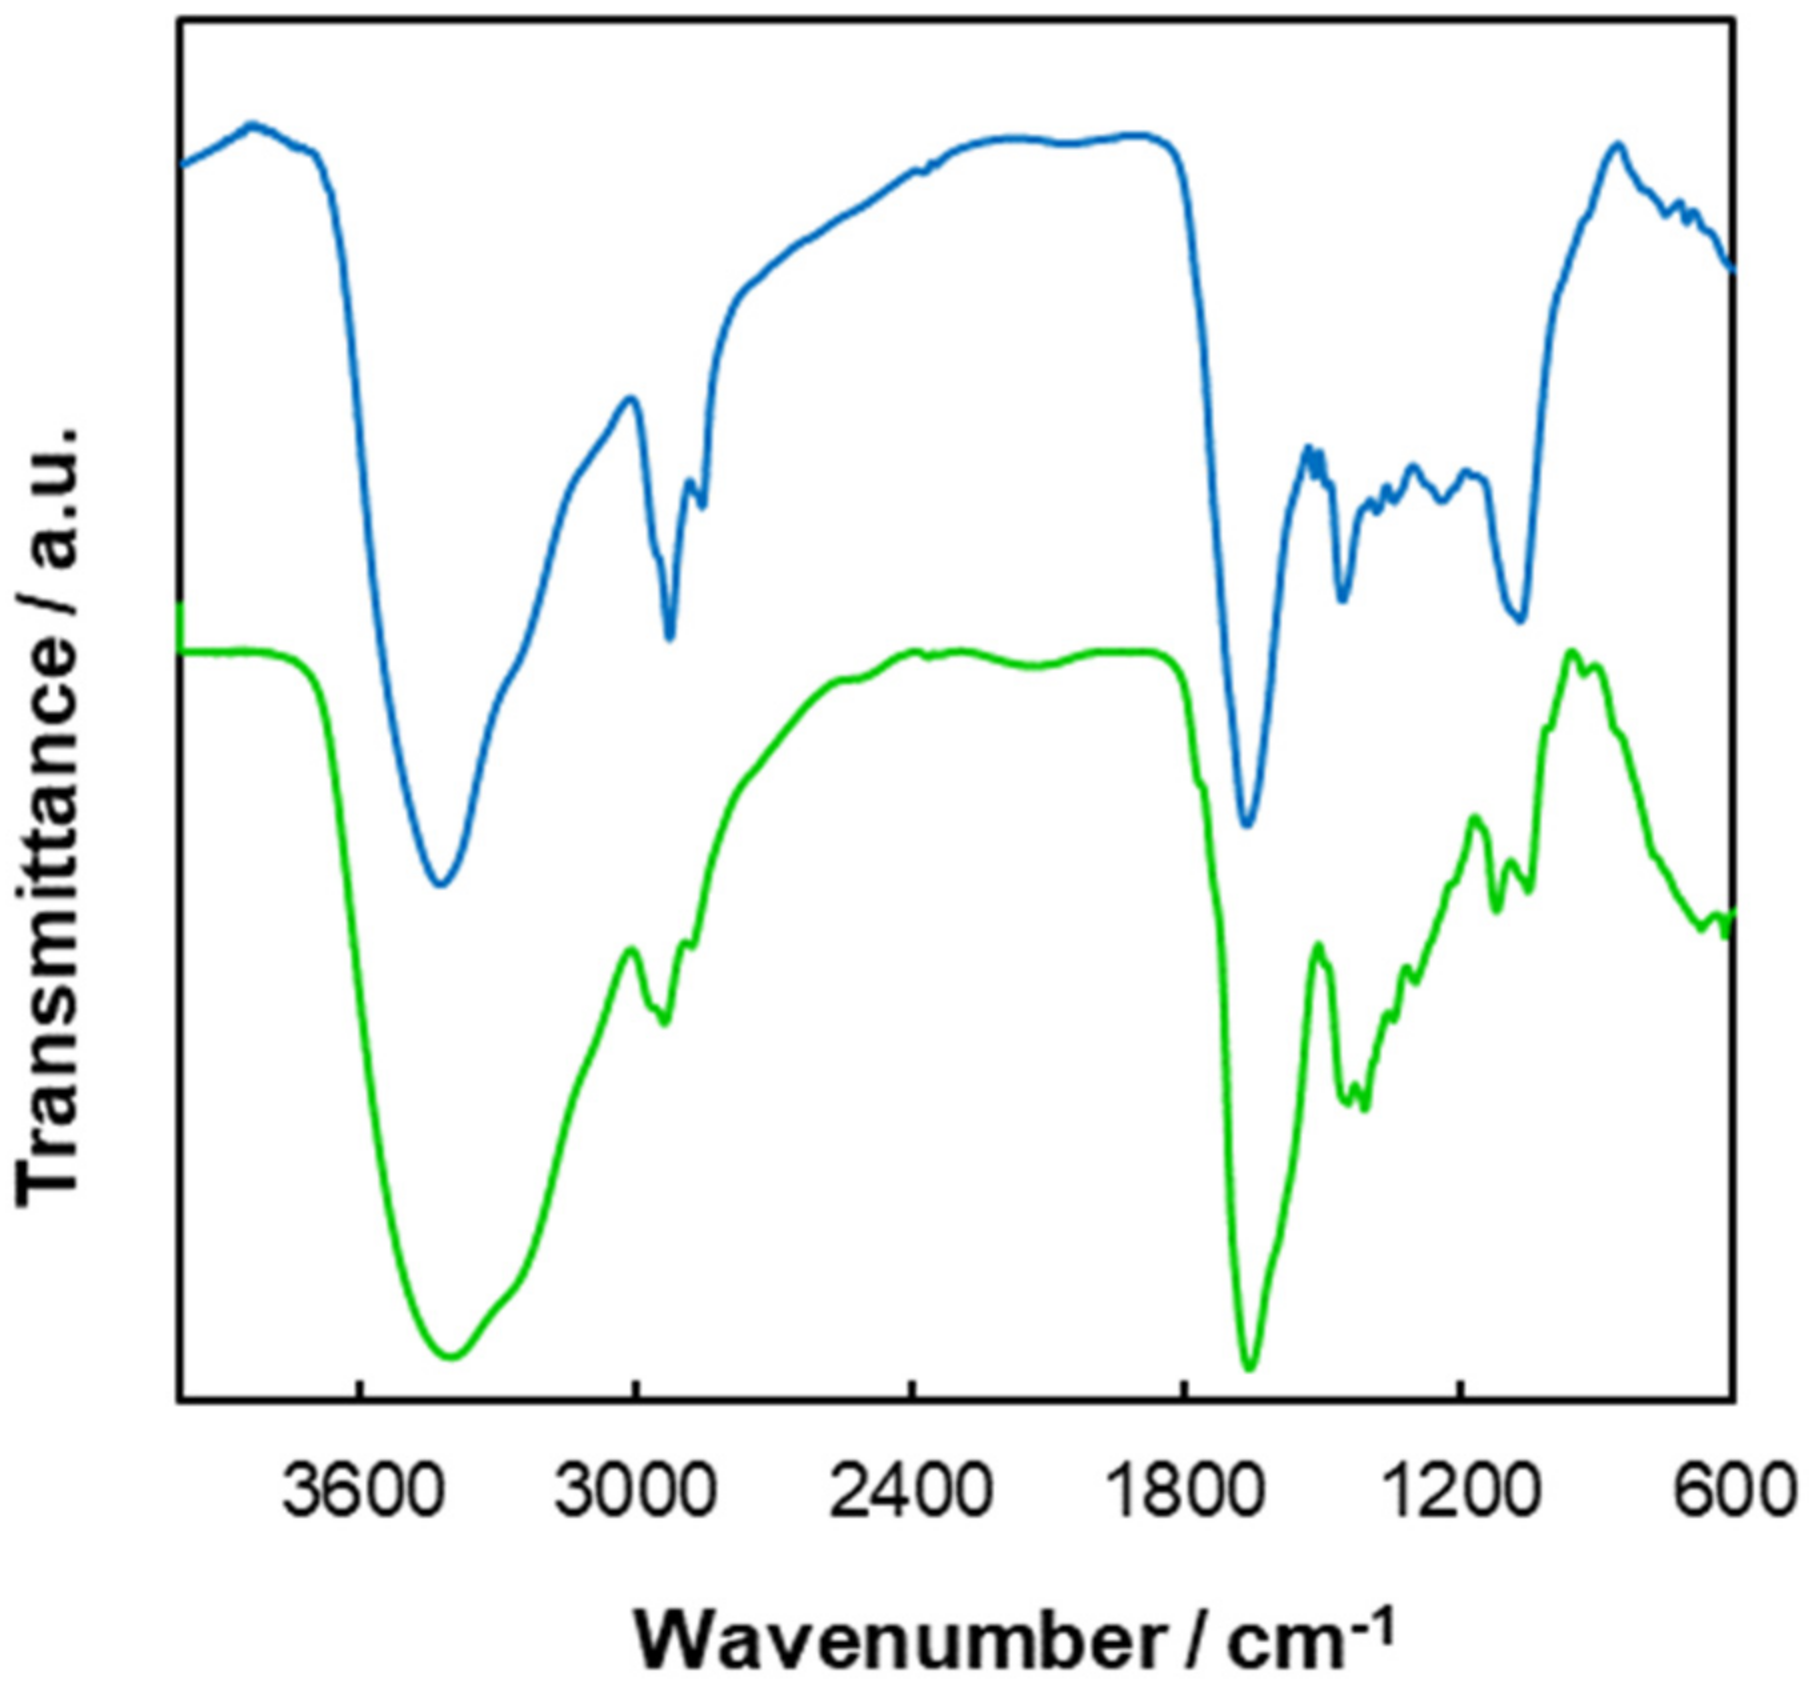
2.4.3. Structural Characterization

The structural characterization of the C-dots was accomplished by FTIR, 1H NMR, and elemental analysis using solid samples, while for UV–Vis and fluorescence and sensing assays, aqueous dispersions were directly used after appropriate dilution.

3. Results

3.1. Coffee Grounds and Coffee Beans Characterization

The physico-chemical properties of CBs and CGs used in this study were evaluated by standard methods and are presented in Table 1.
From the analysis of the main organic constituents (see Table S1 in the Supplementary Materials (SMs)), it was found that the coffee grounds contained substantial amounts of sugars (22–28%), followed by lipids (10–12%), phenols (6–10%; based on gallic acid), and a low level of proteins (1.7–3%). Compared to coffee beans, a high increase in sugar content was noted, along with a substantial reduction in ashes.
The infrared (IR) spectrum of CGsSV displayed characteristic bands at 3397, 3251 (shoulder) (O–H and N–H, str), 2962 (CH3, weak asym), 2925 (CH2, weak asym), 2857 (CH3, weak sym), 1786 (shoulder), 1711 and 1655 (C=O and C=C), 1377 (CH3, ben), 1265, 1210, 1127, 1073, and 1033 (C(O)–O–C, str, and C–O, str) cm−1 (Figure S1). The CBsSV IR spectrum showed a similar profile to that of CGsSV, although with a better vibrational resolution. The 1H NMR spectra of the water extracts of the CGs and CBs showed a complex spectral pattern of signals (Figure S2), indicating a higher proportion of aromatic signals in the latter. This is in accordance with literature reports [52]. The IR spectra of CGs and CBs from other sources (NP and CQ) can be found in the SMs (Figures S3 and S4).

3.2. Synthesis and Structural Characterization of C-Dots from Coffee Grounds

The fluorescent C-dots were synthesized using CGs dispersed in water by sustainable procedures. Hydrothermal carbonization (HTC) and microwave-assisted hydrothermal carbonization (Mw-HTC) methods were applied on CGs from different sources under a variety of conditions (e.g., reaction temperature, reactor dwell time, and amount/nature of additives).
The CGs were charged into the respective reactor with water, a known amount of additive (ethylenediamine (ED), melamine, urea, or diethylenetriamine (DET)), and heated for 1–12 h at temperatures ranging from 190 to 300 °C.

3.2.1. C-Dots Synthesis by the HTC Method

Following the general procedure, using ED as an additive (2.6 mmol ED/g CGsSV; mass ratio ED/CGs = 0.16) at 250 °C for 6 h, an aqueous brown dispersion of C-dots and a dark brown residue were obtained after cellulose membrane filtration. After purification by solvent extraction (see details in the general procedure), the yield of the aqueously dispersed C-dots was 16.0% (w/w, based on CGs and ED). The insoluble matter accounted for 4.6%, and the combined organic extracts to 6.1%, giving an overall 27% (w/w) yield for the thermochemical transformation.
The FTIR spectroscopy was used to characterize the functional groups at the surface of the C-dots. The spectrum (Figure 1) revealed that the most characteristics bands at 3409 (O–H, str); 3256 (N–H, shoulder); 2960, 2938, and 2876 (C–H, weak asym/sym); 1660 (C=O, C=N str), a shoulder around 1590 (N–H ben and C=C str); 1443 and 1407 (C–H, ben); 1346 (C–H ben); 1299, 1119, and 1049 (C(O)–O–C, C–O, str, OH, ben); 619 cm−1. Compared to the IR spectrum of the pristine CGs, the bands attributed to acids/esters/ketones (1780–1710 cm−1) completely disappeared or their intensities were largely attenuated. The existence of abundant hydrophilic functional groups within the structure correlated well with the outstanding water solubility of synthesized C-dots.
The C-dots were also characterized by 1H NMR spectroscopy. The proton spectrum (Figure S5) showed the presence of aliphatic C–H resonances between 0.8 and 2.8 ppm, a large set of peaks between 3.2 and 4.4 ppm that could be assigned to CH–O and CH–N, and a very weak set of signals corresponding to aromatic protons from 7.0 to 8.5 ppm; olefinic protons may be overlapped by the solvent signal. Of course, these signals only represent a partial view of the nanoparticles’ ensemble, since the carbon core is missing.
After correction for ashes (5.26%), the elemental composition was found to be: C, 56.82%; H, 6.52%; N, 11.20%; O (calculated), 20.03%; S, 0.16%; with a C/N ratio of 5.07. The ashes’ FTIR spectrum (Figure S6) exhibited a strong band at 1412 and 873 cm−1, which suggests the presence of carbonate ions [53].

3.2.2. C-Dots Synthesis by the Mw-HTC Method

The synthesis was carried out with CGsSV using a mono-mode microwave reactor, ED as an additive (2.6 mmol ED/g CGs; mass ratio ED/CGs = 0.16), and a dwell time of 3 h at 190 °C. An aqueous brown dispersion of C-dots and a dark brown residue were obtained after filtration by cellulose membrane syringe. After purification by solvent extraction (see details in the general procedure), the yield of the aqueous dispersed C-dots was 15.3% (w/w, based on CGs and ED), which in conjunction with the membrane residue (19.2%) and the organic extracts (9.9%) gave a total yield of 44% (w/w) for the reaction.
The FTIR analysis did not reveal any major dissimilitude between the C-dots’ spectra obtained from the HTC and Mw-HTC methods. It was noted, however, that a shift to lower energies (1648 cm−1) of the band corresponding to C=O/C=N occurred on the material obtained by the latter method (Figure 1). The same set of proton signals (aliphatic, CH–O/CH–N and aromatic) already seen on C-dots from the HTC was also present in this sample (Figure S7).

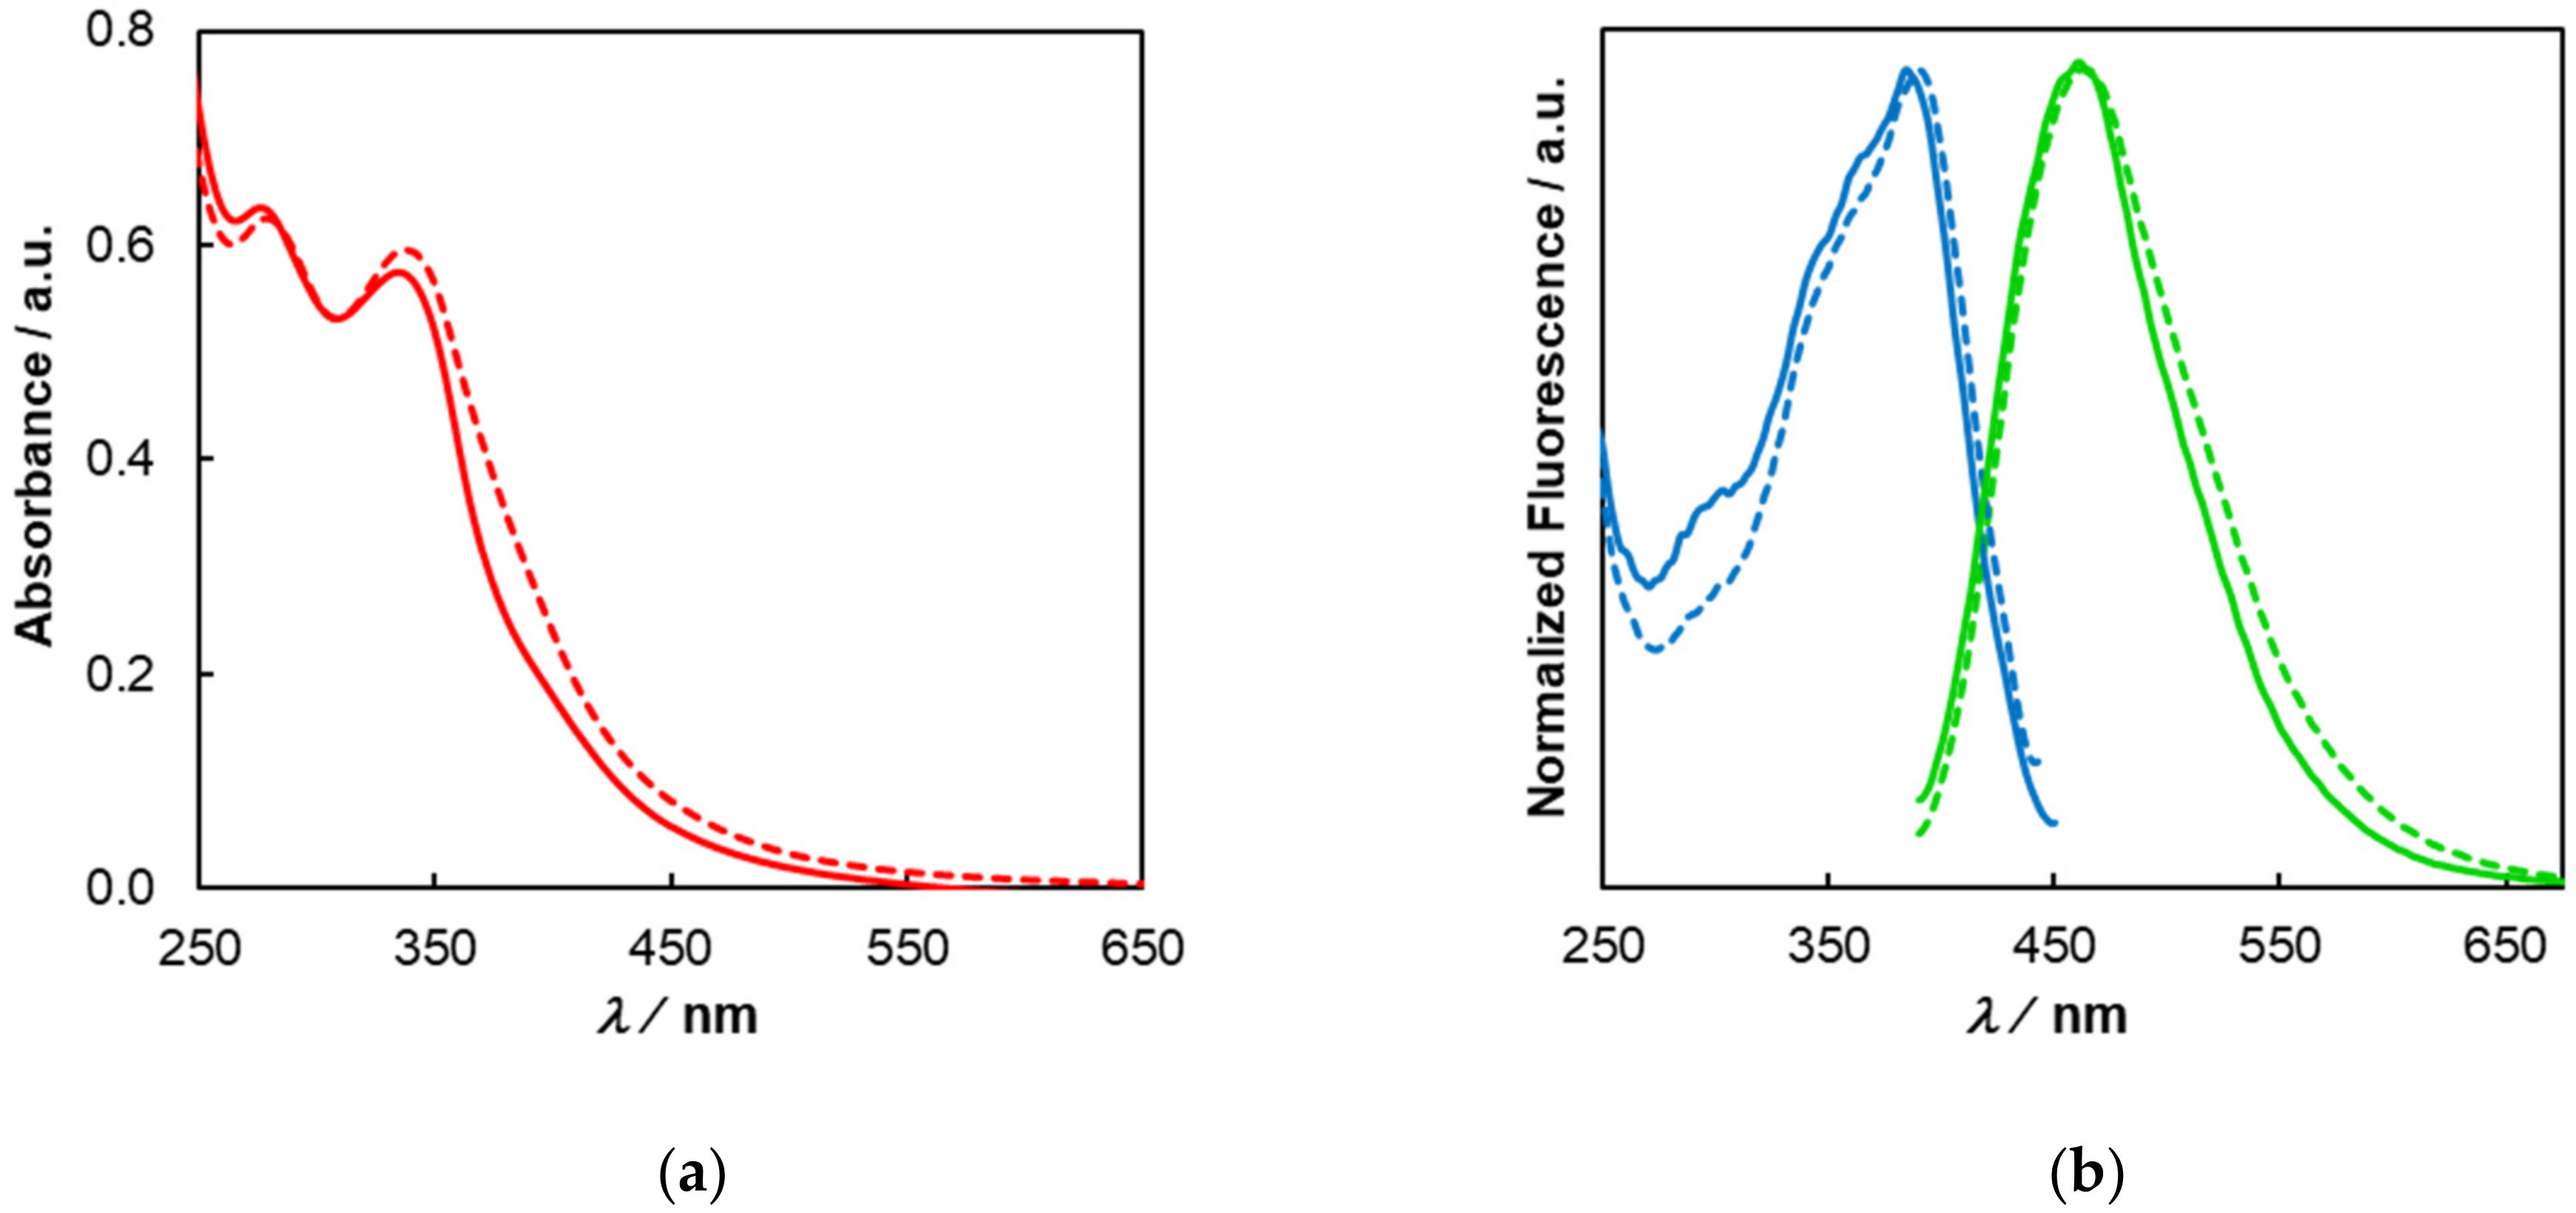
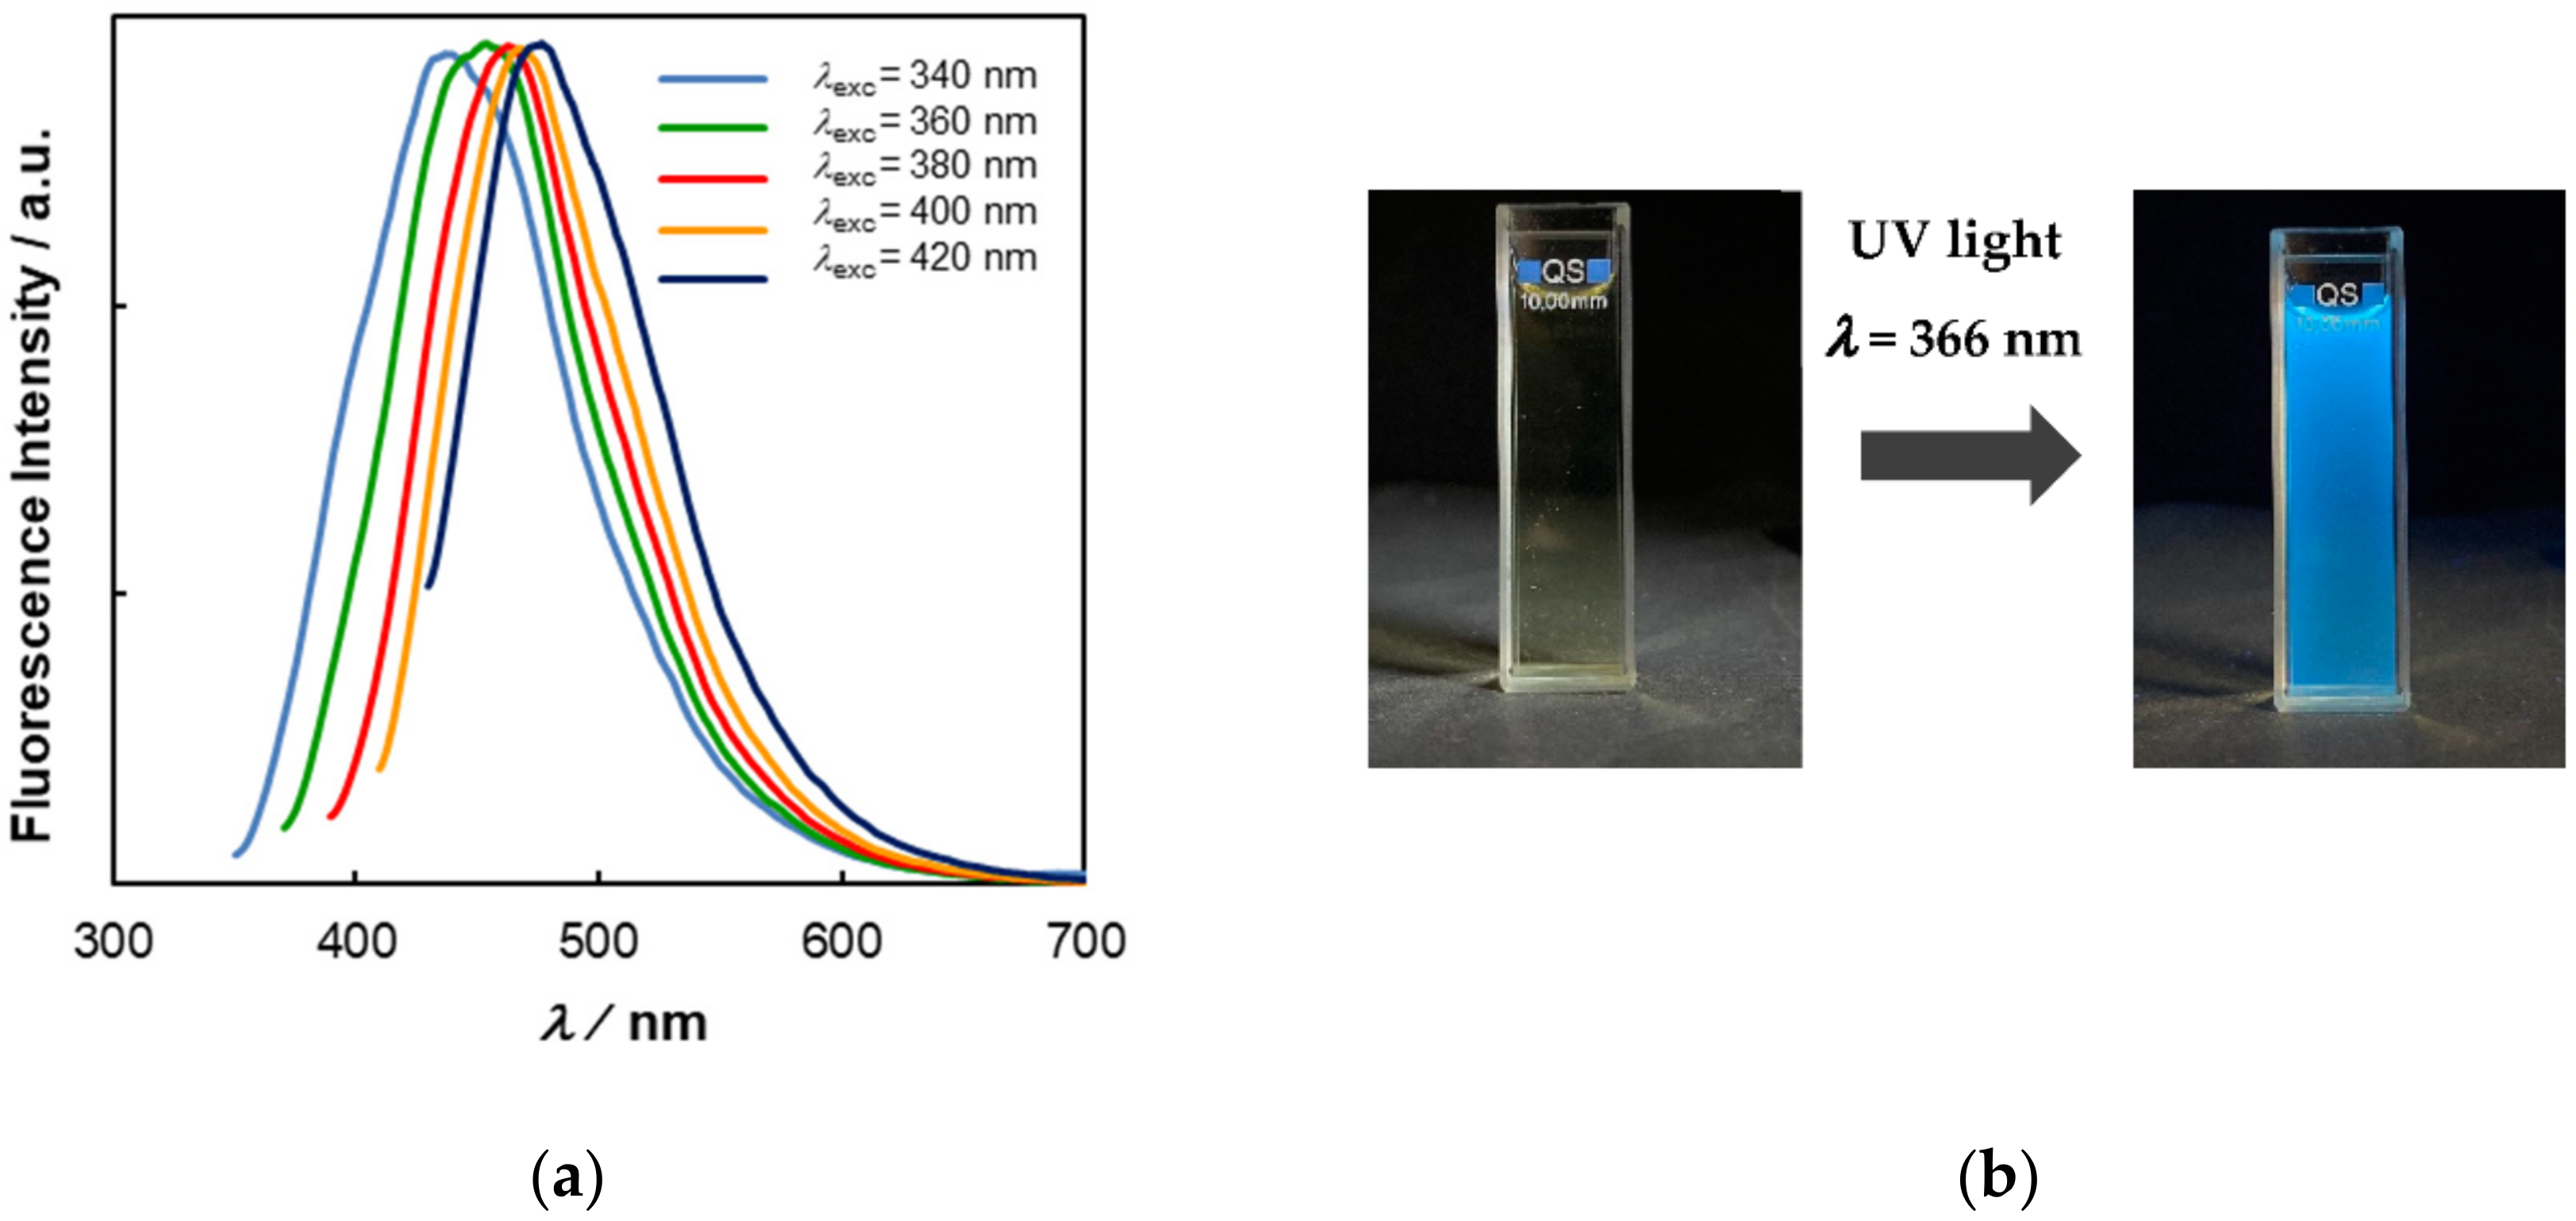
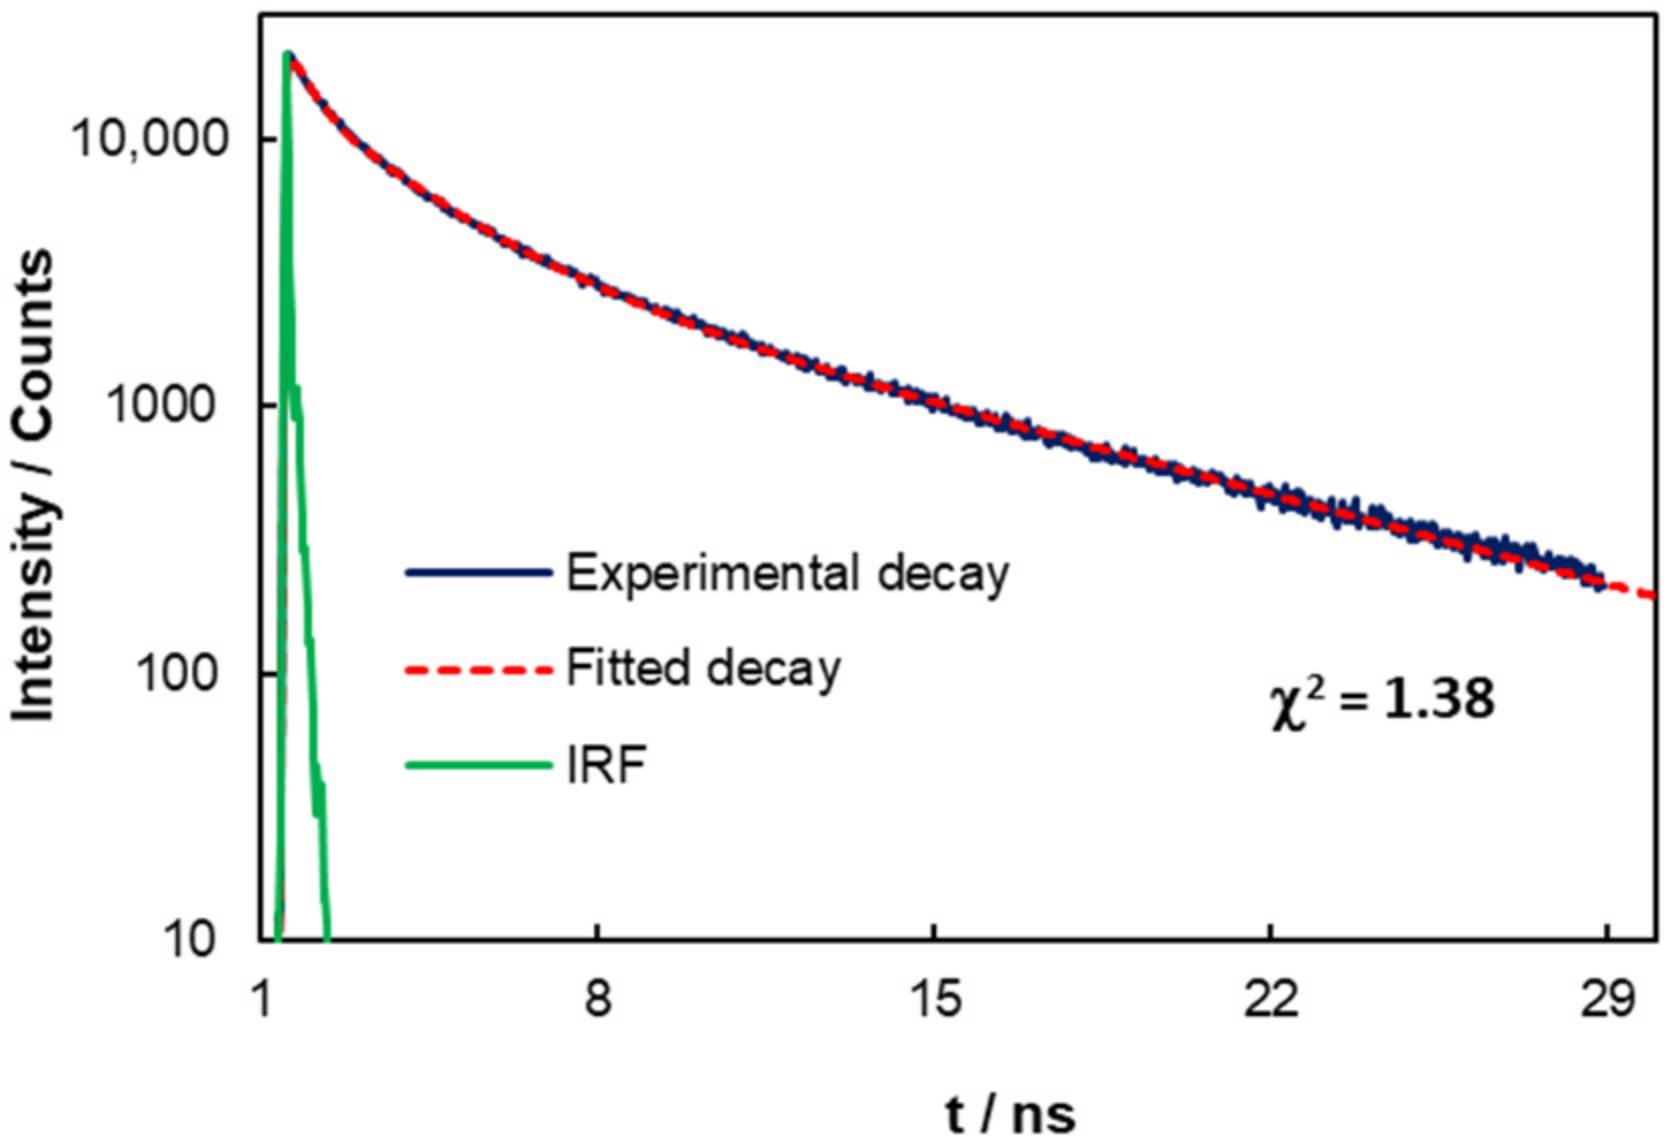
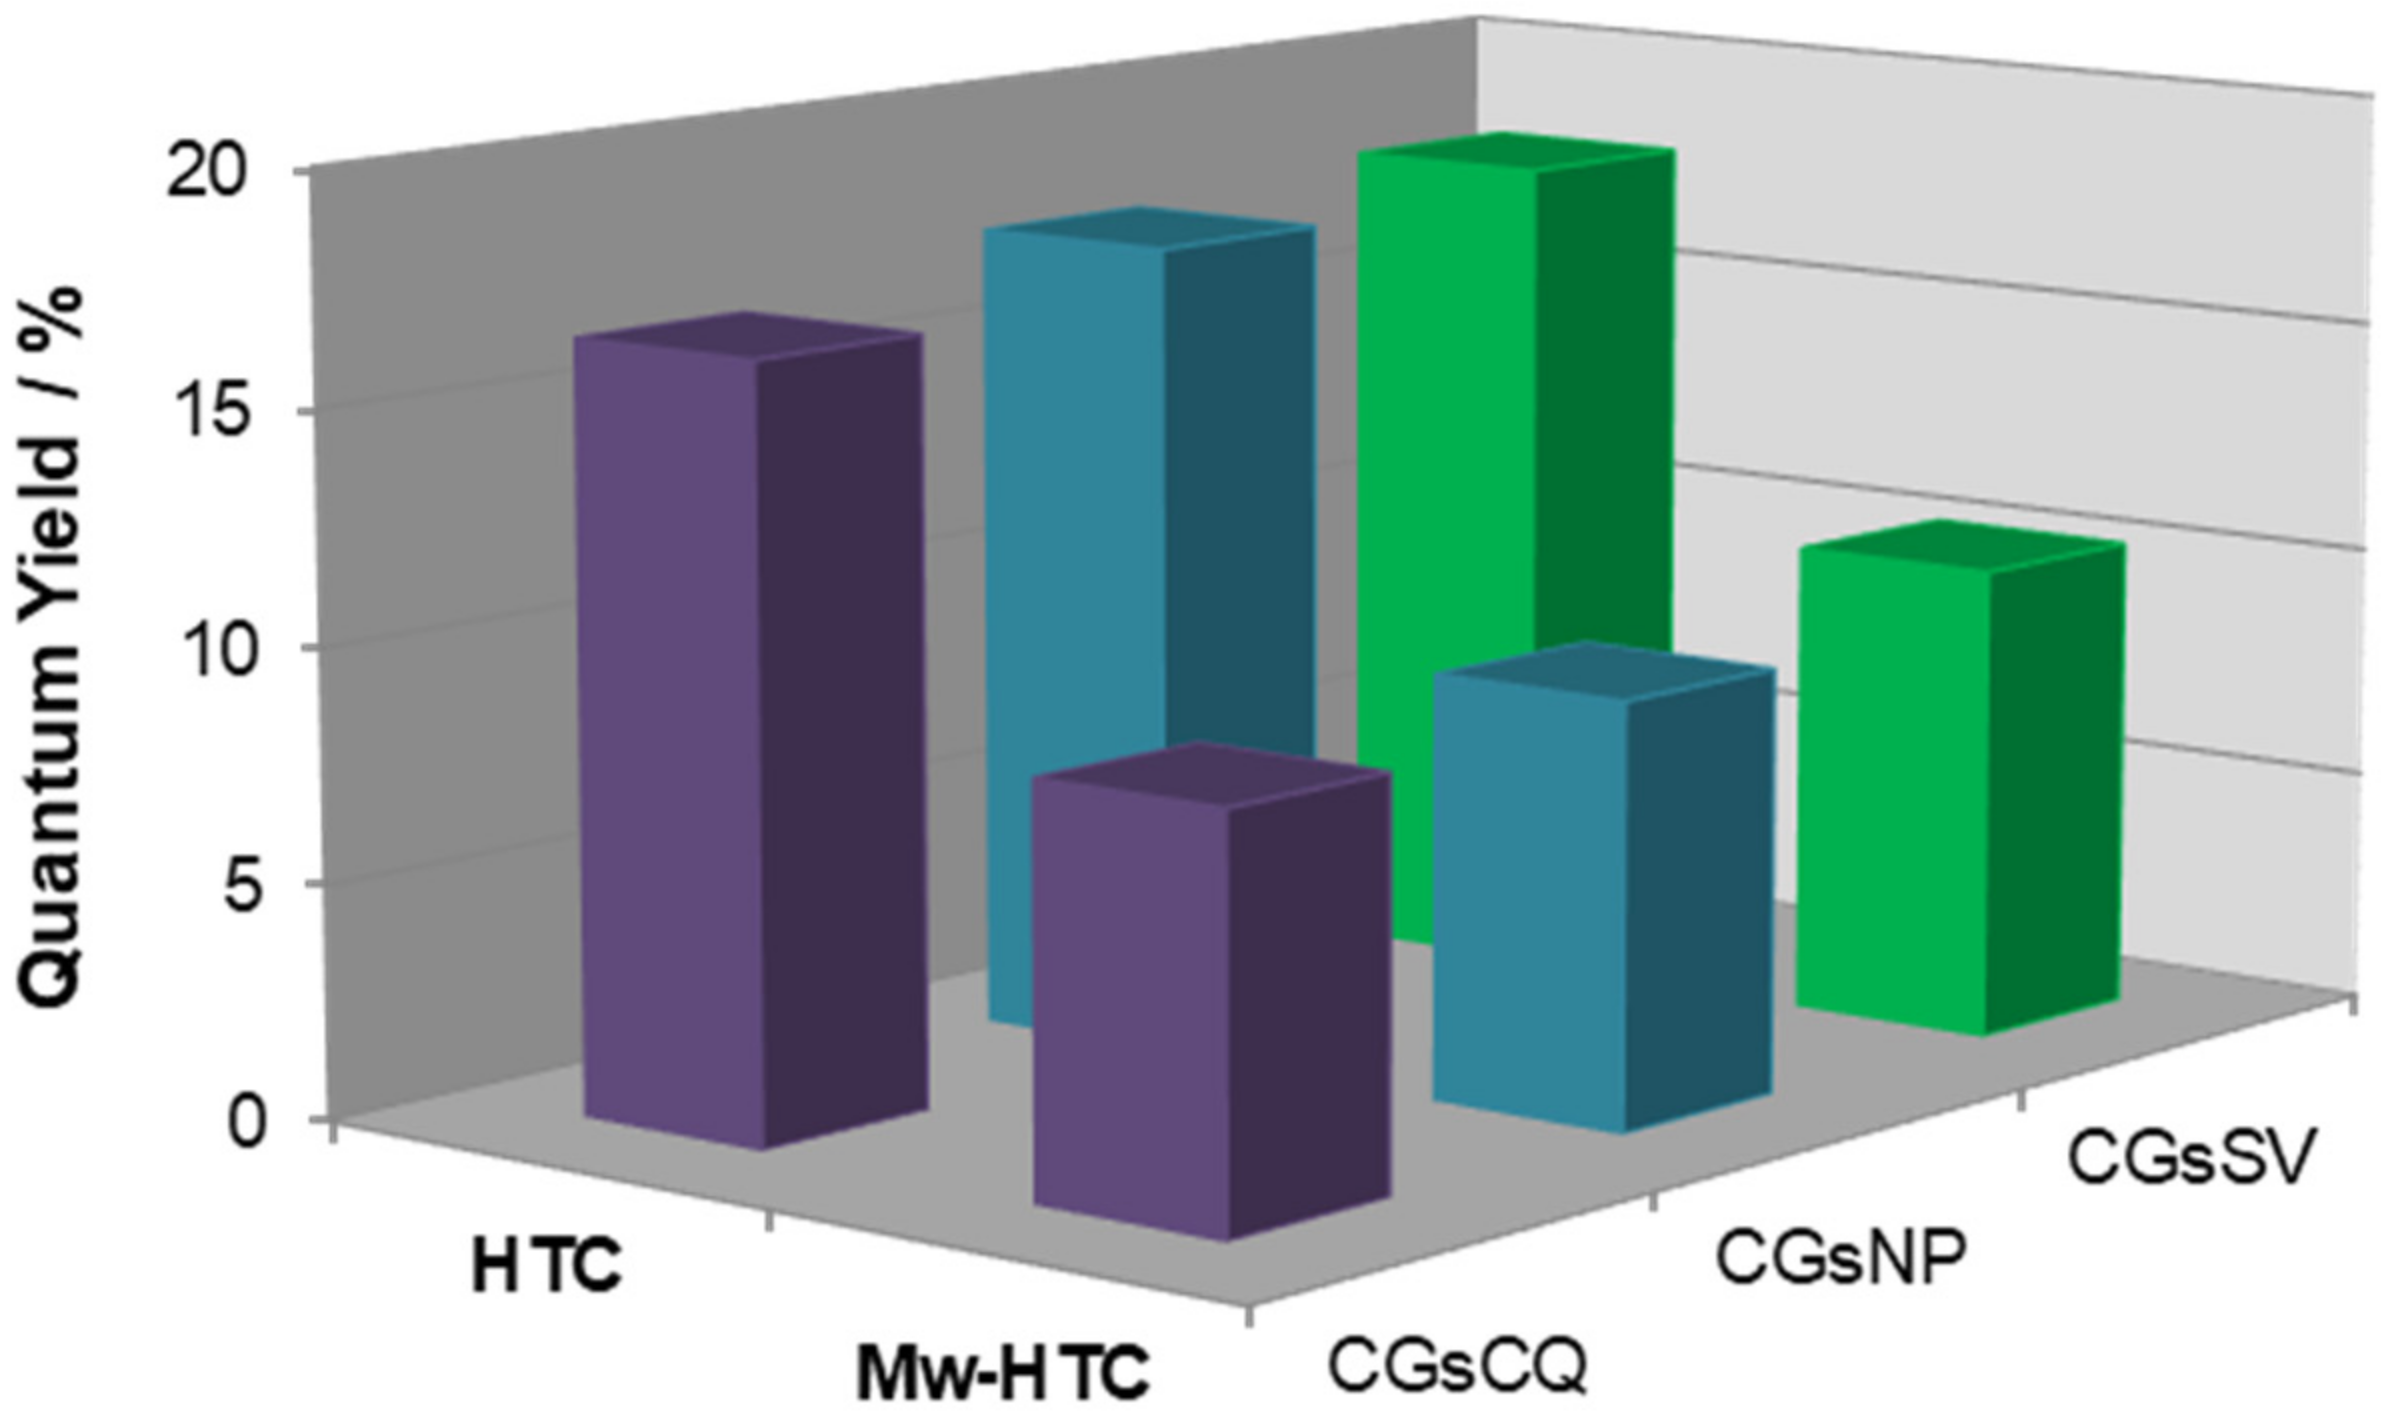
3.3. Photophysical Properties of C-Dots from Coffee Grounds

The photophysical properties of C-dots from coffee grounds were studied by UV–Vis, steady-state, and time-resolved fluorescence spectroscopies. Figure 2 depicts the ground–state absorption (a) and excitation and emission (b) spectra of C-dots obtained from CGsSV by the HTC and Mw-HTC methods under the conditions described in the previous sections.
Generally speaking, the UV–Vis spectra of C-dots from HTC and Mw-HTC are very similar, exhibiting their maximum absorption bands at approximately 278 and 335 nm, normally assigned to π–π* and n–π* or mixed π–π*/n–π* transitions, respectively, with a tail extending into the visible region [22].
The synthesized C-dots from CGsSV exhibited excellent fluorescent properties with the emission maxima changing with the excitation wavelength (340 up to 420 nm). The progressive red shifts of fluorescence emission maxima (Figure 3a) with decreasing excitation energies are normally associated with the presence of different particle sizes and/or surface states, leading to a distribution of optical gaps on the ensemble. The highest emission occurs at 461 nm (HTC) upon excitation at 380 nm. The corresponding aqueous dispersions gave off a strong blue luminescence under UV light (Figure 3b). Similar emission was observed for C-dots from Mw-HTC (λem max = 464 nm). The excitation spectra, when monitored at their emission maxima, exhibited their main transitions at 384 and 390 nm, respectively, for HTC and Mw-HTC (Figure 2).
The C-dots (HTC) reached a fluorescence quantum yield (ΦF) of 0.18 when excited at 380 nm. Using other raw materials (i.e., CGsCQ or CGsNP blends) under the same HTC synthesis procedure, furnished C-dots were equally luminescent (0.17 ± 0.01). For C-dots obtained by Mw-HTC, lower quantum yields were obtained (ΦF = 0.10 ± 0.01). The photostability of aqueous dispersions of C-dots at 0.1 mg/mL was examined under ultraviolet radiation (λexc = 380 nm); after 1 h of continuous irradiation, no loss of fluorescence intensity (monitored at 461 nm) was observed (Figure S8).
The time-resolved fluorescence measurements were conducted by the TCSPC method. The intensity decays of aqueous dispersions of C-dots obtained from CGsSV (HTC method) were best fitted by a sum of three exponentials ((τ1 = 0.36 ns (5.5%), τ2 = 2.29 ns (36.2%), and τ3 = 9.09 ns (58.3%)), yielding an intensity average lifetime (τave) of 6.15 ns (Figure 4).
For C-dots obtained by the Mw-HTC method, the lifetime was very similar to that reported above, showing again three main components ((τ1 = 0.55 ns (9.5%), τ2 = 2.78 ns (36.4%), and τ3 = 9.59 ns (54.1%)), and an intensity average lifetime (τave) of 6.25 ns (Figure S9).

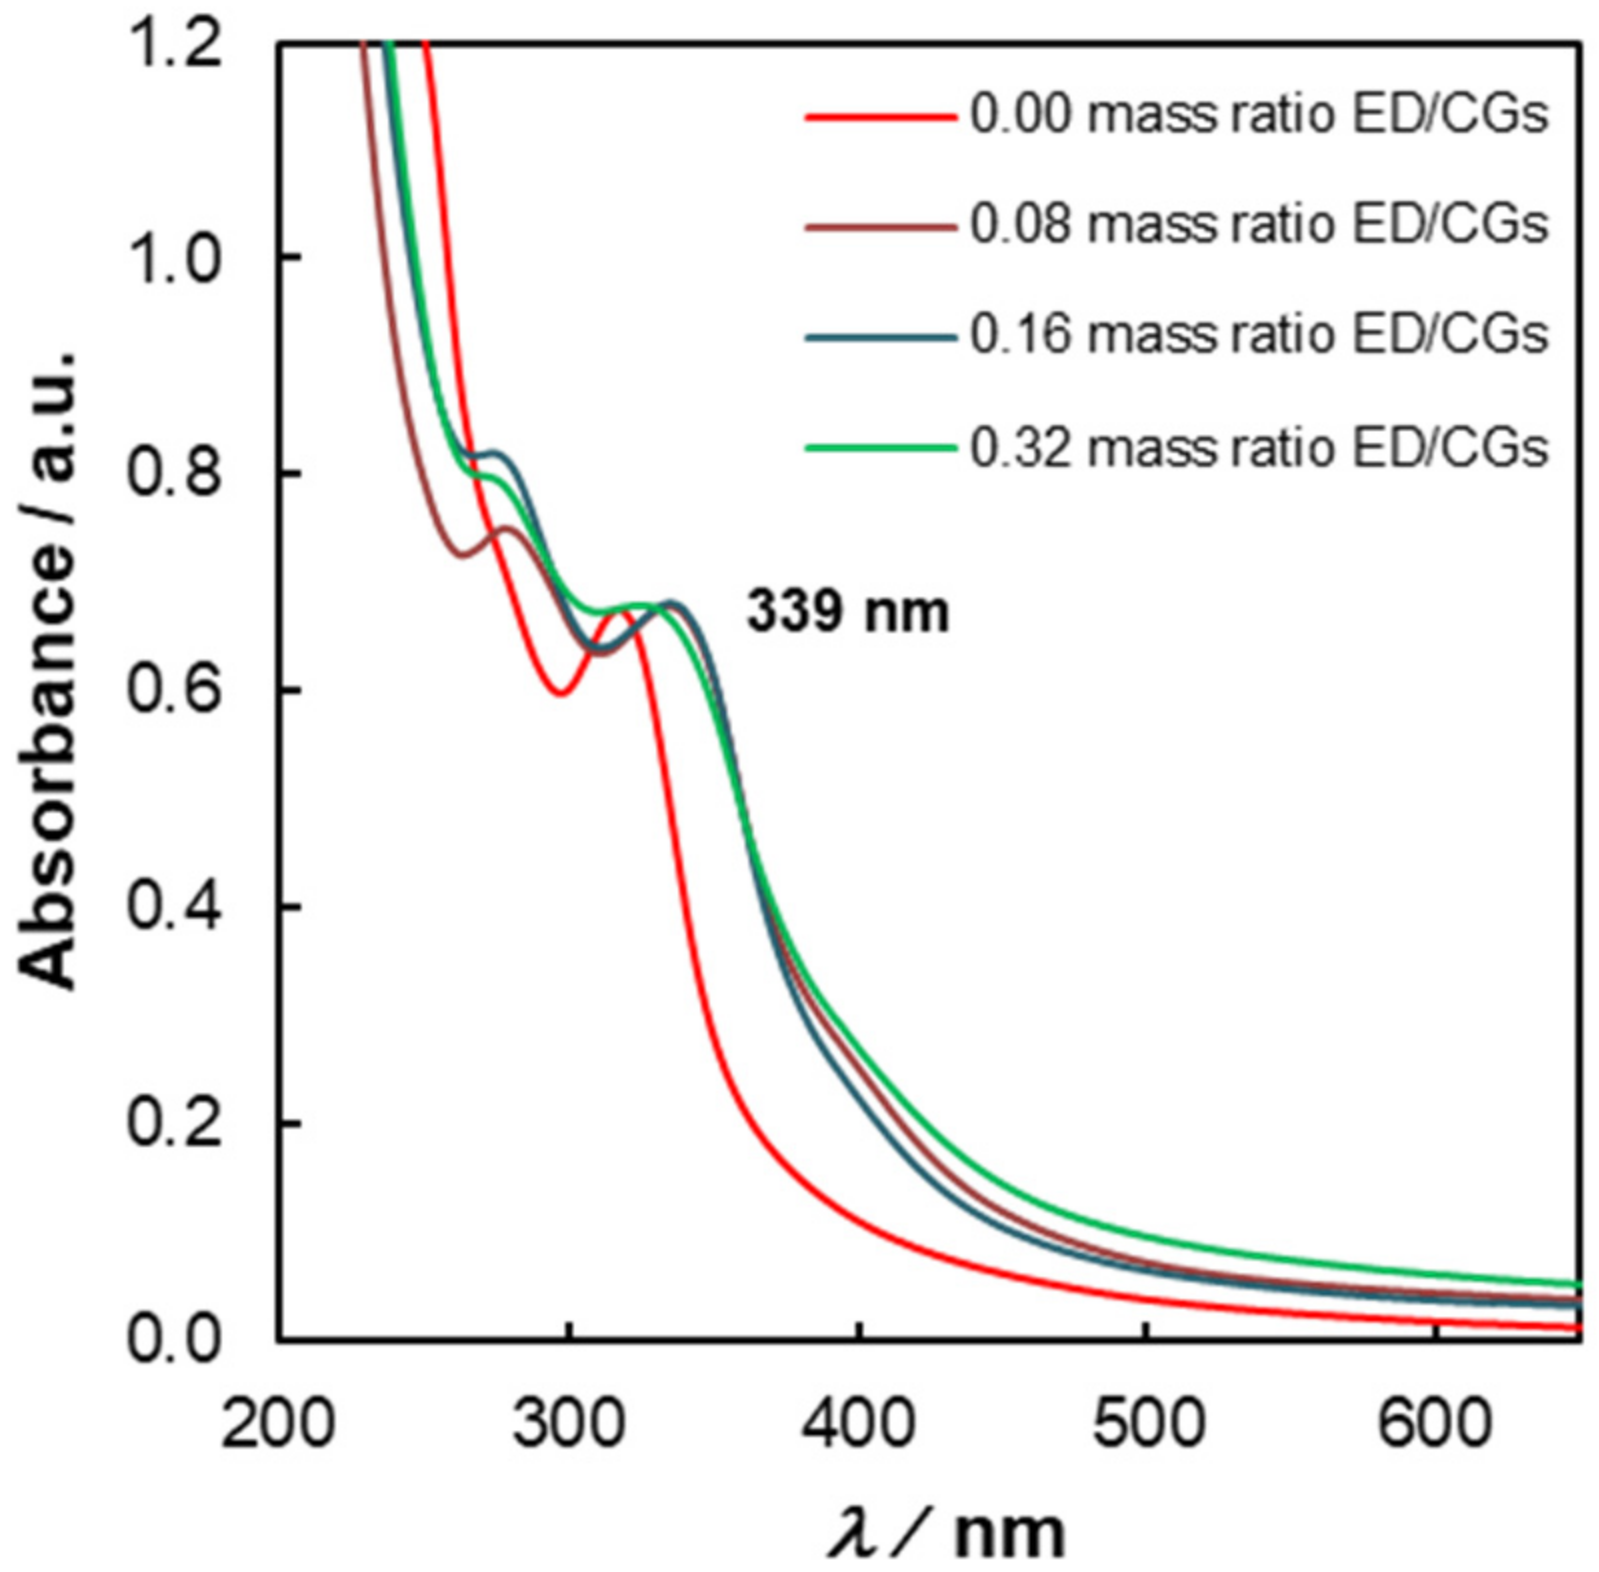
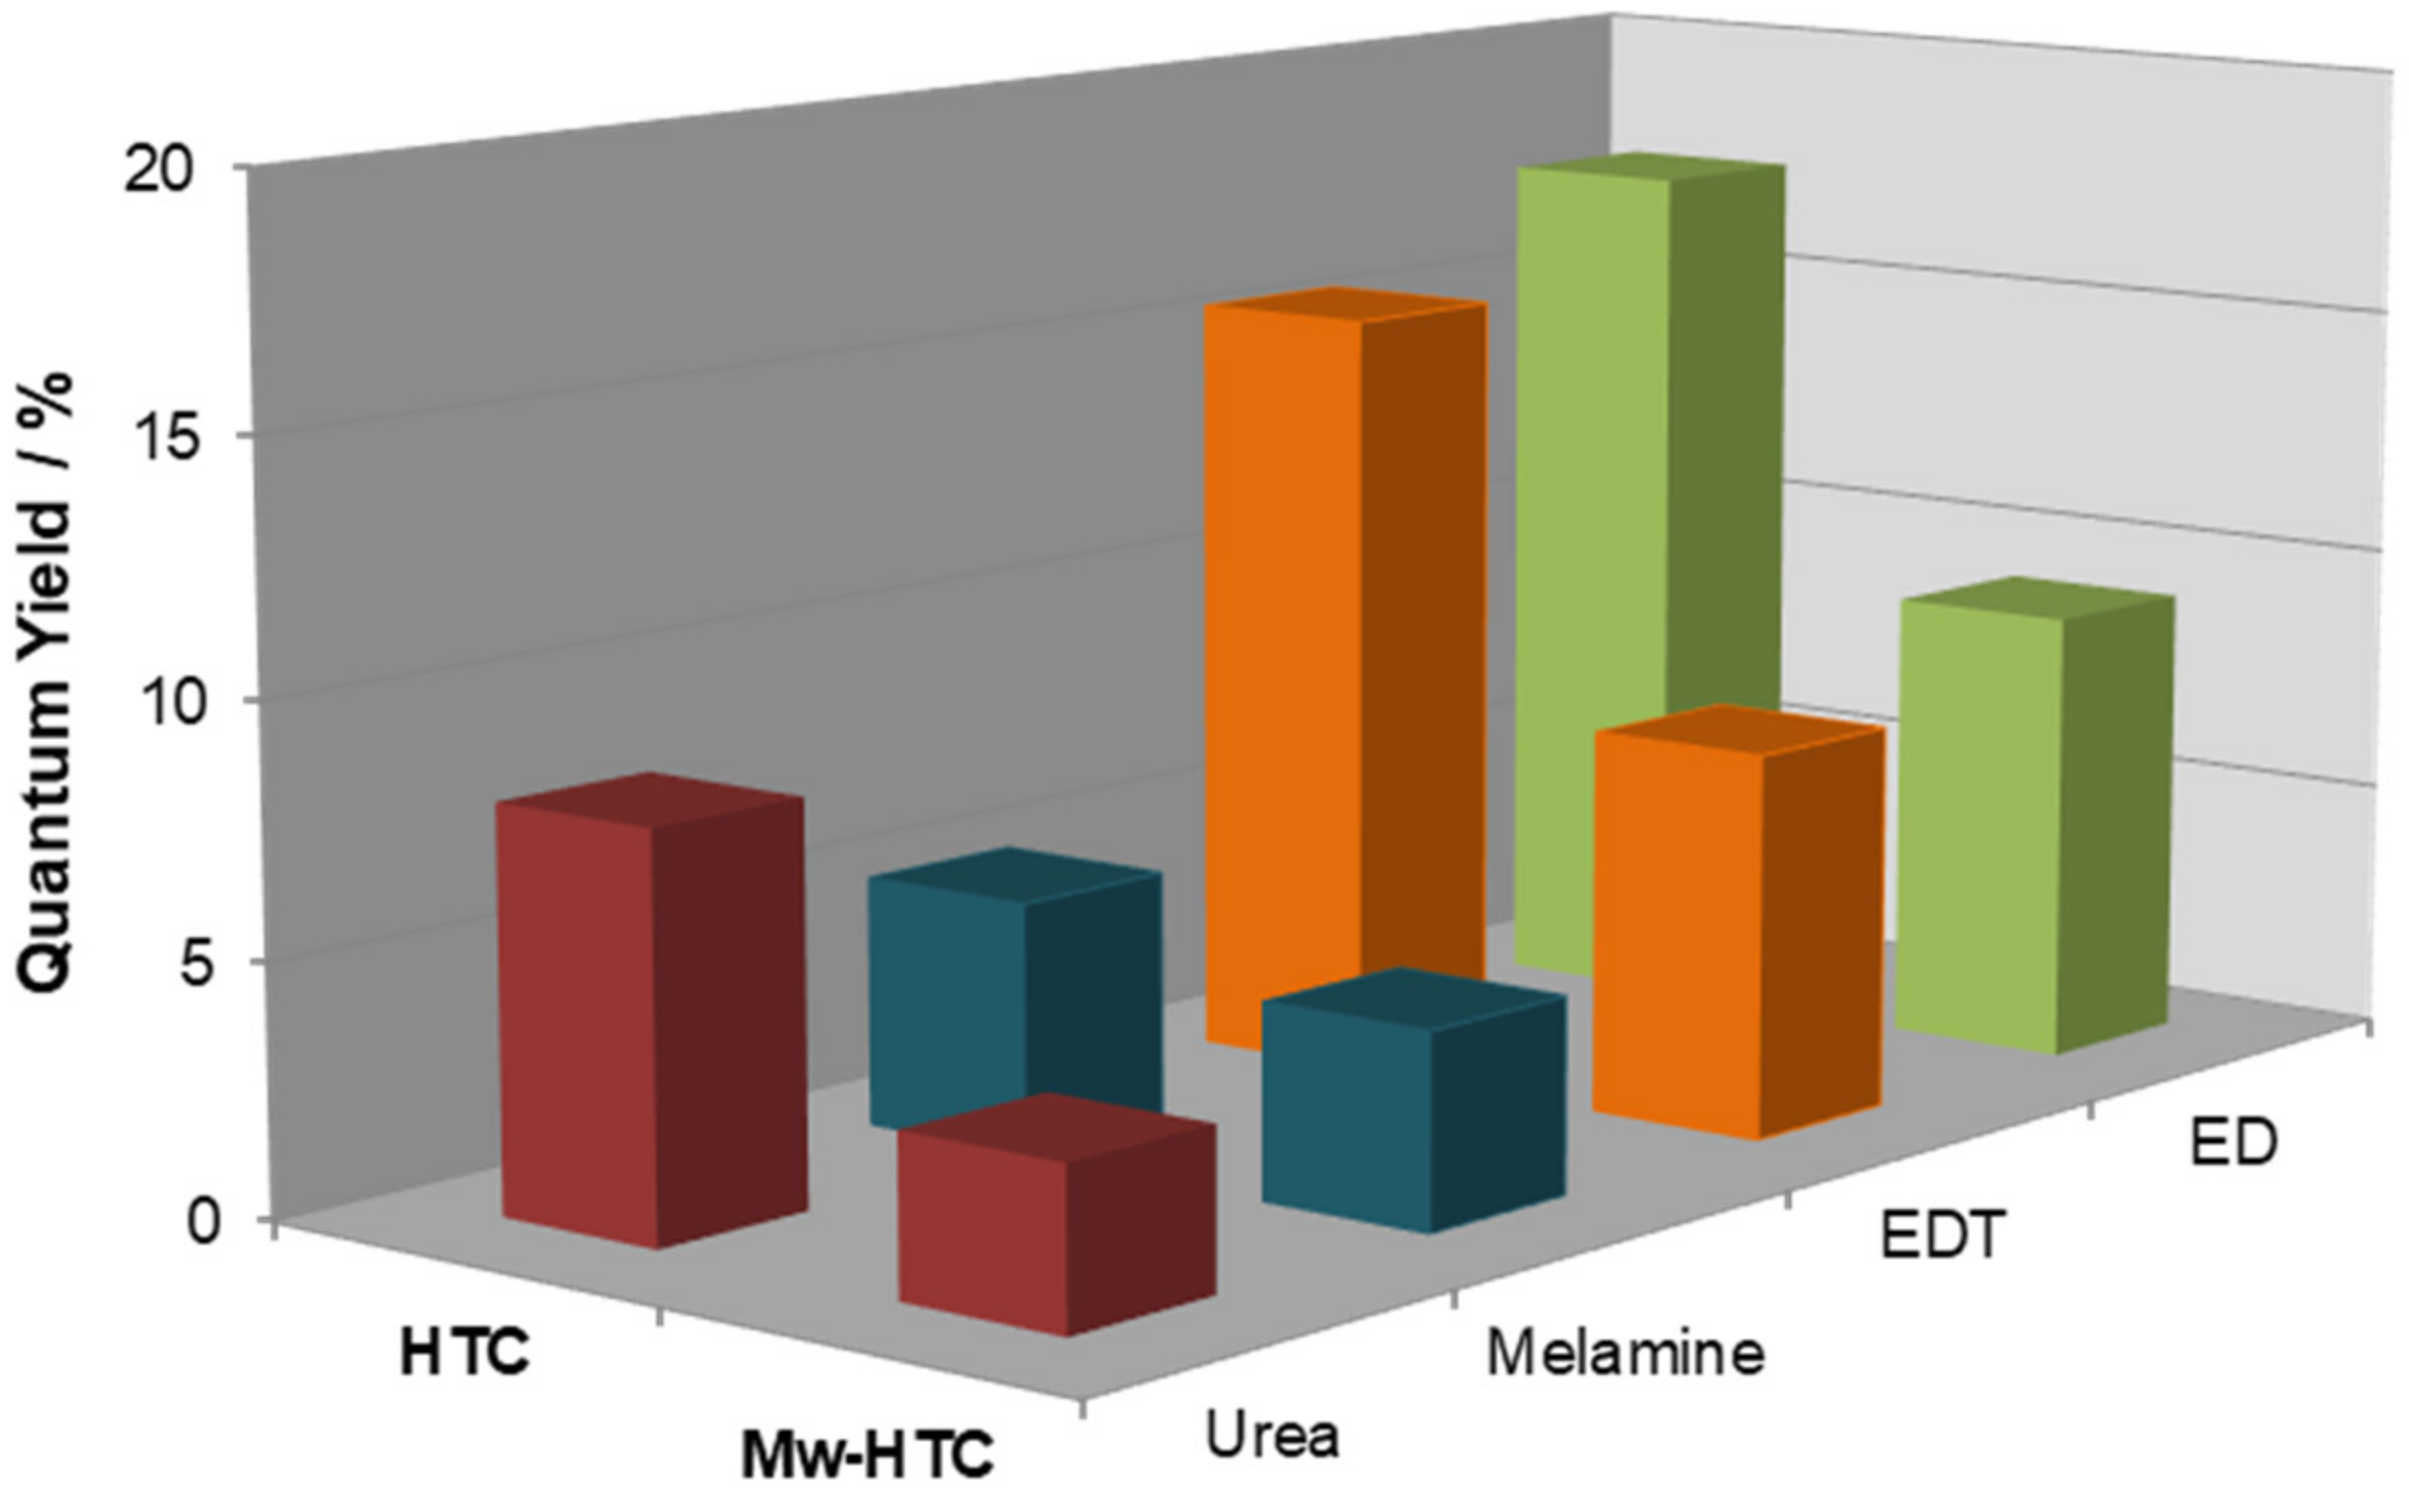
3.4. Influence of Reaction Parameters on the Optical Properties of C-Dots from Coffee Grounds

The surface state is an important characteristic of C-dots, since it is often related to the photoluminescence of C-dots [54]; the reaction temperature and residence time during their synthesis may have a significant impact on the formation of these surface functionalities and, therefore, on the photophysical properties of these nanomaterials [55]. As thus, the influence of the reaction temperature on the C-dots’ photoluminescence and reaction yields, using the HTC method, was explored, keeping constant the concentration of the additive (2.6 mmol ED/g CGs; mass ratio ED/CGs = 0.16) and the residence time (4 h) (Table 2).
The best quantum yield (0.18) was obtained for a reaction temperature of 300 °C, although with the lowest reaction yield. This result was somewhat unexpected, because it is usually reported that on increasing the reaction temperature on solvothermal methods, the component of the emission that eventually would have its origin on the molecular type emitters, many times invoked as the main emitters in nanoparticle ensembles, would fade out. This behavior is usually noted in citric acid-based C-dots [56].
The UV–Vis spectrum of C-dots synthesized at 200 °C exhibited absorption bands at 282 and 325 nm, the last one accompanied by a broad absorption toward lower energies, whereas at 300 °C a blue-shift of 10 nm for the n-π* transition was observed (Figure S10). A hypsochromic shift was also clearly observed on the excitation spectrum of the sample synthesized at 300 °C (Figure S10). This appears to make sense, since at higher temperatures the proportion of surface and/or core chromophores, linked to or embedded in the core of the nanoparticle and responsible for the absorptions above approximately 300 nm, will decrease, because they are more prone to thermal decomposition than the aromatic core. The fluorescence spectra of the samples obviously reflect the foregoing, exhibiting a 15 nm blue shift (from 464 to 449 nm) on the emission band maximum (Figure S11), ongoing from 200 to 300 °C.
The influence of dwell time (4–12 h) on C-dot properties was also evaluated (HTC method) at a fixed reaction temperature of 250 °C. The UV–Vis and fluorescence spectra showed similar profiles and only a marginal increase in the quantum yield (from 0.12 up to 0.15) was observed on increasing the residence times.
Modification of the surface states of carbon nanomaterials by creation of certain functionalities may also play an important role in improving C-dots’ photoluminescence. In this work, the effect of several additives (ED, melamine, urea, and DET) on the luminescent properties of C-dots in comparison to neat feds was investigated (Table 3).
For this particular set of experimental conditions, the higher fluorescence quantum yields of C-dots were obtained in the presence of ED (0.18) and DET (0.15), the latter achieving a slightly better reaction yield. The melamine and urea did not show any significant effect on the quantum yield enhancement in comparison to the experiment without any additive. Elemental analysis showed that the C-dots obtained from CGs in the presence of ED and DET contained similar amounts of nitrogen (N, 12.02% and 12.07%, respectively), which were much higher than that retrieved for C-dots synthesized from neat CGs (N, 6.09%). These results clearly indicate that an additional nitrogen source during the C-dots’ synthesis from CGs was beneficial regarding the C-dots’ fluorescence.
Using ED, the impact of the amount of additive was assessed (Table 4).
The results showed a stepwise enhancement of the quantum yield as the amount of ED was increased, although the difference between the two higher loads was minimal. The UV–Vis spectra of C-dots corresponding to entries 2–4 were similar (Figure 5), showing, however, a blue shift (approximately 4 nm) of the n-π* band (from 339 to 335 nm) for the highest loading of ED. In the absence of additives, the main absorption band peaks at 318 nm, with a perceptible shoulder at approximately 280 nm.
The higher mass ratio of ED/CGs in the load (doubled in entry 4 vs. entry 3) did not directly translate into the nitrogen content of the corresponding C-dots (15.26% vs. 11.20%). Taking into consideration the quantum yields obtained for the several samples (see Table 4), this may indicate that the useful amounts of ED to be used in C-dot synthesis should be approximately 0.1–0.15.
Mw-HTC experiments were undertaken to ascertain its eventual merits as compared to the HTC method. Under typical conditions transposed from the HTC method (CGsNP, 154 mg; ED, 0.40 mmol; mass ratio ED/CGs = 0.16; H2O, 5 mL; 190 °C, 3 h; stirring), a lower quantum yield (0.10) and a similar reaction yield (15.3%) were obtained. Its emission spectrum displayed its maximum at 464 nm as mentioned before (Figure 2b). Assays using other additives (DET, melamine, and urea) were conducted in the same way, being a trend similar to that observed with the HTC method (Figure 6). Overall, the C-dots obtained by Mw-HTC showed lower quantum yields compared to the HTC method.
The impact of the initial concentration of CGs on the photoluminescence of C-dots was next studied using Mw-HTC. For that, the residence time was reduced to 15 min, while the remaining experimental conditions were kept (mass ratio ED/CGs = 0.16; 190 °C; stirring). The UV–Vis, excitation and emission spectra are collected in Figure S12, along with that of the C-dots prepared by Mw-HTC at the lowest concentration of CGs and 3 h heating (see above). The UV–Vis, excitation, and emission spectra of the three samples (15 min reaction time) were quite similar and, thus, the main chromophores seemed to be the same. A notorious difference was, however, noted in relation to the C-dots prepared under an extended reaction time (3 h). One may immediately see that the n-π* band, which in the latter condition peaked at approximately 335 nm, suffered an appreciable red shift in the emission maxima (peaking at approximately 370 nm) when the reaction time was reduced. This fact may be explained by the higher thermal lability of the main chromophores (surface and/or inner functionalities) responsible for this type of electronic transition which upon prolonged heating are destroyed. The quantum yields of the three samples were essentially the same (i.e., 0.036, 0.037, and 0.040, on increasing concentrations), showing that the initial concentration of CGs did not significantly interfere with the photoluminescence of the resulting C-dots. At last, the influence of different types of CG sources on the luminescence of C-dots was evaluated. As shown in Figure 7, no differences were observed among the various sources, either using the HTC or Mw-HTC methods.

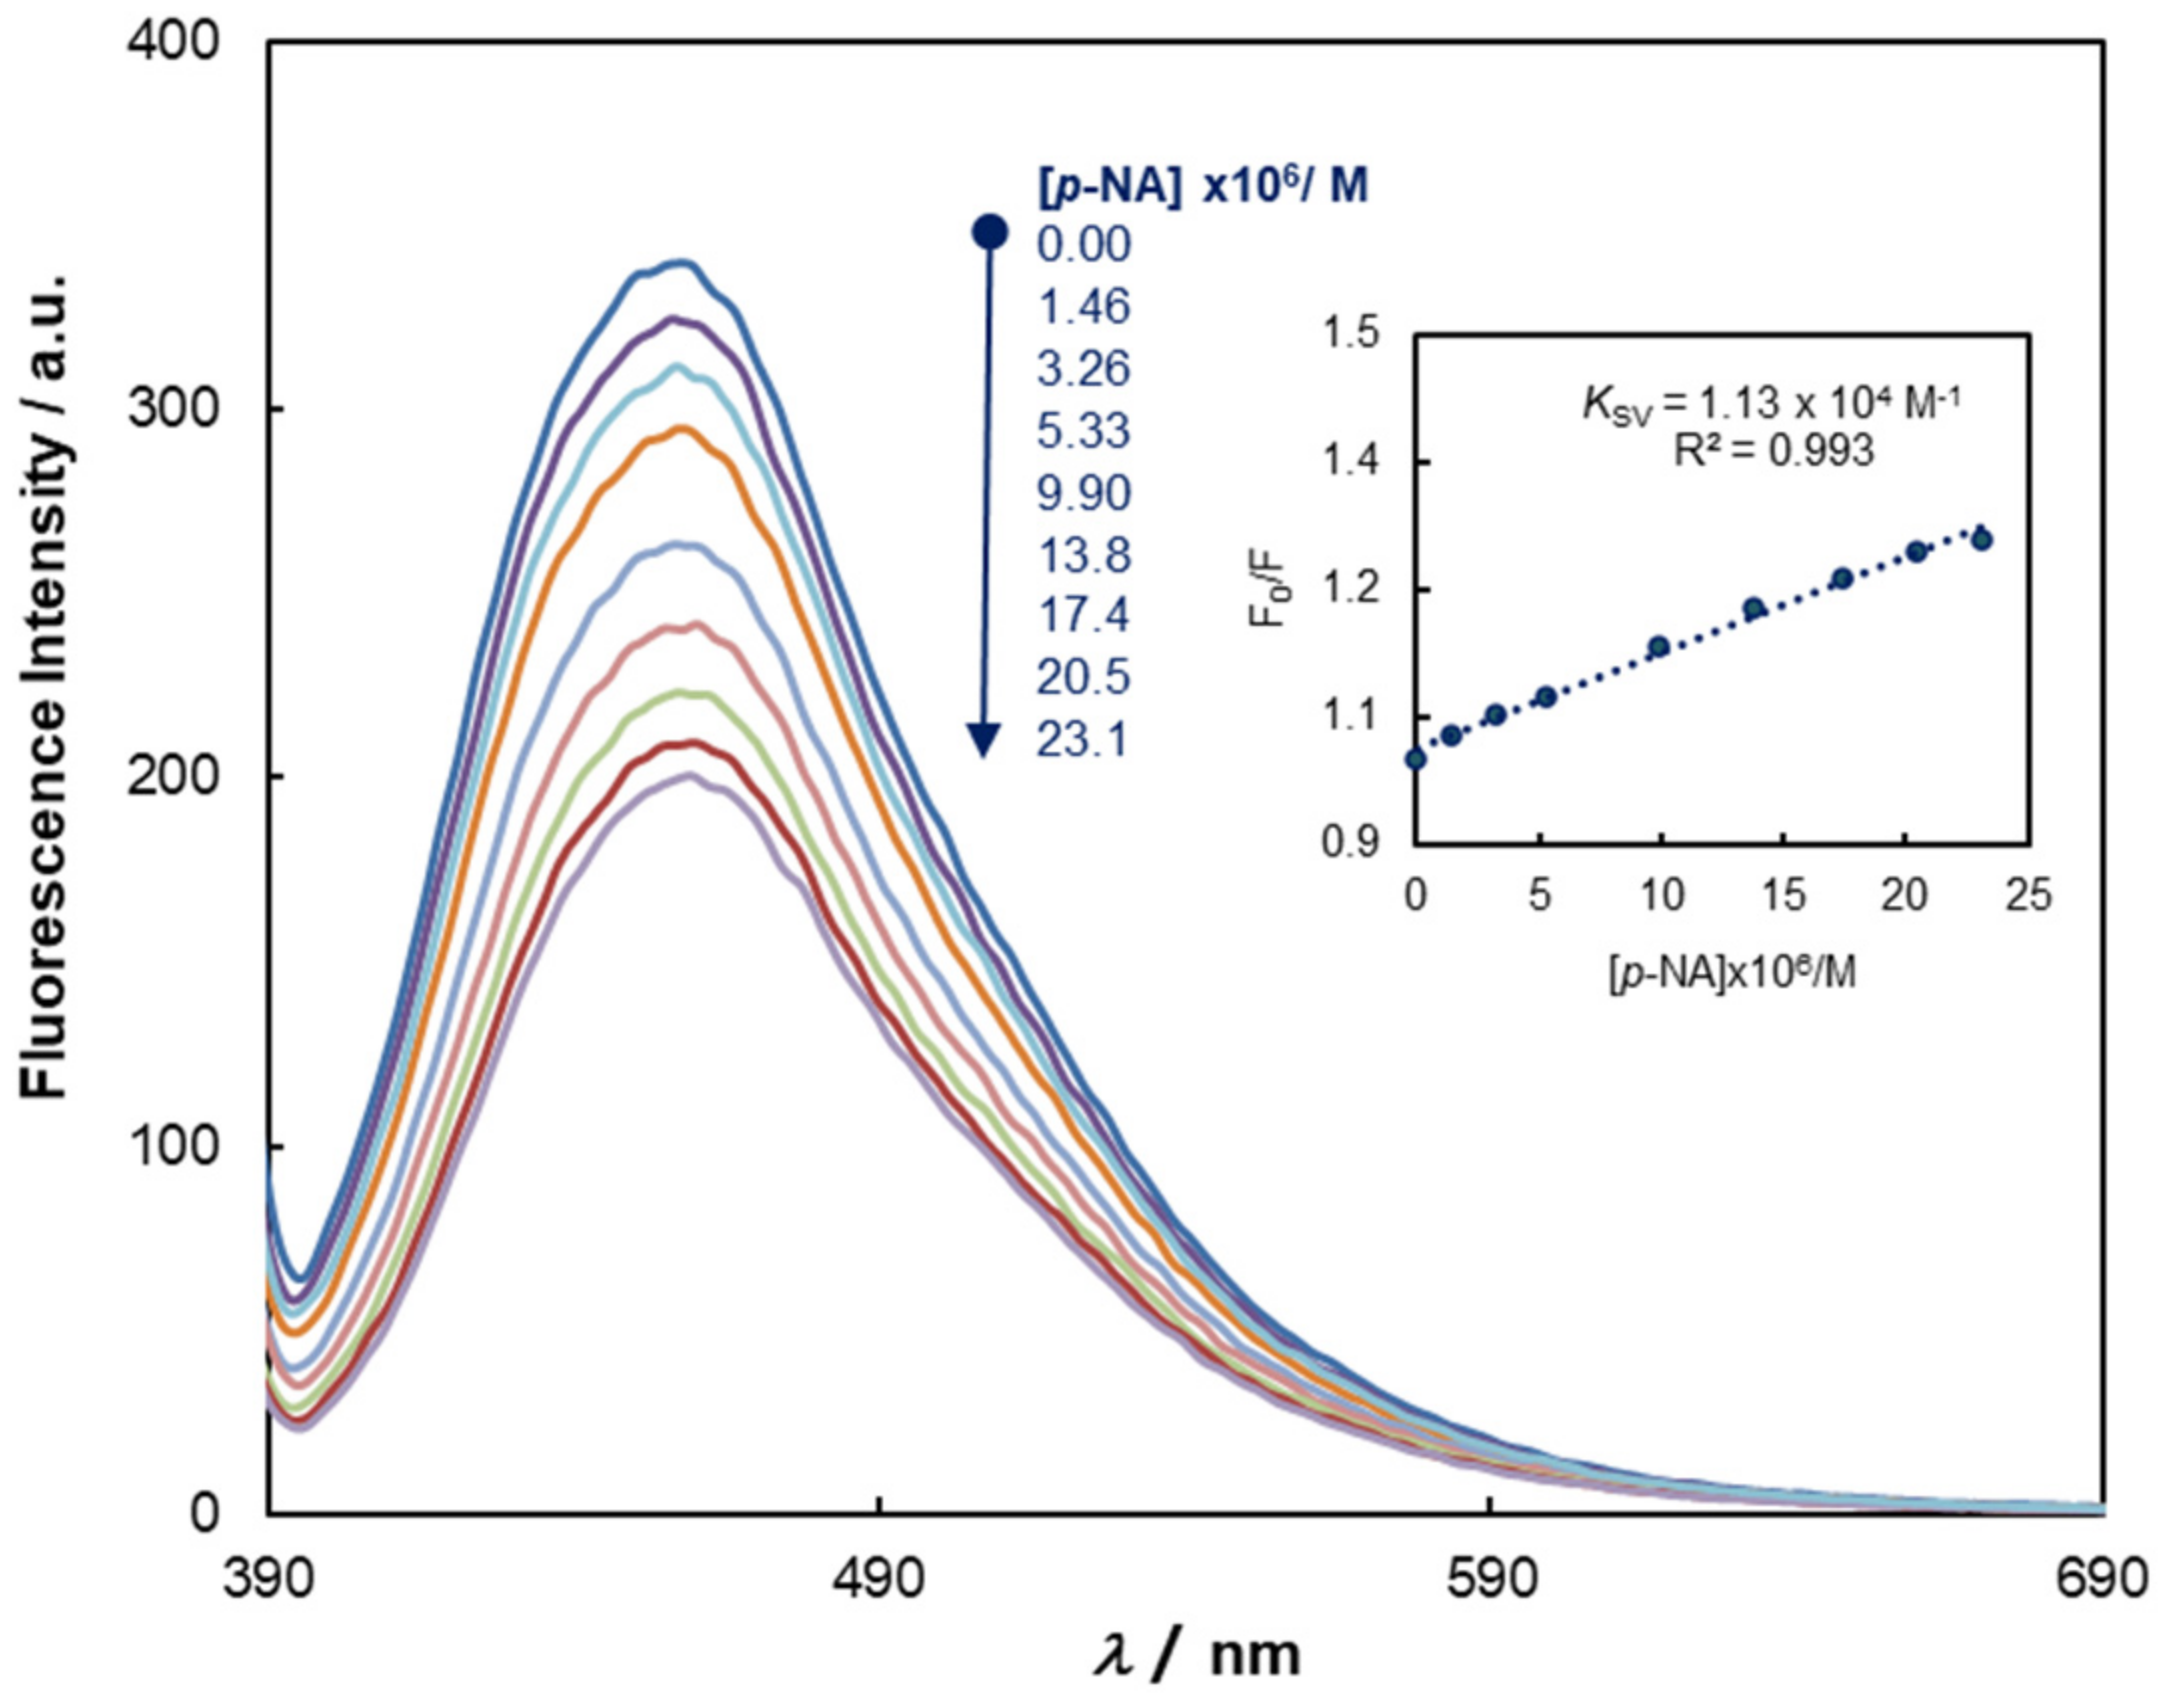
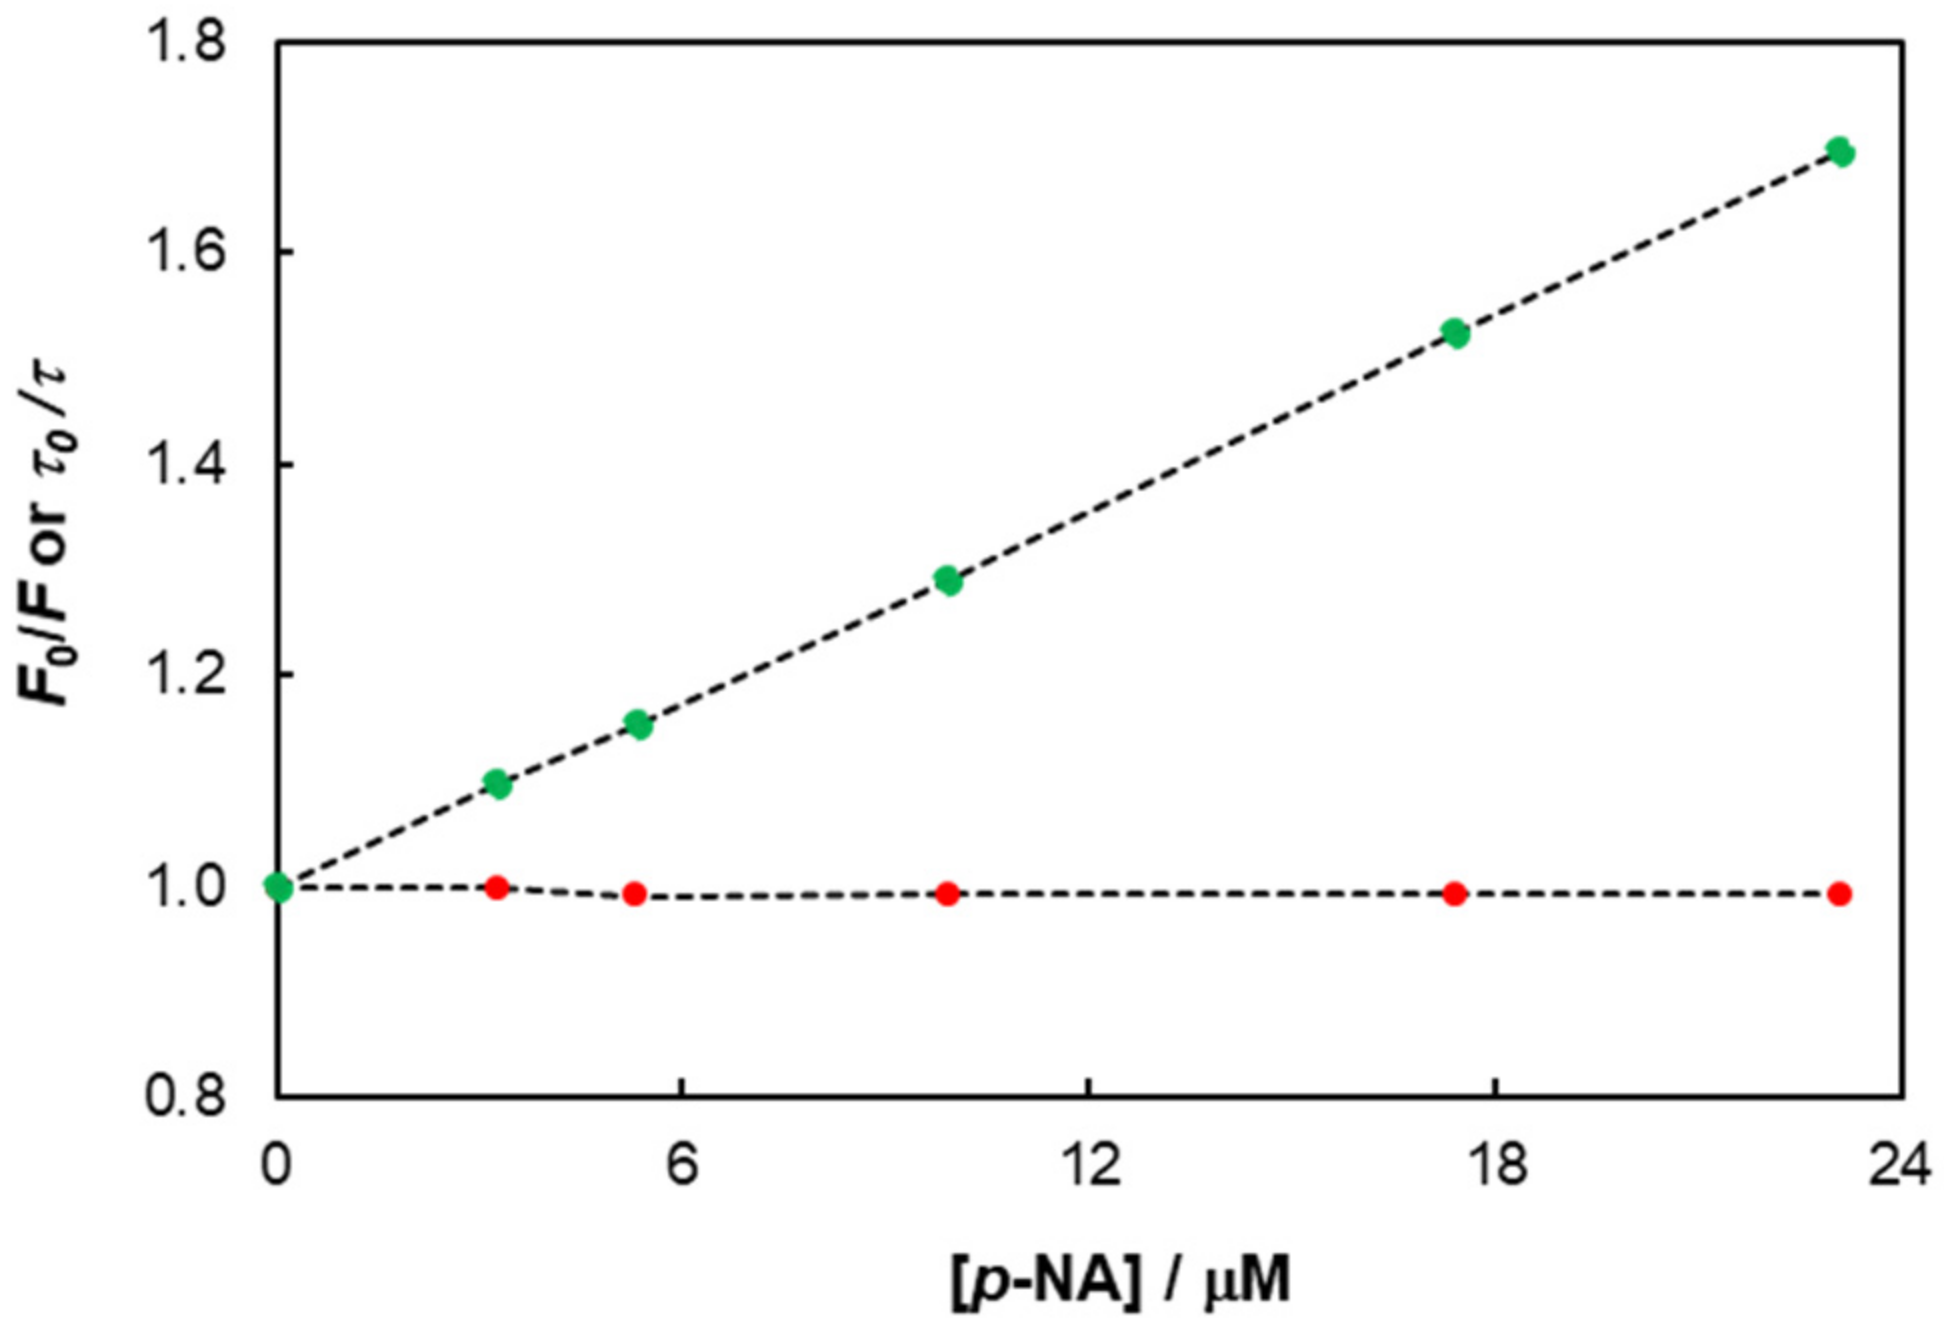
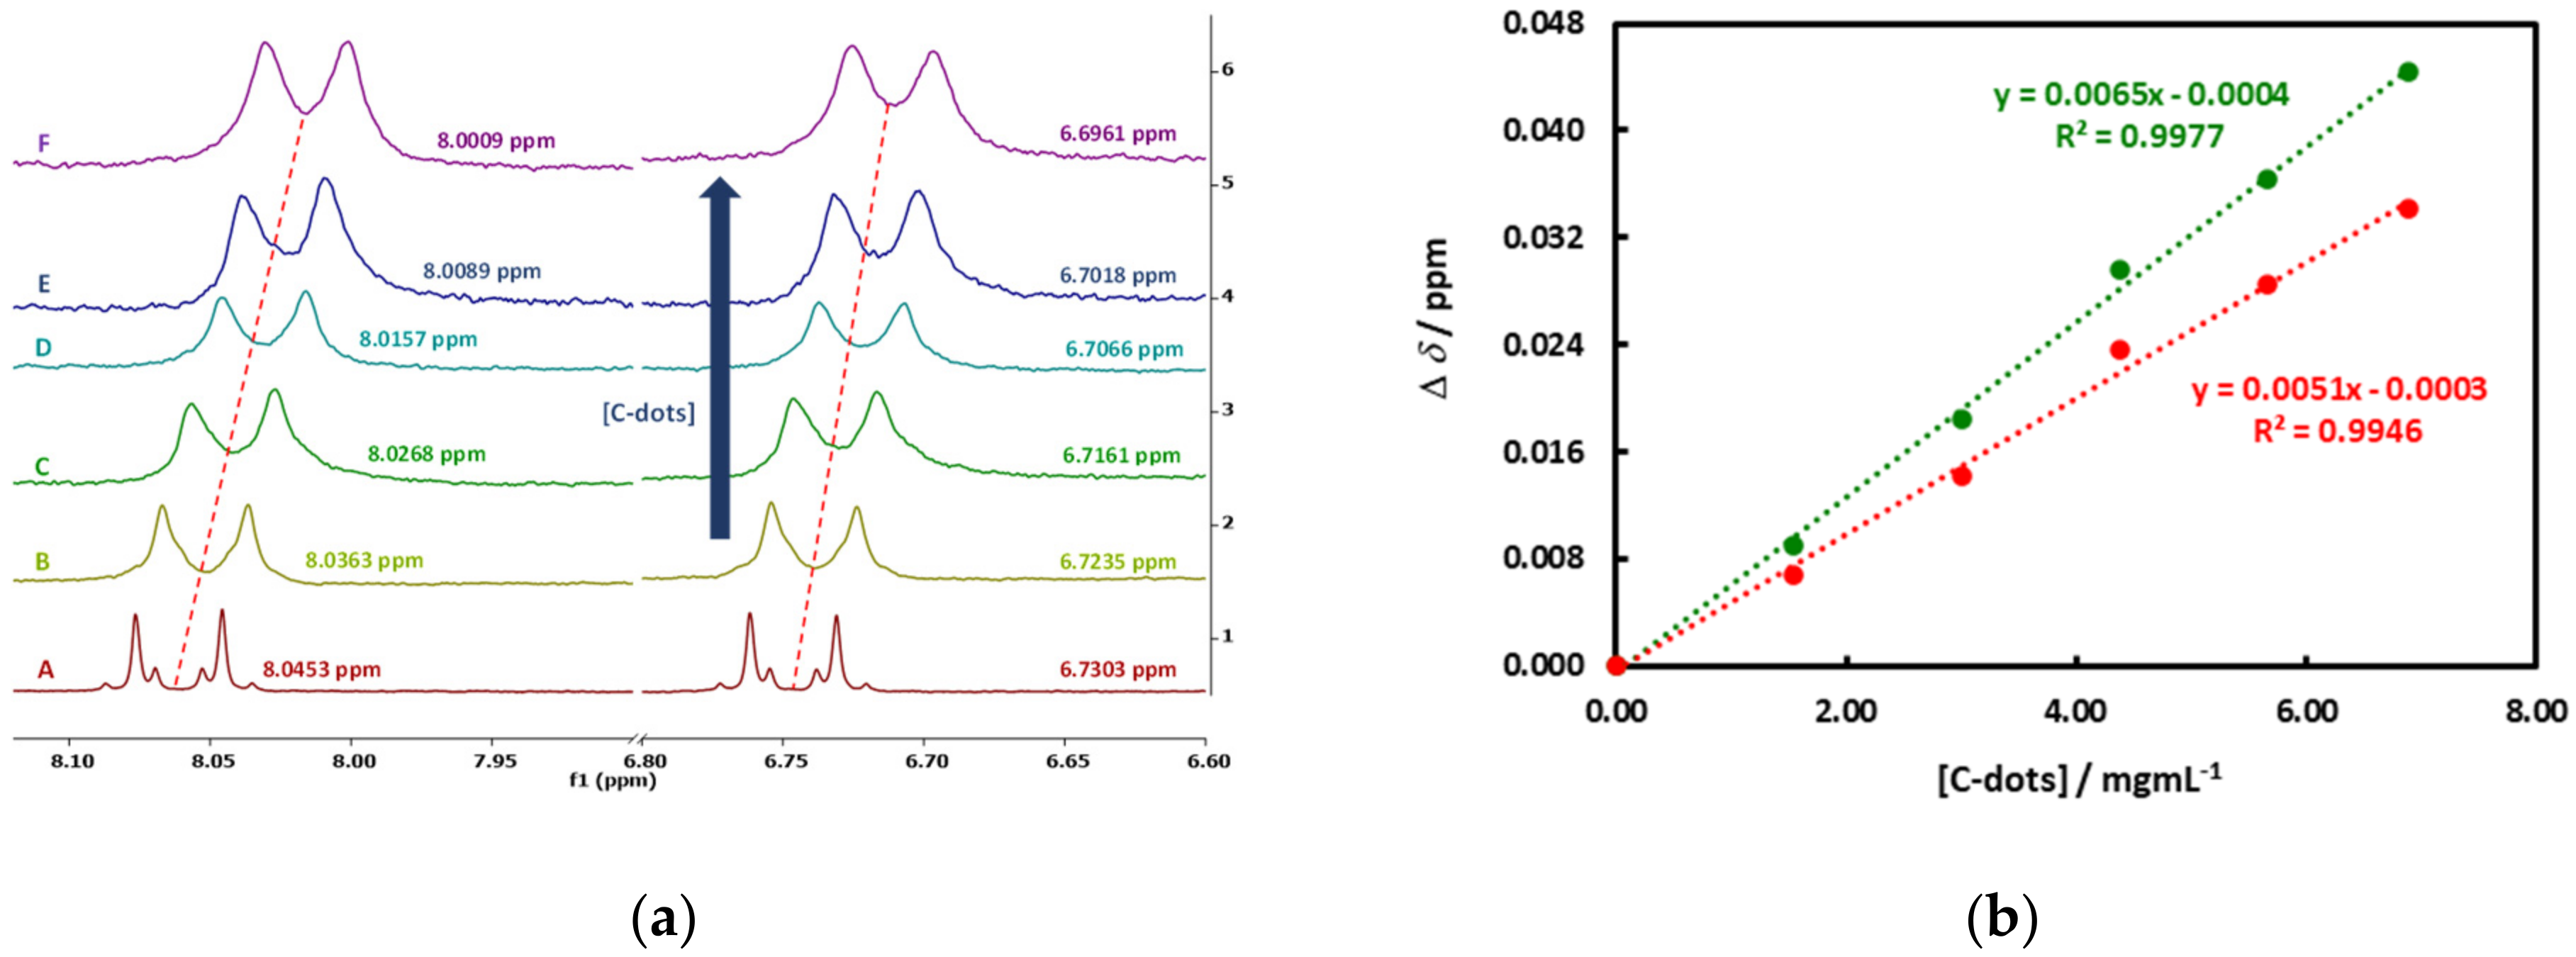
3.5. Detection of Nitroanilines

Nitroanilines are highly used as intermediates in the manufacture of organic dyes, pesticides, and pharmaceuticals. They are, nevertheless, noxious pollutants with high toxicity and mutagenic and carcinogenic activity in humans [57]. Detection of NAs have been accomplished by various methods including HPLC [58], voltammetry [59], fluorimetry [60], and SERS [61].
The ability of synthesized C-dots for the sensitive detection of isomeric nitroanilines (ortho (o), meta (m), and para (p) isomers) was explored, using the change of C-dots fluorescence as the signal transduction technique. The aqueous dispersions of C-dots (0.01 mg/mL) prepared by the HTC method under standard conditions (250 °C, 6 h, mass ratio ED/CGs = 0.16) were titrated with increasing amounts of NAs in a concentration range of 4.47 × 10⁻⁷–2.31 × 10⁻⁵ M, under 380 nm illumination. The fluorescence intensity of C-dots was found to decrease upon the addition of all the analytes. By using the Stern–Volmer equation [62], F0/F = 1 + KSV[Q], where F0 and F are the fluorescence intensities of C-dots in the absence and presence of the quencher, [Q] is the quencher concentration, and KSV is the static Stern–Volmer constant (after correction for hetero-inner filter effects (h-IFEs)), the corresponding association constants were calculated (Table 5). The higher sensitivity was achieved for p-NA (Figure 8), as expressed by its higher Stern–Volmer constant (KSV = 1.13 × 10⁴ M−1), with a limit of detection of 68 ppb, thereby showing the usefulness of the synthesized carbon nanomaterials for NA detection schemes. The emission spectra of C-dots titration with o-NA and m-NA are gathered in Figure S13.
The selectivity observed for the three isomeric NAs is not yet fully established, but a good correlation was found between the quenching efficiency and the dipole moment and, particularly, the hyperpolarizability of NAs, which increase in the order p-NA > o-NA > m-NA (see Table S2) [63].
The magnitude of Stern–Volmer constants (Table 5) obtained from steady-state fluorescence experiments was clearly indicated that a static mechanism was the dominant quenching mechanism. This could be easily checked by the calculation of the hypothetical bimolecular quenching constant (kq) that would be retrieved if a collisional quenching mechanism was in action (kq = 1.8 × 10¹² M−1s−1, which was over 180 times the diffusion limit in water). To further establish this point, time-resolved fluorescence titration assays were conducted. As shown in Figure 9, the ratio of the intensity average lifetimes in the absence and in the presence of p-NA did not change (τ0/τ = 1), which excludes, at this concentration range, the existence of any dynamic quenching, being it collisional or originated by resonance energy transfer (RET). This finding contrasts directly with a recent report [64], where RET was attributed as the main mechanism causing fluorescence quenching.
Evidence for the formation of ground–state complexes between C-dots and NAs was retrieved from NMR titrations between the most effective quencher (p-NA) and C-dots. As shown in Figure 10a, consistent upfield shifts of p-NA aryl protons were observed due to the shielding effects upon increasing the C-dots concentration, being slightly higher to those protons adjacent to the nitro group. These complexation-induced changes in the chemical shift (CIS) varied linearly with the amount of C-dots (Figure 10b), which correlated well with the high association constant (KSV) obtained from photoluminescence experiments, undoubtedly pointing to a static mechanism.

4. Conclusions

Coffee grounds, an abundant and environmentally problematic solid waste, proved to be a suitable vegetable biomass source to generate fluorescent C-dots using sustainable and swift hydrothermal carbonization methods. An extended set of reaction parameters for the HTC and Mw-HTC methods aiming to produce highly luminescent C-dots in better possible chemical yields were investigated. Under proper devised conditions, good reaction yields of C-dots endowed with blue luminescence (up to 0.18) were obtained.
The synthesized C-dots behaved exceptionally well as fluorescent sensors of nitroanilines in aqueous media. High levels of detection were achieved, excelling towards p-NA (LOD = 68 ppb). The higher hyperpolarizability and dipole moment of p-NA was suggested as being the main reason for the observed configurational selectivity among the nitroanilines. The quenching of C-dot fluorescence by NAs was studied by ground–state and time-resolved luminescence techniques. The results clearly indicated the existence of a static mechanism. Using proton NMR spectroscopy titrations, it was further possible to shed light on some of the interactions occurring between C-dots and NAs that may govern the formation of ground–state complexes.
In summary, this work demonstrated for the first time that C-dots from spent coffee grounds have an excellent sensing ability towards noxious nitroanilines.

Supplementary Materials

The following supporting information can be downloaded at: https://0-www-mdpi-com.brum.beds.ac.uk/article/10.3390/chemosensors10030113/s1. Table S1: Organic composition of CGs and CBs; Table S2: Dipole moments and hyperpolarizabilities of NAs; Figures S1, S3 and S4: FTIR spectra of CGs and CBs; Figure S6: FTIR spectra of C-dots’ ashes from the HTC method; Figure S2: 1H NMR spectra of CGsSV and CBsSV; Figure S5, S7: 1H NMR spectra of C-dots; Figure S8: Emission spectra of aqueous dispersions of C-dots (HTC); Figure S9: Intensity decay of aqueous dispersion of C-dots (Mw-HTC); Figures S10, S11: UV–Vis, excitation and emission spectra of aqueous dispersions of C-dots prepared at different temperatures; Figure S12: UV–Vis, excitation and emission spectra of aqueous dispersions of C-dots prepared by the Mw-HTC method with different CG concentrations; Figure S13: Emission spectra and Stern–Volmer plots of C-dots on titration with o-NA and m-NA.

Author Contributions

Conceptualization, J.V.P., A.I.C., and P.D.B.; methodology, J.V.P., A.I.C., and P.D.B.; investigation, B.M., A.I.C., P.D.B., and J.V.P.; resources, J.V.P.; data curation, J.V.P.; supervision, A.I.C. and P.D.B.; validation, A.I.C. and P.D.B.; writing—original draft preparation, A.I.C. and P.D.B.; writing—review and editing, J.V.P. All authors have read and agreed to the published version of the manuscript.

Funding

We are grateful to Fundação para a Ciência e a Tecnologia/Ministério da Ciência, Tecnologia e Ensino Superior (FCT/MCTES) for partial financial support under the projects UIDB/00616/2022 and UIDP/00616/2022, and IPL through the project: DotCoffee/IDI&CA/2020.

Acknowledgments

We thank M.N. Berberan-Santos (IST, iBB, Universidade de Lisboa) for providing access to fluorescence lifetime equipment and A. Fedorov for TCSPC measurements.

Conflicts of Interest

The authors declare no conflict of interest.

References

  1. Gayen, B.; Palchoudhury, S.; Chowdhury, J. Carbon Dots: A Mystic Star in the World of Nanoscience. J. Nanomater. 2019, 2019, 1–19. [Google Scholar] [CrossRef] [Green Version]
  2. Jagdale, P.; Ziegler, D.; Rovere, M.; Tulliani, J.M.; Tagliaferro, A. Waste Coffee Ground Biochar: A Material for Humidity Sensors. Sensors 2019, 19, 801–816. [Google Scholar] [CrossRef] [Green Version]
  3. Du, F.; Zhang, M.; Li, X.; Li, J.; Jiang, X.; Li, Z.; Hua, Y.; Shao, G.; Jin, J.; Shao, Q.; et al. Economical and green synthesis of bagasse derived fluorescent carbon dots for biomedical applications. Nanotechnology 2014, 25, 315702–315711. [Google Scholar] [CrossRef] [PubMed]
  4. Liu, S.; Tian, J.; Wang, L.; Zhang, Y.; Qin, X.; Luo, Y.; Asiri, A.M.; Al-Youbi, A.O.; Sun, X. Hydrothermal Treatment of Grass: A Low-Cost, Green Route to Nitrogen-Doped, Carbon-Rich, Photoluminescent Polymer Nanodots as an Effective Fluorescent Sensing Platform for Label-Free Detection of Cu(II) Ions. Adv. Mat. 2012, 24, 2037–2041. [Google Scholar] [CrossRef] [PubMed]
  5. Baig, N.; Kammakakam, I.; Falatha, W. Nanomaterials: A review of synthesis methods, properties, recent progress, and challenges. Mater. Adv. 2021, 2, 1821–1871. [Google Scholar] [CrossRef]
  6. Xu, X.; Ray, R.; Gu, Y.; Ploehn, H.J.; Gearheart, L.; Raker, K.; Scrivens, W.A. Electrophoretic Analysis and Purification of Fluorescent Single-Walled Carbon Nanotube Fragments. J. Am. Chem. Soc. 2004, 126, 12736–12737. [Google Scholar] [CrossRef]
  7. Kurian, M.; Pau, A. Recent trends in the use of green sources for carbon dot synthesis—A short review. Carbon Trends 2021, 3, 100032. [Google Scholar] [CrossRef]
  8. Pan, M.; Xie, X.; Liu, K.; Yang, J.; Hong, L.; Wang, S. Fluorescent Carbon Quantum Dots—Synthesis, Functionalization and Sensing Application in Food Analysis. Nanomaterials 2020, 10, 930. [Google Scholar] [CrossRef]
  9. Liu, J.; Li, R.; Yang, B. Carbon Dots: A New Type of Carbon-Based Nanomaterial with Wide Applications. ACS Cent. Sci. 2020, 6, 2179–2195. [Google Scholar] [CrossRef]
  10. Tuerhong, M.; Yang, X.; Xue-Bo, Y. Review on Carbon Dots and Their Applications. Chin. J. Anal. Chem. 2017, 45, 139–150. [Google Scholar] [CrossRef]
  11. Liu, M.L.; Chen, B.B.; Li, C.M.; Huang, C.Z. Carbon dots: Synthesis, formation mechanism, fluorescence origin and sensing applications. Green Chem. 2019, 21, 449–471. [Google Scholar] [CrossRef]
  12. Lin, F.; Li, C.; Chen, Z. Bacteria-Derived Carbon Dots Inhibit Biofilm Formation of Escherichia coli without Affecting Cell Growth. Front. Microbiol. 2015, 9, 259. [Google Scholar] [CrossRef] [PubMed]
  13. Sharma, A.; Das, J. Small molecules derived carbon dots: Synthesis and applications in sensing, catalysis, imaging, and biomedicine. J. Nanobiotechnol. 2019, 17, 92. [Google Scholar] [CrossRef] [PubMed] [Green Version]
  14. Kasouni, A.; Chatzimitakos, T.; Stalikas, C. Bioimaging Applications of Carbon Nanodots: A Review. C 2019, 5, 19. [Google Scholar] [CrossRef] [Green Version]
  15. Rosso, C.; Filippini, G.; Prato, M. Carbon Dots as Nano-Organocatalysts for Synthetic Applications. ACS Catal. 2020, 10, 8090–8105. [Google Scholar] [CrossRef]
  16. Wang, Z.; Hu, T.; Liang, R.; Wei, M. Application of Zero-Dimensional Nanomaterials in Biosensing. Front. Chem. 2020, 8, 320. [Google Scholar] [CrossRef]
  17. Stepanidenko, E.A.; Ushakova, E.V.; Fedorov, A.V.; Rogach, A.L. Applications of Carbon Dots in Optoelectronics. Nanomaterials 2021, 11, 364. [Google Scholar] [CrossRef]
  18. Jelinek, R. Materials Science Applications of Carbon-Dots. In Carbon Quantum Dots, Carbon Nanostructures; Springer International Publishing: Cham, Switzerland, 2017; pp. 93–114. [Google Scholar] [CrossRef]
  19. El-Shabasy, R.M.; Elsadek, M.F.; Ahmed, B.M.; Farahat, M.F.; Mosleh, K.N.; Taher, M.M. Recent Developments in Carbon Quantum Dots: Properties, Fabrication Techniques, and Bio-Applications. Processes 2021, 9, 388. [Google Scholar] [CrossRef]
  20. Das, R.; Bandyopadhyay, R.; Pramanik, P. Carbon quantum dots from natural resource: A review. Mater. Today Chem. 2018, 8, 96–109. [Google Scholar] [CrossRef]
  21. Atchudan, R.; Edison, T.N.J.I.; Perumal, S.; Vinodh, R.; Sundramoorthy, A.K.; Babu, R.S.; Lee, Y.R. Leftover Kiwi Fruit Peel-Derived Carbon Dots as a Highly Selective Fluorescent Sensor for Detection of Ferric Ion. Chemosensors 2021, 9, 166. [Google Scholar] [CrossRef]
  22. Kang, C.; Huang, Y.; Yang, H.; Yan, X.F.; Chen, Z.P. A Review of Carbon Dots Produced from Biomass Wastes. Nanomaterials 2020, 10, 2316. [Google Scholar] [CrossRef] [PubMed]
  23. Liang, Z.; Zeng, L.; Cao, X.; Wang, Q.; Wang, X.; Sun, R. Sustainable carbon quantum dots from forestry and agricultural biomass with amplified photoluminescence by simple NH4OH passivation. J. Mater. Chem. C 2014, 2, 9760–9766. [Google Scholar] [CrossRef]
  24. Oliveira, B.P.; Abreu, F.O.M.S. Carbon Quantum Dots Synthesis from Waste and by-products: Perspectives and challenges. Mater. Lett. 2020, 282, 128764. [Google Scholar] [CrossRef]
  25. Sharma, V.; Tiwari, P.; Mobin, S.M. Sustainable Carbon-dots: Recent advances in green carbon dots for sensing and bioimaging. J. Mater. Chem. B 2017, 5, 8904–8924. [Google Scholar] [CrossRef] [PubMed]
  26. Yan, H.; Li, D.; Liu, Y.; Xu, X.; Xiong, C. Nitrogen-Doped Carbon Dots from Plant Cytoplasm as Selective and Sensitive Fluorescent Probes for Detecting p-Nitroaniline in Both Aqueous and Soil Systems. Analyst 2015, 140, 1428–1431. [Google Scholar] [CrossRef] [PubMed]
  27. Alexandre, M.R.; Costa, A.I.; Berberan-Santos, M.N.; Prata, J.V. Finding Value in Wastewaters from the Cork Industry: Carbon Dots Synthesis and Fluorescence for Hemeprotein Detection. Molecules 2020, 25, 2320–2337. [Google Scholar] [CrossRef]
  28. Prata, J.V.; Alexandre, M.R.; Costa, A.I. Produção de Nanomateriais de Carbono Luminescentes a partir de Águas de Cozedura Industriais da Cortiça. (Production of Luminescent Carbon Nanomaterials from Cork Industry Wastewaters). Portuguese Patent NO. 109379, 10 May 2016. [Google Scholar]
  29. Sousa, D.A.; Costa, A.I.; Alexandre, M.R.; Prata, J.V. How an Environmental Issue could Turn into Useful High-valued Products: The Olive Mill Wastewater Case. Sci. Total Environ. 2019, 647, 1097–1105. [Google Scholar] [CrossRef] [PubMed]
  30. Prata, J.V.; Costa, A.I. Nanomateriais de Carbono Luminescentes obtidos por Conversão Química das Águas Residuais do Processamento Industrial do Azeite (Luminescent Carbon Nanomaterials by Chemical Conversion of Olive Mill Wastewaters). Portuguese Patent NO. 110131, 8 June 2017. [Google Scholar]
  31. Coffee Market Report, December 2021, International Coffee Organization. Available online: https://www.ico.org/Market-Report-21-22-e.asp (accessed on 5 January 2022).
  32. Figueroa, G.A.; Homann, T.; Rawel, H.M. Coffee Production Wastes: Potentials and Perspectives. Austin Food Sci. 2016, 1, 1014–1018. [Google Scholar]
  33. Mussatto, S.I.; Machado, E.M.S.; Martins, S.; Teixeira, J.A. Production, Composition, and Application of Coffee. Food Bioproc. Tech. 2011, 4, 661–672. [Google Scholar] [CrossRef] [Green Version]
  34. Tokimoto, T.; Kawasaki, N.; Nakamura, T.; Akutagawa, J.; Tanada, S.J. Removal of lead ions in drinking water by coffee grounds as vegetable biomass. J. Colloid Interface Sci. 2005, 281, 56–61. [Google Scholar] [CrossRef]
  35. Echeverria, M.C.; Nuti, M. Valorisation of the Residues of Coffee Agro-industry: Perspectives and Limitations. Open Waste Manag. J. 2017, 10, 13–22. [Google Scholar] [CrossRef] [Green Version]
  36. Unni, M.S.; George, L.; Bhange, S.N.; Devi, N.; Kurungot, S. Valorization of coffee bean waste: A coffee bean waste derived multifunctional catalyst for photocatalytic hydrogen production and electrocatalytic oxygen reduction reactions. RSC Adv. 2016, 6, 82103–82111. [Google Scholar] [CrossRef]
  37. Hsu, P.C.; Shih, Z.Y.; Lee, C.H.; Chang, H.T. Synthesis and analytical applications of photoluminescent carbon nanodots. Green Chem. 2012, 14, 917–920. [Google Scholar] [CrossRef]
  38. Wang, L.; Li, W.; Wu, B.; Li, Z.; Wang, S.; Liu, Y.; Pan, D.; Wu, M. Facile synthesis of fluorescent graphene quantum dots from coffee grounds for bioimaging and sensing. Chem. Eng. J. 2016, 300, 75–82. [Google Scholar] [CrossRef]
  39. Ge, L.; Yu, H.; Ren, H.; Shi, B.; Guo, Q.; Gao, W.; Li, Z.; Li, J. Photoluminescence of carbon dots and their applications in Hela cell imaging and Fe3+ ion detection. J. Mater. Sci. 2017, 52, 9979–9989. [Google Scholar] [CrossRef]
  40. Xu, H.; Xie, L.; Hakkarainen, M. Coffee-Ground-Derived Quantum Dots for Aqueous Processable Nanoporous Graphene Membranes. ACS Sustain. Chem. Eng. 2017, 5, 5360–5367. [Google Scholar] [CrossRef]
  41. Chen, J.; Du, H.; Xu, Y.; Ma, B.; Zheng, Z.; Li, P.; Jiang, Y. A turn-on fluorescent sensor based on coffee-ground carbon dots for the detection of sodium cyclamate. J. Mater. Sci.: Mater. Electron. 2021, 32, 13581–13587. [Google Scholar] [CrossRef]
  42. Honga, W.T.; Yang, H.K. Anti-counterfeiting application of fluorescent carbon dots derived from wasted coffee grounds. Optik 2021, 241, 16644. [Google Scholar] [CrossRef]
  43. Singleton, V.L.; Rossi, J.A. Colorimetry of total phenolics with phosphomolybdic-phosphotungstic acid reagents. Am. J. Enol. Vitic. 1965, 16, 144–158. [Google Scholar]
  44. Hajimahmoodi, M.; Moghaddam, G.; Ranjbar, A.M.; Khazani, H.; Sadeghi, N.; Oveisi, M.R.; Jannat, B. Total phenolic, flavonoids, tannin content and antioxidant power of some iranian pomegranate flower cultivars (Punica granatum L.). Am. J. Plant Sci. 2013, 4, 1815–1820. [Google Scholar] [CrossRef] [Green Version]
  45. Pekal, A.; Pyrynska, K. Evaluation of aluminium complexation reaction for flavonoid content assay. Food Anal. Methods 2014, 7, 1776–1782. [Google Scholar] [CrossRef] [Green Version]
  46. Dubois, M.; Gilles, K.A.; Hamilton, J.K.; Rebers, P.A.; Smith, F. Colorimetric method for determination of sugars and related substances. Anal. Chem. 1956, 28, 350–356. [Google Scholar] [CrossRef]
  47. Sedmak, J.J.; Grossberg, S.E. A rapid, sensitive, and versatile assay for protein using Coomassie Brilliant Blue G250. Anal. Biochem. 1977, 79, 544–552. [Google Scholar] [CrossRef]
  48. Rabemanolontsoa, H.; Ayada, S.; Saka, S. Quantitative method applicable for various biomass species to determine their chemical composition. Biomass Bioenerg. 2011, 35, 4630–4635. [Google Scholar] [CrossRef] [Green Version]
  49. Anon. A Guide to Recording Fluorescence Quantum Yields, Horiba Scientific. 2018. Available online: http://www.horiba.com/fileadmin/uploads/Scientific/Documents/Fluorescence/quantumyieldstrad.pdf (accessed on 10 January 2022).
  50. Borissevitch, I.E. More about the inner filter effect: Corrections of Stern-Volmer fluorescence quenching constants are necessary at very low optical absorption of the quencher. J. Lumin. 1999, 81, 219–224. [Google Scholar] [CrossRef]
  51. Long, G.L.; Winefordner, J.D. Limit of detection a closer look at the IUPAC definition. Anal. Chem. 1983, 55, 712–724. [Google Scholar] [CrossRef]
  52. Consonni, R.; Cagliani, L.R.; Cogliati, C. NMR based geographical characterization of roasted coffee. Talanta 2012, 88, 420–426. [Google Scholar] [CrossRef]
  53. Miller, F.A.; Wilkins, C.H. Infrared spectra and characteristic frequencies of inorganic ions. Anal. Chem. 1952, 24, 1253–1294. [Google Scholar] [CrossRef]
  54. Hola, K.; Bourlinos, A.B.; Kozak, O.; Berka, K.; Siskova, K.M.; Havrdova, M.; Tucek, J.; Safarova, K.; Otyepka, M.; Giannelis, E.P. Photoluminescence effects of graphitic core size and surface functional groups in carbon dots: COO- induced red-shift emission. Carbon 2014, 70, 279–286. [Google Scholar] [CrossRef]
  55. Zhang, Y.; Wang, Y.; Feng, X.; Zhang, F.; Yang, Y.; Liu, X. Effect of reaction temperature on structure and fluorescence properties of nitrogen-doped carbon dots. Appl. Surf. Sci. 2016, 387, 1236–1246. [Google Scholar] [CrossRef]
  56. Song, Y.; Zhu, S.; Zhang, S.; Fu, Y.; Wang, L.; Zhao, X.; Yang, B. Investigation from chemical structure to photoluminescent mechanism: A type of carbon dots from the pyrolysis of citric acid and an amine. J. Mater. Chem. C 2015, 3, 5976–5984. [Google Scholar] [CrossRef]
  57. Shuker, L.K.; Batt, S.; Rystedt, I.; Berlin, M. The Health Effects of Aromatic Amines—A Review, A Technological Report; Monitoring and Assessment Research Centre: Cambridge, MA, USA, 1986; Available online: https://apps.who.int/iris/handle/10665/40073 (accessed on 26 January 2022).
  58. Strong, C.; Guo, Y.; Liu, W. Simultaneous determination of five nitroaniline and dinitroaniline isomers in wastewaters by solid-phase extraction and high-performance liquid chromatography with ultraviolet detection. Chemosphere 2010, 81, 430–435. [Google Scholar] [CrossRef]
  59. Lin, X.; Ni, Y.; Kokot, S. Voltammetric analysis with the use of a novel electro-polymerised graphene-nafion film modified glassy carbon electrode: Simultaneous analysis of noxious nitroaniline isomers. J. Hazard. Mater. 2012, 243, 232–241. [Google Scholar] [CrossRef]
  60. Ji, N.-N.; Shi, Z.-Q.; Hu, H.-L.; Zheng, H.-G. A triphenylamine-functionalized luminescent sensor for efficient p-nitroaniline detection. Dalton Trans. 2018, 47, 7222–7228. [Google Scholar] [CrossRef] [PubMed]
  61. Chen, S.; Bu, M.; You, X.; Dai, Z.; Shi, J. High-performance detection of p-nitroaniline on defect-graphene SERS substrate utilizing molecular imprinting technique. Microchem. J. 2021, 168, 106536. [Google Scholar] [CrossRef]
  62. Lakowicz, J.R. Principles of Fluorescence Spectroscopy, 3rd ed.; Springer: Berlin, Germany, 2006; ISBN 978-0387-31278-1. [Google Scholar]
  63. Oudar, J.L.; Chemla, D.S. Hyperpolarizabilities of nitroanilines. J. Chem. Phys. 1977, 66, 2664–2668. [Google Scholar] [CrossRef]
  64. Wang, J.H.; Li, G.Y.; Liu, X.J.; Feng, R.; Zhang, H.J.; Zhang, S.Y.; Zhang, Y.H. A fluorescent anthracene-based metal-organic framework for highly selective detection of nitroanilines. Inorg. Chim. Acta 2018, 473, 70–74. [Google Scholar] [CrossRef]
Figure 1. FTIR spectra (KBr) of C-dots from CGsSV by HTC (green line) and Mw-HTC (blue line) methods.
Chemosensors 10 00113 g001
Figure 2. UV–Vis (a) and excitation (blue line; monitored at 461 nm) and emission (green line; λexc = 380 nm) (b) spectra of aqueous dispersions (0.1 mg/mL) of C-dots from CGsSV (HTC (solid line) and Mw-HTC (dashed line)).
Chemosensors 10 00113 g002
Figure 3. Normalized emission spectra of aqueous dispersions (0.1 mg/mL) of C-dots (HTC) obtained from CGsSV (excitation in the 340–420 nm range) (a) and aqueous dispersion of C-dots samples under daylight and UV–Vis excitation (b).
Chemosensors 10 00113 g003
Figure 4. Intensity decay of aqueous dispersions of C-dots (HTC) excited at 340 nm and observed at 434 nm.
Chemosensors 10 00113 g004
Figure 5. UV–Vis spectra of aqueous dispersions (0.1 mg/mL) of C-dots obtained from CGs with different amounts of ED and without additives (see Table 4).
Chemosensors 10 00113 g005
Figure 6. Comparative chart of the photoluminescence of C-dots prepared under the HTC and Mw-HTC methods using various additives (HTC: 250 °C, 6 h; Mw-HTC: 190 °C, 3 h; mass ratio amine/CGs = 0.16).
Chemosensors 10 00113 g006
Figure 7. Comparative chart of photoluminescence of C-dots prepared under the HTC and Mw-HTC methods using various sources of CGs (HTC: 250 °C, 6 h; Mw-HTC: 190 °C, 3 h; mass ratio ED/CGs = 0.16).
Chemosensors 10 00113 g007
Figure 8. Emission spectra of aqueous dispersions of C-dots (0.01 mg/mL) after successive additions (from 4.47 × 10⁻⁷ M up to 2.31 × 10⁻⁵ M) of p-NA (λexc = 380 nm). Inset: Stern–Volmer plot after correction for h-IFEs.
Chemosensors 10 00113 g008
Figure 9. Steady-state (green dots) and time-resolved (red dots) Stern–Volmer plots of aqueous dispersions of C-dots (0.01 mg/mL) in the presence of increasing amounts (3.26 × 10⁻⁶ M–23.1 × 10⁻⁶ M) of p-NA.
Chemosensors 10 00113 g009
Figure 10. (a) Partial 1H NMR spectra of titration of p-NA (5 mM in D2O; (A) by C-dots (increasing concentration (B)–(F) at 25 ºC; (b) CIS of p-NA aryl protons with increasing C-dots concentration.
Chemosensors 10 00113 g010
Table 1. Physico-chemical characteristics of CGs and CBs and their water extracts.
ParameterCoffee GroundsCoffee Beans
CGsSVCGsCQCGsNPCBsSVCBsCQCBsNP
TS-WE (g/100 g)6.857.4112.4521.7722.3828.20
pH (WE)5.05.65.1---
Ashes (%)1.211.831.504.554.194.39
MicroanalysisC, 45.95%; H, 5.11%; N, 3.53% O (calc.), 44.20%; S < 0.3%-C, 45.86%; H, 5.26%; N, 4.16% O (calc.), 43.21%; S < 0.3%C, 49.68%; H, 5.33%; N, 5.16% O (calc.), 35.28%; S < 0.3%-C, 47.44%; H, 5.24%; N, 4.69% O (calc.), 38.24%; S < 0.3%
Table 2. Temperature effect on the C-dots’ luminescence and reaction yield 1.
EntryT (°C)ΦF (λexc = 380 nm)λem max (nm)ηmass (%)
1200 0.06846415.5
2250 0.1246116.5
3300 0.184499.8
1 Typical HTC reaction conditions: CGs (3.69 g), ED (9.67 mmol), mass ratio (ED/CGs) = 0.16, 4 h, and stirring.
Table 3. Dependence of C-dots’ luminescence and reaction yield on additives 1.
EntryAdditiveΦFexc = 380 nm)ηmass (%)
1-0.0510.0
2ED0.1816.0
3Melamine0.0510.3
4Urea0.0810.8
5DET0.1520.4
1 Typical HTC reaction conditions: CGs (3.69 g), mass ratio (additive/CGs) = 0.16, 250 °C, 6 h, and stirring.
Table 4. Effect of ED content on the C-dots’ luminescence and reaction yield 1.
EntryMass Ratio ED/CGsΦFexc = 380 nm)ηmass (%)
1-0.0510.0
20.080.0914.5
30.160.1216.5
40.320.1425.5
1 Typical HTC reaction conditions: CGs (3.69 g), 250 °C, 4 h, and stirring.
Table 5. Stern–Volmer constants of NA quenching of C-dots and their LOD 1.
EntryAnalyteKsv/M−1LOD/ppb
1o-NA6.00 ± 0.05 × 10³ (R2 = 0.994)129
2m-NA2.21 ± 0.02 × 10³ (R2 = 0.969)350
3p-NA1.13 ± 0.10 × 10⁴ (R2 = 0.992)68
1 Excitation at 380 nm and monitored emission at 459 nm for aqueous dispersions of C-dots (0.01 mg/mL) at rt in air equilibrated conditions.
Publisher’s Note: MDPI stays neutral with regard to jurisdictional claims in published maps and institutional affiliations.

