1. Introduction
The use of conventional electrodes has evolved through several designs and one of the most used is based on chemically modified electrodes (CMEs). A CME is a necessary approach to solving sensitivity problems in the detection of analytes that are chemically similar [
1]. The literature reports many examples of electrodes modified with nanomaterials [
2] and molecules [
3,
4] such as multiwall carbon nanotubes (MWCNTs) [
5], carboxylic acid [
6], poly(glutamic acid) [
7], penicillamine [
8], titanium oxide [
9], and others [
1], selected according to the intended need.
The possibility of creating polymeric structures in situ to generate CMEs is currently finding wide interest, also in (bio)sensors with electrochemical detection. A wide range of polymers may be produced by electropolymerization, as long as electrical conditions that enable the formation of radical species at the electrode surface are applied to the electrochemical system. The resulting polymers formed at the electrode surface change the electrical features of the receptor surface, which becomes either more conductive or more insolating. The resulting polymers may also display electroactive features, signaling the presence of the polymer.
Polythionine (PTH) is among such polymers. It has received considerable attention as a polymeric film for sensing purposes, yielding improved sensitivity and lower limits of detection [
1]. Thionine (TH) is its monomeric species, which is a redox dye that has been extensively studied (de Sousa et al., 2018). PTH-modified electrodes have been prepared in a simple way by cyclic voltammetry (CV) having a solution of TH under a potential sweep in the range from −0.4 to +0.4 V [
10]; the specific potential range of interest depends on the electrical features of the receptor substrate. They may also be obtained by chronoamperometry, in which a constant oxidation potential is applied for a given time [
11]. Overall, it has been accepted that the most probable mechanism for the electropolymerization of phenothiazine derivatives is the bond between the nitrogen atom of the amine group and the atom of the phenothiazine ring [
12].
Still, the final electrochemical stability of the PTH-modified electrodes is very critical in sensing and depends greatly on the medium in which TH solutions arere prepared (ionic content, type of ionic species, and pH) and the electrochemical conditions applied. While PTH films prepared by applying constant positive voltage in 0.05 M H
2SO
4 are not stable when evaluated in a neutral medium, those prepared in two oxidation steps of constant potential and cyclic scanning in neutral phosphate buffer are stable [
1]. In turn, Ferreira et al. conducted electrochemical characterization studies of PTH films produced by different scanning speeds and variations in the number of potential cycles. They concluded that the electroactivity and stability of the resulting PTH are pH-dependent. In a wide range of pH values, 1.3 to 9, the authors demonstrated that when increasing the pH to more alkaline media, a lower electroactivity is observed that is associated with the loss of electroactive sites. In other words, the transfer of electrons between neighboring sites is lower at more alkaline pH [
13]. Yang et al. presented what may be called a hybrid approach to prepare PTH-modified electrodes [
11], by using two steps of constant oxidation potential and scanning of the cyclic potential in neutral phosphate solution. The authors referred to two electropolymerization steps when, first, they subjected the electrode to a fixed potential for a few minutes, and as the second step, voltametric cycles in a potential range with a constant sweep. Gao et al. modified screen-printed carbon electrodes (C-SPE) with PTH to determine the oxidation of nicotinamide adenine dinucleotide (NADH) [
14]. The electropolymerization was conducted in PhB pH 7.0 with 25 scanning cycles. The authors considered that 25 CV cycles were adequate to control the electroactive residues in the PTH films. Considering the intended application of this work, the use of screen-printed electrodes (SPEs) as substrates allowed the production of a simple, inexpensive, and versatile analytical approach for monitoring NADH. Overall, there are different electrochemical routes and chemical conditions for preparing PTH, which must be selected appropriately according to the electrochemical system employed.
Thus, this work was directed to the use of PTH as a polymeric material assembled in-situ in SPE substrates. SPEs used herein had carbon or gold substrates on the working electrode, as commercially available. PTH was used to tailor molecularly imprinted polymers (MIPs) for a relevant biomarker protein, which act as biomimetic materials for antibodies. TH acted not only as a functional monomer assembling the MIP materials, but also as an indicator of the electrochemical signal, posing the possibility of having the electrochemical reading of the SPE self-indicated and label-free. This concept was explored for targeting cancer antigen 19-9 (CA 19-9), a cancer biomarker in pancreatic cancer.
Thus, this work described the electropolymerization of TH in neutral PhB in the presence of CA 19-9 to generate imprinted cavities in a molecular dimension within the polymeric network. Readings were made in PhB and CA 19-9 binding was followed by differential pulse voltammetry (DPV), as it allowed the measurement of the concentration of specific electroactive species. The resulting structure of PTH was evaluated using Raman spectroscopy, along with a control material prepared in the absence of CA 19-9 and gold nanostars modified with TH.
2. Experimental Section
2.1. Equipment
The electrochemical measurements were performed in the potentiostat/galvanostat from Metrohm Autolab (Ultrecht, The Netherlands). The C-SPE and Au-SPE were from DropSens (Oviedo, Spain) (DRP-C110, DPR-250AT). The potentiostat interconnected with SPEs through a box was obtained from BioTID (Oviedo, Spain), Portugal. Raman spectra were collected in a Thermo Scientific DXR Raman Microscope (Madison, WI, USA) with a laser of 532 or 785 nm operated at a 5 mW power and a confocal microscope with a 50× objective lens. The parameters of the observed Raman modes (frequency, line width, and amplitude) were obtained, using Igor software, from the best fit of a sum of damped oscillator functions [
15].
2.2. Reagents and Solutions
All chemicals were of analytical grade and water ultrapure Milli-Q laboratory grade. Sodium phosphate dibasic dihydrate (Na2HPO4) and ortho-phosphoric acid 85% (H3PO4) were obtained from Riedel-de-Häen (Charlotte, NC, USA); carbohydrate antigen (CA) 19-9 (250 KU) (Biorbyt, Cambridge, UK) from human metastatic liver carcinoma was obtained from Biorbyt; sodium phosphate dibasic dihydrate, 99.5% (Na2HPO4·2H2O) was from Panreac (Barcelona, Spain); sodium dihydrogen phosphate dehydrate (NaH2PO4·2H2O) was from Scharlau (Pamplona, Spain); sulfuric acid (H2SO4) was obtained from BDH (Dubai, UAE); thionin acetate (TH) from Acros Organics (Geel, Belgium); oxalic acid dihydrate (126.27 g/mol) was obtained from Merck (Branchburg, NJ, USA).
2.3. SERS Measurements
The synthesis of gold nanostars (AuNS) was performed according to Castaño-Guerrero et al. 2021. [
16]. Briefly, the first step consisted of the production of Au seeds. These were prepared with a solution of 0.5 mM of HAuCl
4, and 10 mL of 1% citrate solution was added under stirring. To the resulting solution, 10 mL of PVP (2.5 mM) was added and left under stirring overnight to form Au seeds. The Au seeds obtained were centrifuged (4500 rpm, 45 min) and concentrated to 1.5 mM.
The AuNS were prepared with a solution with 1.5 g of PVP (2.5 mM) in 15 mL of N,N-Dimethylformamide (DMF) and sonicated. To this solution, 40 μL of HAuCl4 (101 mM) was added, followed by the addition of 320 μL of the Au seeds (1.5 mM). After 1 h of stirring, the solution was centrifuged to remove the excess of PVP, using three cycles of centrifugation-dispersion with ethanol (3500 rpm, 40 min). The resulting AuNS was stored at 4 °C until use.
The Raman probe (AuNS/TH) was set-up with a TH solution (1.0 × 10⁻³ M) in absolute ethanol mixed with the AuNS (0.6 mM) solution, in a 1:1 ratio, and shaken for 1 h, at 25 °C. The resulting solution was centrifuged at 4500 rpm for 20 min at 25 °C to remove the excess of unbound TH. The Raman probe AuNS/TH was incubated until dry on the Au-SPE.
2.4. MIP Assembly for CA 19-9
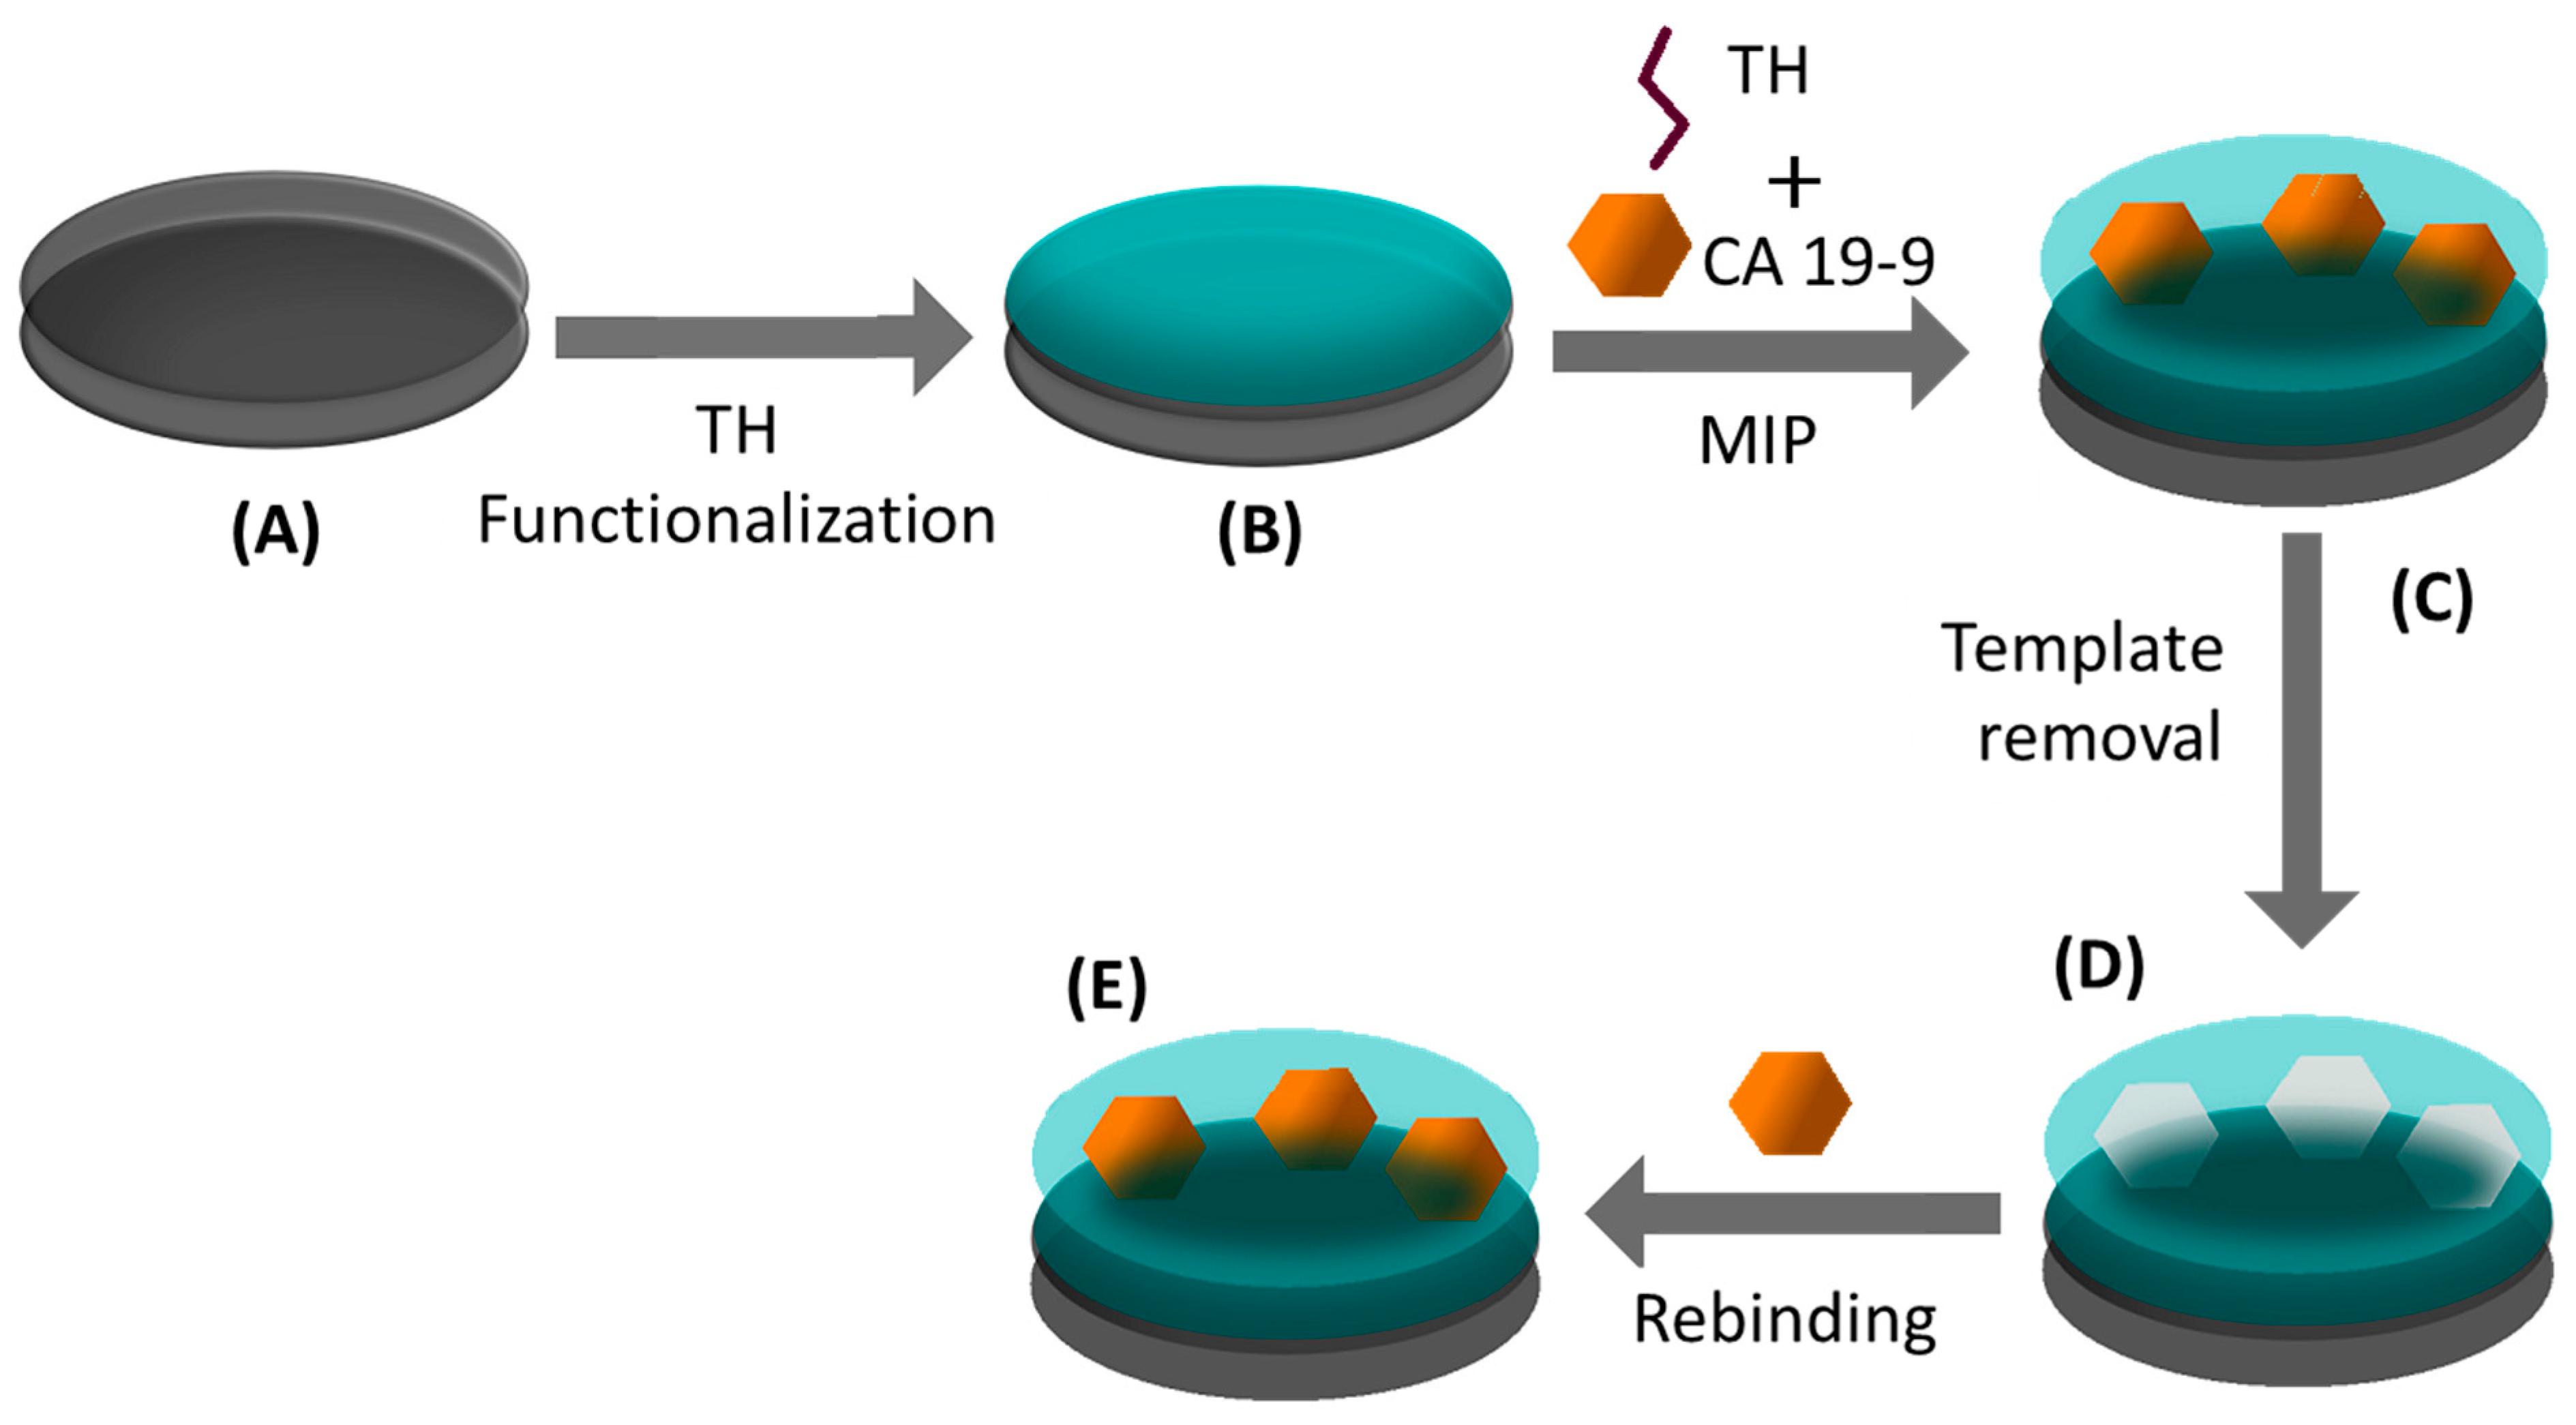
The electropolymerization of TH was made on C-SPE or Au-SPE (
Figure 1) to generate MIP films for CA 19-9. These films were assembled in several steps. First, SPEs underwent a cleaning stage by exposing the 3-electrode system to a H
2SO
4 solution (0.5 M), following 15 cycles of a cyclic voltammetry (CV) procedure, between −0.2 and 1.2 V, at a scan rate of 0.05 V/s. Then, the C-SPEs were modified by incubating a TH solution (10
−3 M) on the working electrode, for 1 h. The Au-SPEs were electrochemically modified by CV cycling of the same solution, under the potential range from −0.4 to 1.2 V, at a scan rate of 0.05 V/s. The electropolymerization of TH for generating the MIP material was the following step. To this end, the TH solution (10
−3 M) was mixed with CA 19-9 (1 KU) and incubated on the 3-electrode system, to undergo 15 CV cycles, from −0.4 to 0.4 V (C-SPE) or −0.4 to 1.2 V (Au-SPE), at scan rate of 0.05 V/s. Finally, the template was removed by incubating the working electrode in oxalic acid (0.5 M) for 1 h. The same steps were followed in the construction of the control nonimprinted polymer (NIP), in which CA 19-9 was excluded from the procedure. Each step of the MIP/NIP assembly was followed by DPV.
The resulting MIP/NIP electrodes were calibrated against CA 19-9 standard solutions, ranging from 0.010 to 100 U/mL, prepared in PhB solution, pH 7.4. After a selected incubation time, the electrochemical reading of DPV was collected, using a pulse amplitude of 0.05 V, a pulse width of 0.0167 s, and pulse period of 0.1 s.
3. Results and Discussion
3.1. Formation and Electrochemical Studies of PTH on SPEs
The formation of the PTH film depends on the potential applied to the different substrates. In the first approaches reported, it was indicated that one should not go below a potential of +1.1 V to undergo electropolymerization of TH [
11]. Gao et al. considered that the upper potential limit in the potential sweep for the preparation of PTH was the determining factor in obtaining PTH. On the other hand, it has been proposed that the oxidation potential should not be less than +0.9 V, because the potential of the electrode should be greater than the potential in which the oxidation of TH is occurring [
14]. After various discussions, it was also accepted that the formation of PTH depends on the pre-anodization of the surface [
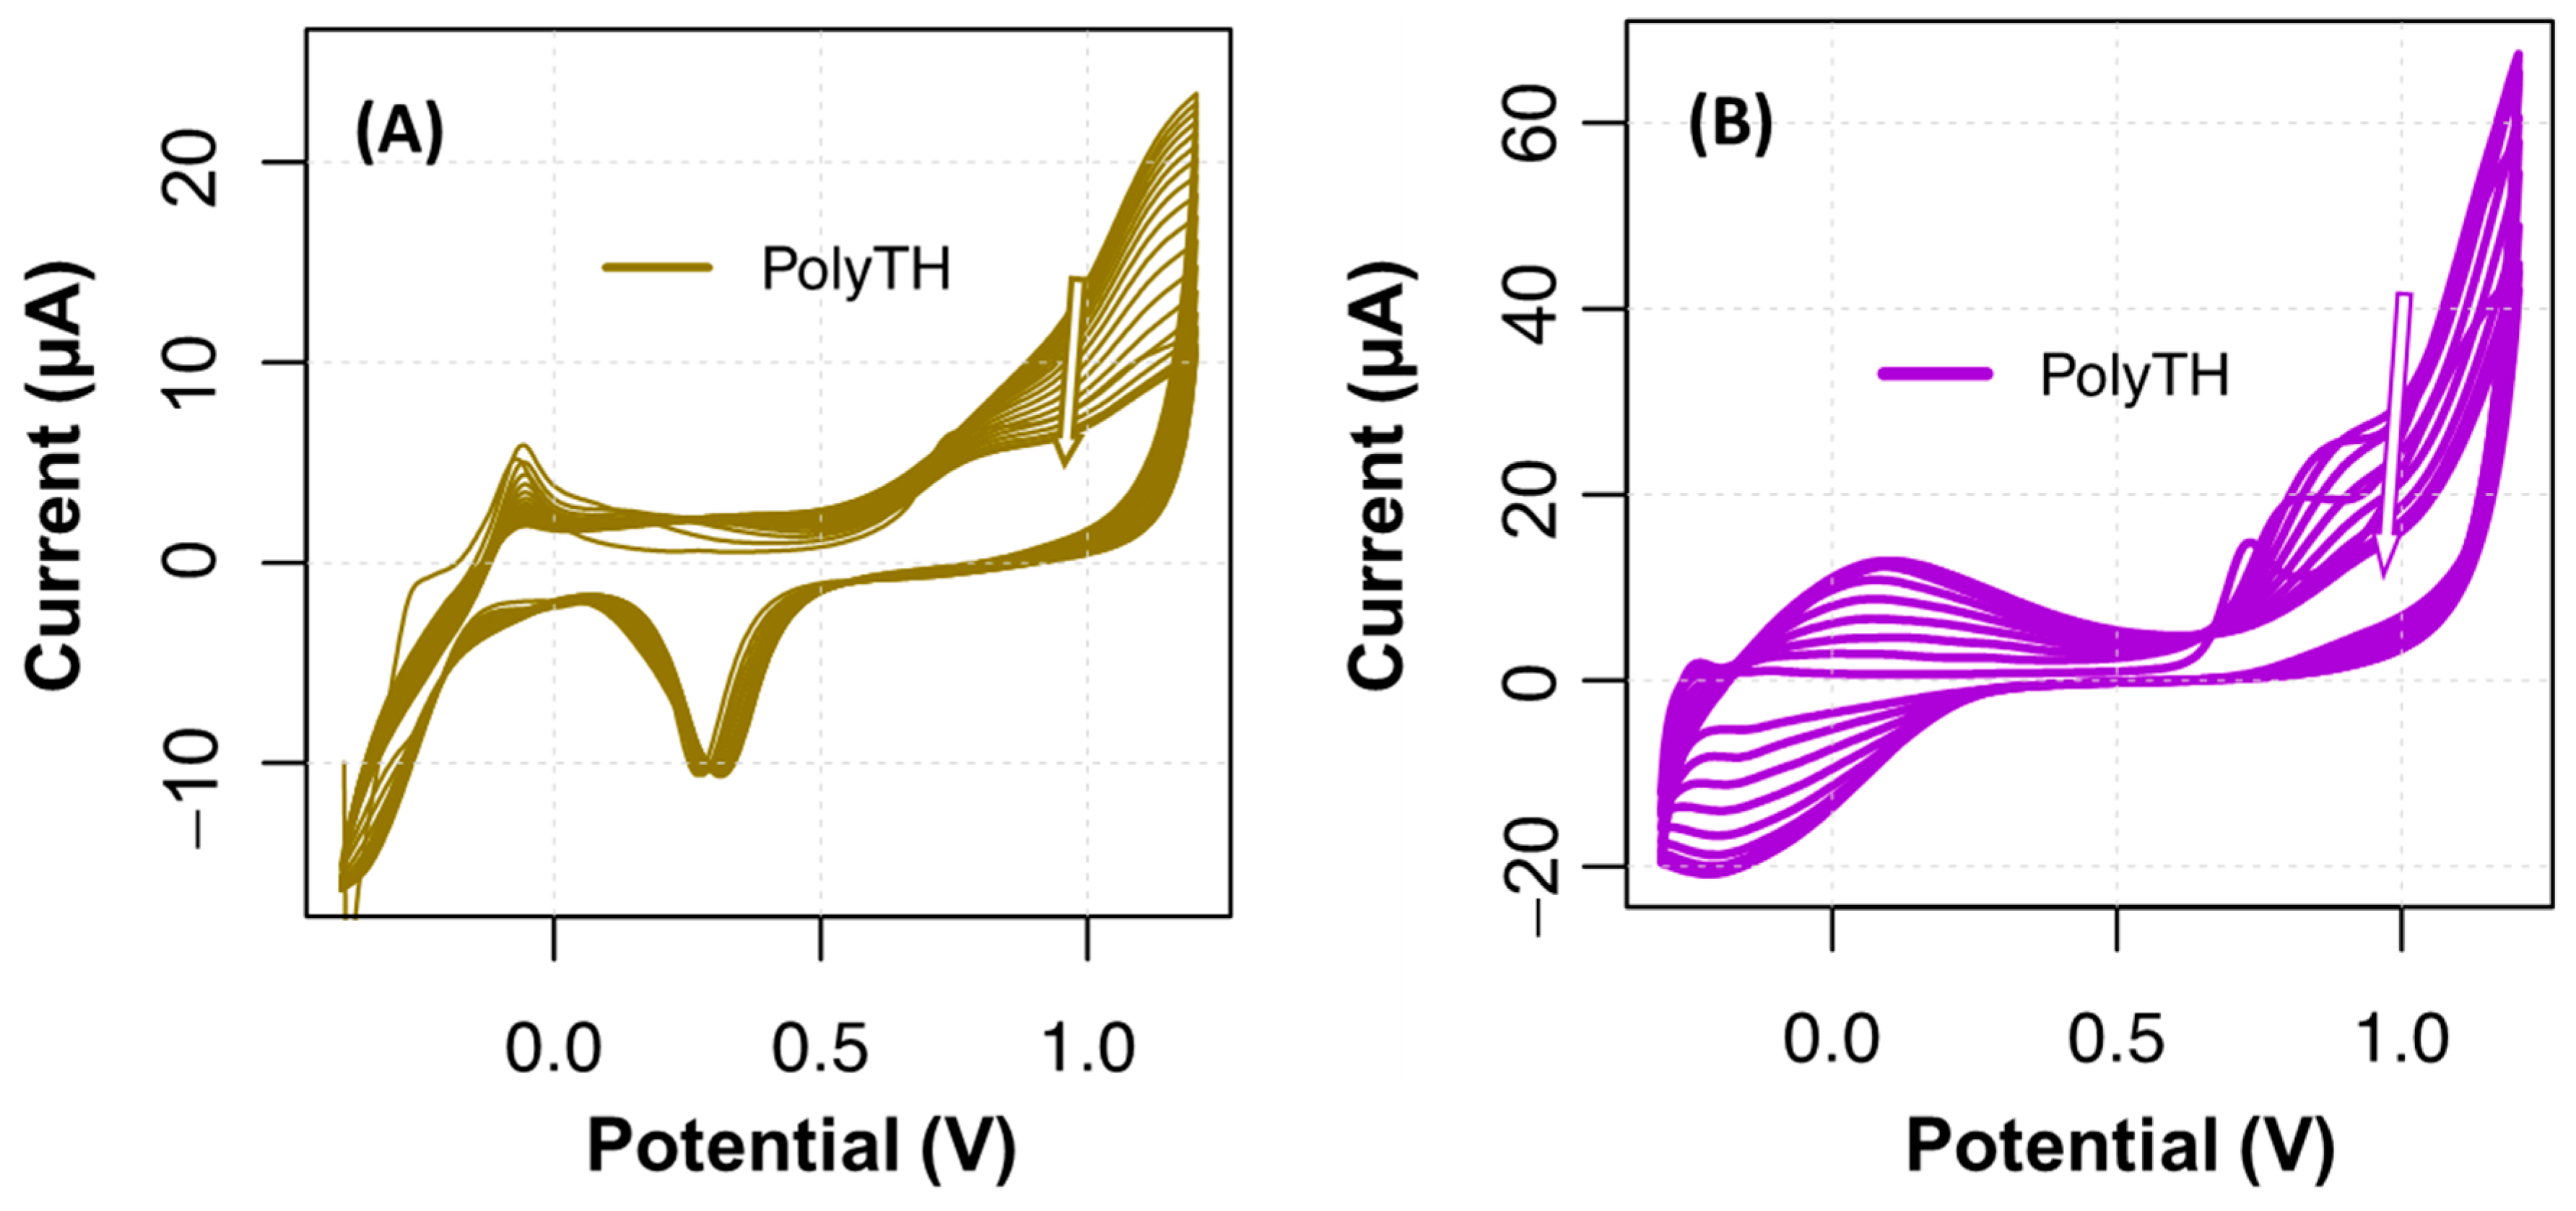
10], from which a positive charge can accumulate at the electrode surface to generate the TH cationic radical. Thus, initial explorations over the TH electropolymerization were conducted to understand which potential would be required to oxidize TH between −0.4 and 1.2 V, at a scan rate of 0.050 V/s for 15 cycles. The results obtained herein are shown in
Figure 2. A shoulder peak at a maximum potential of 0.9 V was evident in both substrates (C-SPE and Au-SPE). In the presence of thionine, around +0.9 V, an irreversible oxidation of the monomer occurred, generating a radical cation, starting polymerization.
Globally, C-SPE had more intense current signals than Au-SPEs (
Figure 2B), and the formation of a pair of (apparently) quasi-reversible peaks (at +0.1 V and −0.2 V) was also evident. The formation of monomeric radicals occurred around +0.9 V as mentioned above. The redox couples that were most noticeable at the carbon electrodes (−0.2 V/+0.1 V) were attributed to the oxidation/reduction of the polymer. Other redox pairs at more negative potentials are also described in the literature [
17], −0.23 V/−0.3 V, which was attributed to the oxidation/reduction of monomers but on CNT-modified surfaces, so these pairs of redox were not evident in our case. It was assumed that this monomer pair (not found) decreased in each voltammetry cycle, while the polymer pairs (−0.2 V/+0.1 V) increased, indicating the growth of PTH. The progressive blockage of electrons in the PTH layer was seen by the current decrease in consecutive CVs, with signals showing a tendency for an increased stabilization under an increasing number of CV cycles.
The electropolymerization curves on Au-SPE showed two oxidation peaks (
Figure 2A), which were attributed to the redox reaction of the molecular layer being formed [
18]. The anchor of TH to the Au-SPE has been proposed to occur covalently when TH is first modified into a diazonium salt, which undergoes electrical reduction through nitrogen cleavage under cathodic conditions, at about 0.9 V [
19]. Eventually, the TH may bind to the gold via sulfur or nitrogen atoms, which are quite common bonds that are energetically favored.
It is known that by increasing the number of potential cycles during electropolymerization, the thickness of the polymeric film tends to be higher, but this is coupled to increased resistances that may hinder the electrochemical response. In the case of PTH, the increasing film thickness also causes a shift from electronic transfer in thin films to diffusion-controlled processes in thick films [
13]. Yet, the purpose of having a first layer of TH/PTH was to have a stable binding between the electrode substrate (carbon or gold) and the subsequent MIP or NIP film. Thus, regardless of the number of cycles, the important aspect here was to have TH bound to the surface. From the studies made, it was clear that a stable PTH film was obtained for 15 CV cycles.
3.2. Preparation of an Imprinted Film of PTH for CA 19-9
The imprinted film was obtained by in situ electropolymerization of TH in the presence of CA 19-9 (MIP). First, both gold and carbon electrodes were modified with TH polymeric films formed under applied potentials or by simple casting, to ensure that the MIP film was strongly bound to the electrode surface. The use of PTH to generate a MIP material was also meant to have an electrochemical probe at the sensing material, which would avoid the need for an external redox probe. In this regard, Cheng et al. explored the properties of TH in a biosensor for DNA recognition by integrating zirconia-reduced graphene oxide nanocomposites [
20]. Another use of TH as an electrochemical probe is the study reported by Zhou et al., in which graphene oxide was modified with TH [
21].
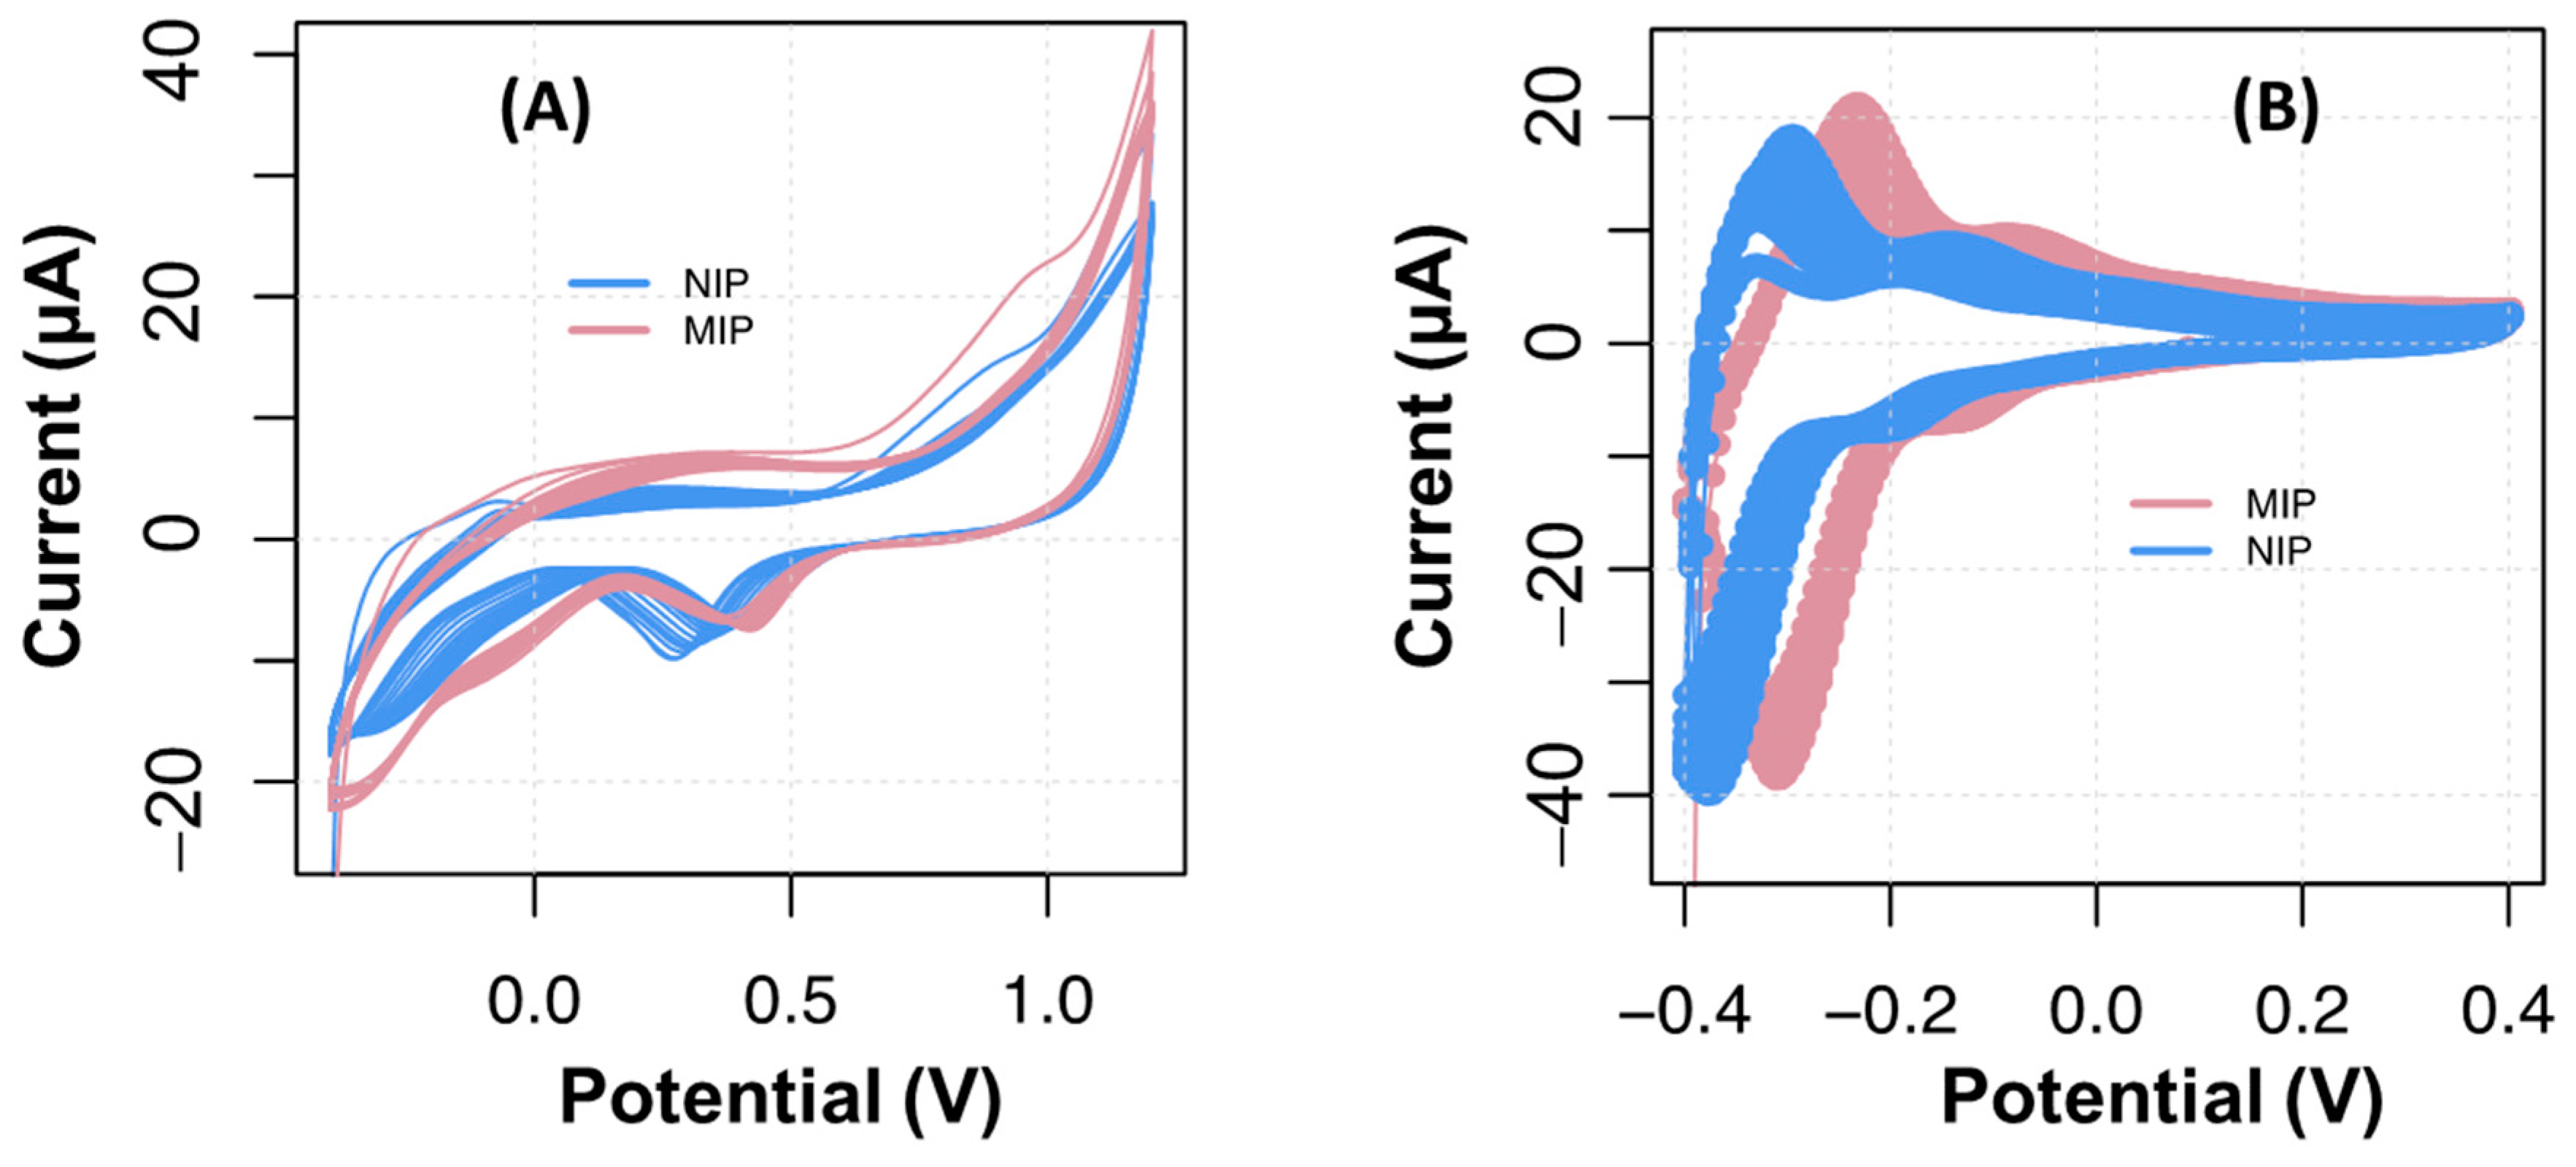
The presence of CA 19-9 within the polymeric film being formed caused a displacement of the redox peaks toward more positive potentials in the cyclic voltammogram, both on carbon and gold substrates. This is shown in
Figure 3, evidencing potential shifts of 50 mV in the C-SPEs and 100 mV in the Au-SPEs. It is important to note that the upper potential value of electropolymerization in the C-SPEs decreased from +1.2 V to +0.4 V (C-SPE). This was performed because Ahammad et al. 2011 reported that the formation of the polymer may be obtained under this narrower potential after subjecting the carbon surface to +1.2 V, which took place at the cleaning stage [
1,
14].
The fact that C-SPEs generated higher current values could turn out to be advantageous in terms of sensitivity of the analytical readings. C-SPEs are also less expensive than devices produced with gold-based inks.
3.3. Raman Studies of TH on C-SPE
Raman spectroscopy is one of the most powerful techniques for this purpose and has been widely used to study graphite and graphene. A characteristic Raman spectrum of the carbon electrodes is shown in
Figure S1. The results showed that while the Raman peaks in crystalline graphene were the G (1579 cm
−1)-associated symmetric E2g Raman mode [
22], the intense peak at 1350 cm
−1, called the D band, is related to the A1g breathing mode, and it was observed because graphite oxidation and the subsequent reduction of graphene oxide significantly alter the basal plane structure of graphene [
23]. The shoulder in the spectrum was interpreted to be peak D″ (1512 cm
−1), which has been reported for some carbon-based materials. In addition, some weak peaks at 1165 cm
−1 were observed in graphene oxide flakes and powders. Raman’s modes for graphene were also observed with different kinds of defects, such as rings with different numbers of C atoms and configurations of C-O bonds. In these cases, a peak at 1615 cm
−1, D′ band, has been attributed to the disorder-induced phonon mode due to crystal defects and defects in the graphene oxides [
24].
By evaluating the Raman spectra of the same carbon electrode modified with TH, one may determine if it is present and if TH interaction with carbon is covalent or noncovalent in nature. This was carried out by observing the D band (1360 cm
−1) and following the alterations that may appear [
25], as shown in
Figure S2. The spectra of TH casted on carbon electrode is shown in
Figure 4b. It showed the Raman bands at 1350 and 1579 cm
−1, being a combination of both the characteristic bands of carbon and TH. The band at 1384 cm
−1 corresponds to the 24 cm
−1 Raman shift from the D band; this band is the defect band of carbon and it was visible in the Raman spectrum. As such, one could confirm the noncovalent interaction hypothesis, given that functionalization with TH does not introduce defects in the carbon network. In agreement with the construction of the biosensor, the first layer deposited was by absorption of TH on the surface, and apparently no covalent bonds were established.
The eight main bands related to the presence of TH are shown in
Table 1. Hutchinson et al., reported a band at 480 cm
−1 that correlates well with the band at 479 cm
−1 in the collected spectrum. This band was assigned to stretching of the C-S bond, central ring breathing, and Namino-H bond rocking [
26]. Another band of TH was located 909 cm
−1 and was assigned to ring breathing. The band at 1149 cm
−1 was attributed to ring vibrations together with stretching vibrations of the N-H bond in the amino group. Finally, the important bands at 1504 and 1622 cm
−1 were assigned to the aromatic ring stretching and Namino-H bending [
19,
27].
Moreover, there was an insignificant difference between the ratio I
D/I
G for 0.94 (carbon) and 1.04 (TH-carbon) presented in
Table S1. As such, one could confirm the noncovalent interaction hypothesis, given that functionalization with TH does not introduce defects in the carbon network.
3.4. Raman Studies of TH on Au-SPE
The Raman spectra collected for the gold electrode substrate (
Figure 4c) had no relevant peaks to comment, as expected for a gold material observed in Raman spectroscopy. In contrast, the modification of this gold electrode with TH solution that underwent the CV procedure yielded a spectrum with a wide range of vibrations, as evidenced in
Figure 4d.
The presence of TH on the gold electrode was evidenced by four main bands at 482, 1059, 1386, and 1624 cm
−1 and twelve weaker bands at 605, 676, 804, 910, 1132, 1154, 1228, 1286, 1322, 1436, 1476, and 1506 cm
−1; the location of the bands as well as their respective assignments are represented in
Table 1. The first four bands can be grouped by their vibration caused by stretching of the C-S bond, central ring breathing, and Namino-H bond rocking. The second one includes the contribution of stretching of C-N-C together with C-NH vibrations, whereas the last arises from aromatic ring stretching and Namino-H bending [
19,
26,
27]. The band at 1506 cm
−1 corresponded to central ring breathing, and Namino-H bond rocking of the amino group and the band at 1436 cm
−1 were assigned to the formation of amino bridges between two phenothiazine molecules [
19]. The bands of leucothionine were at 1154, 1228, and 1386 cm
−1. The signal corresponding to the vibrations of the ring of the dimeric structure formed was evidenced with the band at 1132 cm
−1. The band located near 605 cm
−1 corresponded to the oscillation of the amino group [
19]. The band at 1436 cm
−1 arising from the asymmetric stretching vibrations of the C=N bond in the central ring, together with that at 1475 cm
−1, connected with the vibrations of quinoid rings, which suggest the transformation of grafted TH into the oxidized form [
19].
Overall, the presence of TH on the gold substrate (as well as on the carbon) was clearly validated by the Raman studies.
3.5. Response of the MIP Film to CA 19-9 in C-SPE
For most dyes, including TH, the simplest immobilization technique consists of their adsorption to suitable substrates, such as carbon. In addition, monolayers of these molecules have been shown to be stably adsorbed on gold surfaces [
28]. Thus, TH was first adsorbed into the carbon electrodes, by casting the TH solution along 1 h. This adsorption would allow a strong binding between the carbon substrate and the MIP layer formed after, thereby contributing to increase the stability of the electrochemical response. Considering that TH was not chemically modified, it is possible that the molecule established π−π stack interactions with the aromatic rings on the carbon substrate and electrostatic interactions between the -S- and the three amine groups on TH and the oxidized functional groups on the carbon substrate (which were likely to be present after acidic cleaning).
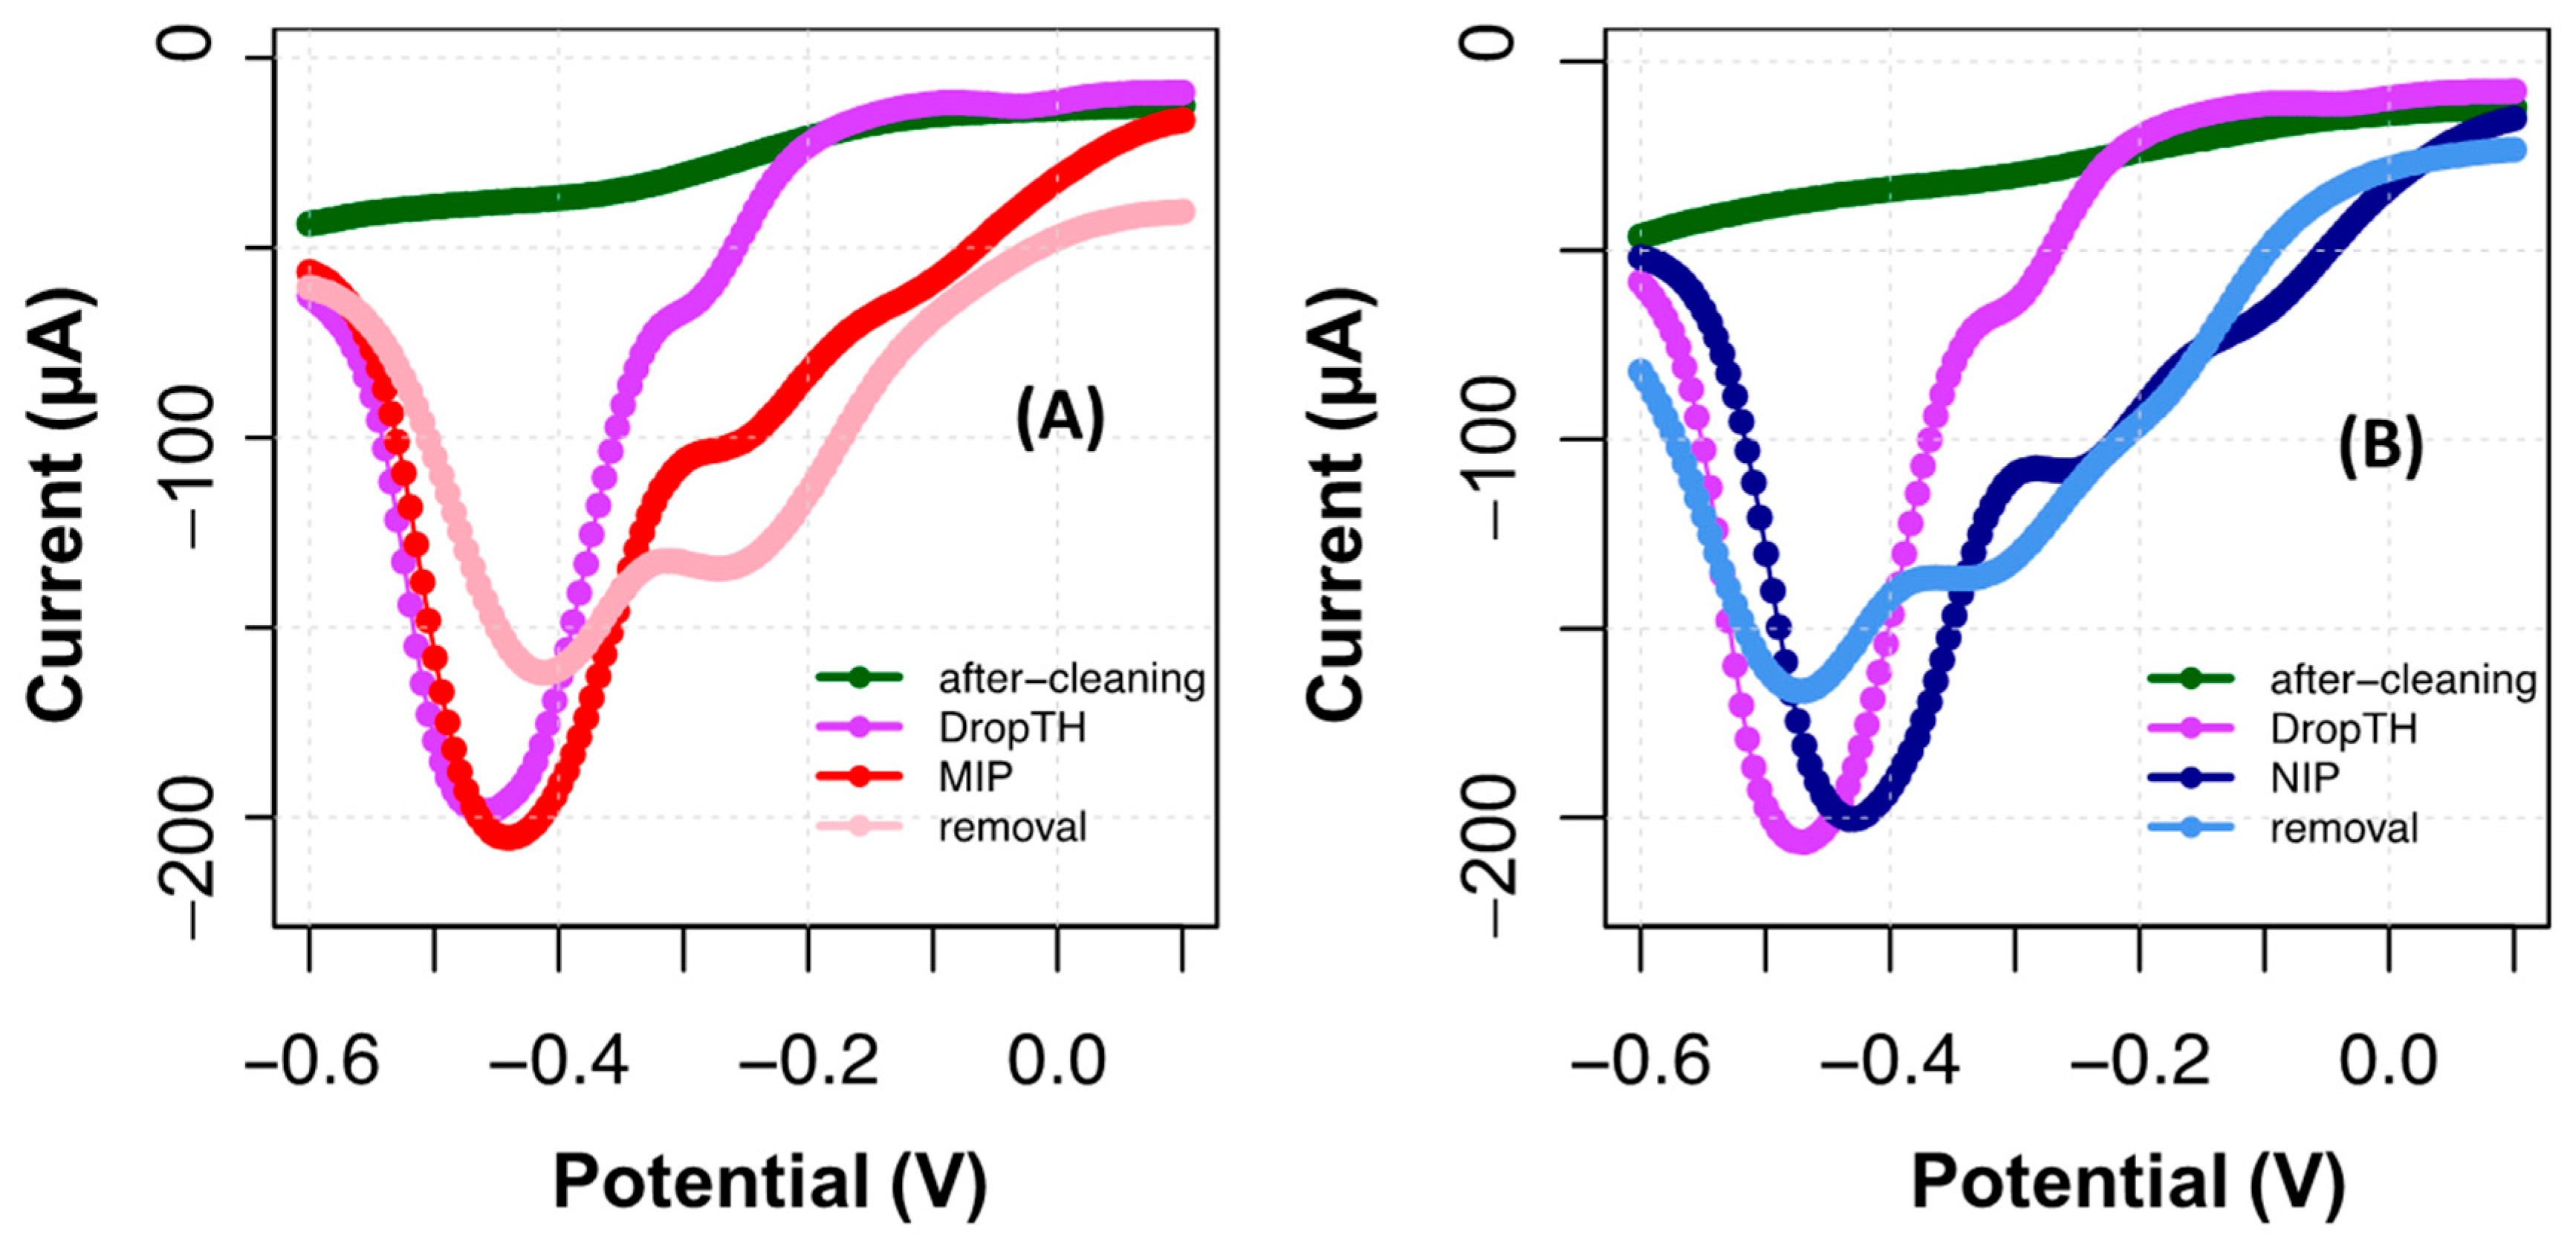
The DPV technique was used to follow the TH peak on the substrate, confirmed by the appearance of a peak at around −0.35 V (
Figure 5). The formation of the MIP film was suggested by the increasing reduction current produced by the electrodes and a potential shift. In contrast, the NIP yielded a more intense potential shift for a lower peak current.
After template removal, a significant current decrease was observed, along with a shift in peak potentials. This tendency was more evident in the NIP, which was also subject to a template removal procedure, only for control purposes. This behavior of the NIP evidenced the extraction from the electrode surface of di- to oligomeric compounds to TH that were not firmly attached. It could also signal chemical changes occurring on PTH after contact with oxalic acid. In addition, the peak shifting to −0.25 V in the NIP also became more intense than that in MIP. By comparing this behavior with the control NIP, the changes in the MIP could be related to the fact that some protein molecules remained entrapped within the polymeric network.
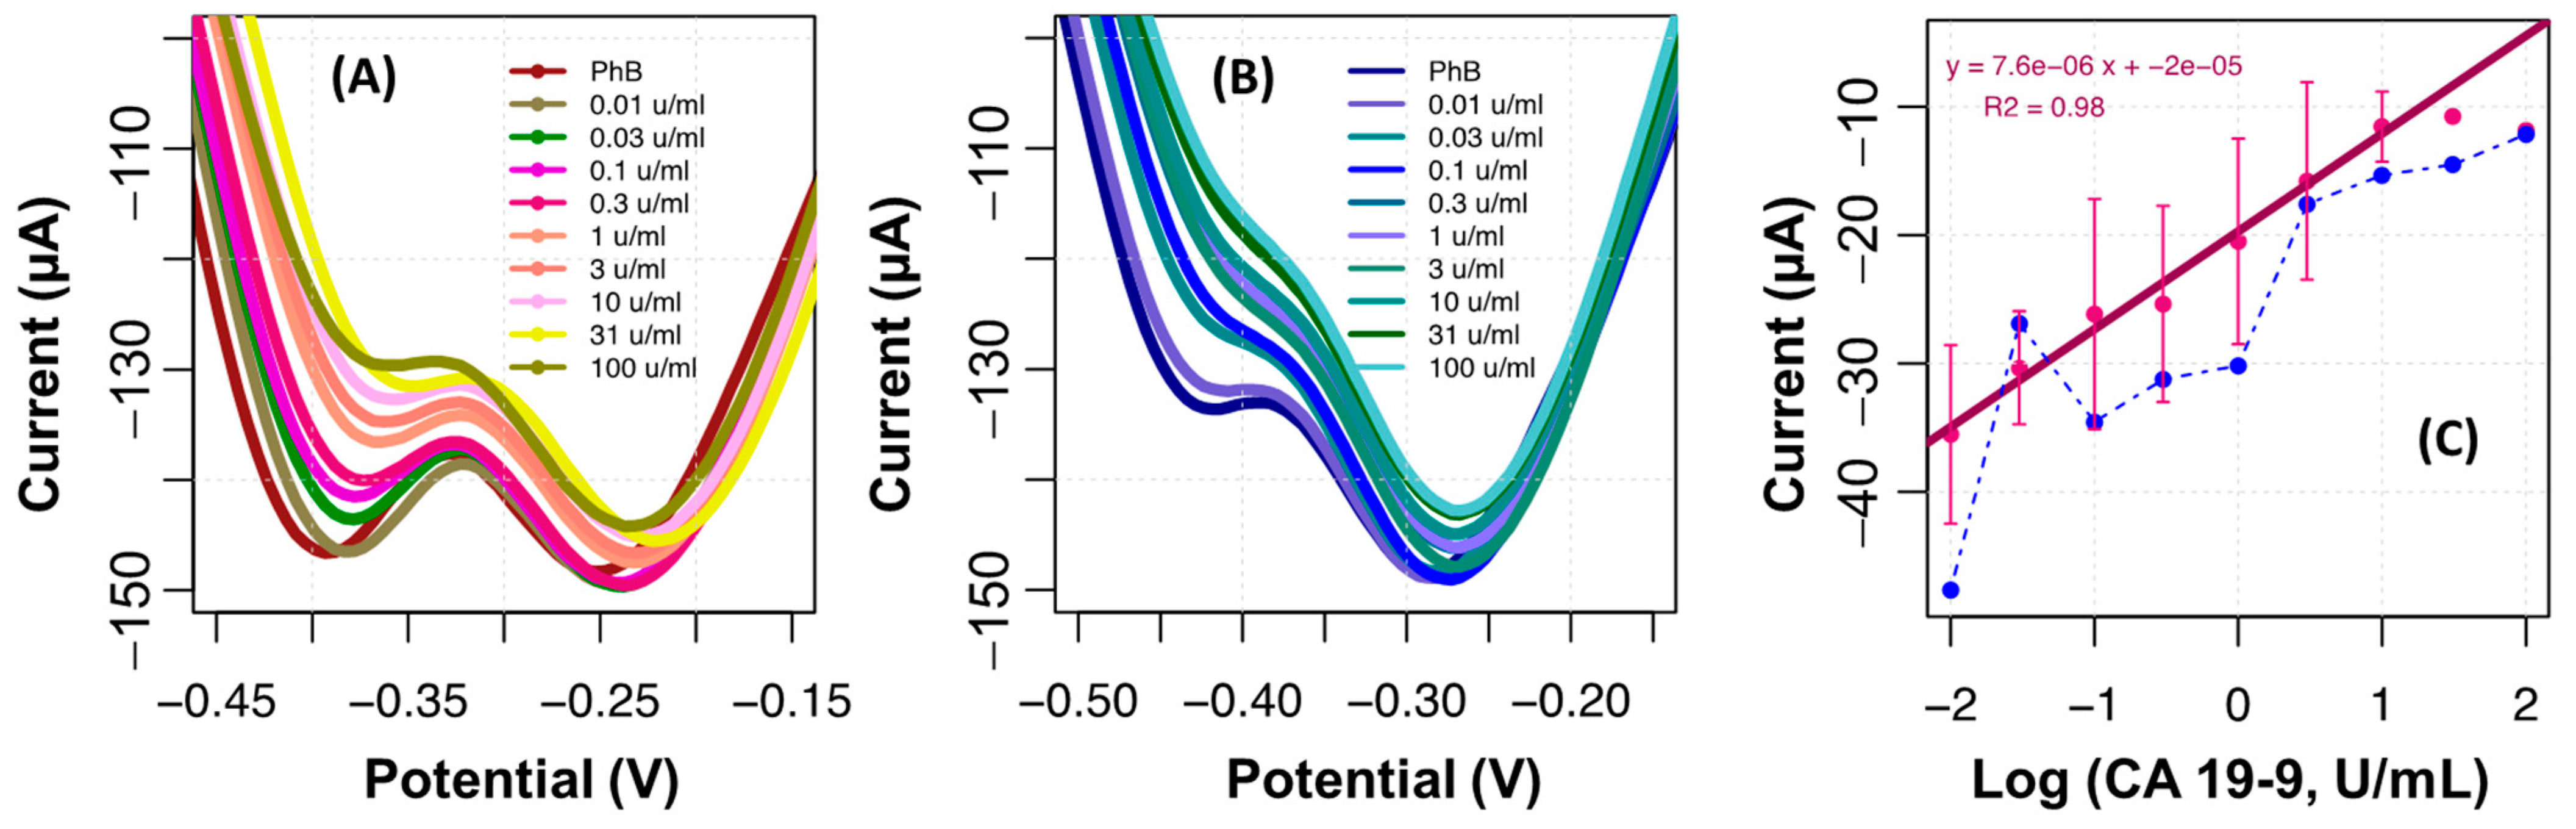
The ability of the MIP film to bind CA 19-9 was tested by performing calibration curves with standard solutions of the protein. This was performed only after stabilization of the MIP/TH surface, by successive incubations in PhB, for 20 min, until a stable reading was reached. The calibration was made from the lowest to the highest concentration, incubating consecutively each standard solution in the same electrode. The standard solutions of CA 19-9 prepared for this purpose had 0.010, 0.030, 0.10, 0.30, 1.0, 3.0, 10, 31, and 100 U/mL.
The results obtained are shown in
Figure 6. In general, from the two peaks observed in the voltammograms of the MIP, the peak current at about −0.4 V decreased its intensity with increasing concentrations of CA 19-9, while the peak at −0.25 V displayed a random behavior. In contrast, the voltammograms of the NIP displayed a more intense peak at about −0.25 V, which also displayed a random behavior, and a negligible peak current at about −0.4 V. This global random behavior of the NIP suggested the absence of specific binding sites on the polymeric network to capture CA 19-9.
Overall, a greater difference between MIP and NIP films was observed at the peak located at about −0.4 V. This peak also displayed more intense peak current changes for consecutive concentration variations, thereby generating calibrations of greater sensitivity. Having calibrations plotted under this condition, the analytical performance of the biosensor in C-SPEs showed a linear trend in the concentration range studied, up to 10 U/mL (
Figure 6c). The average linear regression was
I (A) = 7.6 × 10
−6 × Log (CA 19-9, U/mL) + 2 × 10
−5, with an R squared >0.98, down to 0.010 U/mL. The calibrations in the NIP displayed a random response, as mentioned, thereby confirming that the response of the MIP was selective for CA 19-9.
3.6. Response of the MIP Film to CA 19-9 in Au-SPE
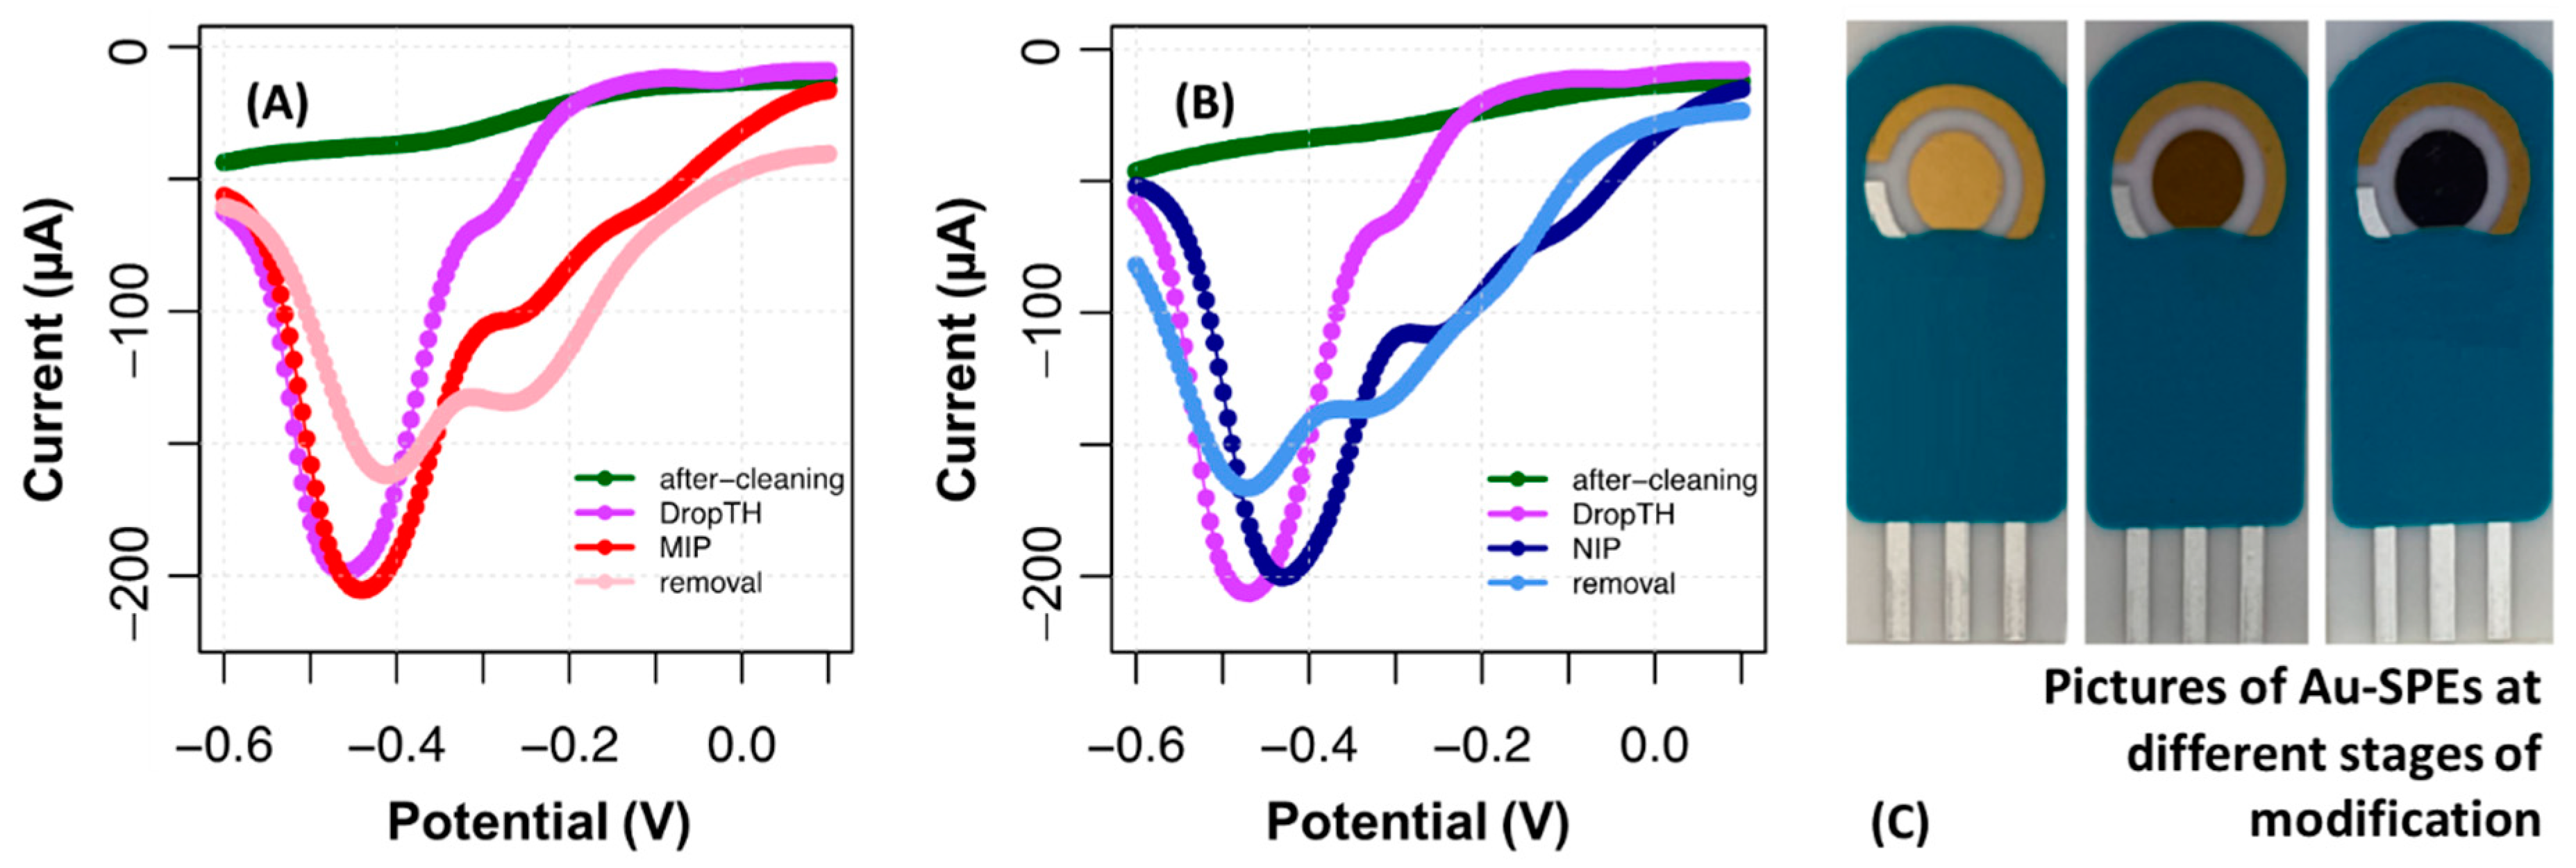
The first layer with TH was made by casting the solution and allowing adsorption and by electropolymerization of TH on top of the electrodes. From the two approaches, electropolymerization yielded the most stable response and was therefore selected [
29]. After electropolymerization of TH, the gold electrode displayed an increase in the current value, along with the appearance of a potential peak around −0.45 V (
Figure 7A). This suggests the formation of the polymeric film of TH, which seemed to be corroborated by the intense purple coloration obtained in the working electrode (
Figure 7A, pictured in inset that is stable within time and after washing).
The formation of the MIP was confirmed by a marked increase in the reducing current in the potential peak that appeared at −0.5 V. As can be seen in
Figure 7, the increase in the conductivity of the electrode in the MIP was much greater with respect to the NIP. Another difference marked by the presence of CA 19-9 was the small shift in the peak to more negative potentials in the MIP, while in the NIP, it shifted to more positive potentials.
The removal of CA 19-9 is a fundamental step to obtain the imprinted cavities that are directly related to the sensitivity of the biosensor. The removal of the protein was conducted by incubating oxalic acid on the working electrode for 1 h. The correct formation of cavities in the sensor was verified by decreasing the reduction peak and shifting to higher potentials. The NIP also yielded decreasing currents; however, the peak obtained had little resolution compared to the background signal.
The response of the MIP film on Au-SPE to CA 19-9 was tested by calibration curves, which were made similarly to the studies made with C-SPEs. The typical results so obtained are shown in
Figure 8. Overall, the reduction peak signaling the presence of PTH was also the presence at about −0.5 V (it is important to note that the solutions were deaerated with nitrogen before reading) and the reduction peak tended to decrease in the presence of CA 19-9. This tendency showed a linear dependency with log CA 19-9 concentration from 0.10 U/mL to 100 U/mL. As before, the NIP displayed a random behavior, thereby confirming that the response obtained for CA 19-9 depended mostly on interactions between the target protein and the binding sites.
3.7. SERS on TH Readings
Attempts to increase the signal by SERS studies were made by casting on the gold substrate TH linked to AuNS. The TEM shown in
Figure S3 confirmed the formation of AuNS. The typical Raman band of TH was observed in the spectra obtained and shown in
Table 1. The intensity of the spectrum obtained by SERS was two times lower than that obtained with TH casted directly on the gold electrode (
Figure 4e).
The Raman spectra shown in
Figure S4A corresponds to the absorption of TH in glass and in the carbon substrate. In the other graph,
Figure S4B, the absorption of TH followed by electropolymerization is shown in carbon electrodes, TH/PTH. It is interesting to note that the spectra were apparently quite similar, showing the strong Raman bands of the TH. The most predominant bands observed were found at 486, 811, 914, 1036, 1389, 1504, and 1625 cm
−1, and their vibrational characteristics are listed in
Table 1.
In the SERS spectrum, it was expected that the Raman bands would be more visible (
Figure S5B), that is, an increase in intensity would be observed throughout the spectrum. This may be due to the fact that the distribution of the AuNS was not homogeneous throughout the surface of the electrode. As the AuNS/TH layer was not homogeneously distributed on the surface, it was difficult to observe the SERS effect (
Figure S5A), unlike the spectrum observed on the surface of the gold electrodes (
Figure S5B), where the intensity of the spectrum of the TH bands appeared with greater intensity compared to SERS. Hence, we can conclude that the distribution of the AuNS/TH did not occur homogeneously throughout the surface. However, on the surface of the gold electrodes, we had a homogeneous layer of PTH that covered the entire surface of the gold. Any reading point of the Raman laser will find PTH deposited and its effect intensified by the surface of the gold in which it was absorbed.
The band located at 1616 cm−1 corresponded to a shift of 8 cm−1 of the band corresponding to aromatic ring stretching and Namino-H bending for TH on Au-SPE (1624 cm−1). The band located at 1515 cm−1 could be attributed to central ring breathing, and Namino-H bond rocking of the amino group such as TH on the Au-SPE band was located at 1506 cm−1. The band at 1441 cm−1 attributed to the asymmetric stretching vibrations of C=N bond in the central ring decreased by 5 cm−1 in TH on Au-SPE (1436 cm−1). The greatest decrease corresponded to the attributed band vibrations of the ring of the dimeric at 1214 cm−1, being 14 cm−1 for TH on Au-SPE (1228 cm−1). Despite the peaks appearing with less intensity in both spectra, this displacement of the band can be associated with loss or gains of energy between the atomic vibrations.
Overall, the signal obtained by direct reading to TH on the gold electrode was greater than that observed with the TH on the AuNS. In fact, there was no reasonable explanation for this observation, considering that the gold AuNS had a much greater surface area than the eventually flat gold surface on the Au-SPE (which has great roughness because it was produced by printing a gold electrode on a ceramic substrate). Likely, this comparison was not valid and should require additional studies with increasing concentrations of the AuNS/TH, but this was also made to work very expensively, which is not desired for a POC system.
Overall, the results obtained demonstrate that the Au-SPE/TH substrate had potential to undergo a SERS reading to CA 19-9 binding in consecutive incubations of standard solutions, which would lead to a complementary and dual response on the same sensing unit. After incubation of the standard solutions, the electrochemical reading (which is nondestructive) could be followed by a SERS reading for providing additional information, in a similar approach to that described in Castaño-Guerrero et al., 2021 [
16] (without AuNS and having the signal enhancement at the substrate). This would help increase the accuracy of the analytical response.
4. Conclusions
A new MIP material for CA 19-9 was presented for electrochemical reading of this cancer biomarker. When compared to a control, the MIP showed selective and sensitive responses in reduction peak currents of the sensing film that were concentration-dependent. The materials obtained were monitored by DPV and analyzed by Raman spectroscopy, aiming to confirm the presence of TH and possible derived species. Raman spectroscopy was useful to determine the presence of TH and its different interactions with respect to each substrate studied. The results obtained from the characterization of the TH bands suggest wide range of potential applications.
Importantly, TH was efficient as an indicator of the electrochemical signal, revealing the SPEs to be self-indicated and label-free to detect CA 19-9. DPV was a useful technique to monitor the effect of CA 19-9 on the electrode, being an overly sensitive technique. Moreover, studies made with SERS suggested that the gold substrate with TH could further lead to complementary data, in a dual-detection scheme on the same electrode.


 ,
, 


