
An Electrochemical and Raman Scattering Dual Detection Biosensor for Rapid Screening and Biomolecular Profiling of Cancer Biomarkers

 , ,
, ,  and
and 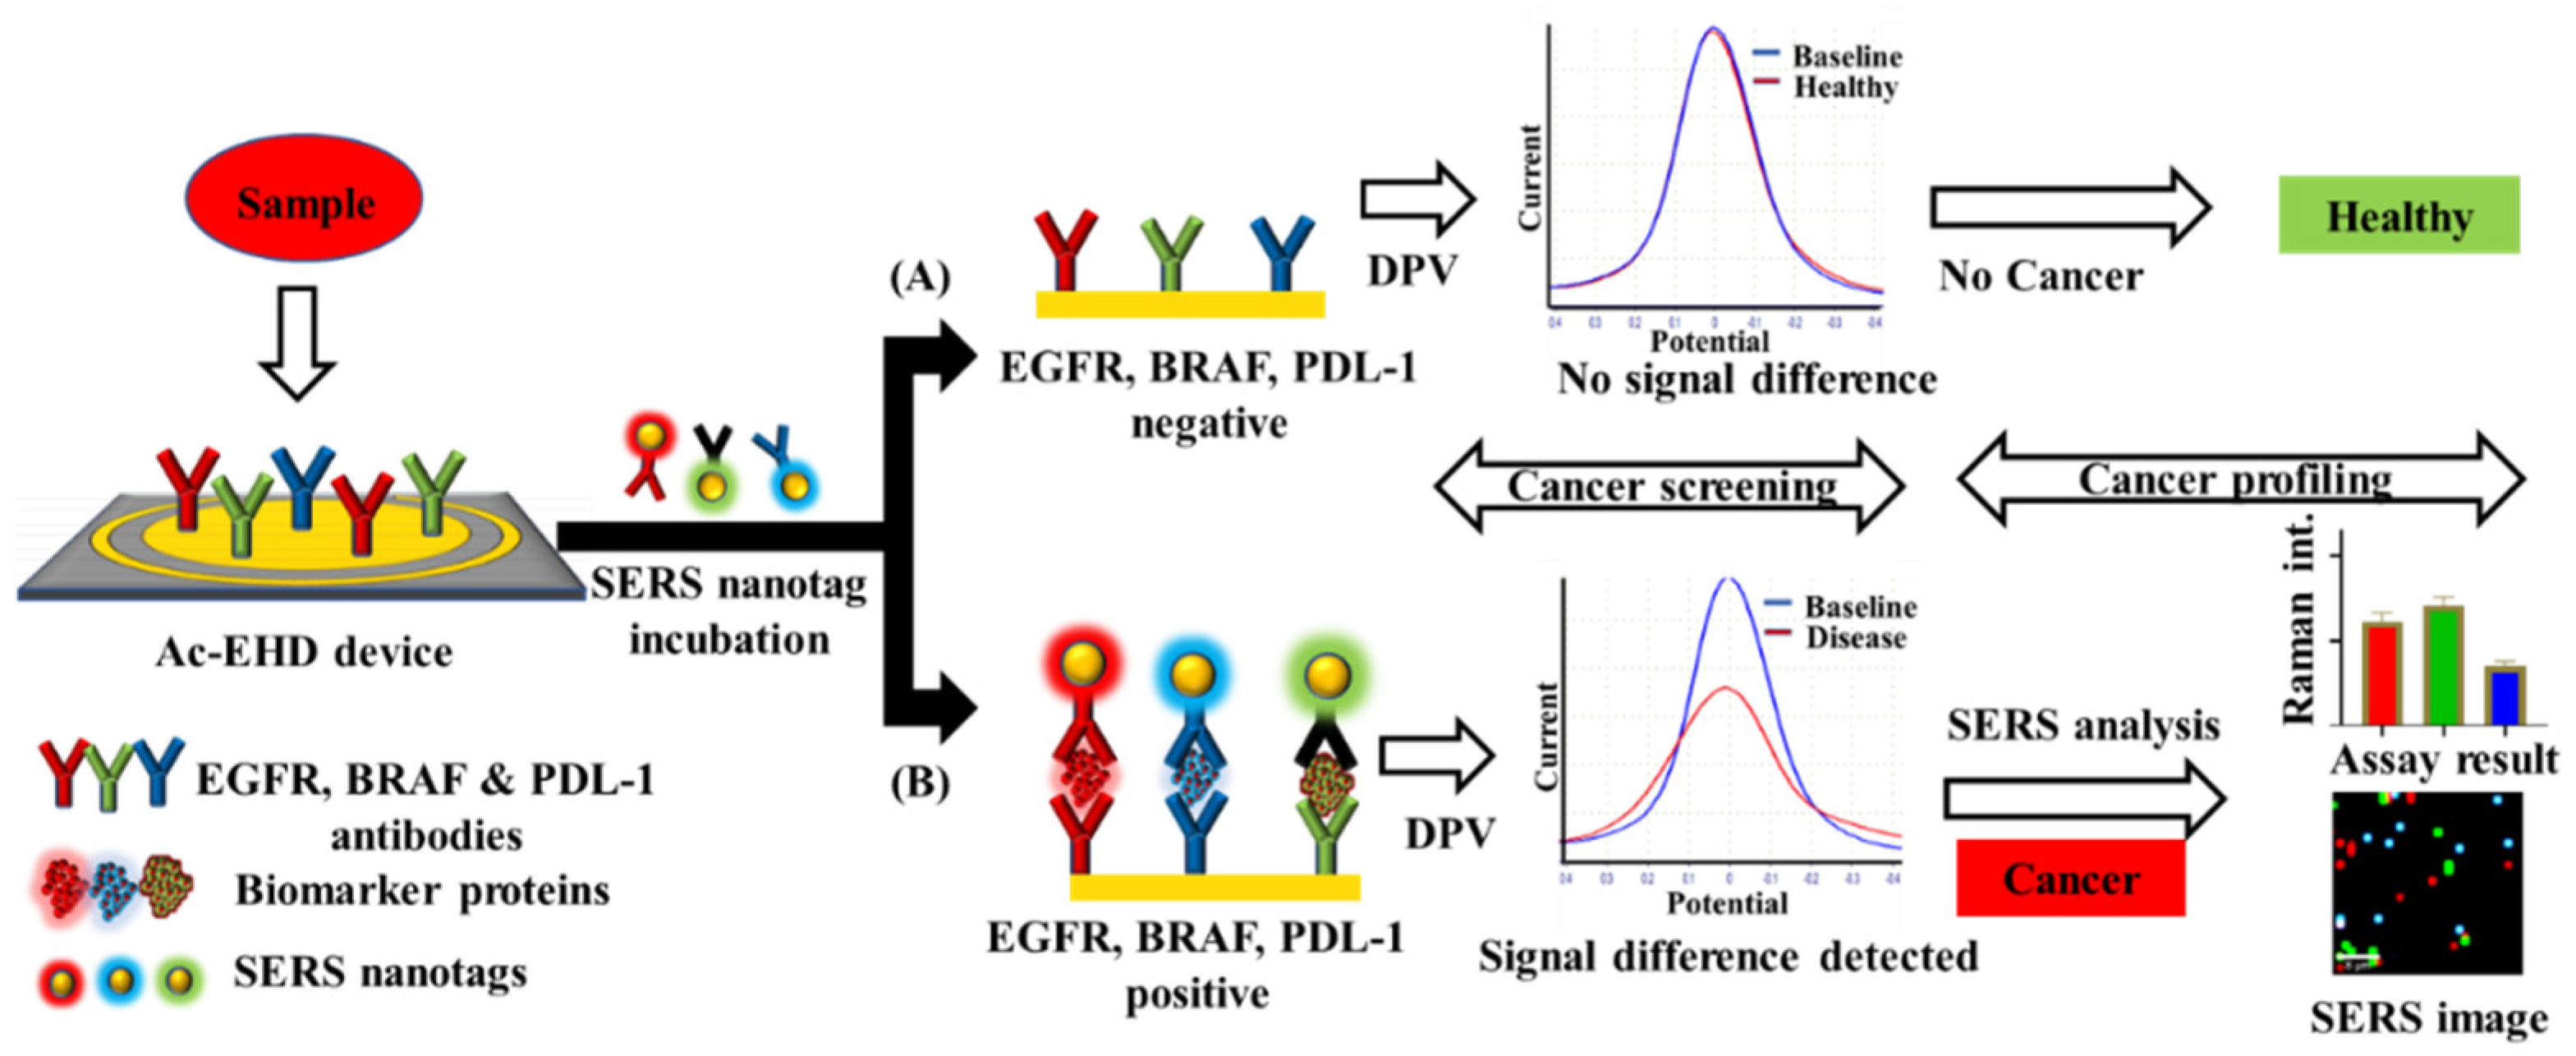
Abstract
:1. Introduction
2. Materials and Methods
2.1. Device Design and Fabrication
2.2. SERS Nanoparticle Synthesis
2.3. Assay Protocol, Signal Detection and Analysis
3. Results
3.1. Working Scheme
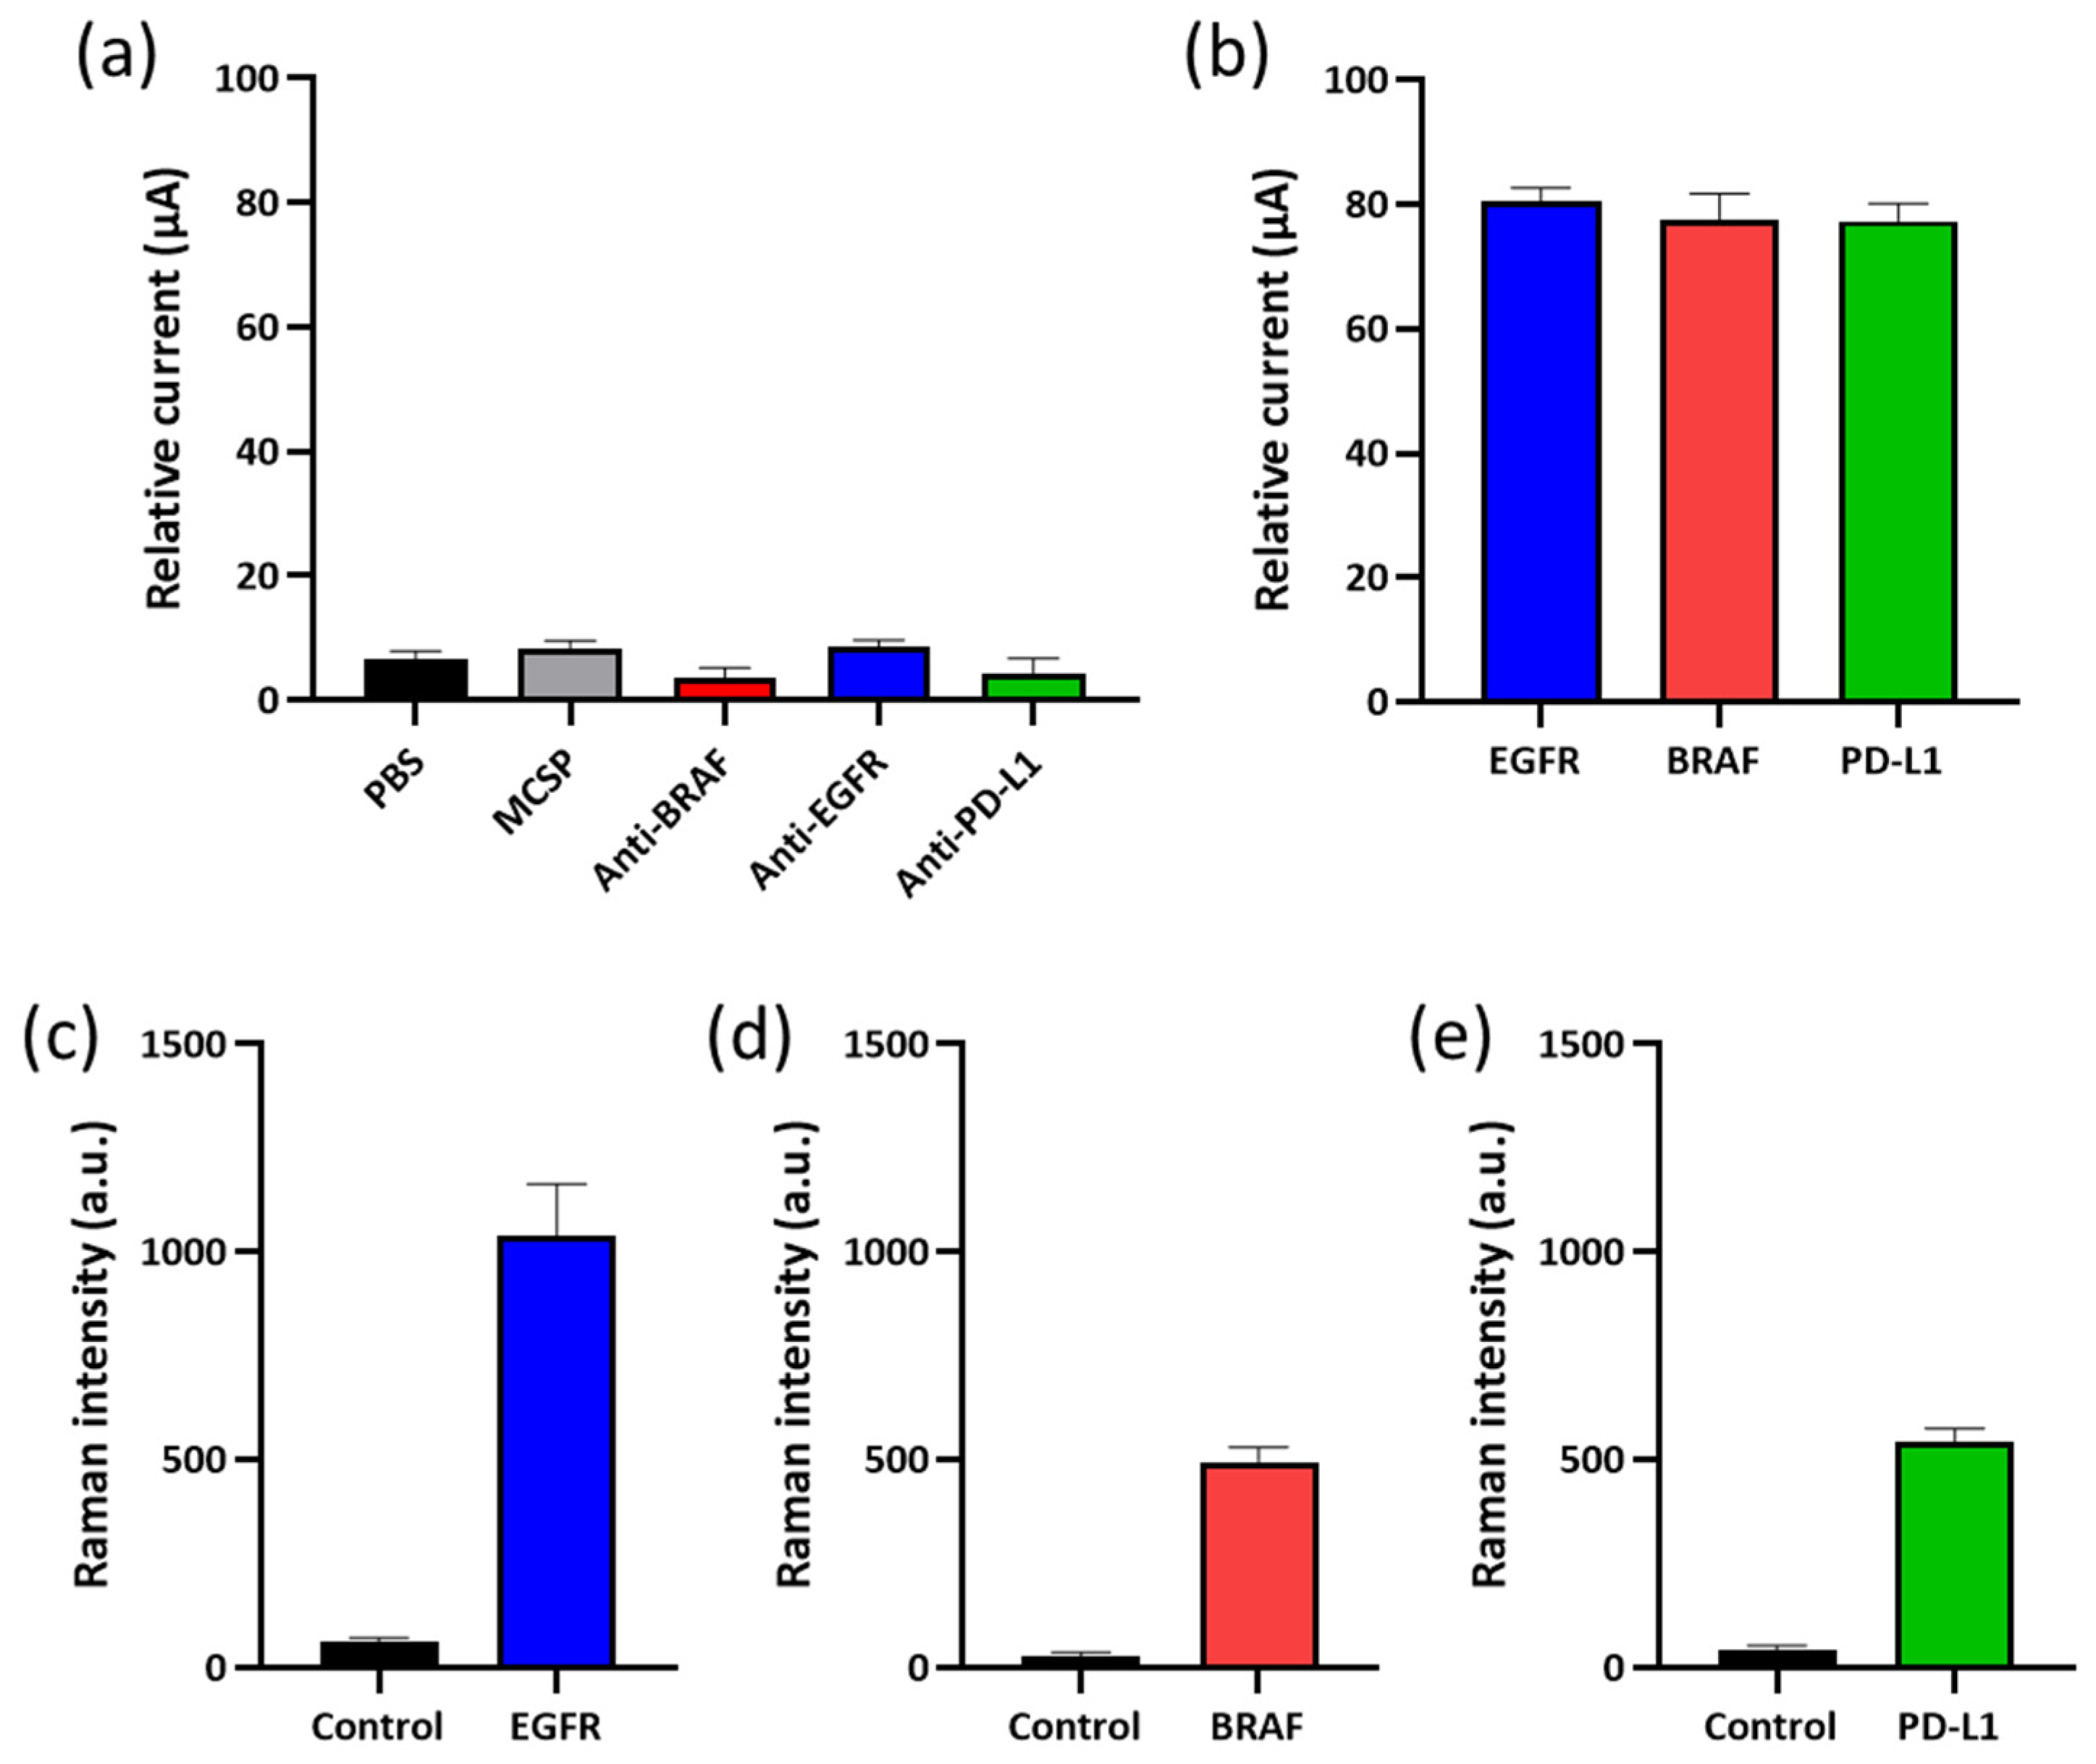
3.2. Specificity for the Ensemble and Individual Detection of Circulating EGFR, PDL-1, and BRAF
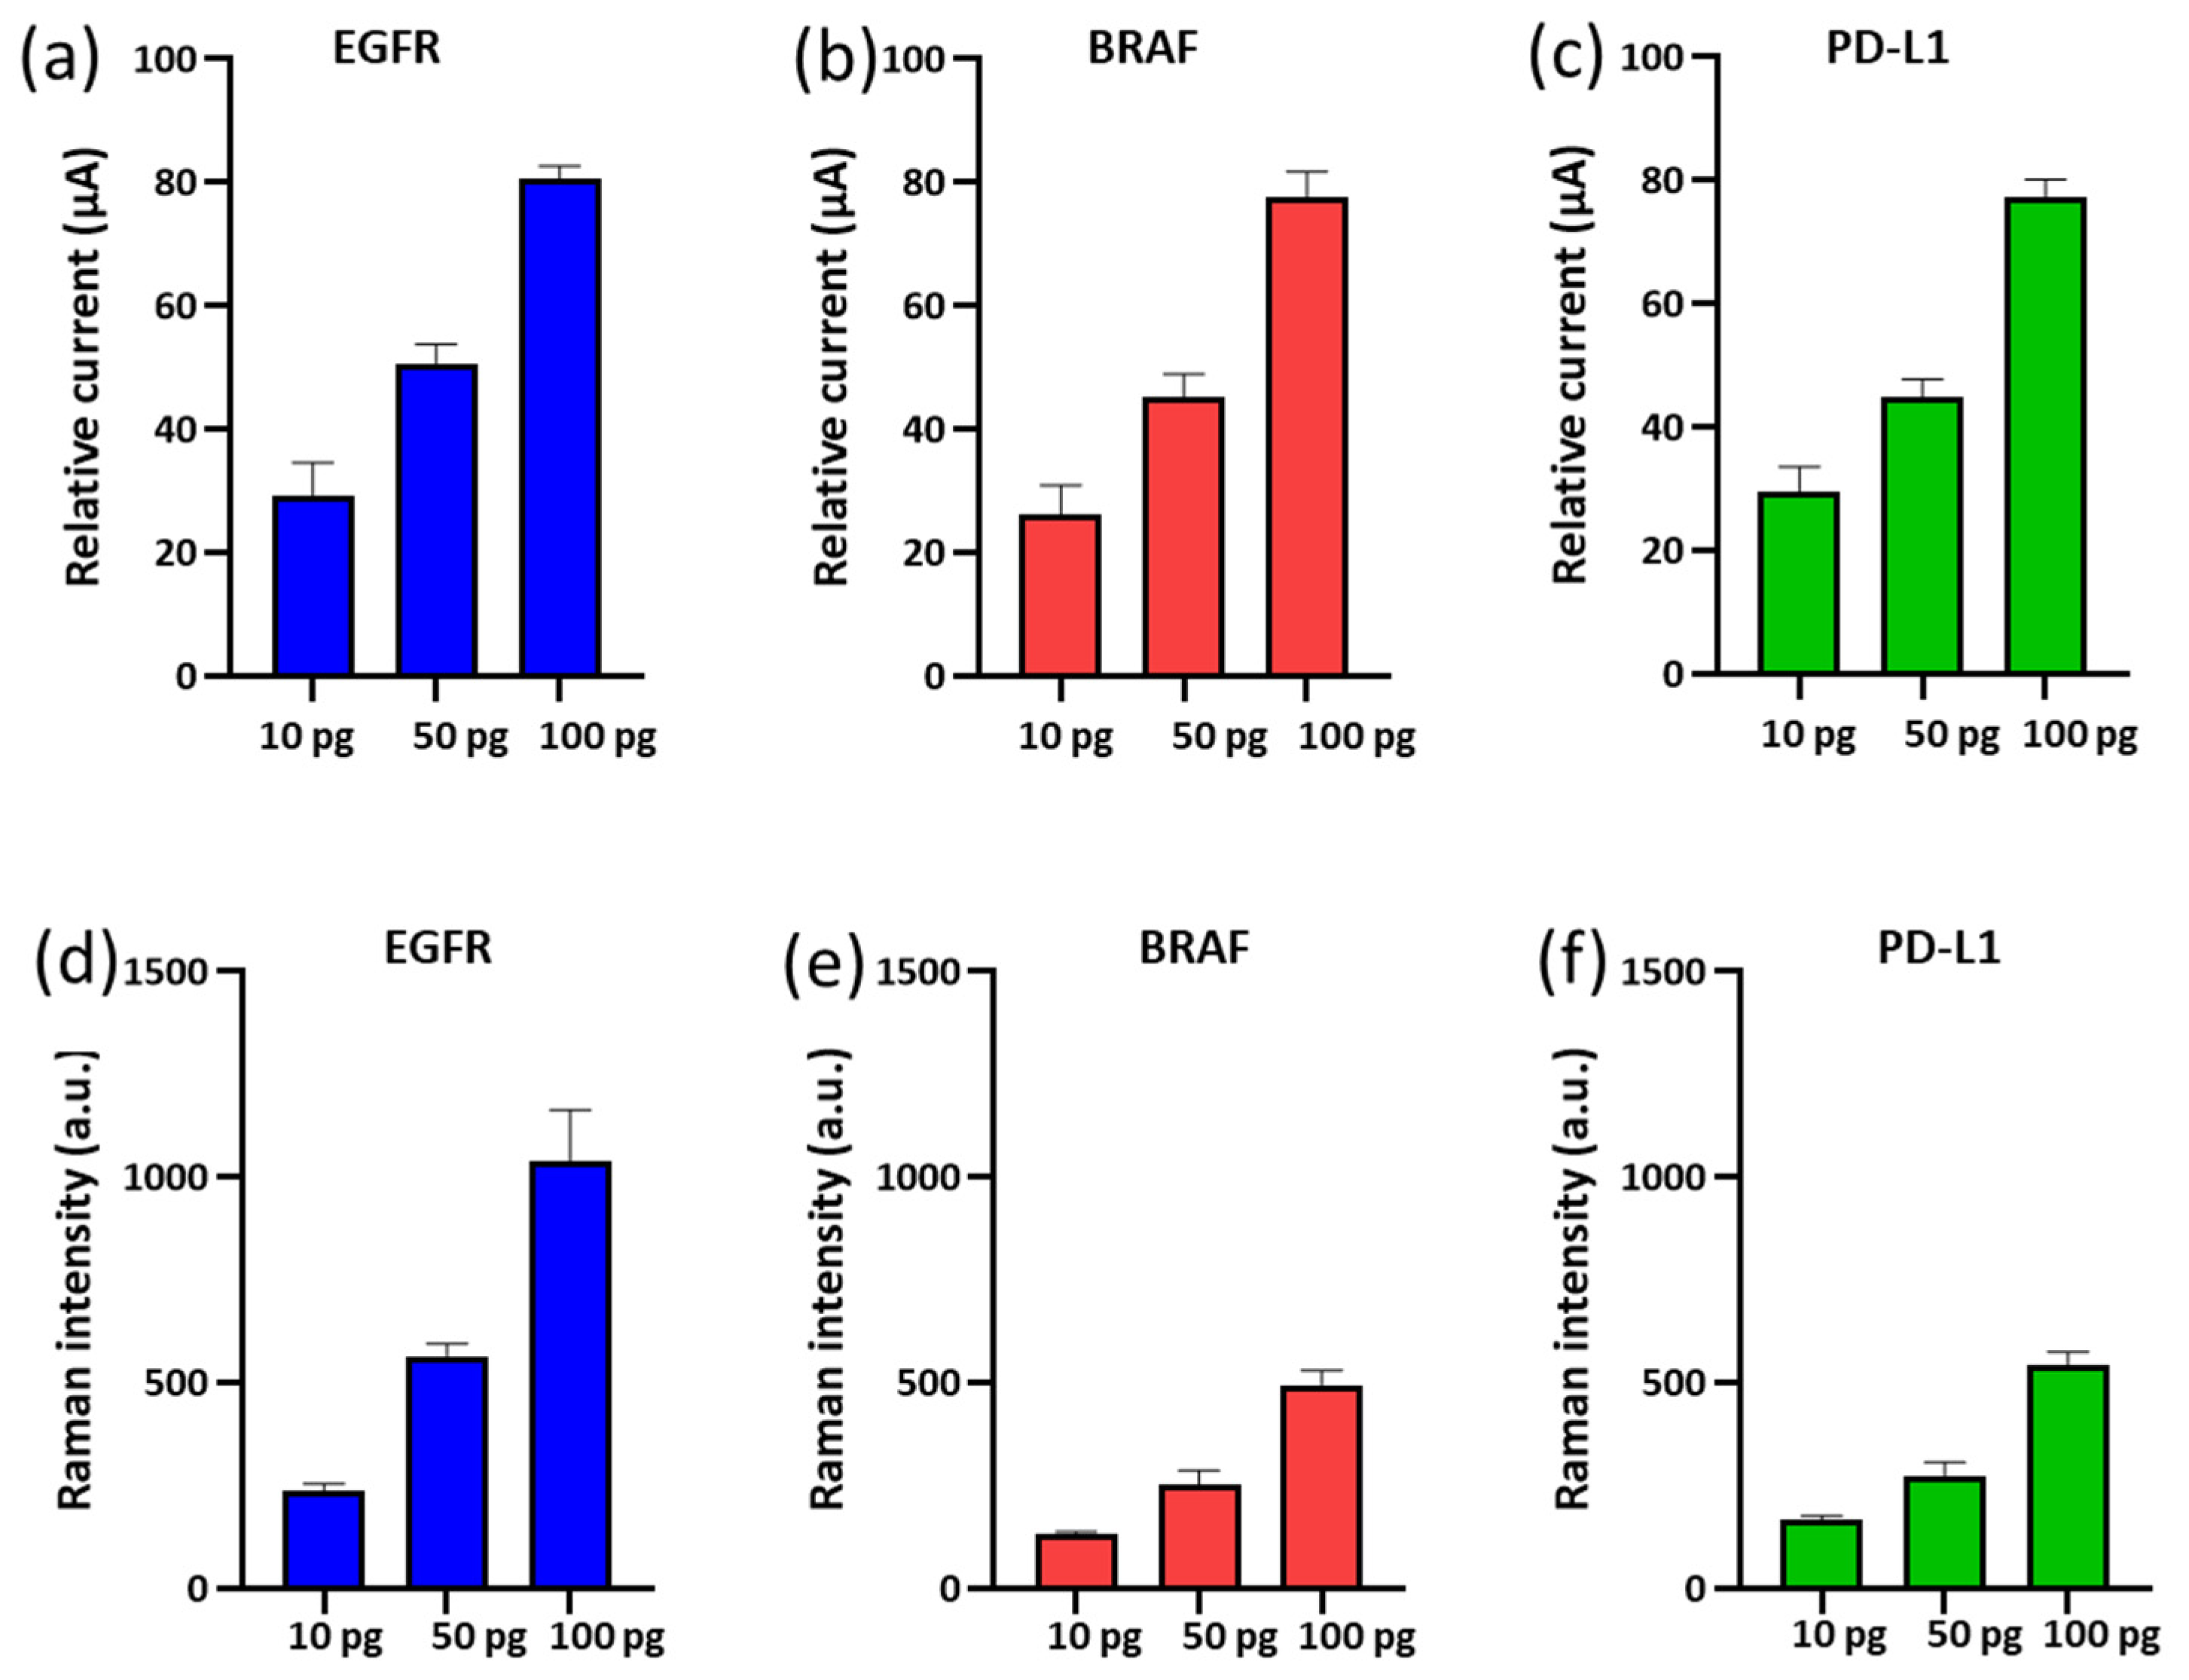
3.3. Sensitivity for Individual Detection of Circulating EGFR, BRAF and PDL-1
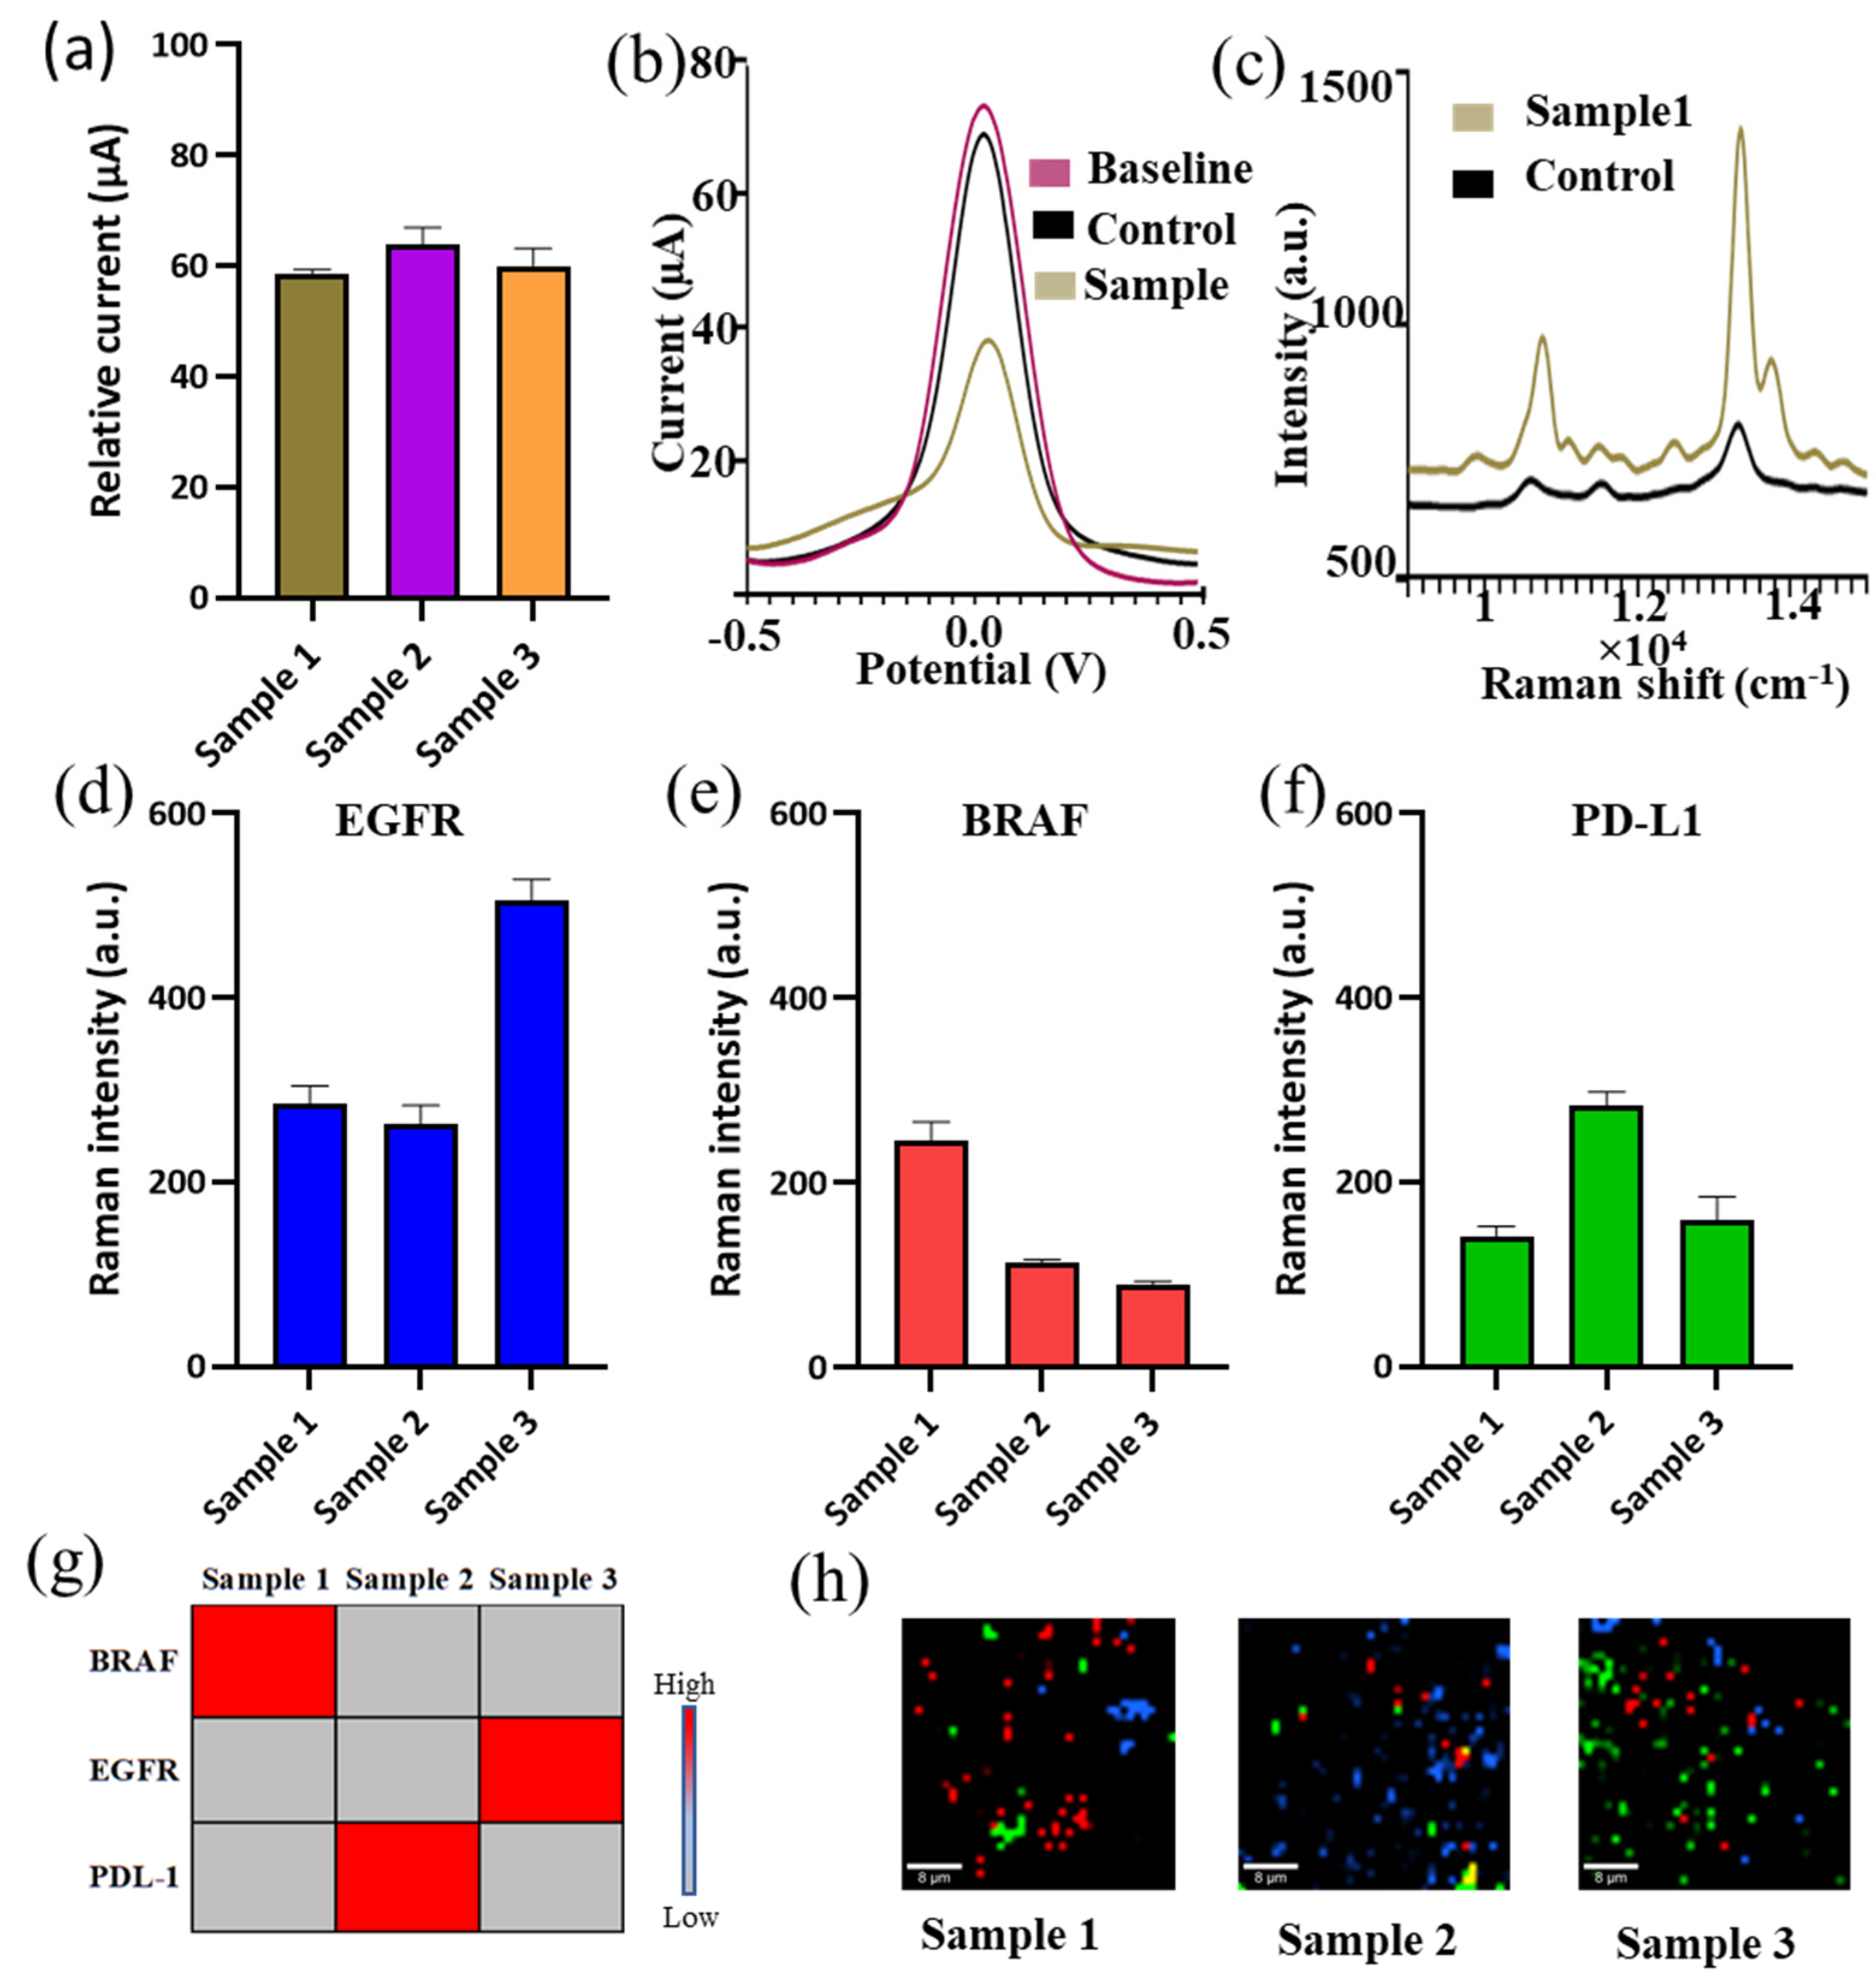
3.4. Ensemble and Individual Detection of a Mixture of Circulating EGFR, BRAF and PDL-1
4. Discussion
5. Conclusions
Supplementary Materials
Author Contributions
Funding
Data Availability Statement
Acknowledgments
Conflicts of Interest
References
- Fisher, R.; Pusztai, L.; Swanton, C. Cancer heterogeneity: Implications for targeted therapeutics. Br. J. Cancer 2013, 108, 479–485. [Google Scholar] [CrossRef] [PubMed] [Green Version]
- Palmirotta, R.; Lovero, D.; Cafforio, P.; Felici, C.; Mannavola, F.; Pellè, E.; Quaresmini, D.; Tucci, M.; Silvestris, F. Liquid biopsy of cancer: A multimodal diagnostic tool in clinical oncology. Ther. Adv. Med. Oncol. 2018, 10, 1758835918794630. [Google Scholar] [CrossRef]
- Alix-Panabieres, C. The future of liquid biopsy. Nature 2020, 579, S9. [Google Scholar] [CrossRef] [PubMed] [Green Version]
- Pantel, K.; Alix-Panabières, C. Real-time liquid biopsy in cancer patients: Fact or fiction? Cancer Res. 2013, 73, 6384–6388. [Google Scholar] [CrossRef] [PubMed] [Green Version]
- Hofman, P.; Heeke, S.; Alix-Panabières, C.; Pantel, K. Liquid biopsy in the era of immuno-oncology: Is it ready for prime-time use for cancer patients? Ann. Oncol. 2019, 30, 1448–1459. [Google Scholar] [CrossRef] [Green Version]
- Birkenkamp-Demtröder, K.; Christensen, E.; Nordentoft, I.; Knudsen, M.; Taber, A.; Høyer, S.; Lamy, P.; Agerbæk, M.; Jensen, J.B.; Dyrskjøt, L. Monitoring treatment response and metastatic relapse in advanced bladder cancer by liquid biopsy analysis. Eur. Urol. 2018, 73, 535–540. [Google Scholar] [CrossRef]
- Zhu, X.; Lang, J. Soluble PD-1 and PD-L1: Predictive and prognostic significance in cancer. Oncotarget 2017, 8, 97671. [Google Scholar] [CrossRef] [Green Version]
- Baron, A.T.; Wilken, J.A.; Haggstrom, D.E.; Goodrich, S.T.; Maihle, N.J. Clinical implementation of soluble EGFR (sEGFR) as a theragnostic serum biomarker of breast, lung and ovarian cancer. IDrugs 2009, 12, 302–308. [Google Scholar]
- Chen, Y.; Wang, Q.; Shi, B.; Xu, P.; Hu, Z.; Bai, L.; Zhang, X. Development of a sandwich ELISA for evaluating soluble PD-L1 (CD274) in human sera of different ages as well as supernatants of PD-L1+ cell lines. Cytokine 2011, 56, 231–238. [Google Scholar] [CrossRef]
- Chu, B.; Qi, T.; Liao, J.; Peng, J.; Li, W.; Fu, S.; Luo, F.; Qian, Z. Colorimetric detection of cancer biomarker based on pH induced color change. Sens. Actuators B Chem. 2012, 166, 56–60. [Google Scholar] [CrossRef]
- Wegner, K.D.; Lindén, S.; Jin, Z.; Jennings, T.L.; el Khoulati, R.; van Bergen en Henegouwen, P.M.; Hildebrandt, N. Nanobodies and nanocrystals: Highly sensitive quantum dot-based homogeneous FRET immunoassay for serum-based EGFR detection. Small 2014, 10, 734–740. [Google Scholar] [CrossRef]
- Wu, S.; Liu, L.; Li, G.; Jing, F.; Mao, H.; Jin, Q.; Zhai, W.; Zhang, H.; Zhao, J.; Jia, C. Multiplexed detection of lung cancer biomarkers based on quantum dots and microbeads. Talanta 2016, 156, 48–54. [Google Scholar] [CrossRef] [PubMed]
- Qu, F.; Li, T.; Yang, M. Colorimetric platform for visual detection of cancer biomarker based on intrinsic peroxidase activity of graphene oxide. Biosens. Bioelectron. 2011, 26, 3927–3931. [Google Scholar] [CrossRef] [PubMed]
- Antal-Szalmás, P.; Nagy, B., Jr.; Debreceni, I.B.; Kappelmayer, J. Measurement of soluble biomarkers by flow cytometry. EJIFCC 2013, 23, 135. [Google Scholar] [PubMed]
- Nimse, S.B.; Sonawane, M.D.; Song, K.-S.; Kim, T. Biomarker detection technologies and future directions. Analyst 2016, 141, 740–755. [Google Scholar] [CrossRef] [Green Version]
- Chikkaveeraiah, B.V.; Bhirde, A.A.; Morgan, N.Y.; Eden, H.S.; Chen, X. Electrochemical immunosensors for detection of cancer protein biomarkers. ACS Nano 2012, 6, 6546–6561. [Google Scholar] [CrossRef] [Green Version]
- Díaz-Fernández, A.; Lorenzo-Gómez, R.; Miranda-Castro, R.; de-Los-Santos-Álvarez, N.; Lobo-Castañón, M.J. Electrochemical aptasensors for cancer diagnosis in biological fluids—A review. Anal. Chim. Acta 2020, 1124, 1–19. [Google Scholar] [CrossRef]
- Hasan, M.; Ahommed, M.; Daizy, M.; Bacchu, M.; Ali, M.; Al-Mamun, M.; Aly, M.A.S.; Khan, M.; Hossain, S. Recent development in electrochemical biosensors for cancer biomarkers detection. Biosens. Bioelectron. X 2021, 8, 100075. [Google Scholar] [CrossRef]
- Ilkhani, H.; Sarparast, M.; Noori, A.; Bathaie, S.Z.; Mousavi, M.F. Electrochemical aptamer/antibody based sandwich immunosensor for the detection of EGFR, a cancer biomarker, using gold nanoparticles as a signaling probe. Biosens. Bioelectron. 2015, 74, 491–497. [Google Scholar] [CrossRef]
- Moon, J.-M.; Kim, Y.H.; Cho, Y. A nanowire-based label-free immunosensor: Direct incorporation of a PSA antibody in electropolymerized polypyrrole. Biosens. Bioelectron. 2014, 57, 157–161. [Google Scholar] [CrossRef]
- Bravo, K.; Ortega, F.G.; Messina, G.A.; Sanz, M.I.; Fernández-Baldo, M.A.; Raba, J. Integrated bio-affinity nano-platform into a microfluidic immunosensor based on monoclonal bispecific trifunctional antibodies for the electrochemical determination of epithelial cancer biomarker. Clin. Chim. Acta 2017, 464, 64–71. [Google Scholar] [CrossRef]
- RáGonšales, V.; JustináGooding, J. Ultrasensitive detection of programmed death-ligand 1 (PD-L1) in whole blood using dispersible electrodes. Chem. Commun. 2021, 57, 2559–2562. [Google Scholar]
- Dey, S.; Koo, K.M.; Wang, Z.; Sina, A.A.; Wuethrich, A.; Trau, M. An integrated multi-molecular sensor for simultaneous BRAF V600E protein and DNA single point mutation detection in circulating tumour cells. Lab Chip 2019, 19, 738–748. [Google Scholar] [CrossRef] [PubMed] [Green Version]
- Guerrini, L.; Alvarez-Puebla, R.A. Surface-enhanced Raman spectroscopy in cancer diagnosis, prognosis and monitoring. Cancers 2019, 11, 748. [Google Scholar] [CrossRef] [Green Version]
- Vendrell, M.; Maiti, K.K.; Dhaliwal, K.; Chang, Y.-T. Surface-enhanced Raman scattering in cancer detection and imaging. Trends Biotechnol. 2013, 31, 249–257. [Google Scholar] [CrossRef]
- Granger, J.H.; Granger, M.C.; Firpo, M.A.; Mulvihill, S.J.; Porter, M.D. Toward development of a surface-enhanced Raman scattering (SERS)-based cancer diagnostic immunoassay panel. Analyst 2013, 138, 410–416. [Google Scholar] [CrossRef] [PubMed] [Green Version]
- Dey, S.; Trau, M.; Koo, K.M. Surface-enhanced raman spectroscopy for cancer immunotherapy applications: Opportunities, challenges, and current progress in nanomaterial strategies. Nanomaterials 2020, 10, 1145. [Google Scholar] [CrossRef] [PubMed]
- Wang, Y.; Vaidyanathan, R.; Shiddiky, M.J.; Trau, M. Enabling rapid and specific surface-enhanced Raman scattering immunoassay using nanoscaled surface shear forces. ACS Nano 2015, 9, 6354–6362. [Google Scholar] [CrossRef] [PubMed]
- Li, J.; Wuethrich, A.; Sina, A.A.; Cheng, H.-H.; Wang, Y.; Behren, A.; Mainwaring, P.N.; Trau, M. A digital single-molecule nanopillar SERS platform for predicting and monitoring immune toxicities in immunotherapy. Nat. Commun. 2021, 12, 1087. [Google Scholar] [CrossRef]
- Yang, H.; Gun, X.; Pang, G.; Zheng, Z.; Li, C.; Yang, C.; Wang, M.; Xu, K. Femtosecond laser patterned superhydrophobic/hydrophobic SERS sensors for rapid positioning ultratrace detection. Opt. Express 2021, 29, 16904–16913. [Google Scholar] [CrossRef]
- Xu, L.; Liu, H.; Zhou, H.; Hong, M. One-step fabrication of metal nanoparticles on polymer film by femtosecond LIPAA method for SERS detection. Talanta 2021, 228, 122204. [Google Scholar] [CrossRef] [PubMed]
- Kozhina, E.; Andreev, S.; Tarakanov, V.; Bedin, S.; Doludenko, I.; Naumov, A. Study of local fields of dendrite nanostructures in hot spots formed on SERS-active substrates produced via template-assisted synthesis. Bull. Russ. Acad. Sci. Phys. 2020, 84, 1465–1468. [Google Scholar] [CrossRef]
- Kozhina, E.P.; Bedin, S.A.; Nechaeva, N.L.; Podoynitsyn, S.N.; Tarakanov, V.P.; Andreev, S.N.; Grigoriev, Y.V.; Naumov, A.V. Ag-nanowire bundles with gap hot spots synthesized in track-etched membranes as effective SERS-substrates. Appl. Sci. 2021, 11, 1375. [Google Scholar] [CrossRef]
- Shiddiky, M.J.; Vaidyanathan, R.; Rauf, S.; Tay, Z.; Trau, M. Molecular nanoshearing: An innovative approach to shear off molecules with AC-induced nanoscopic fluid flow. Sci. Rep. 2014, 4, 3716. [Google Scholar] [CrossRef] [PubMed] [Green Version]
- Frens, G. Controlled nucleation for the regulation of the particle size in monodisperse gold suspensions. Nat. Phys. Sci. 1973, 241, 20–22. [Google Scholar] [CrossRef]
- Zorea, J.; Shukla, R.P.; Elkabets, M.; Ben-Yoav, H. Probing antibody surface density and analyte antigen incubation time as dominant parameters influencing the antibody-antigen recognition events of a non-faradaic and diffusion-restricted electrochemical immunosensor. Anal. Bioanal. Chem. 2020, 412, 1709–1717. [Google Scholar] [CrossRef] [Green Version]
- Kneipp, K.; Kneipp, H.; Kneipp, J. Surface-enhanced Raman scattering in local optical fields of silver and gold nanoaggregates from single-molecule Raman spectroscopy to ultrasensitive probing in live cells. Acc. Chem. Res. 2006, 39, 443–450. [Google Scholar] [CrossRef]
- Pérez-Jiménez, A.I.; Lyu, D.; Lu, Z.; Liu, G.; Ren, B. Surface-enhanced Raman spectroscopy: Benefits, trade-offs and future developments. Chem. Sci. 2020, 11, 4563–4577. [Google Scholar] [CrossRef] [Green Version]
- Hong, S.; Li, X. Optimal size of gold nanoparticles for surface-enhanced Raman spectroscopy under different conditions. J. Nanomater. 2013, 2013. [Google Scholar] [CrossRef]
- Chen, Z.; Liu, X.; Liu, D.; Li, F.; Wang, L.; Liu, S. Ultrasensitive electrochemical DNA biosensor fabrication by coupling an integral multifunctional zirconia-reduced graphene oxide-thionine nanocomposite and exonuclease I-assisted cleavage. Front. Chem. 2020, 8, 521. [Google Scholar] [CrossRef]
- Shaw, C.P.; Fan, M.; Lane, C.; Barry, G.; Jirasek, A.I.; Brolo, A.G. Statistical correlation between SERS intensity and nanoparticle cluster size. J. Phys. Chem. C 2013, 117, 16596–16605. [Google Scholar] [CrossRef]
- Zhou, Q.; Andersson, R.; Hu, D.; Bauden, M.; Kristl, T.; Sasor, A.; Pawłowski, K.; Pla, I.; Hilmersson, K.S.; Zhou, M. Quantitative proteomics identifies brain acid soluble protein 1 (BASP1) as a prognostic biomarker candidate in pancreatic cancer tissue. EBioMedicine 2019, 43, 282–294. [Google Scholar] [CrossRef] [PubMed] [Green Version]
- Welsh, J.B.; Sapinoso, L.M.; Kern, S.G.; Brown, D.A.; Liu, T.; Bauskin, A.R.; Ward, R.L.; Hawkins, N.J.; Quinn, D.I.; Russell, P.J. Large-scale delineation of secreted protein biomarkers overexpressed in cancer tissue and serum. Proc. Natl. Acad. Sci. USA 2003, 100, 3410–3415. [Google Scholar] [CrossRef] [PubMed] [Green Version]
- Ray, S.; Reddy, P.J.; Jain, R.; Gollapalli, K.; Moiyadi, A.; Srivastava, S. Proteomic technologies for the identification of disease biomarkers in serum: Advances and challenges ahead. Proteomics 2011, 11, 2139–2161. [Google Scholar] [CrossRef]


Publisher’s Note: MDPI stays neutral with regard to jurisdictional claims in published maps and institutional affiliations. |
© 2022 by the authors. Licensee MDPI, Basel, Switzerland. This article is an open access article distributed under the terms and conditions of the Creative Commons Attribution (CC BY) license (https://creativecommons.org/licenses/by/4.0/).
Share and Cite
Dey, S.; Ahmed, E.; Somvanshi, P.S.; Sina, A.A.I.; Wuethrich, A.; Trau, M. An Electrochemical and Raman Scattering Dual Detection Biosensor for Rapid Screening and Biomolecular Profiling of Cancer Biomarkers. Chemosensors 2022, 10, 93. https://0-doi-org.brum.beds.ac.uk/10.3390/chemosensors10030093
Dey S, Ahmed E, Somvanshi PS, Sina AAI, Wuethrich A, Trau M. An Electrochemical and Raman Scattering Dual Detection Biosensor for Rapid Screening and Biomolecular Profiling of Cancer Biomarkers. Chemosensors. 2022; 10(3):93. https://0-doi-org.brum.beds.ac.uk/10.3390/chemosensors10030093
Chicago/Turabian StyleDey, Shuvashis, Emtiaz Ahmed, Pranjal Satishchandra Somvanshi, Abu Ali Ibn Sina, Alain Wuethrich, and Matt Trau. 2022. "An Electrochemical and Raman Scattering Dual Detection Biosensor for Rapid Screening and Biomolecular Profiling of Cancer Biomarkers" Chemosensors 10, no. 3: 93. https://0-doi-org.brum.beds.ac.uk/10.3390/chemosensors10030093