
A Laser-Induced Photoelectrochemical Sensor for Natural Sweat Cu2+ Detection

College of Chemistry and Chemical Engineering, Hubei University, Wuhan 430062, China
*
Author to whom correspondence should be addressed.
Chemosensors 2022, 10(5), 169; https://0-doi-org.brum.beds.ac.uk/10.3390/chemosensors10050169
Submission received: 5 April 2022
/
Revised: 28 April 2022
/
Accepted: 29 April 2022
/
Published: 2 May 2022
(This article belongs to the Special Issue Photoelectrochemical (Bio)sensors for Biological, Food, and Environmental Analysis)
Abstract
:Tracking fluctuations in the Cu2+ level in sweat is meaningful for non-invasive and real-time assessment of Cu2+-abnormality-related diseases and provides important diagnostic information. However, the user-unfriendly ways to obtain sweat and sweat biofouling have limited the development of this field. Herein, we exploit a highly sensitive photoelectrochemical (PEC) sensor as a detection method, a powerful laser engraving technique for the large-scale fabrication of laser-induced graphene and In-doped CdS (LIG-In-CdS) photoelectrodes, and a hydrophilic porous polyvinyl alcohol (PVA) hydrogel for natural sweat collection for fingertip touch sweat Cu2+ monitoring. The proposed sensor has several very attractive features: (i) the LIG-In-CdS photoelectrode with high photoelectric conversion efficiency can be produced by a cheap 450 nm semiconductor laser system; (ii) the sensor performs Cu2+ detection with a wide linear range of 1.28 ng/mL~5.12 μg/mL and good selectivity; (iii) the PVA hydrogel possesses an excellent antifouling effect ability and a rapid natural sweat collection ability; and (iv) the sensor exhibits feasibility and good reliability for PEC sensing of sweat Cu2+. Thus, these advantages endow the proposed method with a great deal of potential for smart monitoring of heavy metals in sweat in the future.
1. Introduction
As an essential trace element in human beings, Cu2+ plays a pivotal role in physiological processes [1]. Abnormal uptake of Cu is associated with various diseases, such as Wilson’s disease, Menkes disease, hematological abnormalities, and kidney and cardiovascular diseases [2]. Consequently, it is of considerable significance to detect Cu2+ in human biofluids. Among the several candidate biofluids, including blood, interstitial fluid, tears, urine, saliva, and sweat, sweat has attracted a lot of research interest because it can be generated on-demand at convenient locations on the body and is ideal for continuous monitoring [3]. Sweat also contains many other biological biomarkers that could potentially indicate an individual’s health status, so sweat analysis allows individuals to monitor their own health, early diagnosis and predictive analysis of disease, and promotes the realization of a real-time, forward-looking, and personalized medical mode [4]. However, obtaining information-rich sweat usually requires physical exercise, iontophoretic stimulation, or heat treatment, which not only place higher requirements on the research environment or conditions but also may be physically impossible for some user groups, such as patients and the elderly [5,6]. To address this issue, natural-sweat-based sensors that eliminate vigorous sweat stimulation methods have demonstrated immense potential for autonomous monitoring of the patient’s physical condition in the resting state [7]. More importantly, natural sweat produced at lower sweat rates reduces the change in the content of secreted targets due to stimulation and thus maintains a better sweat and blood correlation [8]. While exercise sweat Cu2+ monitoring has been reported in the literature [2,9,10], the development of more sensitive and user-friendly detection methods for natural sweat Cu2+ remains an urgent need. In addition, the biofouling of electrodes is a major challenge to accurate electrochemical detection in complex biological liquids (such as serum and urine) [11]. Although many targets (e.g., electrolytes, metabolites, amino acids, proteins, and hormones) in sweat are lower in content than in the blood due to the skin barrier, it is still necessary to develop fouling-resistant wearable sensors for continuous sweat analysis to avoid sweat contamination [12,13].
To detect chemical substances in sweat, electrochemical sensors are widely used because of their low cost, ease of miniaturization, and fast response times [14]. In recent years, the laser engraving technique has emerged as a versatile and powerful method for the large-scale fabrication of flexible electrodes with customizable designs, and its simple, scalable, mask-free fabrication process makes it crucial for the widespread implementation of wearable sensors [15]. Laser-induced graphene (LIG) possesses high electrical conductivity and unique mechanical properties [16]. As a revolutionary form of electrochemical analysis, photoelectrochemical (PEC) sensing not only has the advantages of the electrochemical sensors mentioned above but also has higher sensitivity than the traditional electrochemical method due to the separation of the excitation signal and the detection signal [17,18]. The laser engraving method has also been used for the preparation of photoelectrodes for sensitive PEC analysis [19,20,21]. However, these photoelectrodes were all produced using a 1060 nm CO2 laser machine, and they were not fully optimized for photoelectric performance or used for sweat analysis. A cheaper and more readily available semiconductor laser has been successfully used to prepare LIG [22,23]. Therefore, studying the fabrication of high-performance photoelectrodes using the semiconductor laser on flexible substrates is vital for the development of wearable PEC sweat sensors. Furthermore, the metal/non-metal doping strategy, as an efficient method for improving the photoelectric properties of semiconductor materials [24], is worth introducing into the laser engraving photoelectrode system.
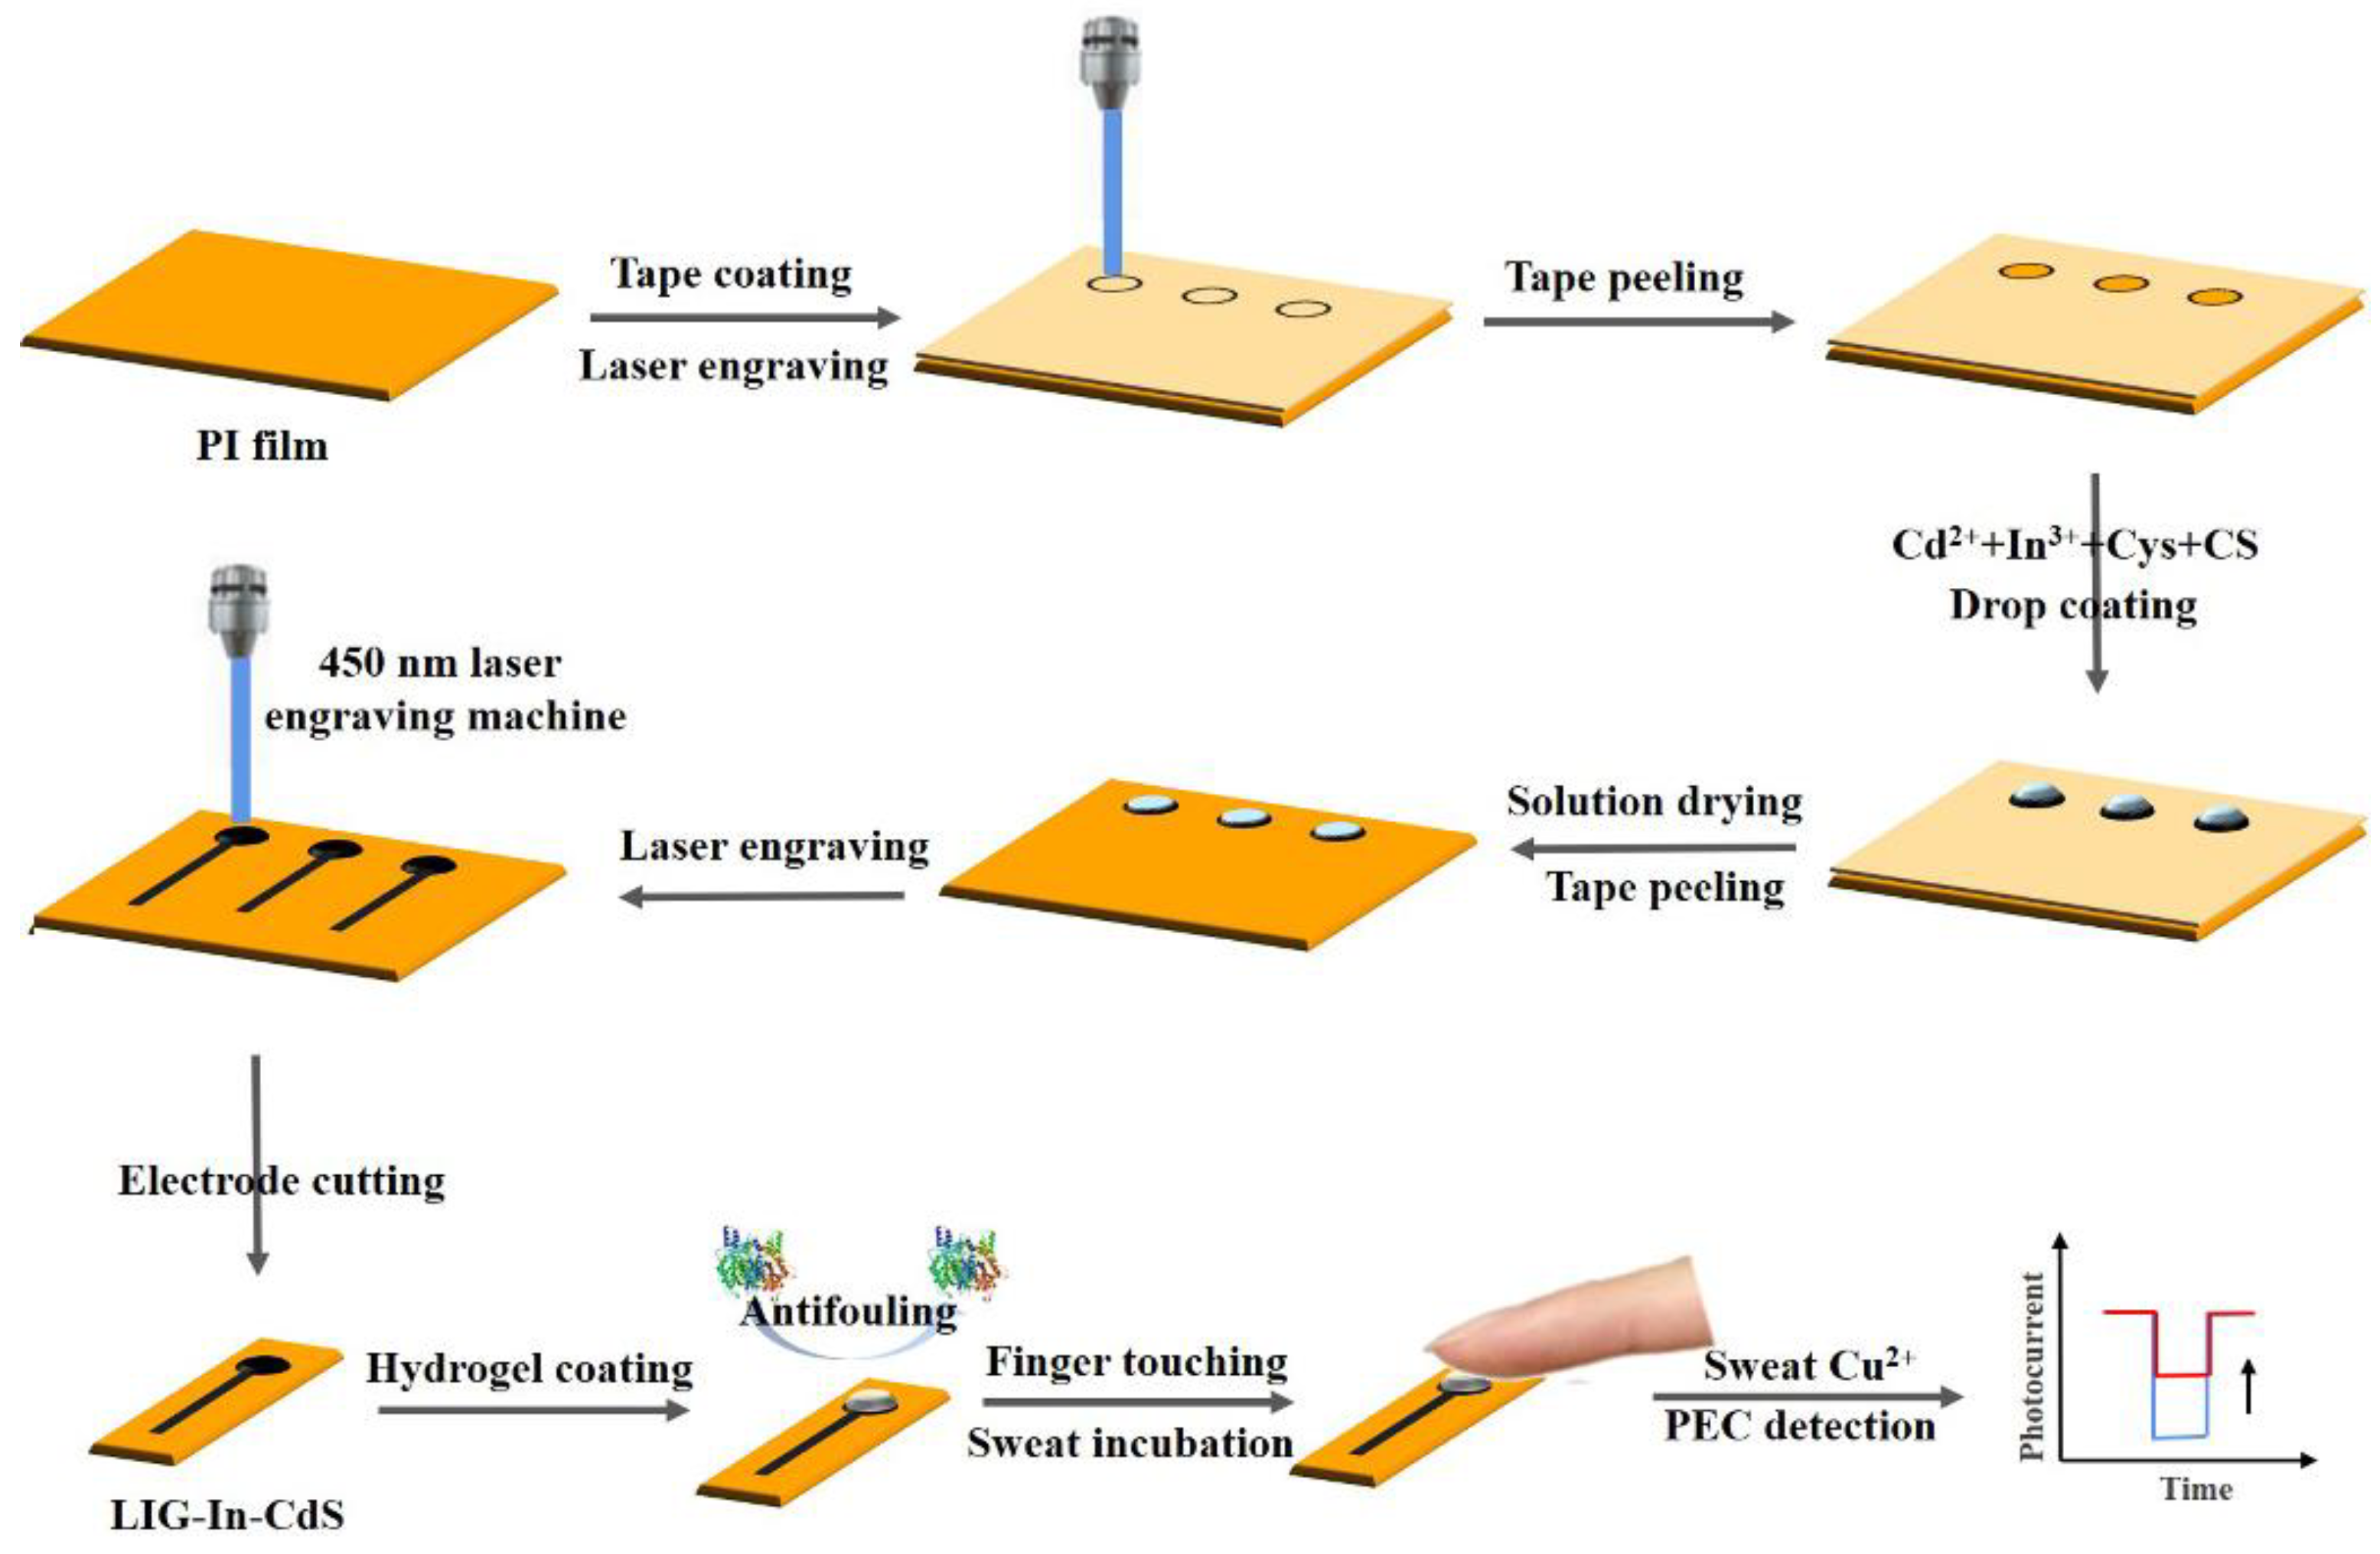
Herein, we propose an antifouling PEC sensor based on a laser-induced graphene and In-doped CdS composite (LIG-In-CdS) for natural sweat Cu2+ detection (Figure 1). The LIG-In-CdS was produced by engraving a chitosan (CS, polymer and carbon source) membrane containing Cd2+ (cadmium source), In3+ (doping element), and cysteine (Cys, sulfur source) modified on a polyimide (PI) film by a 450 nm semiconductor laser system. Compared with the polyethersulfone (PES) polymer commonly used in the preparation of laser-induced photoelectrodes, CS had a better film-forming ability and the photocurrent of the fabricated LIG-CdS photoelectrode was significantly higher than that produced by PES. After the optimization of the sulfur source, the Cys concentration, the doping element, and the concentration ratio of Cd and In, large-scale LIG-In-CdS electrodes with a high photocurrent were prepared for Cu2+ sensing. On account of the specific binding of Cu2+ with CdS [1], the photocurrent of the LIG-In-CdS electrodes decreased gradually with the increasing concentration of Cu2+ and exhibited a wide linear interval of 1.28 ng/mL to 5.12 μg/mL and good selectivity. Moreover, a hydrophilic porous polyvinyl alcohol (PVA) hydrogel was prepared for fingertip natural sweat collection and displayed an outstanding antifouling ability, which is very beneficial for improving the accuracy of the proposed sweat sensor. The natural sweat Cu2+ detection value obtained by the “touch–incubate–detect” protocol fell within the reported physiological level range and was close to that measured in exercise sweat, demonstrating the feasibility of the developed sensor. Additionally, its good reliability was verified by recovery studies conducted in the collected exercise sweat.
2. Materials and Methods
2.1. Materials
Cadmium chloride (CdCl2·2.5H2O), cysteine (Cys), cupric sulfate pentahydrate (CuSO4·5H2O), thiourea, lysozyme (Lys), glucose (Glu), ascorbic acid (AA), uric acid (UA), potassium chloride (KCl), sodium sulfate (Na2SO4), potassium ferricyanide (K3Fe(CN)6), potassium ferrocyanide (K4Fe(CN)6), acetic acid, sucrose, dimethyl sulfoxide (DMSO), and N,N-dimethylformamide (DMF) were purchased from Sinopharm Chemical Reagent Co. Ltd., Shanghai, China. Thioacetamide (TAA), albumin from bovine serum (BSA), and polyvinylpyrrolidone (PVP, MW: 40,000) were obtained from Adamas-Beta (Shanghai, China). Indium acetate (In(Ac)3) was purchased from Sinopharm Chemical Reagent Co., Ltd. (Shanghai, China). Chitosan (CS), bismuth nitrate pentahydrate (Bi(NO3)3·5H2O), triethanolamine (TEA), manganese chloride (MnCl2), ammonium molybdate tetrahydrate ((NH4)2MoO4·4H2O), sodium hypophosphate monohydrate (NaH2PO2·H2O), boric acid (H3BO3), and cadmium(II) acetylacetonate (Cd(acac)2) were purchased from Aladdin Biochemical Technology Co., Ltd., Shanghai, China. Zinc dichloride (ZnCl2) was supplied by Shanghai Lingfeng Chemical Reagent Co., Ltd. (Shanghai, China). Magnesium chloride (MgCl2) was purchased from Innochem Reagent Co., Ltd. (Beijing, China). Lactate (LA) and polyvinyl alcohol (PVA, MW: 89,000-98,000) were purchased from Sigma-Aldrich (Shanghai, China). Dopamine hydrochloride (DA) was obtained from J&K Scientific Ltd. Polyethersulfone (PES) polymer was obtained from Trump Chemical Co., Ltd. (Guangzhou, China). Polyimide (PI) film with a thickness of 75 μm was purchased from Suzhou Max Plastic Products Co., Ltd. (Suzhou, China). Silver paste (BQ6880E) was obtained from Uninwel, Co., Ltd. (Shanghai, China). Epoxy glue was purchased from Hunan Magic Power Industrial Co (Liuyang, China). All chemicals were of analytical grade and used without further purification. All aqueous solutions were prepared using ultrapure deionized water (18.2 MΩ·cm) produced in a Milli-Q system (Millipore Corp., Burlington, MA, USA).
2.2. Methods
Scanning electron microscopy (SEM) images were collected on a field emission scanning electron microscope (JSM-7100F, JEOL, Japan). Elemental distributions were mapped by using energy dispersive spectroscopy (EDS) as an accessory to SEM at 15 kV. The transmission electron microscopy (TEM) images were recorded by a Tecnai G2 20 S-TWIN transmission electron microscope (FEI, Hillsboro, USA) with an acceleration voltage of 200 kV. An X-ray photoelectron spectra (XPS) scan spectrum was collected on an ESCALAB 250Xi using a monochromatic Al Kα source (Thermo Fisher, Waltham, USA). Powder X-ray diffraction (XRD) patterns were collected on a Bruker D8 Advan X-ray diffractometer (Bruker, Germany). A Raman spectrum was obtained on an inVia Reflex high-resolution confocal Raman microscope equipped with a 532 nm laser (Renishaw, Wotton-under-Edge, UK). The Mott–Schottky test was performed on a CHI 660E analyzer (CH Instruments, Shanghai, China) in 0.1 M PBS (containing 0.1 M Na2SO4). All the photocurrent measurements were performed on the CHI 660E analyzer at open circuit potentials in an electrolyte solution of 0.1 M KCl containing 0.5 M TEA by a three-electrode system including a homemade working electrode, a platinum wire counter electrode, and a saturated calomel reference electrode. A multi-functional LED system (~50 mW, 445–465 nm, Tianjin Brillante Technology Co. LTD, Tianjin, China) with an irradiation diameter of 4 mm was used as the light source.
2.3. Preparation of LIG-In-CdS
A laser engraving system (DK-5.0, Anqing Kejin Trading Co., Ltd., Anqing, China) with a semiconductor diode laser at a wavelength of 450 nm controlled by a computer was used to fabricate the photoelectrode (Figure S1a). Firstly, a PI film was cleaned using alcohol to remove surface impurities and then attached to a layer of PVC tape, which was engraved to obtain circular hole patterns (2.5 mm in diameter, Figure S1b). Then, 20 mM CdCl2·2.5H2O and 45 mM Cys were successively dissolved in a homogeneous CS solution (7.5 mg of CS dissolved in 5 mL of acetic acid solution) and the mixed solution was stirred for 1 h. Afterward, 3 μL of the mixture was drop-coated into the circular hole and the modified PI film was then placed into a vacuum oven at 50 °C for 15 min to evaporate the solvent. After peeling off the PVC tape, the PI film modified by the mixture membrane was obtained and then was scanned by the laser engraving machine according to the design pattern (the power of the machine was set at 4 W with a scan speed of 9.4 cm/s) to generate LIG-CdS (Figure S1c,d). Images of the electrodes at different stages of the laser engraving process are shown in Figure S2. For comparison, the 20 mM Cd(acac)2-containing PES (0.1555 g of PES dissolved in 5 mL of DMF/DMSO (v/v = 4:1)) and the 20 mM CdCl2 and Cys-containing PVP (25 mg of PVP dissolved in 5 mL of H2O) membranes that are commonly used in the literature for laser engraving were also prepared on the PI film. In addition, to improve the PEC performance of the LIG-CdS electrode, the sulfur source (TAA, thiourea, Cys), the Cys concentration (15 mM, 30 mM, 45 mM, and 60 mM), the doping element (4 mM, Mn, Bi, Mo, Zn, In, P, and B), and the concentration ratio of Cd and In (10:1, 5:1, and 5:2) were optimized. It also should be mentioned that the LIG was directly produced by engraving the PI film and the LIG-In was formed by engraving the In3+-containing CS membrane on the PI film.
2.4. Construction of a PEC Sensor for Cu2+ Detection
The obtained LIG-In-CdS/PI array was rinsed repeatedly in water to remove excess materials and cut into single electrodes, which were electrically connected to the Cu wire with silver paste and then sealed with epoxy glue and used as the PEC sensor. For the detection of Cu2+, Cu2+ solution at a concentration ranging between 1.28 ng/mL and 5.12 μg/mL was dropped onto the LIG-In-CdS surface. After incubation for 10 min, the photocurrent responses of LIG-In-CdS/Cu2+ were recorded. Selectivity tests were performed by comparing the PEC response of the interferents (50 μM UA, 10 μM AA, 5 mM LA, 50 μM DA, 150 μM Glu, 86 ng/mL Mg2+, 930 ng/mL Zn2+, 1.14 μg/mL Fe3+, and 0.36 ng/mL Cd2+) on the sensor with that of 100 ng/mL Cu2+.
2.5. Fabrication of PVA Hydrogel Patches
The PVA hydrogel was synthesized by following a slightly modified physical mixing and thermal crosslinking reaction method [25]. Firstly, 2.0 g of PVA was dissolved in 12 mL of water by stirring at 85 °C for 30 min and 9 g of sucrose was dissolved in 4 mL of water with continuous stirring and heating. Then, the sucrose solution was transferred to the PVA solution and the obtained mixture was continuously stirred at 60 °C for 3 h to form a hydrogel precursor. After cooling to room temperature, 4 g of the precursor was then poured into a Petri dish (3.5 cm in diameter) and placed in an oven at 70 °C to remove excess water and allow for crosslinking until only 2/3 of the weight of the precursor remained. Finally, film-like PVA hydrogels with a diameter of 2.5 mm were produced by a puncher and stored in 0.1 M PBS for subsequent use.
2.6. Antifouling Test
The changes in the photocurrent of the PVA-hydrogel-modified sensor before and after incubation with 10 mg/mL BSA or 10 mg/mL Lys solution for 10 min were recorded to evaluate the antifouling property of the hydrogel film.
2.7. Detection of Natural Sweat Cu2+
The on-body sweat test was performed on a healthy subject who had fully consented to the release of the sensing results to the public. A PVA hydrogel patch was placed on the LIG-In-CdS electrode for fingertip sweat collection. Specifically, the index finger was cleaned by a wet tissue and the sweat was allowed to accumulate on the fingertip for 3 min. Then, the subject touched the hydrogel patch for different amounts of time (30 s, 60 s, 90 s, and 120 s). Right after touching the patch, the sensor was put in a humid environment for incubation with Cu2+ for 10 min and then its photocurrent was recorded. Moreover, we also tested the Cu2+ concentration in sweat produced by physical exercise (in the same subject) for comparison.
3. Results and Discussion
3.1. Characterizations of LIG-In-CdS
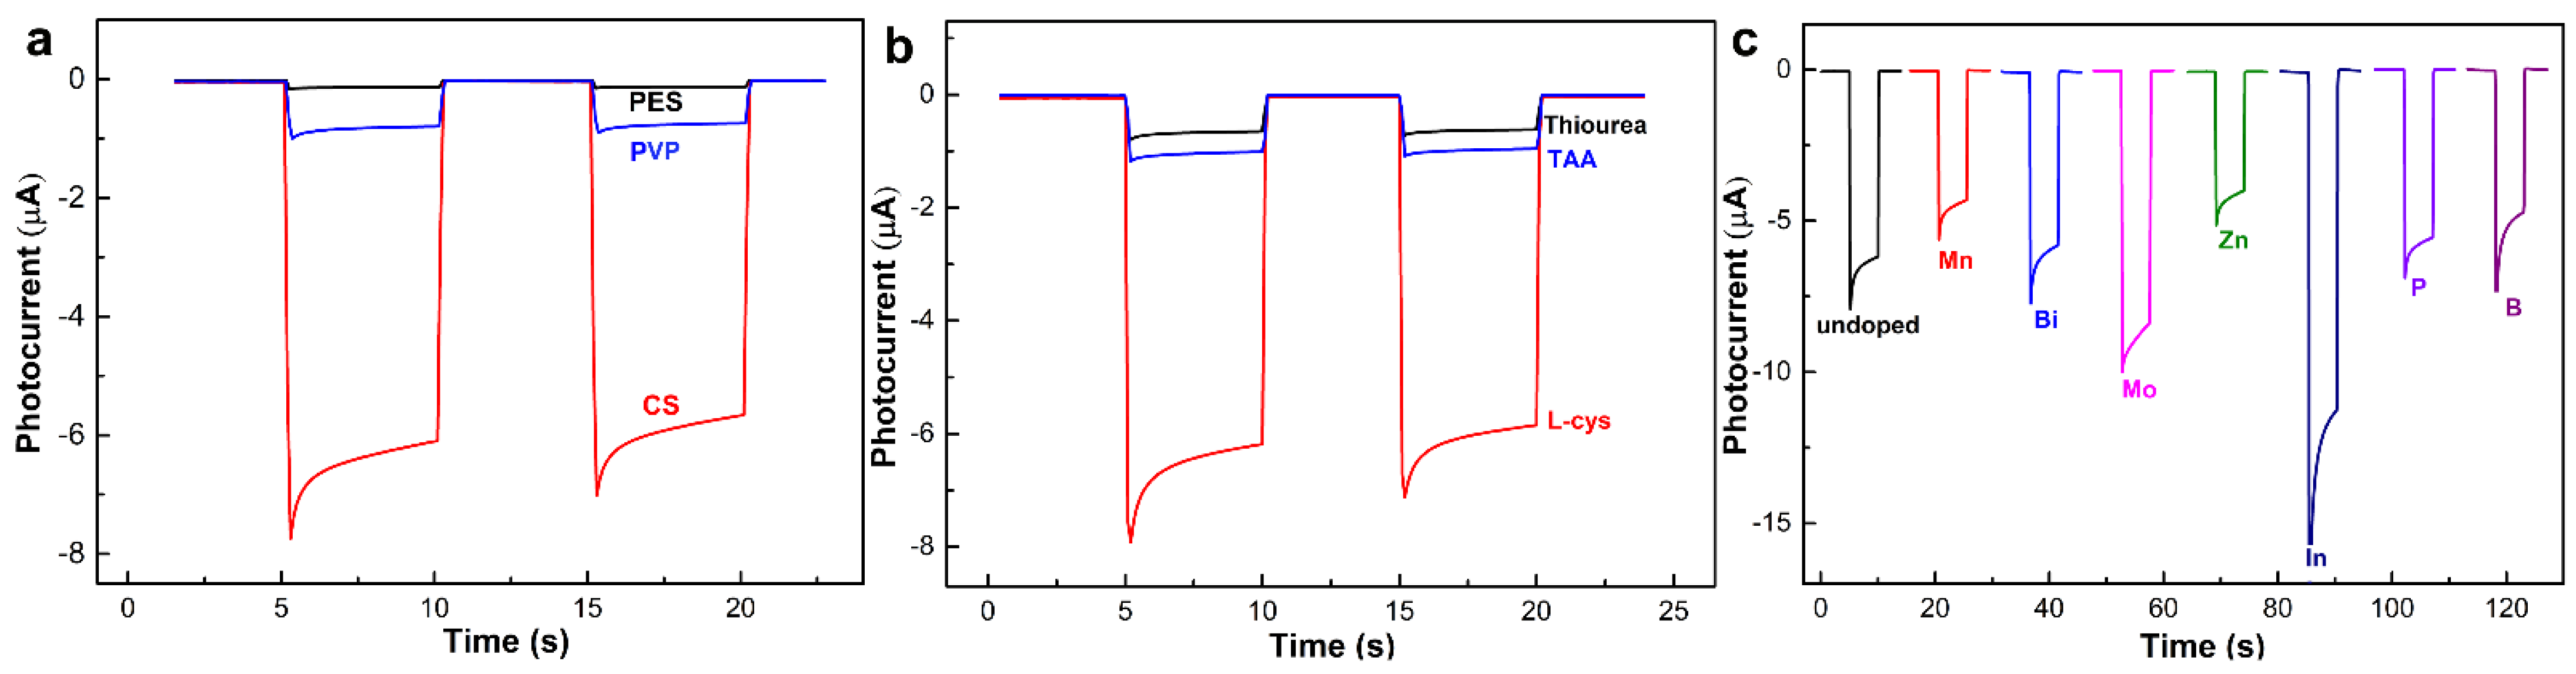
At present, there are PEC sensors that use laser engraving technology to generate photoelectrodes, which are usually obtained by laser engraving the metal-ion-containing polymer (e.g., PES) modified on the electrode surface using a 1060 nm CO2 laser [19,26]. In addition, PVP and CS are often used as hydrophilic thin-film surface modifications in laser engraving [23,27]. Herein, the PEC properties of LIG-CdS produced by using different polymers (PES, PVP, and CS) were compared. As displayed in Figure 2a, the photocurrent response of LIG-CdS (CS) was significantly greater than that of LIG-CdS (PES) and LIG-CdS (PVP). Although we used the same cadmium source (Cd(acac)2) as that reported in the literature, and PES was also used as both a carbon and a sulfur source [19], the photocurrent of the obtained CdS was not satisfactory, probably because the 450 nm laser (~300 USD) used here did not produce as much energy as the 1060 nm laser (~20000 USD, Epilog Laser) used in the reference and because the conversion of carbon precursors to LIG originates from the photothermal effects for the IR laser, the photochemical effects for the UV laser, and the combination of photothermal and photochemical effects for the visible laser [16]. Moreover, the laser-induced formation of CdS in LIG should involve the reduction of sulfur at high valence states to S2− by the carbothermic reaction, which happens at high temperatures [19]. CS, as a natural polysaccharide biopolymer with good adhesion, an excellent film-forming ability, good biocompatibility, non-toxicity, and a low cost [28], can not only serve as a carbon source to increase the conductivity of the engraved photoelectrode but can also be used to obtain LIG-CdS with uniform morphology and an excellent photocurrent under a 450 nm laser. Therefore, this simple laser engraving method with low instrumentation requirements has a great deal of potential in the preparation of high-performance flexible photoelectrodes. Then, to obtain a better LIG-CdS electrode, the sulfur source and the sulfur concentration were optimized. The optimal sulfur source was found to be Cys (Figure 2b), and the optimal sulfur concentration was found to be 45 mM (Figure S3a). In addition, metal/non-metal doping has been reported to be a very effective strategy to improve the photocatalytic properties of CdS [29,30,31,32]. We added different doped ions to the precursor solution to obtain Mn, Bi, Mo, Zn, In, P, and B-doped CdS, and the highest photocurrent of LIG-In-CdS indicated that In was the optimal doping element (Figure 2c). Further experiments showed that the optimal concentration ratio of Cd and In was 5:1 (Figure S3b). To sum up, the best conditions for laser engraving LIG-In-CdS are: CS as the polymer, 20 mM CdCl2 as the cadmium source, 45 mM Cys as the sulfur source, and 4 mM In as the doping element.
The surface morphologies of the synthesized electrodes were characterized by SEM and TEM. For the LIG produced by the laser carbonization of PI film at a high temperature [28], its 3D ordered and porous morphology and lamellar structure were visible in the SEM image (Figure S4a) and the TEM image (Figure S4d), respectively. After laser engraving the In3+-containing CS membrane, many In-based particles were distributed on the surface of the LIG (Figure S4b,e). The EDS spectrum of the LIG-In electrode (Figure S5a) demonstrated the presence of C, O, and In, which further confirmed the growth of In on the surface of the 3D porous graphene. Similarly, the SEM (Figure S4c), TEM (Figure S4f), and EDS (Figure S5b) images indicated the formation of CdS nanoparticles on the Cd2+ and Cys-containing CS film. Moreover, as can be seen in the SEM image of LIG-In-CdS (Figure 3a), many nanoparticles existed in the LIG framework; however, the differences between the In-based particles and the CdS nanoparticles could not be identified. Fortunately, LIG-In and LIG-CdS can be clearly observed in the TEM image (Figure 3b). The EDS maps also reveal the successful coupling of LIG-In and LIG-CdS within the LIG-In-CdS (Figure 3c). Figure 3d shows a cross-sectional SEM image of the obtained LIG-In-CdS, revealing the three-layer structure of the PI film, the PI tape, and the LIG-In-CdS. The thickness of the LIG-In-CdS layer was ~60 µm.
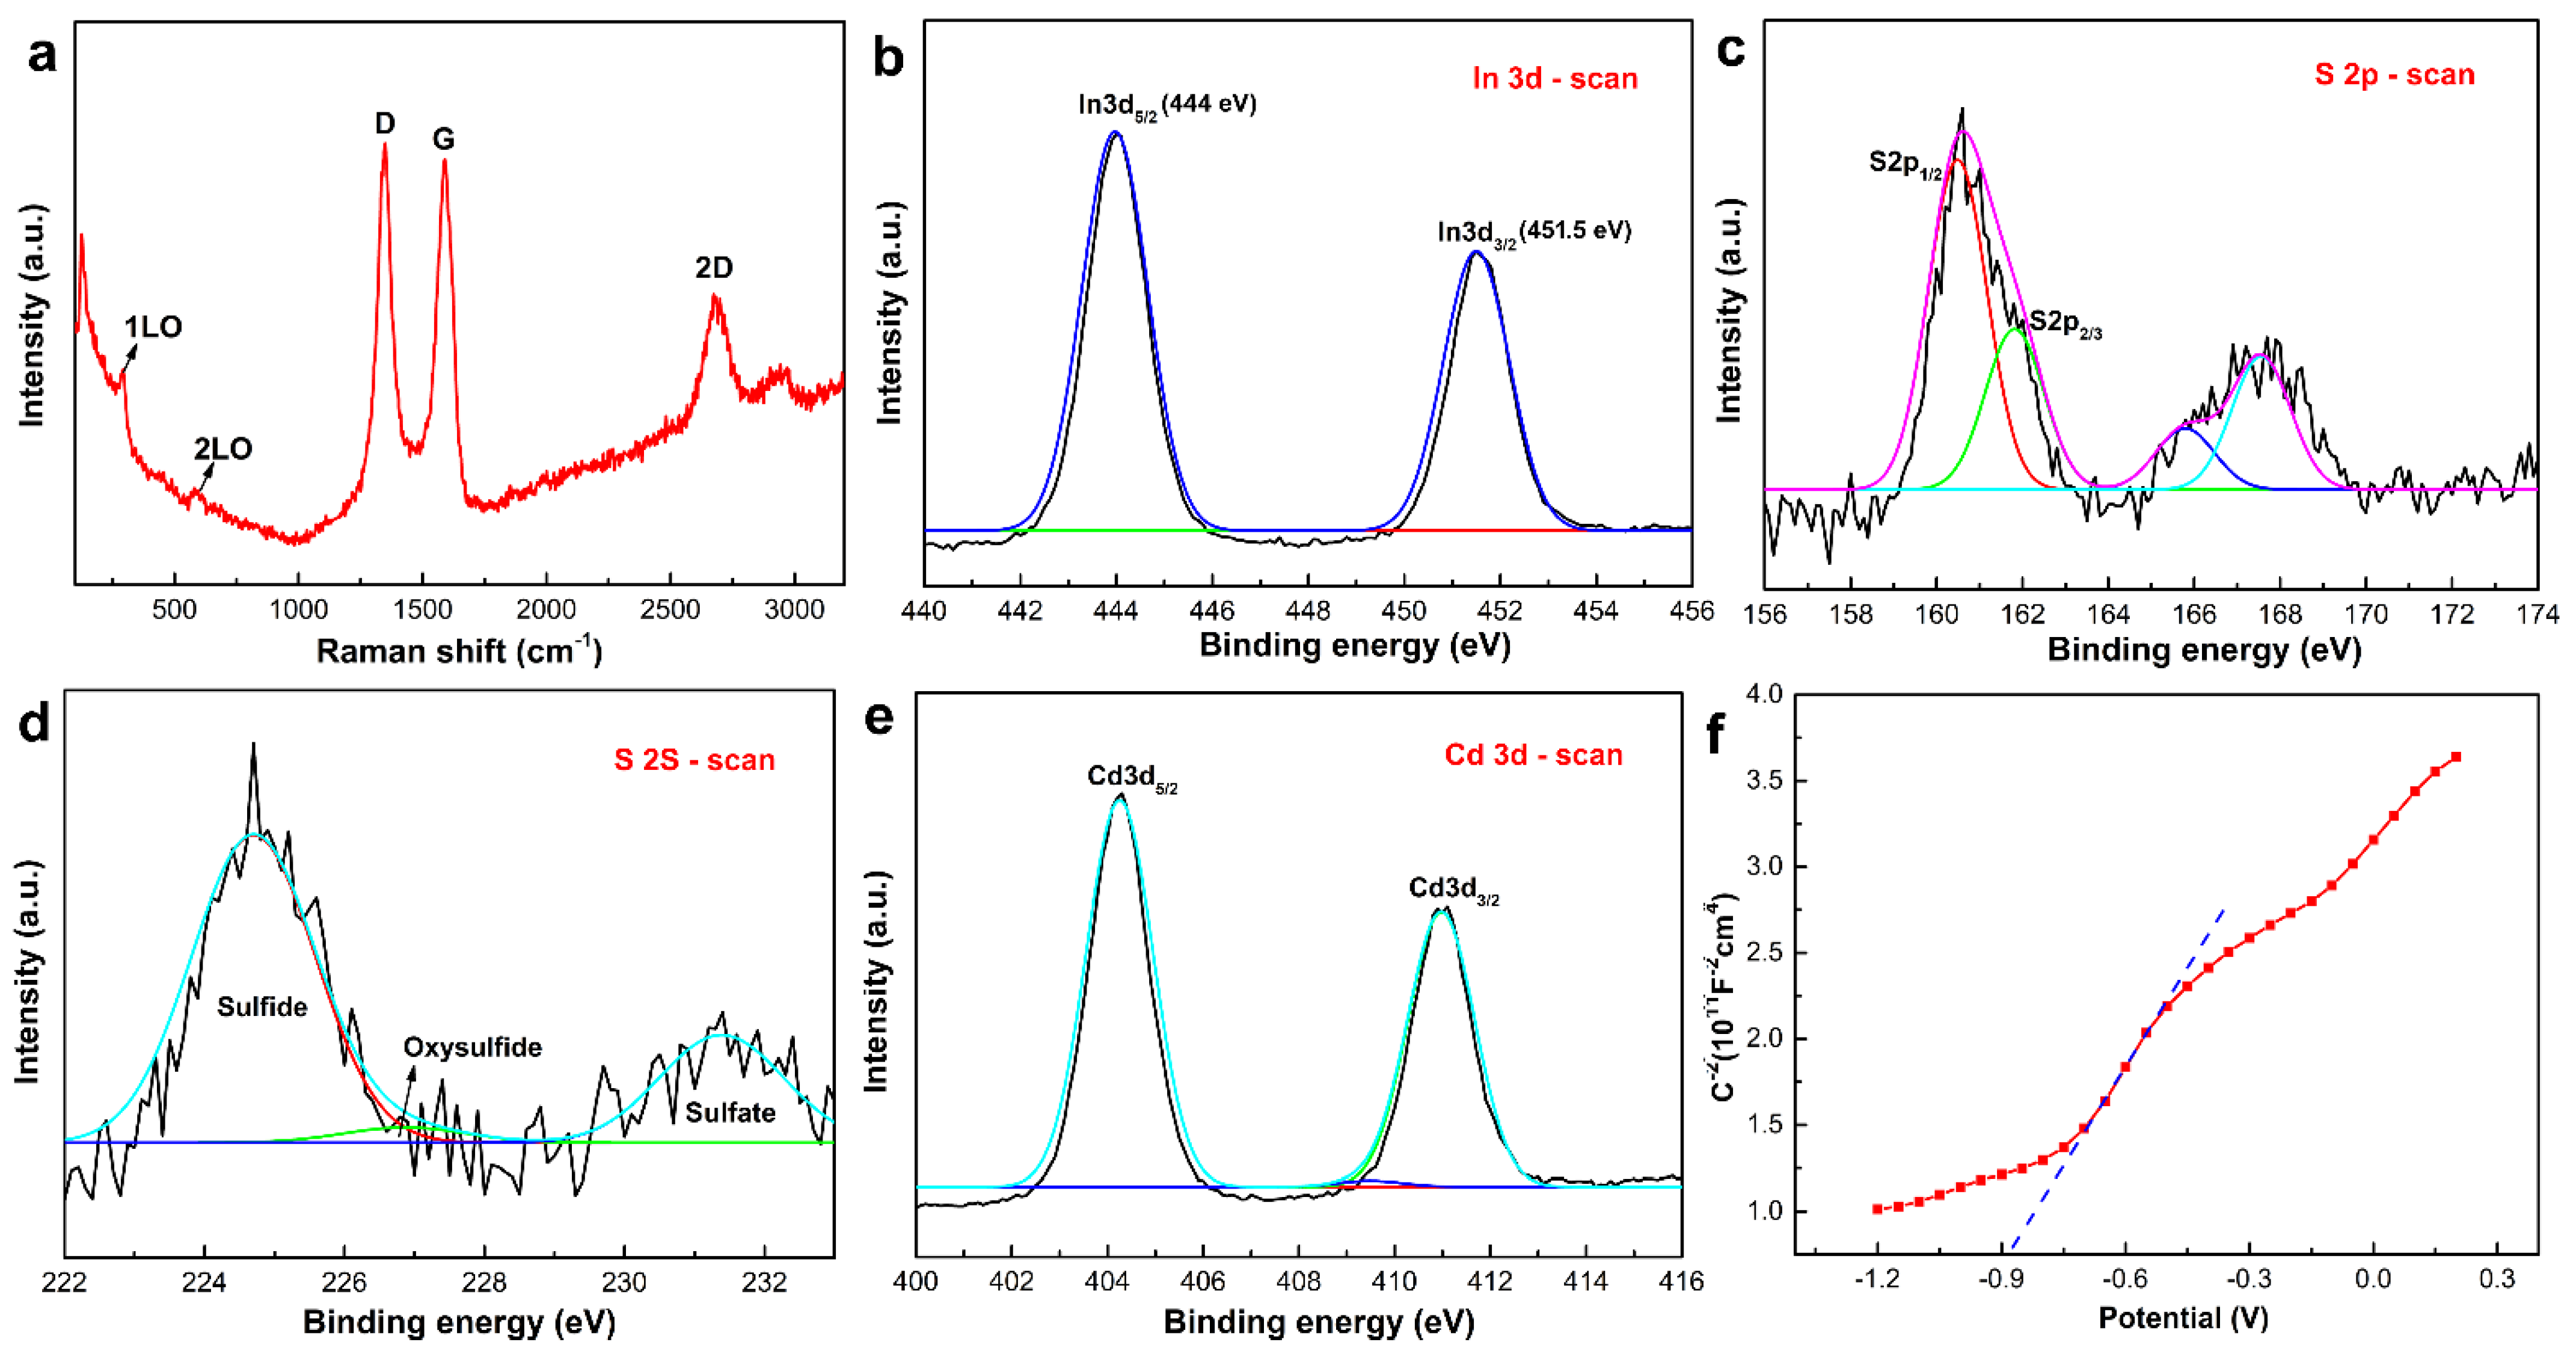
Additionally, XRD was applied to investigate the phase composition of the LIG-In-CdS nanocomposite synthesized by laser induction, as shown in Figure S6a. For comparison, the XRD patterns of LIG and LIG-CdS were also recorded. It is evident that all films exhibited typical diffraction peaks at ~28° and ~43° corresponding to the (002) and (100) crystal plane reflections of graphene [22]. However, no significant In- and CdS-related reflection peaks were observed in the LIG-In-CdS pattern, which may be ascribed to the CdS and In-CdS films being very thin [33]. Raman spectroscopy was used to verify the generation of CdS in the laser-induced LIG-In-CdS (Figure 4a), which not only showed three characteristic peaks of graphene at 1350 cm−1 (D band), 1585 cm−1 (G band), and 2700 cm−1 (2D band) but also possessed another two distinguishable bands of CdS located at around 295 cm−1 (1LO) and 594 cm−1 (2LO) [26]. Considering that the existing form of In has yet to be characterized, we resorted to XPS to study the valence state of elements in the as-synthesized In-CdS film. From the full-survey XPS spectra of LIG-In, LIG-CdS, and LIG-In-CdS (Figure S6b), the peaks of C 1s, O 1s, Cd 2d, S 2s, S 2p, and In 3d can be observed in the corresponding spectrum, confirming the presence of In in the In-CdS film. Peaks for In 3d5/2 and In 3d3/2 were observed at 444 eV and 451.5 eV (Figure 4b), respectively, and their energy difference was 7.5 eV, indicating that the In was in the +3 oxidation state and perhaps existed in the form of indium oxide [34,35]. Moreover, the appearance of S 2p1/2 and S 2p3/2 peaks of S2− in the S 2p scan spectrum (Figure 4c) and the emergence of a S2− peak at ca. 225 eV in the S 2s spectrum (Figure 4d), coupled with the coexistence of the Cd 3d peak (Figure 4e), demonstrated the successful generation of CdS [19]. In addition, the positive slope of the Mott–Schottky curve (Figure 4f) revealed that the LIG-In-CdS composite was an n-type semiconductor [36].
3.2. PEC Sensor Determination of Cu2+
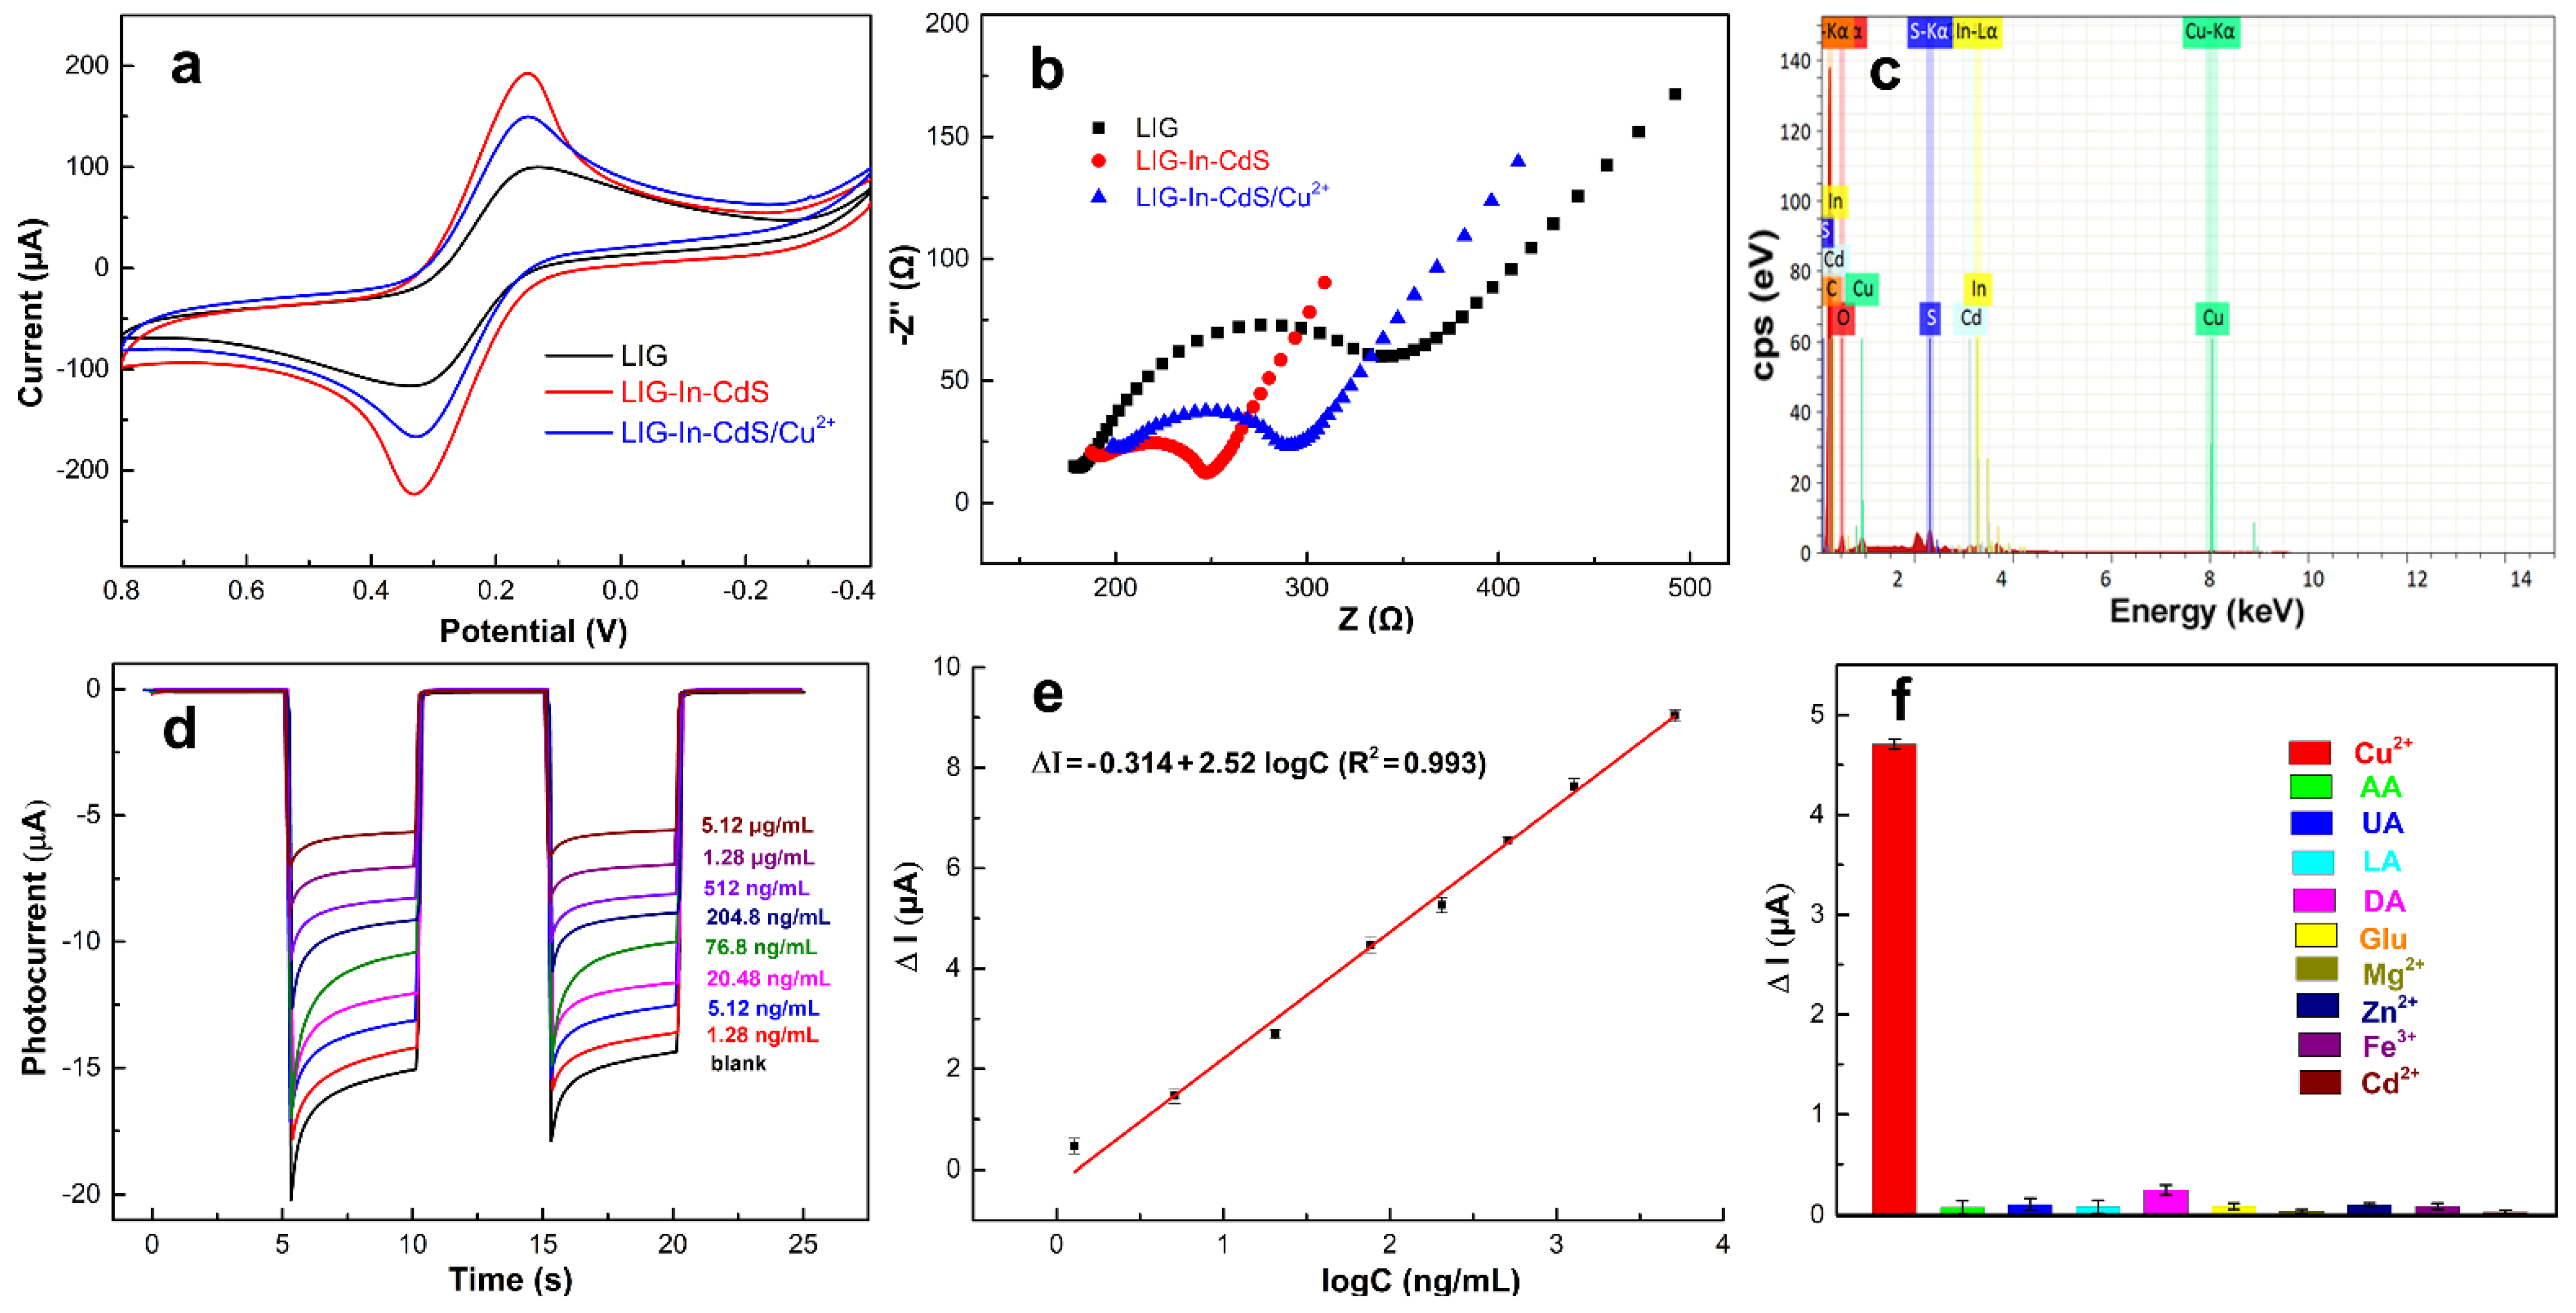
To track the stepwise modification process of the PEC sensor for Cu2+ detection, cyclic voltammetry (CV) and electrochemical impedance spectroscopy (EIS) characterization tests were carried out in 0.1 M KCl solution containing 5.0 mM [Fe(CN)6]3−/4−. As indicated in Figure 5a, the LIG electrode showed well-defined redox peaks of the [Fe(CN)6]3−/4− marker, demonstrating the good electron transfer capability of the laser-induced graphene. The redox peak currents increased and the peak-to-peak potential difference decreased as well after the modification of the LIG-In-CdS. This was because the LIG was formed by directly engraving the PI film, and the CS used to prepare the LIG-In-CdS contained many carbon atoms, which increased the conductivity and surface area of the LIG electrode after the laser sculpturing process [28]. Many studies have shown that the introduction of Cu2+ onto the CdS surface can lead to the formation of CuxS (x = 1, 2) since the solubility of CuS (Ksp = 6.3 × 10−36) or Cu2S (Ksp = 2.5 × 10−48) is much poorer than that of CdS (Ksp = 8 × 10⁻²⁷) [37,38]. The CuxS may act as a deep-level trap to facilitate the recombination of photoinduced carriers [1], so the current response of the LIG-In-CdS decreased after the absorption of Cu2+. The corresponding EIS test results (Figure 5b) were consistent with these CV results. In addition, the EDS spectrum shown in Figure 5c proved the existence of Cu on the LIG-In-CdS electrode (Figure S7). Hence, these results confirm that the PEC Cu2+ sensor was successfully fabricated. Then, the analytical performance of the developed method was measured in the presence of different concentrations of Cu2+, and the photocurrent density obtained at the open circuit potential decreased gradually as the Cu2+ concentration increased (Figure 5d). The photocurrent difference (ΔI) between the background and the Cu2+ showed a good linear relationship with the logarithm of the Cu2+ concentration (lgC) from 1.28 ng/mL to 5.12 μg/mL with a correlation equation of ΔI = −0.314 + 2.52 lgC (ng/mL) (Figure 5e). To achieve accurate detection of sweat Cu2+, AA, UA, LA, DA, Glu, Mg2+, Zn2+, Fe3+, and Cd2+, which are some of the interfering molecules and ions often present in sweat, were selected as interferents to examine the selectivity of the sensor. The obtained result (Figure 5e) reveals that the LIG-In-CdS electrode has a good anti-interference capability and is suitable for the detection of Cu2+ in real sweat samples.
3.3. Antifouling Test and Natural Sweat Cu2+ Detection
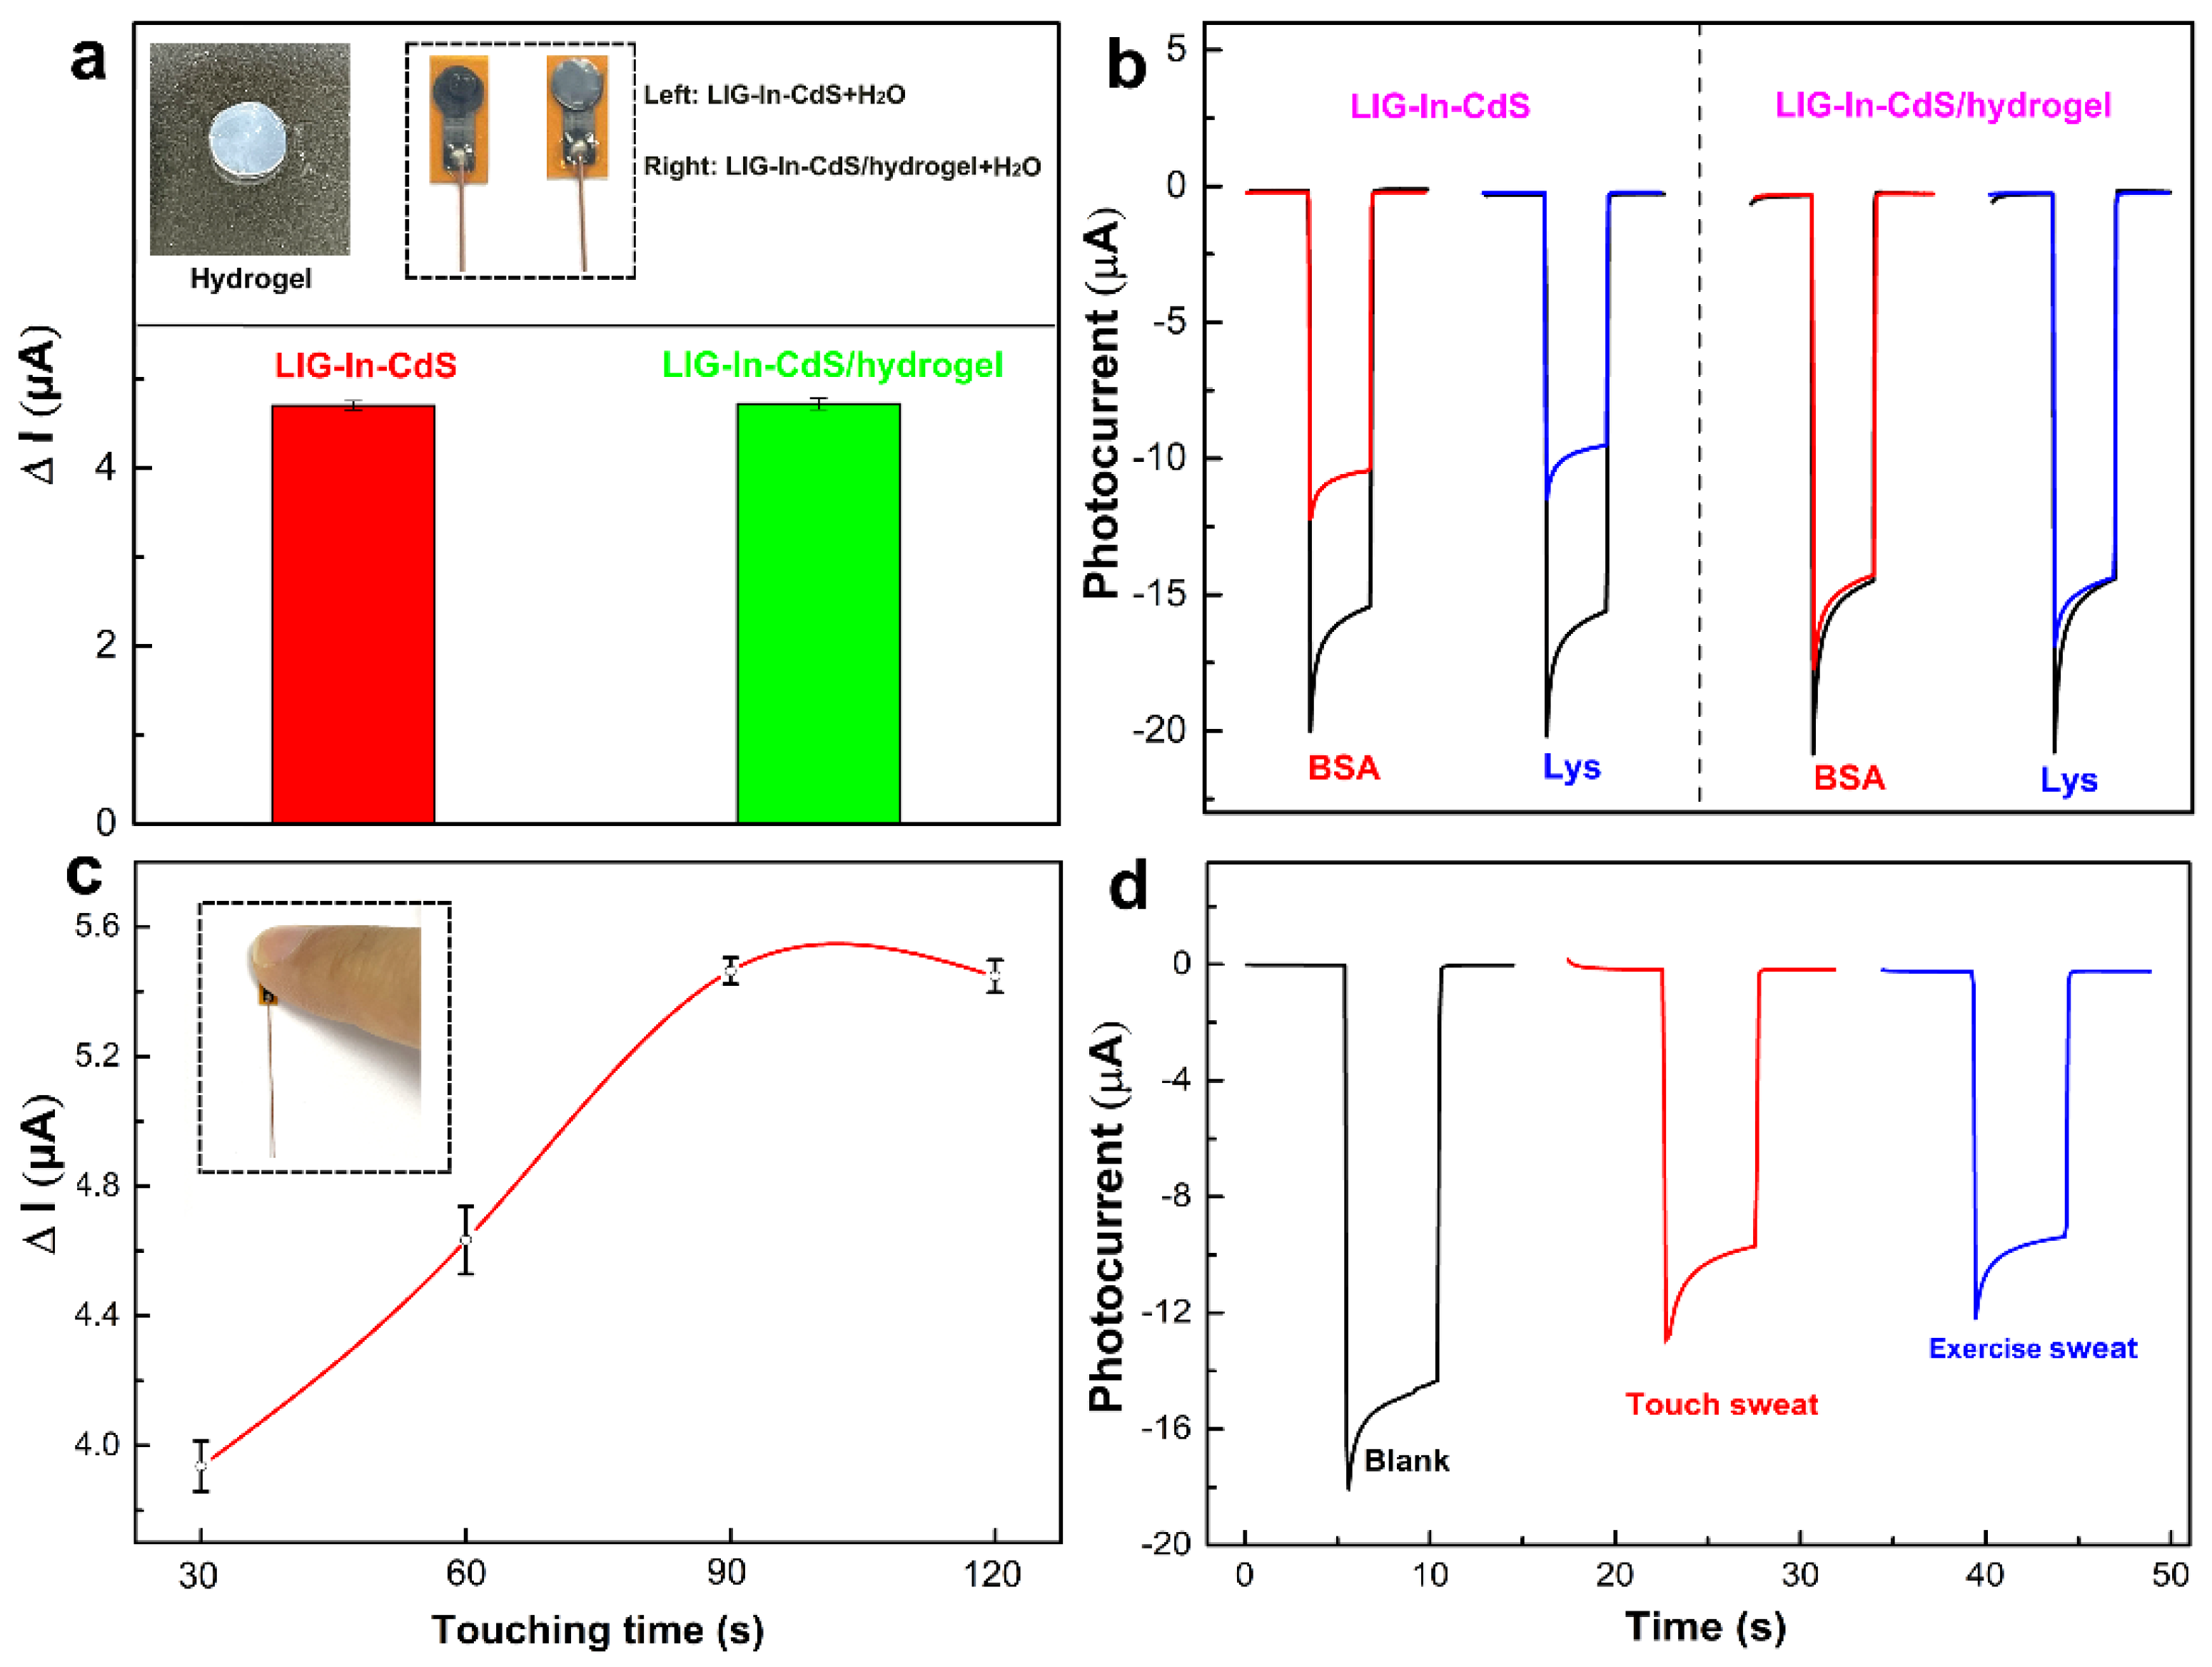
Sweat is a complex biological fluid that may cause photoelectrode passivation and thus affect the test results. The PVA hydrogel used in this study for natural sweat collection has been reported to have antifouling properties [39]. Therefore, we coated the LIG-In-CdS surface with the prepared hydrogel and dropped H2O droplets onto it, as illustrated in the inset of Figure 6a. The droplets were quasi-spherical on the LIG-In-CdS surface, while they tended to be flattened on the LIG-In-CdS/hydrogel substrate, which proved that the hydrogel had excellent hydrophilicity [40]. Additionally, the PVA hydrogel had little influence on the detection of Cu2+ by the fabricated sensor (Figure 6a) because Cu2+ can pass through the hydrogel and react with the LIG-In-CdS underneath. Then, we evaluated the antifouling ability of the hydrogel using a high concentration of proteins. The negligible photocurrent signal changes after incubation with 10 mg/mL BSA or 10 mg/mL Lys confirmed its outstanding antifouling performance (Figure 6b). In contrast, in the absence of the hydrogel, BSA and Lys had a significant influence on the photocurrent of the sensor. A tightly bound hydration layer can form on the hydrophilic PVA hydrogel when it is in contact with water, which acts as a physical and energetic barrier that resists the adsorption of fouling molecules [41]. This may account for the good fouling resistance of the hydrogel.
Fingers are suitable sites for natural sweat collection due to the high density of eccrine sweat glands (~400 glands cm−2) and the high sweat rates [8]. Moreover, the accurate detection of Cu2+ in human sweat is extremely critical for on-site and noninvasive assessment of Cu2+ abnormalities, because these abnormalities are closely associated with hematological, kidney, and cardiovascular diseases and Wilson’s disease [9]. Therefore, a touch-based fingertip sweat Cu2+ sensor was developed. Its sensing process consists of three steps: the collection of sweat by touching the PVA hydrogel membrane (covering the LIG-In-CdS sensor) (inset of Figure 6c); the reaction between the sweat Cu2+ and the LIG-In-CdS; and the detection of the photocurrent of the LIG-In-CdS/CuxS. As indicated in Figure 6c, the ΔI steadily increased upon increasing the touching time from 30 to 90 s and leveled off with longer touching times. Thus, the optimal touching time was determined to be 90 s. This short collection time is due to the ability of the hydrophilic porous PVA hydrogel to collect sweat [42,43]. The Cu2+ content in the touch sweat calculated from the photocurrent test results (Figure 6d) was 197 ng/mL, which is in agreement with the physiological values in sweat (100–1000 μg/L) reported in the literature [10]. Further, we also collected exercise sweat from the same subject and measured its Cu2+ concentration. The obtained result of 222 ng/mL was close to that in the natural touch sweat. Finally, a standard addition method was applied for exercise sweat Cu2+ quantification, as reported in Table 1. The good reliability of the developed method was successfully validated by the 98.1–102.9% recovery rates.
4. Conclusions
In this study, we successfully developed a PEC sensor for natural sweat Cu2+ monitoring without external stimulation of sweating. This sensor was constructed by integrating an LIG-In-CdS photoelectrode and a hydrophilic PVA hydrogel, which were prepared by a powerful laser engraving technique and a simple physical mixing and thermal crosslinking reaction method, respectively. Moreover, the laser engraving conditions, including the sulfur source, the Cys concentration, the doping element, and the concentration ratio of Cd and In, were optimized. As a result, the optimally fabricated LIG-In-CdS exhibited a high photocurrent and achieved highly sensitive and selective detection of Cu2+. Additionally, the PVA hydrogel displayed good antifouling activity and collected a sufficient amount of fingertip sweat in a short time. In addition, based on the “touch–incubate–detect” protocol, the fabricated sensor showed feasibility and good reliability for sweat Cu2+ analysis. The speed and simplicity of the touch-based fingertip sweat assay, and the elimination of sweat fouling, should lead to frequent self-testing of physiological Cu2+ levels and enhanced patient compliance, resulting in improved management of related diseases. To this end, further studies should be devoted to combining the constructed PEC sensor with near-field communication to achieve battery-free and wireless PEC sensing.
Supplementary Materials
The following supporting information can be downloaded at: https://0-www-mdpi-com.brum.beds.ac.uk/article/10.3390/chemosensors10050169/s1, Figure S1: Photo of the laser engraving machine; Figure S2: Images of the laser engraving process for the preparation of LIG-In-CdS; Figure S3: Optimization of the Cys concentration and the concentration ratio of Cd and In; Figure S4: SEM and TEM images of laser-induced electrodes; Figure S5: Elemental EDS mapping images of LIG-In and LIG-CdS; Figure S6: XRD patterns and XPS survey spectra of laser-induced electrodes; and Figure S7: Elemental EDS mapping images of LIG-In-CdS/Cu2+.
Author Contributions
Conceptualization, J.W.; methodology, S.Z. and Y.L.; validation, J.W., S.Z. and Y.L.; formal analysis, S.Z.; investigation, S.Z. and Y.L.; resources, J.W. and Z.L.; data curation, Y.L.; writing—original draft preparation, S.Z.; writing—review and editing, J.W. and Z.L.; visualization, J.W.; supervision, Z.L.; project administration, J.W.; funding acquisition, J.W. and Z.L. All authors have read and agreed to the published version of the manuscript.
Funding
This research was funded by the National Natural Science Foundation of China, grant number 22176052, and the Foundation for Creative Research Groups of Hubei Province of China, grant number 2020CFA035.
Institutional Review Board Statement
Not applicable.
Informed Consent Statement
Not applicable.
Data Availability Statement
The data presented in this study are available in the Supplementary Materials section.
Conflicts of Interest
The authors declare no conflict of interest. The funders had no role in the design of the study; in the collection, analyses, or interpretation of data; in the writing of the manuscript; or in the decision to publish the results.
References
- Wang, J.; Pan, Y.; Jiang, L.; Liu, M.; Liu, F.; Jia, M.; Li, J.; Lai, Y. Photoelectrochemical Determination of Cu2+ Using a WO3/CdS Heterojunction Photoanode. ACS Appl. Mater. Interface 2019, 11, 37541–37549. [Google Scholar] [CrossRef] [PubMed]
- Hui, X.; Sharifuzzaman, M.; Sharma, S.; Xuan, X.; Zhang, S.; Ko, S.G.; Yoon, S.H.; Park, J.Y. High-Performance Flexible Electrochemical Heavy Metal Sensor Based on Layer-by-Layer Assembly of Ti3C2Tx/MWNTs Nanocomposites for Noninvasive Detection of Copper and Zinc Ions in Human Biofluids. ACS Appl. Mater. Interface 2020, 12, 48928–48937. [Google Scholar] [CrossRef] [PubMed]
- Bariya, M.; Nyein, H.Y.Y.; Javey, A. Wearable sweat sensors. Nat. Electron. 2018, 1, 160–171. [Google Scholar] [CrossRef]
- Wei, X.; Zhu, M.; Li, J.; Liu, L.; Yu, J.; Li, Z.; Ding, B. Wearable biosensor for sensitive detection of uric acid in artificial sweat enabled by a fiber structured sensing interface. Nano Energy 2021, 85, 106031. [Google Scholar] [CrossRef]
- Nyein, H.Y.Y.; Bariya, M.; Tran, B.; Ahn, C.H.; Brown, B.J.; Ji, W.; Davis, N.; Javey, A. A wearable patch for continuous analysis of thermoregulatory sweat at rest. Nat. Commun. 2021, 12, 1823. [Google Scholar] [CrossRef] [PubMed]
- Bariya, M.; Li, L.; Ghattamaneni, R.; Ahn, C.H.; Nyein, H.Y.Y.; Tai, L.C.; Javey, A. Glove-based sensors for multimodal monitoring of natural sweat. Sci. Adv. 2020, 6, eabb8308. [Google Scholar] [CrossRef]
- Lin, S.; Wang, B.; Zhao, Y.; Shih, R.; Cheng, X.; Yu, W.; Hojaiji, H.; Lin, H.; Hoffman, C.; Ly, D.; et al. Natural Perspiration Sampling and in Situ Electrochemical Analysis with Hydrogel Micropatches for User-Identifiable and Wireless Chemo/Biosensing. ACS Sens. 2020, 5, 93–102. [Google Scholar] [CrossRef] [Green Version]
- Sempionatto, J.R.; Moon, J.-M.; Wang, J. Touch-Based Fingertip Blood-Free Reliable Glucose Monitoring: Personalized Data Processing for Predicting Blood Glucose Concentrations. ACS Sens. 2021, 6, 1875–1883. [Google Scholar] [CrossRef]
- Bagheri, N.; Mazzaracchio, V.; Cinti, S.; Colozza, N.; Di Natale, C.; Netti, P.A.; Saraji, M.; Roggero, S.; Moscone, D.; Arduini, F. Electroanalytical Sensor Based on Gold-Nanoparticle-Decorated Paper for Sensitive Detection of Copper Ions in Sweat and Serum. Anal. Chem. 2021, 93, 5225–5233. [Google Scholar] [CrossRef]
- Gao, W.; Nyein, H.Y.Y.; Shahpar, Z.; Fahad, H.M.; Chen, K.; Emaminejad, S.; Gao, Y.; Tai, L.-C.; Ota, H.; Wu, E.; et al. Wearable Microsensor Array for Multiplexed Heavy Metal Monitoring of Body Fluids. ACS Sens. 2016, 1, 866–874. [Google Scholar] [CrossRef] [Green Version]
- Jiang, C.; Wang, G.; Hein, R.; Liu, N.; Luo, X.; Davis, J.J. Antifouling Strategies for Selective In Vitro and In Vivo Sensing. Chem. Rev. 2020, 120, 3852–3889. [Google Scholar] [CrossRef] [PubMed]
- Lin, S.; Cheng, X.; Wang, B.; Yu, W.; Ly, D.; Emaminejad, S. A Fouling-Resistant Voltammetric Sensing System for Wearable Electroactive Biomarker Monitoring. J. Microelectromec. Syst. 2020, 29, 1059–1063. [Google Scholar] [CrossRef]
- Ghaffari, R.; Rogers, J.A.; Ray, T.R. Recent progress, challenges, and opportunities for wearable biochemical sensors for sweat analysis. Sens. Actuators B Chem. 2021, 332, 129447. [Google Scholar] [CrossRef] [PubMed]
- Wang, Z.; Shin, J.; Park, J.-H.; Lee, H.; Kim, D.-H.; Liu, H. Engineering Materials for Electrochemical Sweat Sensing. Adv. Funct. Mater. 2021, 31, 2008130. [Google Scholar] [CrossRef]
- Yang, Y.; Song, Y.; Bo, X.; Min, J.; Pak, O.S.; Zhu, L.; Wang, M.; Tu, J.; Kogan, A.; Zhang, H.; et al. A laser-engraved wearable sensor for sensitive detection of uric acid and tyrosine in sweat. Nat. Biotechnol. 2020, 38, 217–224. [Google Scholar] [CrossRef] [PubMed] [Green Version]
- Xu, Y.; Fei, Q.; Page, M.; Zhao, G.; Ling, Y.; Chen, D.; Yan, Z. Laser-induced graphene for bioelectronics and soft actuators. Nano Res. 2021, 14, 3033–3050. [Google Scholar] [CrossRef] [PubMed]
- Zhao, W.-W.; Xu, J.-J.; Chen, H.-Y. Photoelectrochemical aptasensing. TrAC Trends Anal. Chem. 2016, 82, 307–315. [Google Scholar] [CrossRef]
- Han, F.; Song, Z.; Nawaz, M.H.; Dai, M.; Han, D.; Han, L.; Fan, Y.; Xu, J.; Han, D.; Niu, L. MoS2/ZnO-Heterostructures-Based Label-Free, Visible-Light-Excited Photoelectrochemical Sensor for Sensitive and Selective Determination of Synthetic Antioxidant Propyl Gallate. Anal. Chem. 2019, 91, 10657–10662. [Google Scholar] [CrossRef]
- Ge, L.; Hong, Q.; Li, H.; Liu, C.; Li, F. Direct-Laser-Writing of Metal Sulfide-Graphene Nanocomposite Photoelectrode toward Sensitive Photoelectrochemical Sensing. Adv. Funct. Mater. 2019, 29, 1904000. [Google Scholar] [CrossRef]
- Ge, L.; Hong, Q.; Li, H.; Li, F. A laser-induced TiO2-decorated graphene photoelectrode for sensitive photoelectrochemical biosensing. Chem. Commun. 2019, 55, 4945–4948. [Google Scholar] [CrossRef]
- Zhao, Y.; Xiang, J.; Cheng, H.; Liu, X.; Li, F. Flexible photoelectrochemical biosensor for ultrasensitive microRNA detection based on concatenated multiplex signal amplification. Biosens. Bioelectron. 2021, 194, 113581. [Google Scholar] [CrossRef] [PubMed]
- Lan, L.; Le, X.; Dong, H.; Xie, J.; Ying, Y.; Ping, J. One-step and large-scale fabrication of flexible and wearable humidity sensor based on laser-induced graphene for real-time tracking of plant transpiration at bio-interface. Biosens. Bioelectron. 2020, 165, 112360. [Google Scholar] [CrossRef] [PubMed]
- Zhao, G.; Wang, X.; Liu, G.; Thi Dieu Thuy, N. A disposable and flexible electrochemical sensor for the sensitive detection of heavy metals based on a one-step laser-induced surface modification: A new strategy for the batch fabrication of sensors. Sens. Actuators B Chem. 2022, 350, 130834. [Google Scholar] [CrossRef]
- Basavarajappa, P.S.; Patil, S.B.; Ganganagappa, N.; Reddy, K.R.; Raghu, A.V.; Reddy, C.V. Recent progress in metal-doped TiO2, non-metal doped/codoped TiO2 and TiO2 nanostructured hybrids for enhanced photocatalysis. Int. J. Hydrog. Energy 2020, 45, 7764–7778. [Google Scholar] [CrossRef]
- Wang, L.; Xu, T.; He, X.; Zhang, X. Flexible, self-healable, adhesive and wearable hydrogel patch for colorimetric sweat detection. J. Mater. Chem. C 2021, 9, 14938–14945. [Google Scholar] [CrossRef]
- Li, H.; Xia, X.; Guo, C.; Ge, L.; Li, F. Laser-induced nano-bismuth decorated CdS–graphene hybrid for plasmon-enhanced photoelectrochemical analysis. Chem. Commun. 2020, 56, 13784–13787. [Google Scholar] [CrossRef]
- You, Z.; Qiu, Q.; Chen, H.; Feng, Y.; Wang, X.; Wang, Y.; Ying, Y. Laser-induced noble metal nanoparticle-graphene composites enabled flexible biosensor for pathogen detection. Biosens. Bioelectron. 2020, 150, 111896. [Google Scholar] [CrossRef]
- Samoson, K.; Soleh, A.; Saisahas, K.; Promsuwan, K.; Saichanapan, J.; Kanatharana, P.; Thavarungkul, P.; Chang, K.H.; Lim Abdullah, A.F.; Tayayuth, K.; et al. Facile fabrication of a flexible laser induced gold nanoparticle/chitosan/ porous graphene electrode for uric acid detection. Talanta 2022, 243, 123319. [Google Scholar] [CrossRef]
- Guo, C.; Tian, K.; Wang, L.; Liang, F.; Wang, F.; Chen, D.; Ning, J.; Zhong, Y.; Hu, Y. Approach of fermi level and electron-trap level in cadmium sulfide nanorods via molybdenum doping with enhanced carrier separation for boosted photocatalytic hydrogen production. J. Colloid Interface Sci. 2021, 583, 661–671. [Google Scholar] [CrossRef]
- Shi, R.; Ye, H.-F.; Liang, F.; Wang, Z.; Li, K.; Weng, Y.; Lin, Z.; Fu, W.-F.; Che, C.-M.; Chen, Y. Interstitial P-Doped CdS with Long-Lived Photogenerated Electrons for Photocatalytic Water Splitting without Sacrificial Agents. Adv. Mater. 2018, 30, 1705941. [Google Scholar] [CrossRef]
- Chauhan, R.; Kumar, A.; Chaudhary, R.P. Synthesis, structural and photocatalytic studies of Mn-doped CdS nanoparticles. Res. Chem. Intermediat. 2013, 39, 645–657. [Google Scholar] [CrossRef]
- Yang, F.; Yan, N.-N.; Huang, S.; Sun, Q.; Zhang, L.-Z.; Yu, Y. Zn-Doped CdS Nanoarchitectures Prepared by Hydrothermal Synthesis: Mechanism for Enhanced Photocatalytic Activity and Stability under Visible Light. J. Phys.Chem. C 2012, 116, 9078–9084. [Google Scholar] [CrossRef]
- Wu, C.; Jiang, C.; Wang, X.; Ding, H.; Ju, H.; Zhang, L.; Chen, T.; Zhu, C. Interfacial Engineering by Indium-Doped CdS for High Efficiency Solution Processed Sb2(S1–xSex)3 Solar Cells. ACS Appl. Mater. Interface 2019, 11, 3207–3213. [Google Scholar] [CrossRef] [PubMed]
- Kumaravel, V.; Rhatigan, S.; Mathew, S.; Bartlett, J.; Nolan, M.; Hinder, S.J.; Sharma, P.K.; Singh, A.; Byrne, J.A.; Harrison, J.; et al. Indium-Doped TiO2 Photocatalysts with High-Temperature Anatase Stability. J. Phys. Chem. C 2019, 123, 21083–21096. [Google Scholar] [CrossRef]
- Shaheera, M.; Girija, K.G.; Kaur, M.; Geetha, V.; Debnath, A.K.; Vatsa, R.K.; Muthe, K.P.; Gadkari, S.C. Characterization and device application of indium doped ZnO homojunction prepared by RF magnetron sputtering. Opt. Mater. 2020, 101, 109723. [Google Scholar] [CrossRef]
- Liu, Y.; Zhong, L.; Zhang, S.; Wang, J.; Liu, Z. An ultrasensitive and wearable photoelectrochemical sensor for unbiased and accurate monitoring of sweat glucose. Sens. Actuators B Chem. 2022, 354, 131204. [Google Scholar] [CrossRef]
- Tang, J.; Li, J.; Zhang, Y.; Kong, B.; Yiliguma; Wang, Y.; Quan, Y.; Cheng, H.; Al-Enizi, A.M.; Gong, X.; et al. Mesoporous Fe2O3–CdS Heterostructures for Real-Time Photoelectrochemical Dynamic Probing of Cu2+. Anal. Chem. 2015, 87, 6703–6708. [Google Scholar] [CrossRef]
- Ibrahim, I.; Lim, H.N.; Huang, N.M.; Jiang, Z.-T.; Altarawneh, M. Selective and sensitive visible-light-prompt photoelectrochemical sensor of Cu2+ based on CdS nanorods modified with Au and graphene quantum dots. J. Hazard. Mater. 2020, 391, 122248. [Google Scholar] [CrossRef]
- Sakarkar, S.; Muthukumaran, S.; Jegatheesan, V. Tailoring the Effects of Titanium Dioxide (TiO2) and Polyvinyl Alcohol (PVA) in the Separation and Antifouling Performance of Thin-Film Composite Polyvinylidene Fluoride (PVDF) Membrane. Membranes 2021, 11, 241. [Google Scholar] [CrossRef]
- He, X.; Xu, T.; Gao, W.; Xu, L.-P.; Pan, T.; Zhang, X. Flexible Superwettable Tapes for On-Site Detection of Heavy Metals. Anal. Chem. 2018, 90, 14105–14110. [Google Scholar] [CrossRef] [Green Version]
- Zhu, L.; Zhong, L.; Wang, J.; Tang, Y.; Liu, Z. An Antifouling Photoelectrochemical Ultramicrosensor for Unbiased Single-Cell Analysis. Chin. J. Chem. 2022, 40, 500–506. [Google Scholar] [CrossRef]
- Ganguly, A.; Lin, K.C.; Muthukumar, S.; Prasad, S. Autonomous, Real-Time Monitoring Electrochemical Aptasensor for Circadian Tracking of Cortisol Hormone in Sub-microliter Volumes of Passively Eluted Human Sweat. ACS Sens. 2021, 6, 63–72. [Google Scholar] [CrossRef] [PubMed]
- Moon, J.-M.; Teymourian, H.; Paz, E.D.l.; Sempionatto, J.R.; Mahato, K.; Sonsa-ard, T.; Huang, N.; Longardner, K.; Litvan, I.; Wang, J. Non-invasive Sweat-based Tracking of L-Dopa Pharmacokinetic Profiles Following an Oral Tablet Administration. Angew. Chem. 2021, 60, 19074–19078. [Google Scholar] [CrossRef] [PubMed]
Figure 1.
Schematic illustration of the laser engraving fabrication process of a PEC sensor for natural sweat Cu2+ detection.
Figure 1.
Schematic illustration of the laser engraving fabrication process of a PEC sensor for natural sweat Cu2+ detection.

Figure 2.
Comparison of the photocurrents of CdS produced by using different polymers (a) or different sulfur sources (b, CS as the polymer) in laser engraving. (c) Optimization of doped elements for laser-induced CdS photoelectrodes (CS as the polymer, Cys as the sulfur source). The cadmium source for PES was 20 mM Cd(acac)2; PES itself acted as the sulfur source. All other cadmium sources were 20 mM CdCl2 and all other sulfur sources had a concentration of 30 mM.

Figure 3.
SEM images of (a) the surface and (d) the cross-section; (b) a TEM image; and (c) elemental (C, O, S, Cd, and In) EDS mapping images of the fabricated LIG-In-CdS electrode. The inset of (a) is the enlarged image.
Figure 3.
SEM images of (a) the surface and (d) the cross-section; (b) a TEM image; and (c) elemental (C, O, S, Cd, and In) EDS mapping images of the fabricated LIG-In-CdS electrode. The inset of (a) is the enlarged image.

Figure 4.
(a) Raman spectrum and (f) Mott–Schottky curve of LIG-In-CdS. XPS spectra of LIG-In-CdS: (b) In 3d; (c) S 2p; (d) S 2s; and (e) Cd 3d.
Figure 4.
(a) Raman spectrum and (f) Mott–Schottky curve of LIG-In-CdS. XPS spectra of LIG-In-CdS: (b) In 3d; (c) S 2p; (d) S 2s; and (e) Cd 3d.

Figure 5.
(a) Cyclic voltammetry curves and (b) Nyquist plots of LIG, LIG-In-CdS, and LIG-In-CdS/Cu2+ in 0.1 M KCl/5.0 mM [Fe(CN)6]3−/4− solution. (c) EDS spectrum of LIG-In-CdS/Cu2+. (d) Photocurrent responses and (e) calibration plot for Cu2+ detection by the fabricated PEC sensor. (f) The selectivity evaluation of the fabricated sensor. Error bars = standard deviation (n = 3).

Figure 6.
(a) Comparison of the results of detection of 100 ng/mL Cu2+ by LIG-In-CdS before and after incubation with hydrogel. Inset: photos of the PVA hydrogel and behaviors of two H2O droplets on the LIG-In-CdS and LIG-In-CdS/hydrogel substrates. (b) Comparison of the photocurrent responses of the LIG-In-CdS and LIG-In-CdS/hydrogel substrates before (black curve) and after being incubated with 10 mg/mL BSA (red curve) or 10 mg/mL Lys (blue curve) for 10 min. (c) Optimization of the touching time for the fingertip on the LIG-In-CdS/hydrogel substrate in the Cu2+ sensing procedure. The inset is the corresponding picture of the fingertip touching the substrate. (d) The photocurrent responses of the LIG-In-CdS/hydrogel substrate to Cu2+ in touch sweat and exercise sweat.


Table 1.
Recovery experiment on Cu2+ in exercise sweat samples.
| Sample | Added (ng/mL) | Found (ng/mL) | Recovery (%) |
|---|---|---|---|
| Exercise sweat | 0 | 222 | / |
| 50 | 280 | 102.9 | |
| 200 | 414 | 98.1 |
Publisher’s Note: MDPI stays neutral with regard to jurisdictional claims in published maps and institutional affiliations. |
© 2022 by the authors. Licensee MDPI, Basel, Switzerland. This article is an open access article distributed under the terms and conditions of the Creative Commons Attribution (CC BY) license (https://creativecommons.org/licenses/by/4.0/).
Share and Cite
MDPI and ACS Style
Zhang, S.; Liu, Y.; Wang, J.; Liu, Z. A Laser-Induced Photoelectrochemical Sensor for Natural Sweat Cu2+ Detection. Chemosensors 2022, 10, 169. https://0-doi-org.brum.beds.ac.uk/10.3390/chemosensors10050169
AMA Style
Zhang S, Liu Y, Wang J, Liu Z. A Laser-Induced Photoelectrochemical Sensor for Natural Sweat Cu2+ Detection. Chemosensors. 2022; 10(5):169. https://0-doi-org.brum.beds.ac.uk/10.3390/chemosensors10050169
Chicago/Turabian StyleZhang, Shubo, Yanwen Liu, Juan Wang, and Zhihong Liu. 2022. "A Laser-Induced Photoelectrochemical Sensor for Natural Sweat Cu2+ Detection" Chemosensors 10, no. 5: 169. https://0-doi-org.brum.beds.ac.uk/10.3390/chemosensors10050169
Note that from the first issue of 2016, this journal uses article numbers instead of page numbers. See further details here.