Article

Photoluminescence Sensing of Chloride Ions in Sea Sand Using Alcohol-Dispersed CsPbBr3@SiO2 Perovskite Nanocrystal Composites

1
Department of Civil Engineering and Architecture, Wuyi University, Wuyishan 354300, China
2
Department of Chemistry and the MOE Key Laboratory of Spectrochemical Analysis & Instrumentation, College of Chemistry and Chemical Engineering, Xiamen University, Xiamen 361000, China
3
College of Chemistry, Chemical Engineering and Environment, Minnan Normal University, Zhangzhou 363000, China
*
Author to whom correspondence should be addressed.
These authors contributed equally to this work.
Submission received: 11 April 2022 / Revised: 27 April 2022 / Accepted: 29 April 2022 / Published: 2 May 2022
(This article belongs to the Special Issue Feature Papers on Luminescent Sensing)

Abstract

:
In this study, CsPbBr3@SiO2 perovskite nanocrystal composites (CsPbBr3@SiO2 PNCCs) were synthesized by a benzyl bromide nucleophilic substitution strategy. Homogeneous halide exchange between CsPbBr3@SiO2 PNCCs and Cl solution (aqueous phase) was applied to the determination of Cl in sea sand samples. Fast halide exchange with Cl in the aqueous phase without any magnetic stirring or pH regulation resulted in the blue shift of the photoluminescence (PL) wavelength and vivid PL color changes from green to blue. The results show that the PL sensing of Cl in aqueous samples could be implemented by using the halide exchange of CsPbBr3@SiO2 PNCCs. A linear relationship between the PL wavelength shift and the Cl concentration in the range of 0 to 3.0% was found, which was applied to the determination of Cl concentration in sea sand samples. This method greatly simplifies the detection process and provides a new idea for further broadening PL sensing using the CsPbBr3 PNC halide.

1. Introduction

Due to environmental protection, the mining of river sand is restricted, which results in the shortage of river sand resources for buildings. The replacement of sea sand necessitates the use of river sand. However, sea sand without suitable treatment causes serious problems for the durability of reinforced concrete structures due to the high concentration of chloride ions (Cl). The durability of concrete in coastal or offshore areas is mainly caused by Cl erosion, which may be widespread in a relatively large area. The occurrence of chlorinated sand is generally associated with two situations: one is that chlorinated sea sand is inadequately cleaned and is then used in the mixing of concrete, and the second is that some rivers are polluted by seawater due to seawater backflow. In this case, a certain amount of river sand exceeding the standard of Cl enters the commercial market. Research results show that the possibility and harm of reinforcement corrosion increase with the increase in Cl content in concrete. When the concentration of Cl exceeds the critical concentration (generally considered to be 0.6 kg/m3), corrosion occurs in the presence of water and oxygen.
The titration of a potassium chromate indicator with silver nitrate has been commonly regarded as a typical titration method for the determination of Cl according to the Chinese National Standard (GB/T 14684-2011) for construction sand [1]. When potassium chromate reacts with silver nitrate, silver chromate appears with a brick-red color, but the color changes to white as soon as Cl is added. There have been many instrumental methods for the determination of Cl in aqueous samples, such as high-performance liquid chromatography [2], ion chromatography [3], capillary electrophoresis [4], the electrochemical method [5], the fluorescence method [6] and the colorimetric detection method [7]. However, sophisticated scientific instruments with complicated data-collecting and -processing systems are required, and thus, high costs and the requirement for a professional operator severely limit their usage.
Although selective electrodes can be applied for the inexpensive and convenient sensing of Cl in some samples, such as human serum [8,9], the response sensitivity and long-term stability of the electrochemical sensing material should be thoroughly considered. Based on the situation, fluorescence-sensing methods can be reasonably considered. At present, fluorescence-sensing methods for Cl mainly include fluorescence on and quenching approaches. In 2020, Zhang et al. [10] synthesized 5, 10, 15, 20-tetra (4-hydroxyphenyl) porphyrin (THPP) and coordinated it with Ag+ to form a THPP-Ag complex. This complex has a strong binding ability to Cl and can be used for Cl fluorescence sensing with a detection limit of 7.5 μM Cl. This sensing approach has been successfully applied to in vitro and in vivo bioimaging. Based on the strong interaction between silver (Ag+) and Cl, a Ag+-benzimidazole complex (Ag+-FBI) was used by Kim et al. [6] to develop a fluorescence sensor for the quantitative determination of Cl in human sweat. The fluorescence intensity of the Ag+-FBI complex increased in the presence of Cl⁻, with a detection limit of 19 μM and a response time of less than 3 min. The Ag+-FBI complex showed high selectivity for Cl⁻ ions in a wide pH range from pH 6 to pH 9. In 2021, Tutol et al. [11] reported a fluorescence on-type sensing approach for the determination of Cl⁻ in detergent and E. coli using a single point mutation of the fluorescent protein. The single point mutation replaces the chromophore counter-ion with valine, creating a binding site for Cl⁻. The binding of Cl⁻ adjusts the pKa of chromophores to a protonated fluorescence state and responds to the pH change.
In addition, several fluorescence-quenching-based Cl⁻ sensing approaches have been reported in recent years. For example, in 2006, Schazmann et al. [12] developed a 1, 3-alternating tetra-substituted calix arene-based neutral 2-chloride compound, whose fluorescence could be quenched due to the conformational change during Cl⁻ coordination. It is highly selective for Cl⁻ sensing, with a detection limit of 8 × 10⁻⁶ M, and the response time is less than 3 s. In 2014, a fluorescence-sensing approach based on the substitution of N-acylhydrazone for Bodipy–mercury (II) was proposed by Madhu et al. [13]. BODIPYs 1 and 2 specifically recognize Hg2+ and form 1-Hg2+ and 2-Hg2+ complexes, respectively, and lead to fluorescence quenching. After Cl ions were added to the complexes, fluorescence was restored by extracting mercury (II) ions from the complexes, which reveals high selectivity and specificity under physiological conditions, with a detection limit of 108 nM. In 2015, Bazany-Rodriguez et al. [14] reported a fluorescent dicationic compound for Cl sensing in water. Chloride quenches blue fluorescence and forms a very stable complex. This approach revealed good selectivity for other co-existing anions, with a detection limit of 33 mol L−1. In 2017, Kim et al. [15] proposed a fluorescence-quenching sensing approach using citrate-based material, which realized the low-cost and automatic detection of Cl in sweat. In addition, the fluorescent material also has higher selective characteristics and can be applied under different pH conditions.
In PL intensity-ratio-based optical sensing, in 2010, Riedinger et al. [16] developed a novel approach for Cl sensing using an organic fluorophore (chlorine-sensitive fluorophore, amino-MQAE) and a reference fluorophore (cresol violet)–gold nanoparticle hybrid. The fluorescence quenching of amino-MQAE in the presence of Cl can be observed by changing the distance between amino-MQAE and Au NP surfaces with polyethylene glycol (PEG) spacers. In 2020, Ding et al. [17] reported a nanosensor for Cl based on the ratio of PL lifetimes. In their study, the luminescent ruthenium dye [Ru(1,10-phenanthroline)3] was added to the interior of silica nanoparticles, and the external surface was labeled with a fluorescent dye (N,N′-bis-(carboxypropyl)-9,9′-biacridine), which is sensitive towards Cl. The surface was further functionalized with a positively charged amino group, and a good linear relationship between the response and Cl concentrations from 0 to 200 mM was realized, with the ratio signal varying from 140.9 to 40.2. The proposed method can be used to detect the chloride concentration in cells.
Lead halide perovskites (LHPs) have become smart materials because of their excellent characteristics in photovoltaic and photoelectric fields. For example, in solar cells, the energy conversion efficiency has soared from 3% to 27% in the last 20 years. Recently, lead halide perovskite nanocrystals (LHP NCs) have received great attention for their outstanding photoluminescence (PL) performance, wide color gamut [18], adjustable emission wavelength [19], large defect tolerance [20], high fluorescence quantum yield [21] and unique electrical properties of bipolar transport [22]. These advantages enable LHP NCs to be used in light-emitting diodes, low-threshold lasers, X-ray scintillators and single-photon emitters. Generally, in AMX3-type LHPs, the A-position is an amine cation such as methylamine, formamidine or Cs+, the B-position is Pb2+, and the X bit is Cl, Br or I [23]. The energy level structure of LHPs is a key factor affecting its photoelectric performance, which is mainly composed of B and X sites [24]. The valence band of LHPs is hybridized by the NP orbital of the halogen and the 6 s orbital of Pb, while the conduction band is mainly determined by the 6p orbital of Pb, where the np orbital of the halogen contributes less. Thus, by changing halogens with different np orbital energy levels (Cl 3p, Br 4p and I 5p), the band gap of LHPs can be easily adjusted to convert the halogens from chlorine atoms to iodine atoms, and the light emitted by the resulting LHPs can be converted from near-ultraviolet to near-infrared light. Introducing different proportions of halide species to occupy the X position can flexibly adjust the band gap of the resulting LHPs, thus continuously adjusting the emission spectrum to extend to the entire visible range [25]. For example, CsPbCl3 NCs with a particle size of 12 nm produce blue light emission (~450 nm), CsPbBr3 NCs with a particle size of 20 nm emit green light (~520 nm), and CsPbI3 NCs with a particle size of 40–50 nm yield red light (~690 nm). In contrast, the cations at the A position do not play a significant role in the emission wavelength shift of LHPs; for example, the substituent MA+ can achieve a smaller red shift in the emission spectrum of CsPbBr3 [26].
Recently, there have been several reports on the studies and applications of colorimetric sensing based on the wavelength shift of the halogen exchange characteristics of CsPbX3 NCs. Different halide ions resulted in the variational emission characteristics of the test paper, and 8 μM of fluorine ions, 75 μM of chloride ions and 2 μM of iodide ions in water could be detected. CsPbX3 NCs in transparent nanoporous glass (NPG) were obtained by Ye et al. [27] using a solution immersion method. The prepared material revealed a stimulus-sensing response by changing color in deionized water and non-aqueous solution containing Br. They found that the residual Cl in NPG nanopores during the preparation of blank NPG played an important role in the sensing response behavior and long-term water resistance. The residual Cl ions are responsible for the stimulus conversion of the composite material color from green or red to blue. Even when immersed in water for several months, the composite glass still yielded blue emission due to the protection of Cl, and the emission could be restored in non-aqueous solution to a green color after treatment with Br. Sandeep et al. developed paper-substrate-immobilized CsPbBr3 NCs and used the paper substrate to detect fluorine ions, chloride ions and iodide ions in water [28]. Three approaches for the determination of Cl using CsPbBr3 NCs were proposed by Mishra et al. [29], including the direct addition of the Cl sample solution to CsPbBr3 NCs, a drop of the Cl sample solution onto a glass substrate with deposited CsPbBr3 NCs, and a drop of CsPbBr3 NCs onto a strip pre-soaked in the Cl sample solution. In these procedures, the blue shift of their fluorescence spectra could be observed due to the rapid anion exchange between CsPbBr3 NCs and Cl, and the detection limit was 100 μM. More recently, Chen et al. [30] investigated the heterogeneous halide exchange between CsPbBr3 PNCs (n-hexane, organic phase) and NaCl solutions (aqueous phase). The results show that CsPbBr3 PNCs could achieve fast halide exchanges with Cl of NaCl in the aqueous phase, accompanying a significant wavelength blue shift and vivid fluorescence color changes. The Cl concentration in sweet samples could be determined with a detection limit of 3 mmol/L.
In this study, we developed an efficient synthesis approach to fabricate CsPbBr3@SiO2 perovskite nanocrystal composites (CsPbBr3@SiO2 PNCCs) in 10 min with the help of a nucleophilic substitution strategy using benzylic bromide. Compared with CsPbBr3 PNCs, CsPbBr3@SiO2 PNCCs revealed better stability towards the alcohol polarity and can stably disperse in ethanol. In addition, the homogeneous halogen exchange process of NaCl solution (water)–CsPbBr3@SiO2 PNCCs (ethanol) was observed and investigated in the study. In sensing experiments, it was found that the halogen exchange between Cl and CsPbBr3@SiO2 PNCCs could be realized without any pH modifications to the sensing medium or magnetic stirring, which is conducive to the efficient determination of Cl and reveals its simplicity and convenience compared with heterogeneous halogen exchange between Cl and CsPbBr3 NCs in water–organic phases [30]. The detection limit of 0.05 mg/mL for this approach meets the requirement that the Cl content in the highest class of construction sand should generally be lower than 0.1 mg/g. This approach was applied to the fluorescence sensing of Cl in sea sand samples.

2. Materials and Methods

2.1. Materials and Chemicals

Octadecene (ODE, 90%), lead stearate (PbSTR, 99.9%), Cs2CO3 (99.9%) and 3-aminopropyl triethoxysilane (APTES, 98%) were purchased from Shanghai Aladdin Reagent Co., Ltd., Shanghai, China. ODE was dried for 1 h in a vacuum at 120 °C for purification. 1,3,5-Tris (bromomethyl) benzene (TBB) was obtained from Shanghai Anergy Reagent Co., Ltd., Shanghai, China. Other chemicals were used directly without further purification.
A standard Cl solution with a concentration of l000 μg/mL was purchased from Beijing Zhongke Quality Inspection Biotechnology Co. Ltd., Beijing, China. Each different concentration of Cl solution was prepared by diluting the standard solution with pure water and used on the same day.

2.2. Instruments

The diffuse reflectance spectra of CsPbBr3@SiO2 PNCCs were characterized by a near-infrared/UV/visible spectrophotometer (Varian Cary 5000, Cary, NC, USA). Fluorescence spectra were collected by an F-7100 fluorescence spectrophotometer (Hitachi, Tokyo, Japan). An excitation wavelength of 365 nm was used. A 1.5 nm slit for excitation and a 5.5 nm slit for emission were selected. An excitation wavelength of 365 nm was selected, and a typical excitation spectrum at 1.92% (330 mmol/L) Cl is shown in Figure S1. The absolute fluorescence quantum yields (PLQYs) were measured using an FS5 fluorescence spectrophotometer (Edinburgh, UK) loaded with a 150 W xenon lamp with a light source of 106 cps. In the PLQY measurement, the excitation slit was set at 0.8 nm, and the emission slit was 0.5 nm. The fluorescence quantum yields were measured and calculated by integrating sphere. The fluorescence lifetimes were characterized by an FLS 980 spectrometer using a 397 nm laser (Edinburgh, UK) and 1 cm quartz cuvette. The crystal structures of products were characterized by Ultima IV X-ray Diffractometer (Rigaku, Tokyo, Japan) with an operating voltage of 40 kV and a current of 15 mA. Infrared spectra of CsPbBr3@SiO2 PNCCs were collected by a Nicolet IS5 Fourier Transform Infrared Spectrometer (Symerfeld, New York, USA). The surface chemical composition of CsPbBr3@SiO2 PNCCs was characterized by X-ray photoelectron spectroscopy (XPS, PHI Quantum 2000 Scanning ESCA Microprobe). Tecnai F30 transmission electron microscopy (TEM), high-resolution transmission electron microscopy (HRTEM), and energy-dispersive X-ray spectroscopy (EDX, Philipps-FEI, Netherlands, with an acceleration voltage of 300 kV) were used to analyze the morphology of CsPbBr3@SiO2 PNCCs.

2.3. Preparation of CsPbBr3@SiO2 PNCCs

To a 25 mL three-neck flask, 5 mL of ODE, 210 μL of APTES, 0.016 g of Cs2CO3, 0.0387 g of PbSTR and 0.071 g of TBB were successively added, stirred vigorously at 2500 rpm and heated rapidly to 120 °C in natural air. The product was cooled using ice water. The primary product with yellow-green color was washed using a mixed solvent of ethyl acetate and n-hexane (Vethyl acetate/Vn-hexane = 3:1) and was then centrifuged at 10,000 rpm for 10 min. The product of CsPbBr3@SiO2 PNCCs at the bottom was collected and dried in vacuum at 60 °C for use.

2.4. Sensing and Sample Preparation

Samples of 15 mg of CsPbBr3@SiO2 PNCCs were accurately weighed and added to 30 mL of anhydrous ethanol for ultrasonic dispersion. A 1 mL sample of the above-mentioned CsPbBr3@SiO2 PNCC ethanol solution was taken; 5 μL of NaCl solution with different concentrations (17.55–29.83 mg/g) was added and reacted for 15 min, and 365 nm was used as excitation light. Fluorescence spectra of CsPbBr3@SiO2 PNCCs before and after halogen exchange were collected by F-7100 fluorometer, and the fluorescence discoloration was observed under a 365 nm UV lamp.
About 500 g of each sand sample was obtained from a sea beach or construction site. Before being weighed, the sand samples were dried at 105 °C for 60 min. Then, 10.00 g of the dried sand sample was weighed and then put into a 25 mL flask with 10 mL of deionized water. The filtrate was collected and stored after ultrasonic extraction for 30 min. For the measurement, 10 μL of sample filtrate was directly added to CsPbBr3@SiO2 PNCC ethanol solution without prior treatment. The other measurement steps were the same as above.

3. Results and Discussion

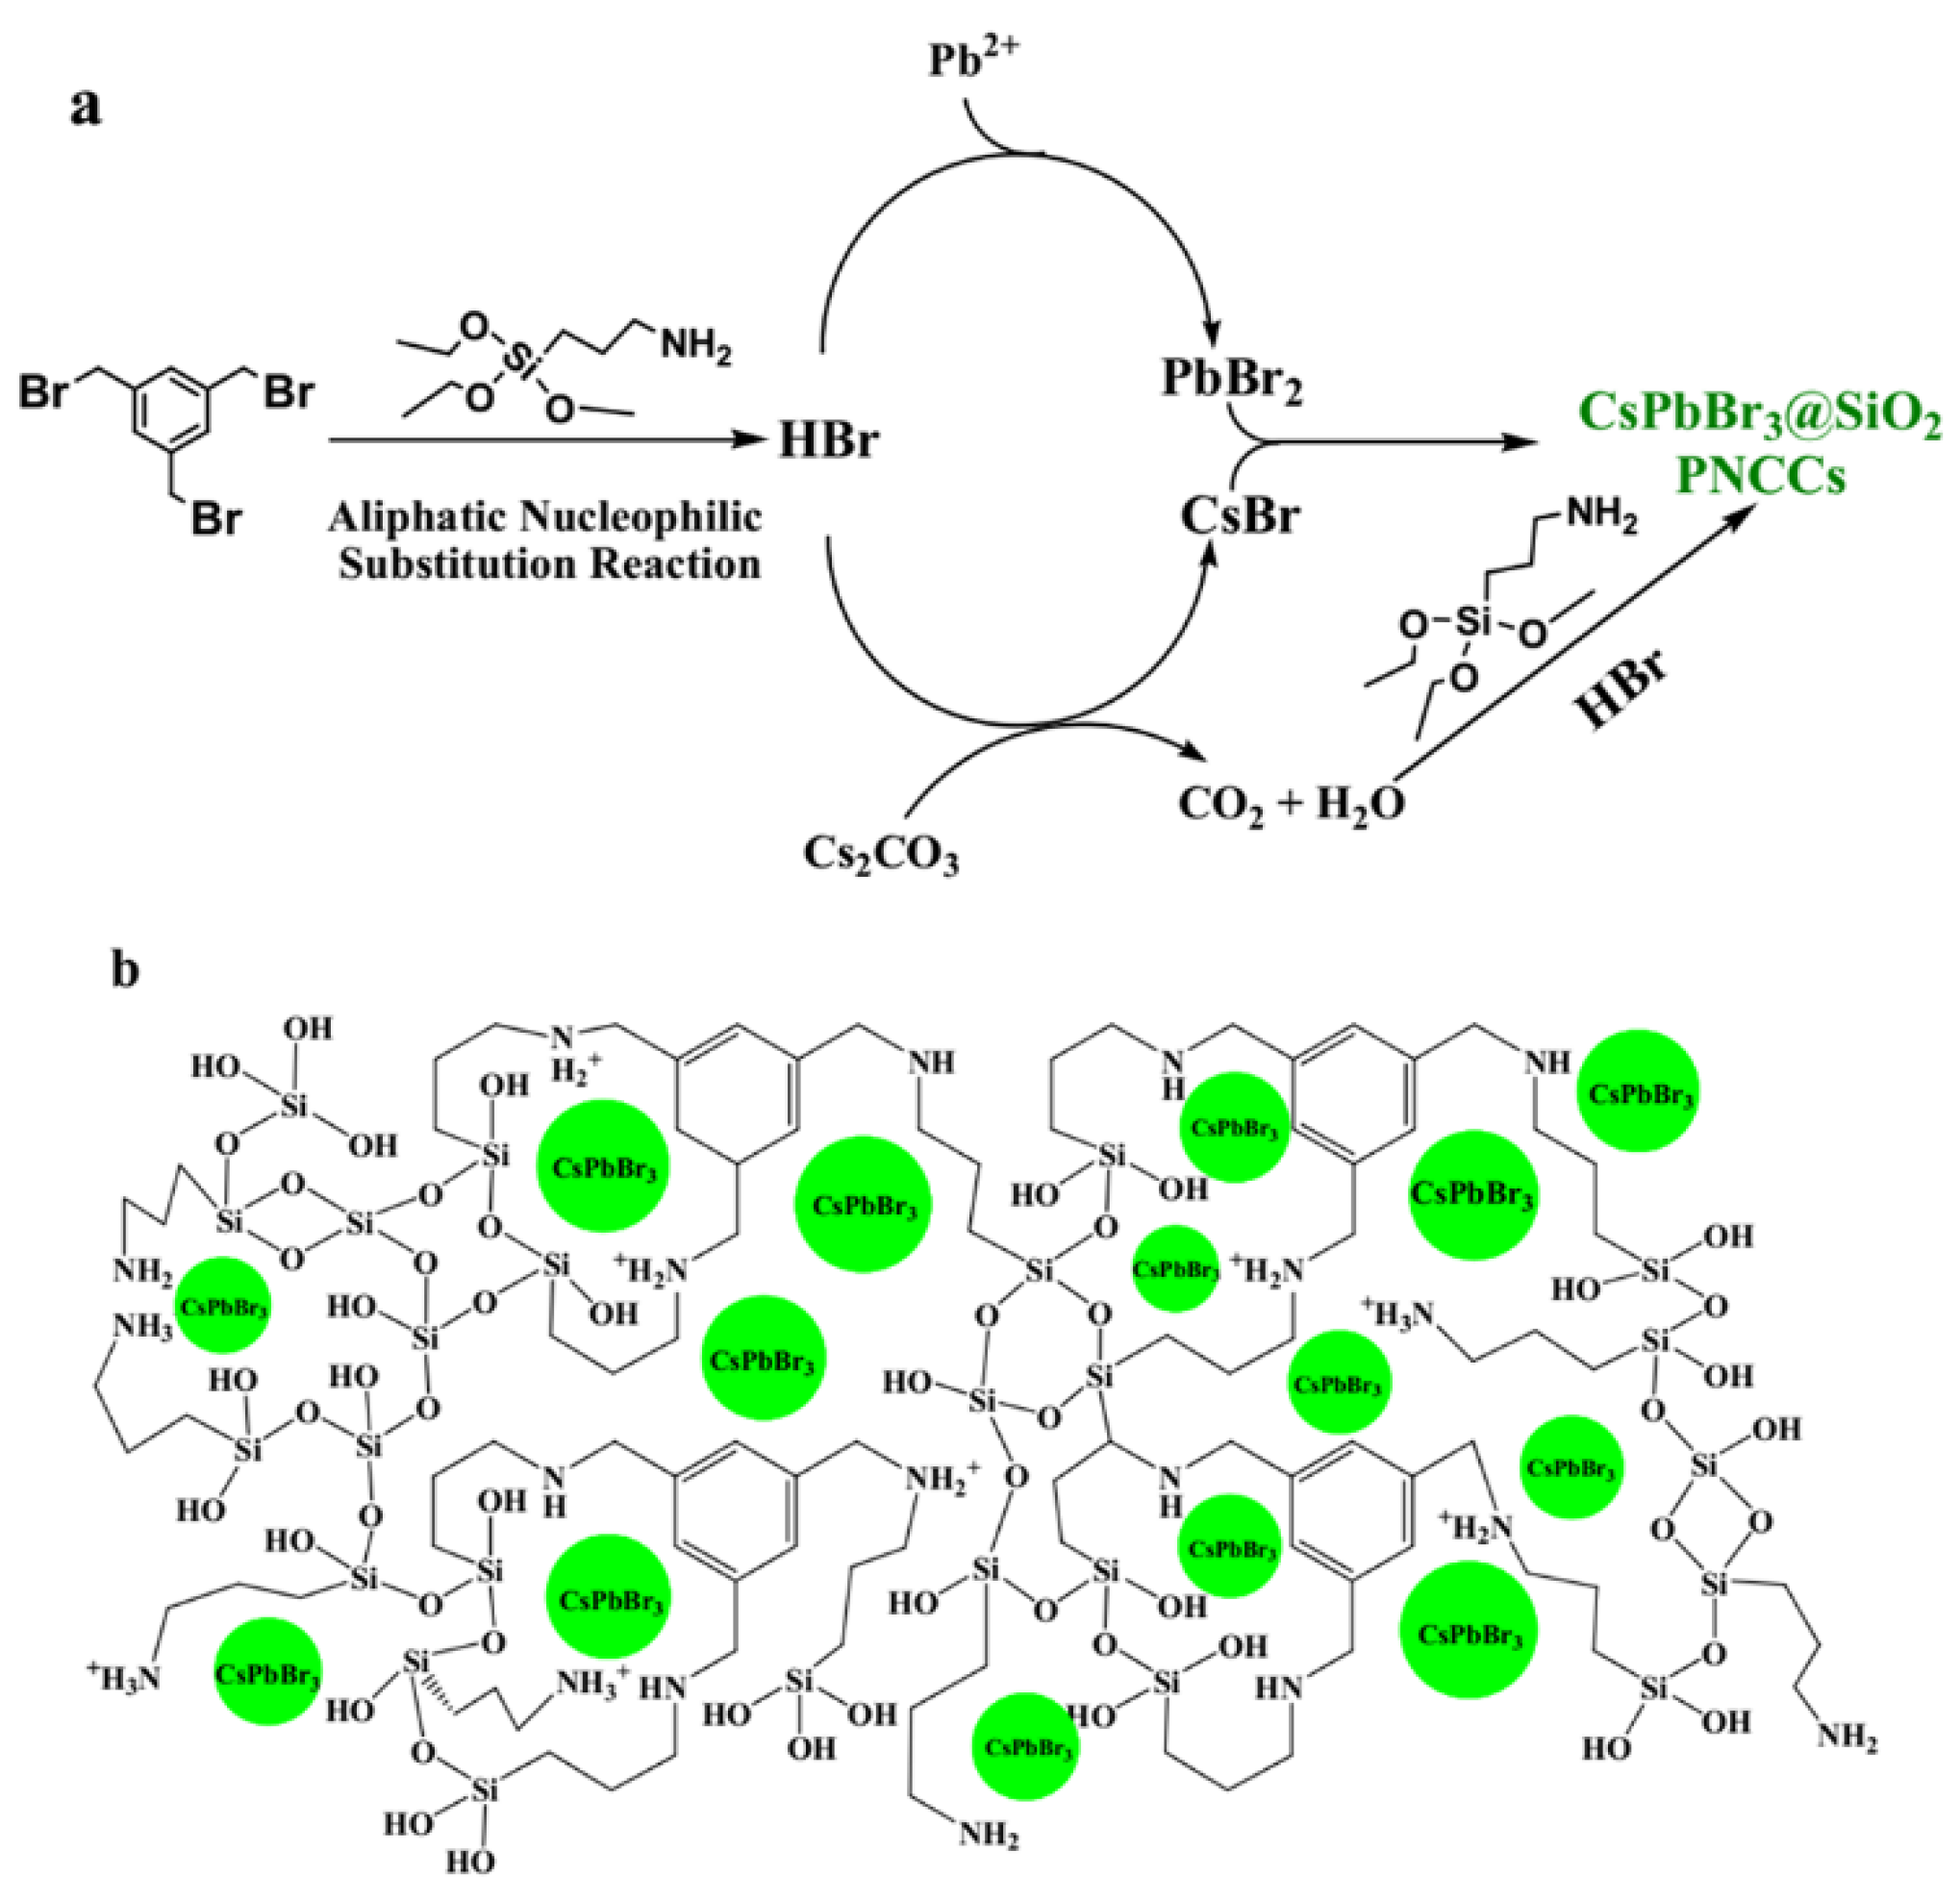
3.1. Synthesis of CsPbBr3@SiO2 PNCCs Based on TBB Nucleophilic Substitution

The synthesis of CsPbBr3@SiO2 PNCCs was set up as shown in Figure 1. TBB first underwent a nucleophilic substitution reaction with APTES under heating conditions, and the generated HBr reacted with the acid-binding agent Cs2CO3, producing CsBr, CO2 and H2O. In the meantime, it reacted with PbSTR to yield PbBr2. CsPbBr3 PNCs could be produced by the reaction between CsBr and PbBr2, while APTES reacted with H2O to generate SiO2 under the catalysis of HBr, by which the one-step synthesis of CsPbBr3@SiO2 PNCCs could be realized. As shown by the structural formula in Figure 1b, the imine bond generated by the reaction of TBB with APTES and the products of the unreacted NH2 with HBr, as well as the unreacted NH2 of APTES, can be taken as the anchor sites of CsPbBr3 PNCs on the surface of SiO2 [31,32]. The anchor sites play a key role in the passivation of the CsPbBr3 PNC surface and in improving its stability.
For the synthesis of CsPbBr3 PNCs coated by SiO2, the whole synthesis process can be carried out in an open system at 120 °C and completed within 10 min. By simply mixing the solvent, all of the precursors and the ligand reagents, strong luminescent CsPbBr3 PNCs@SiO2 PNCCs can be obtained. In addition, the released amount of H2O in the synthesis can be regulated by Cs2CO3. Compared with the previous method of diffusion hydrolysis of H2O in the air, the method is more efficient and controllable, which helps to improve the quality of the CsPbBr3@SiO2 PNCCs for sensing applications.

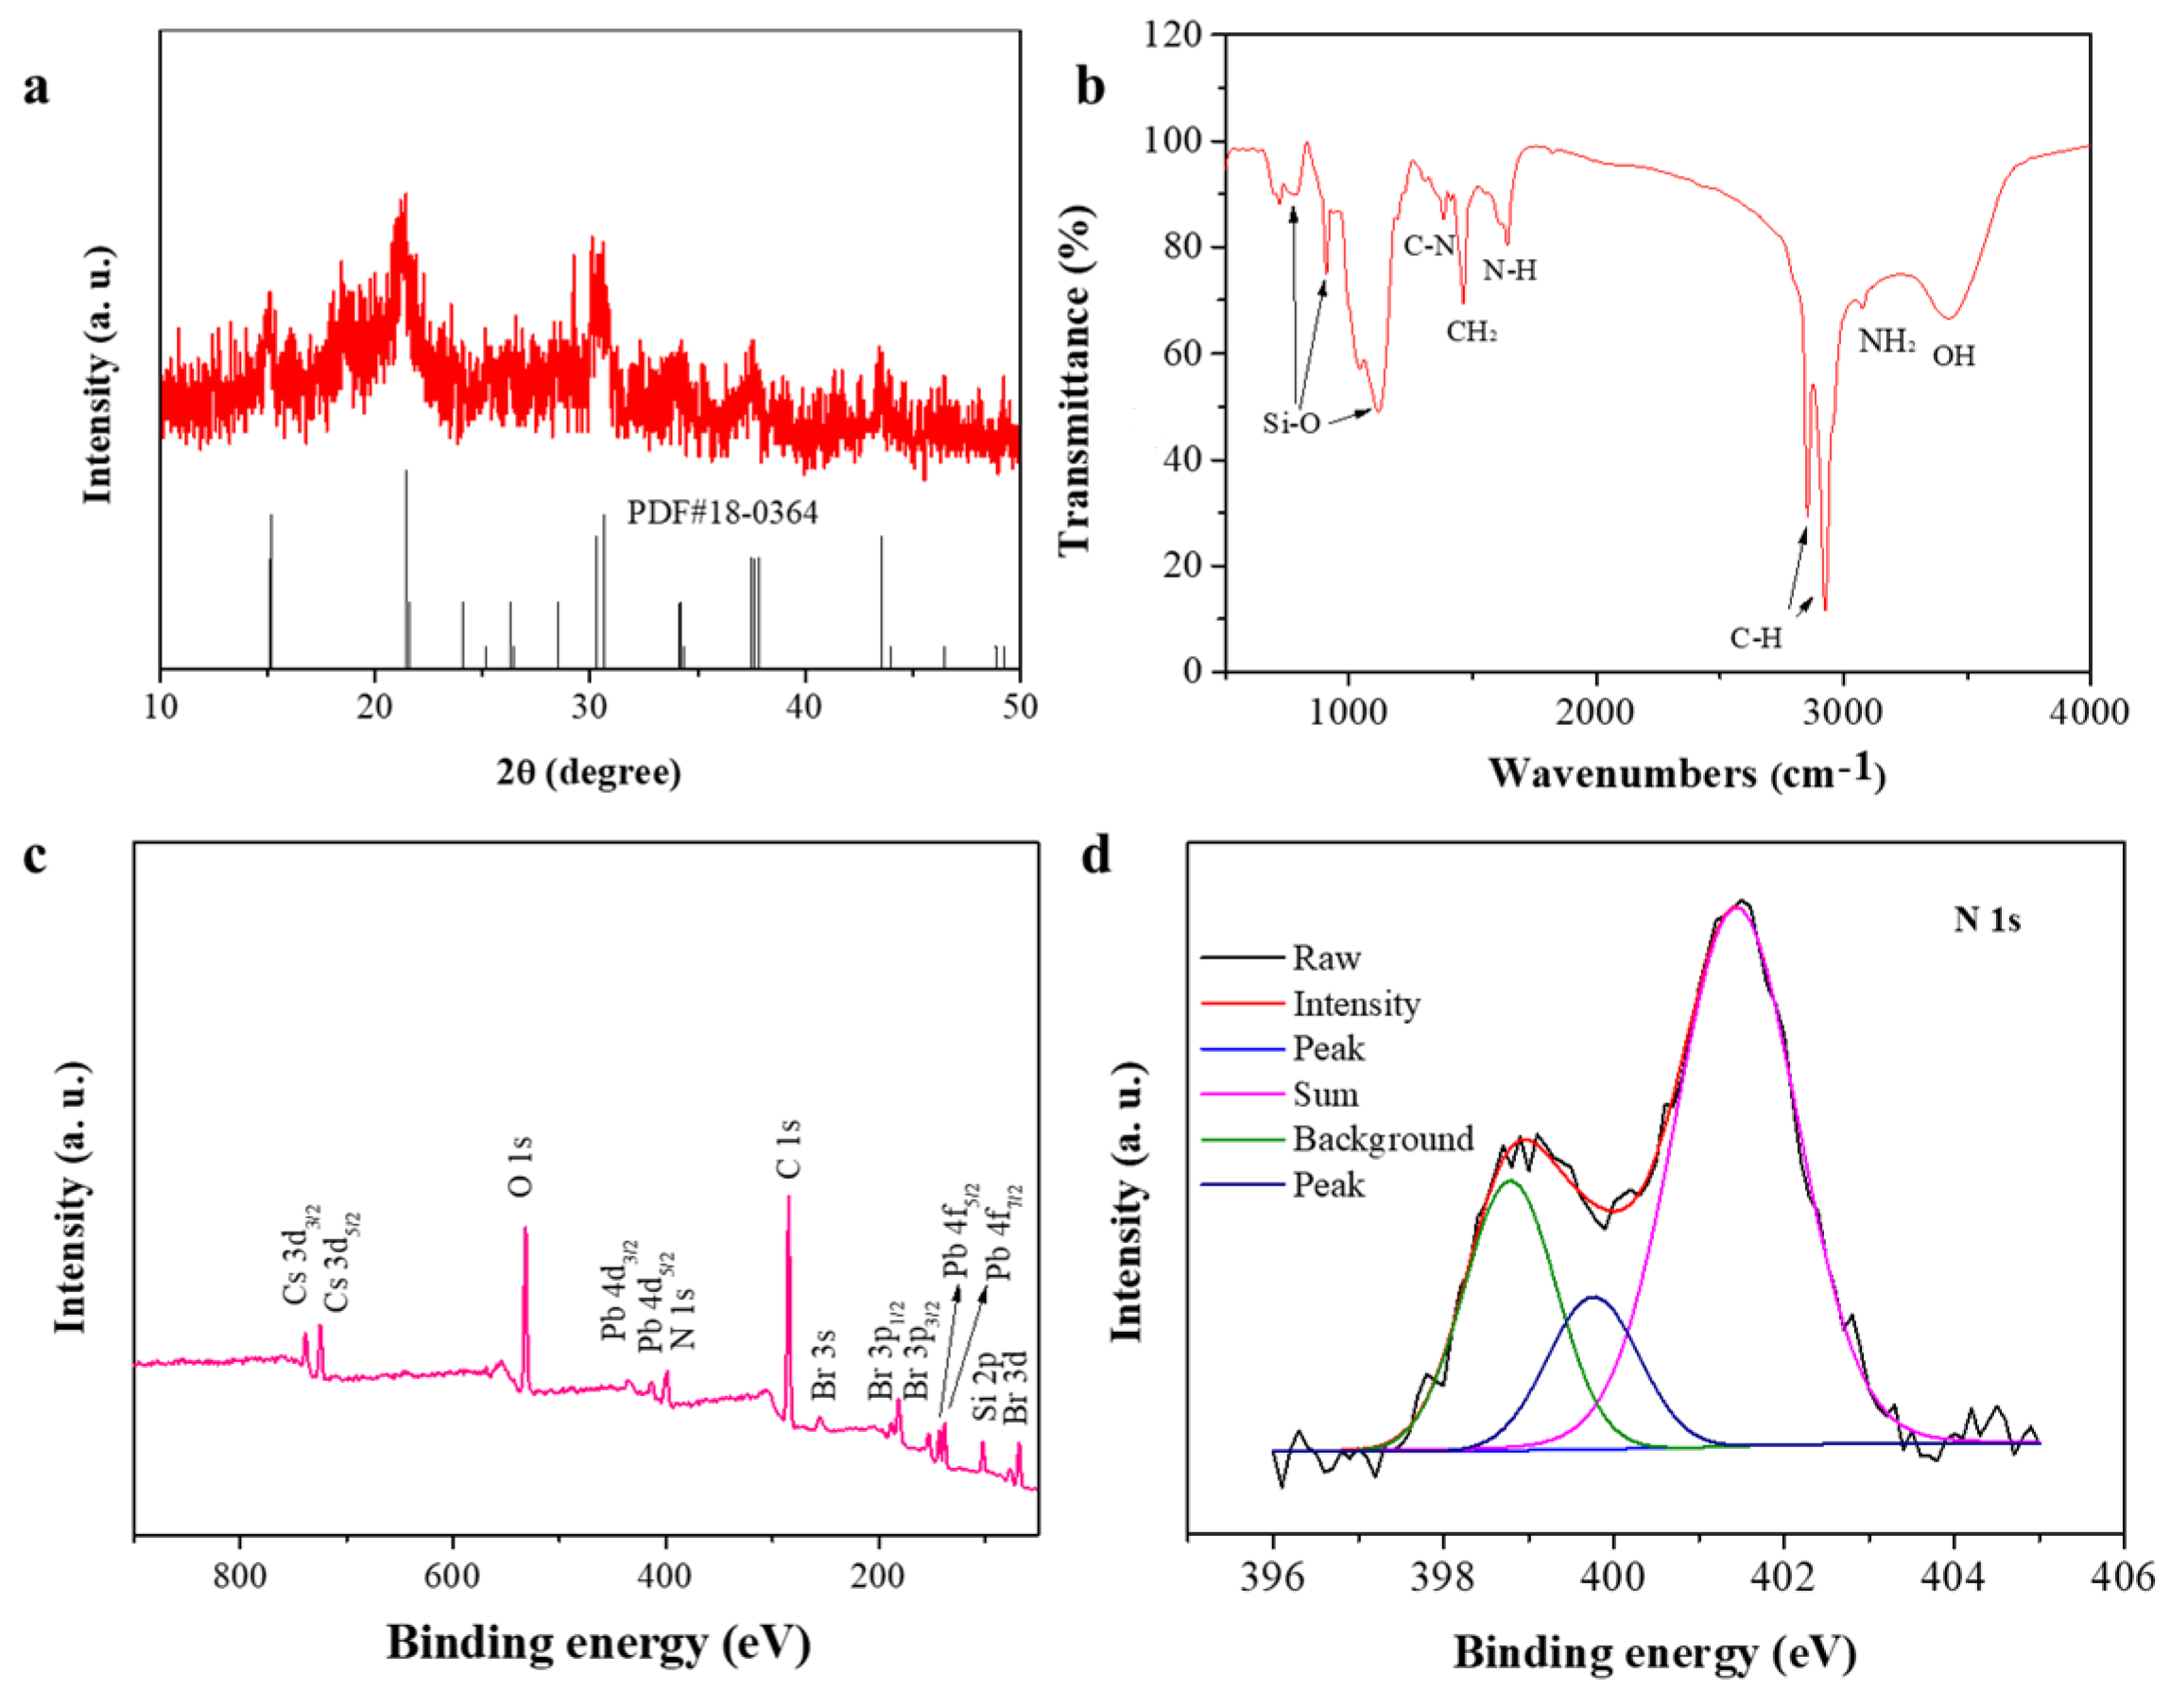
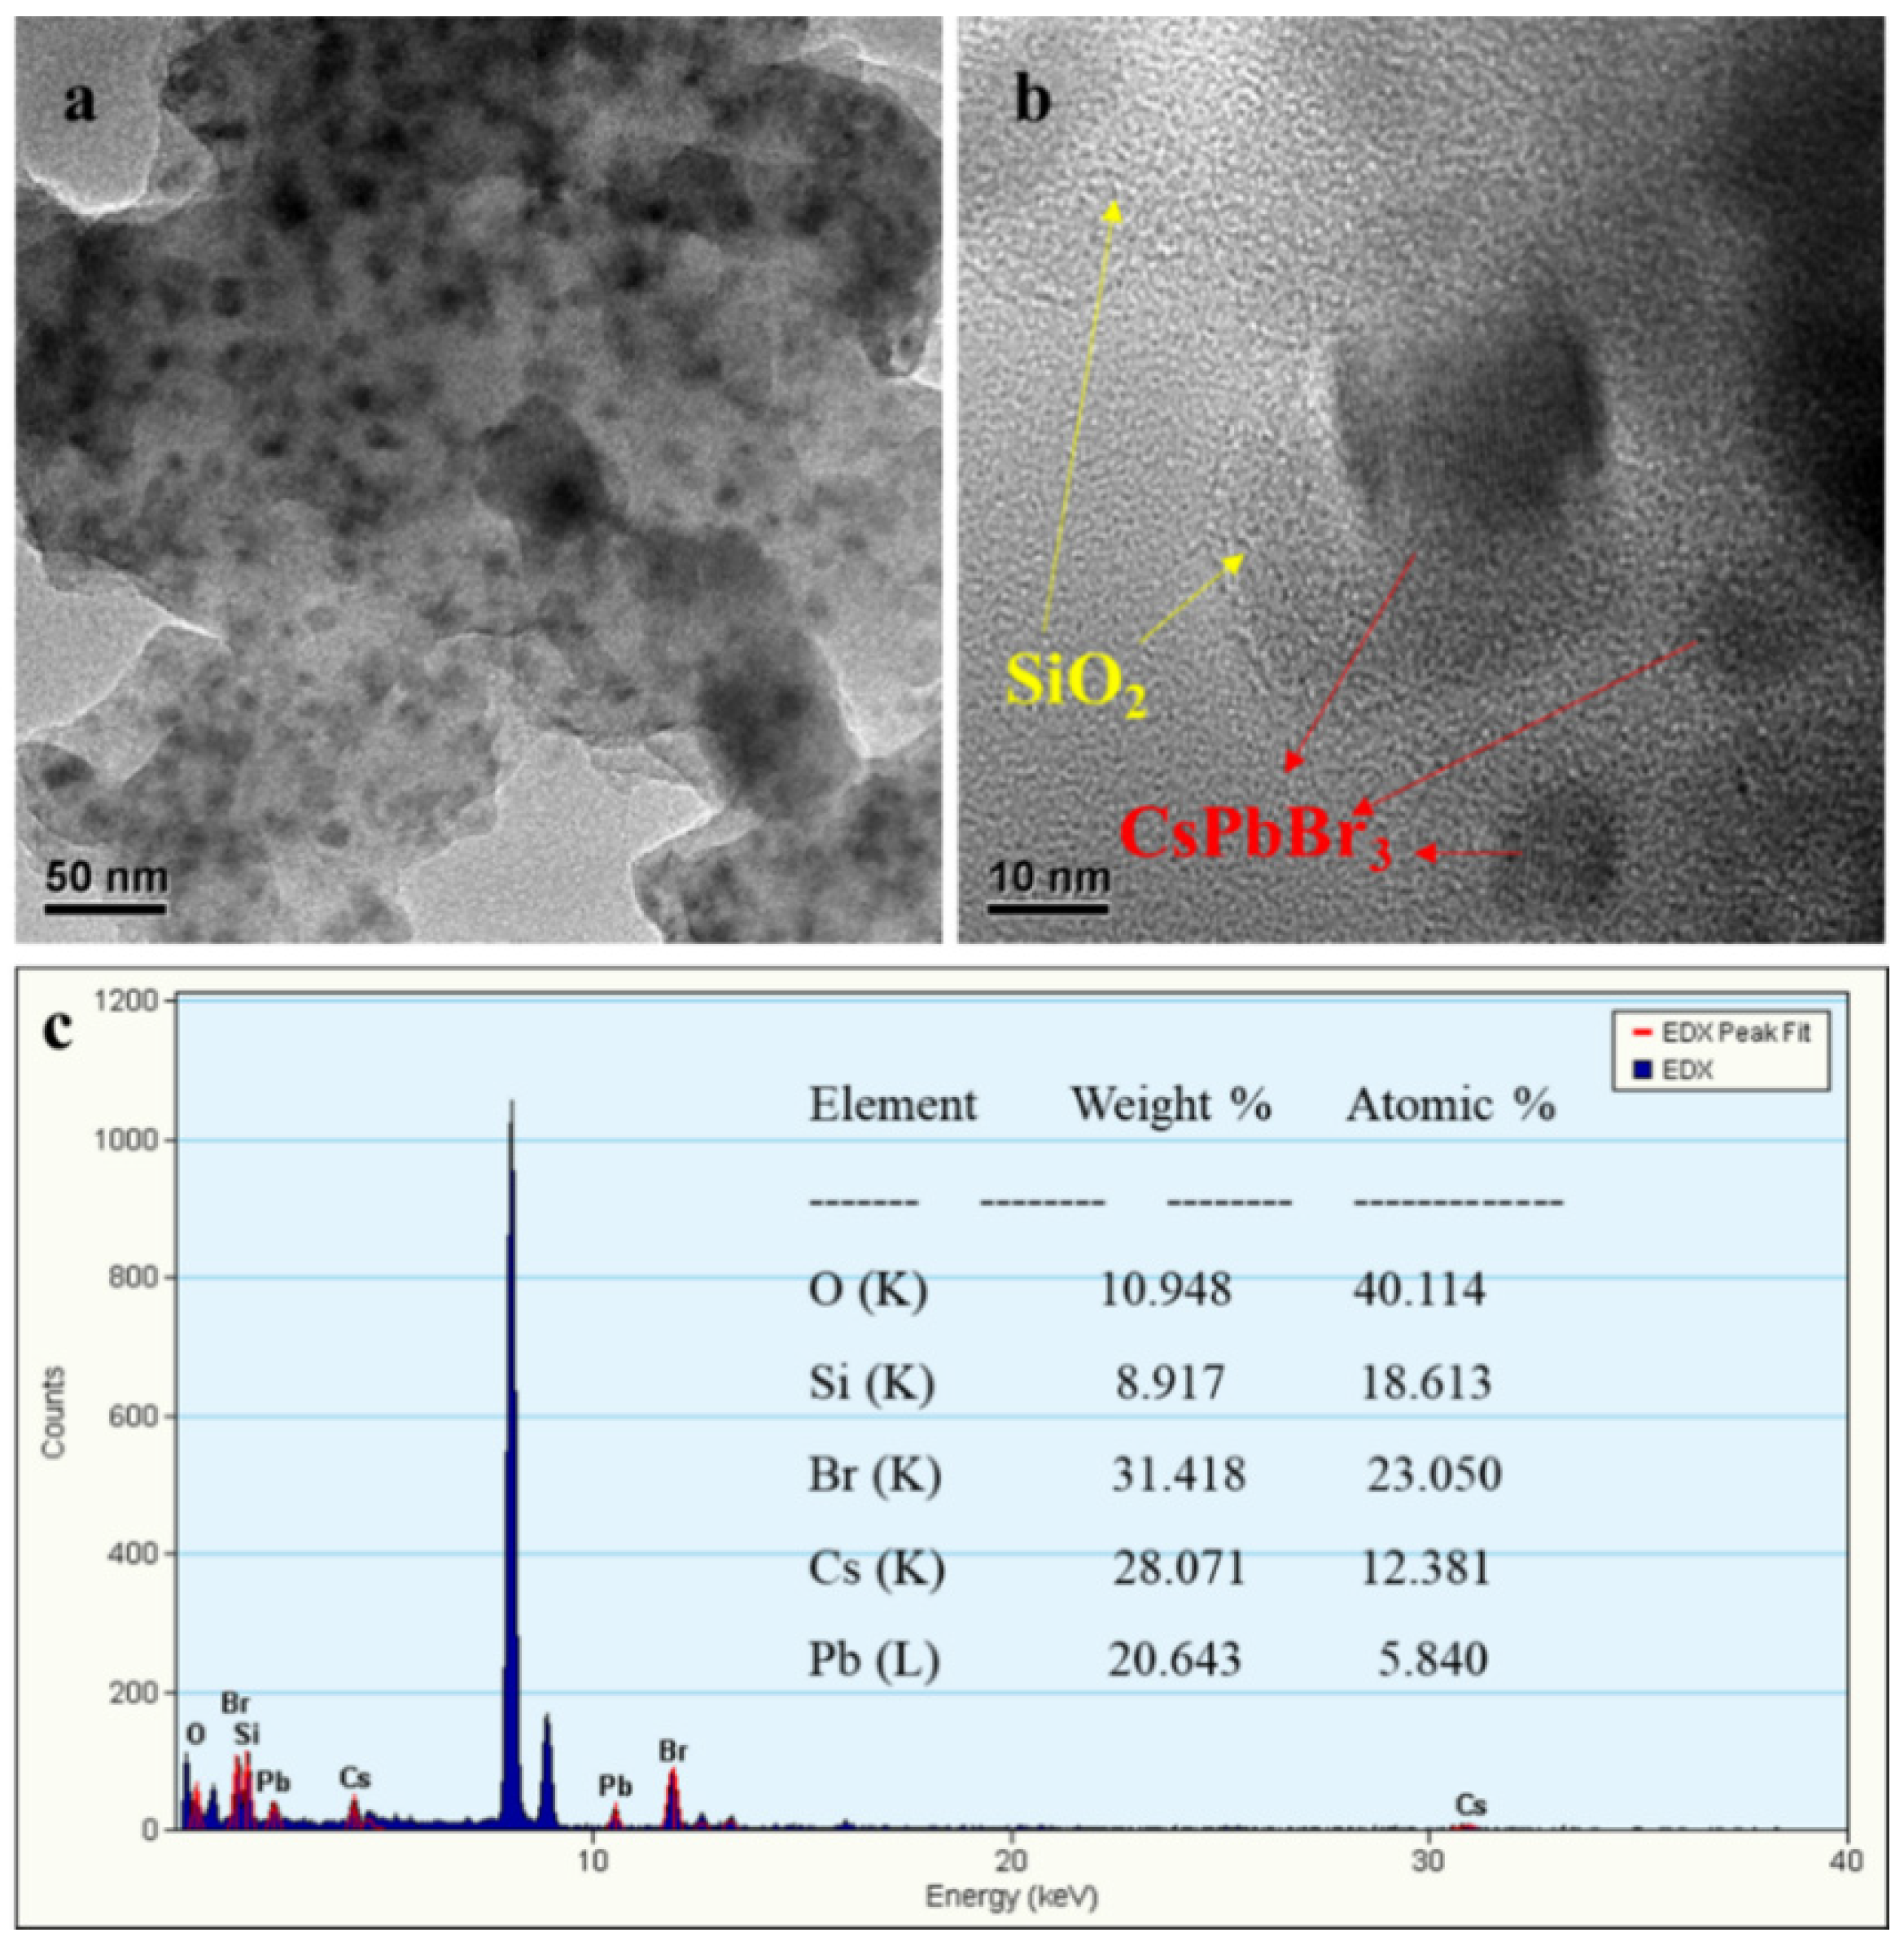
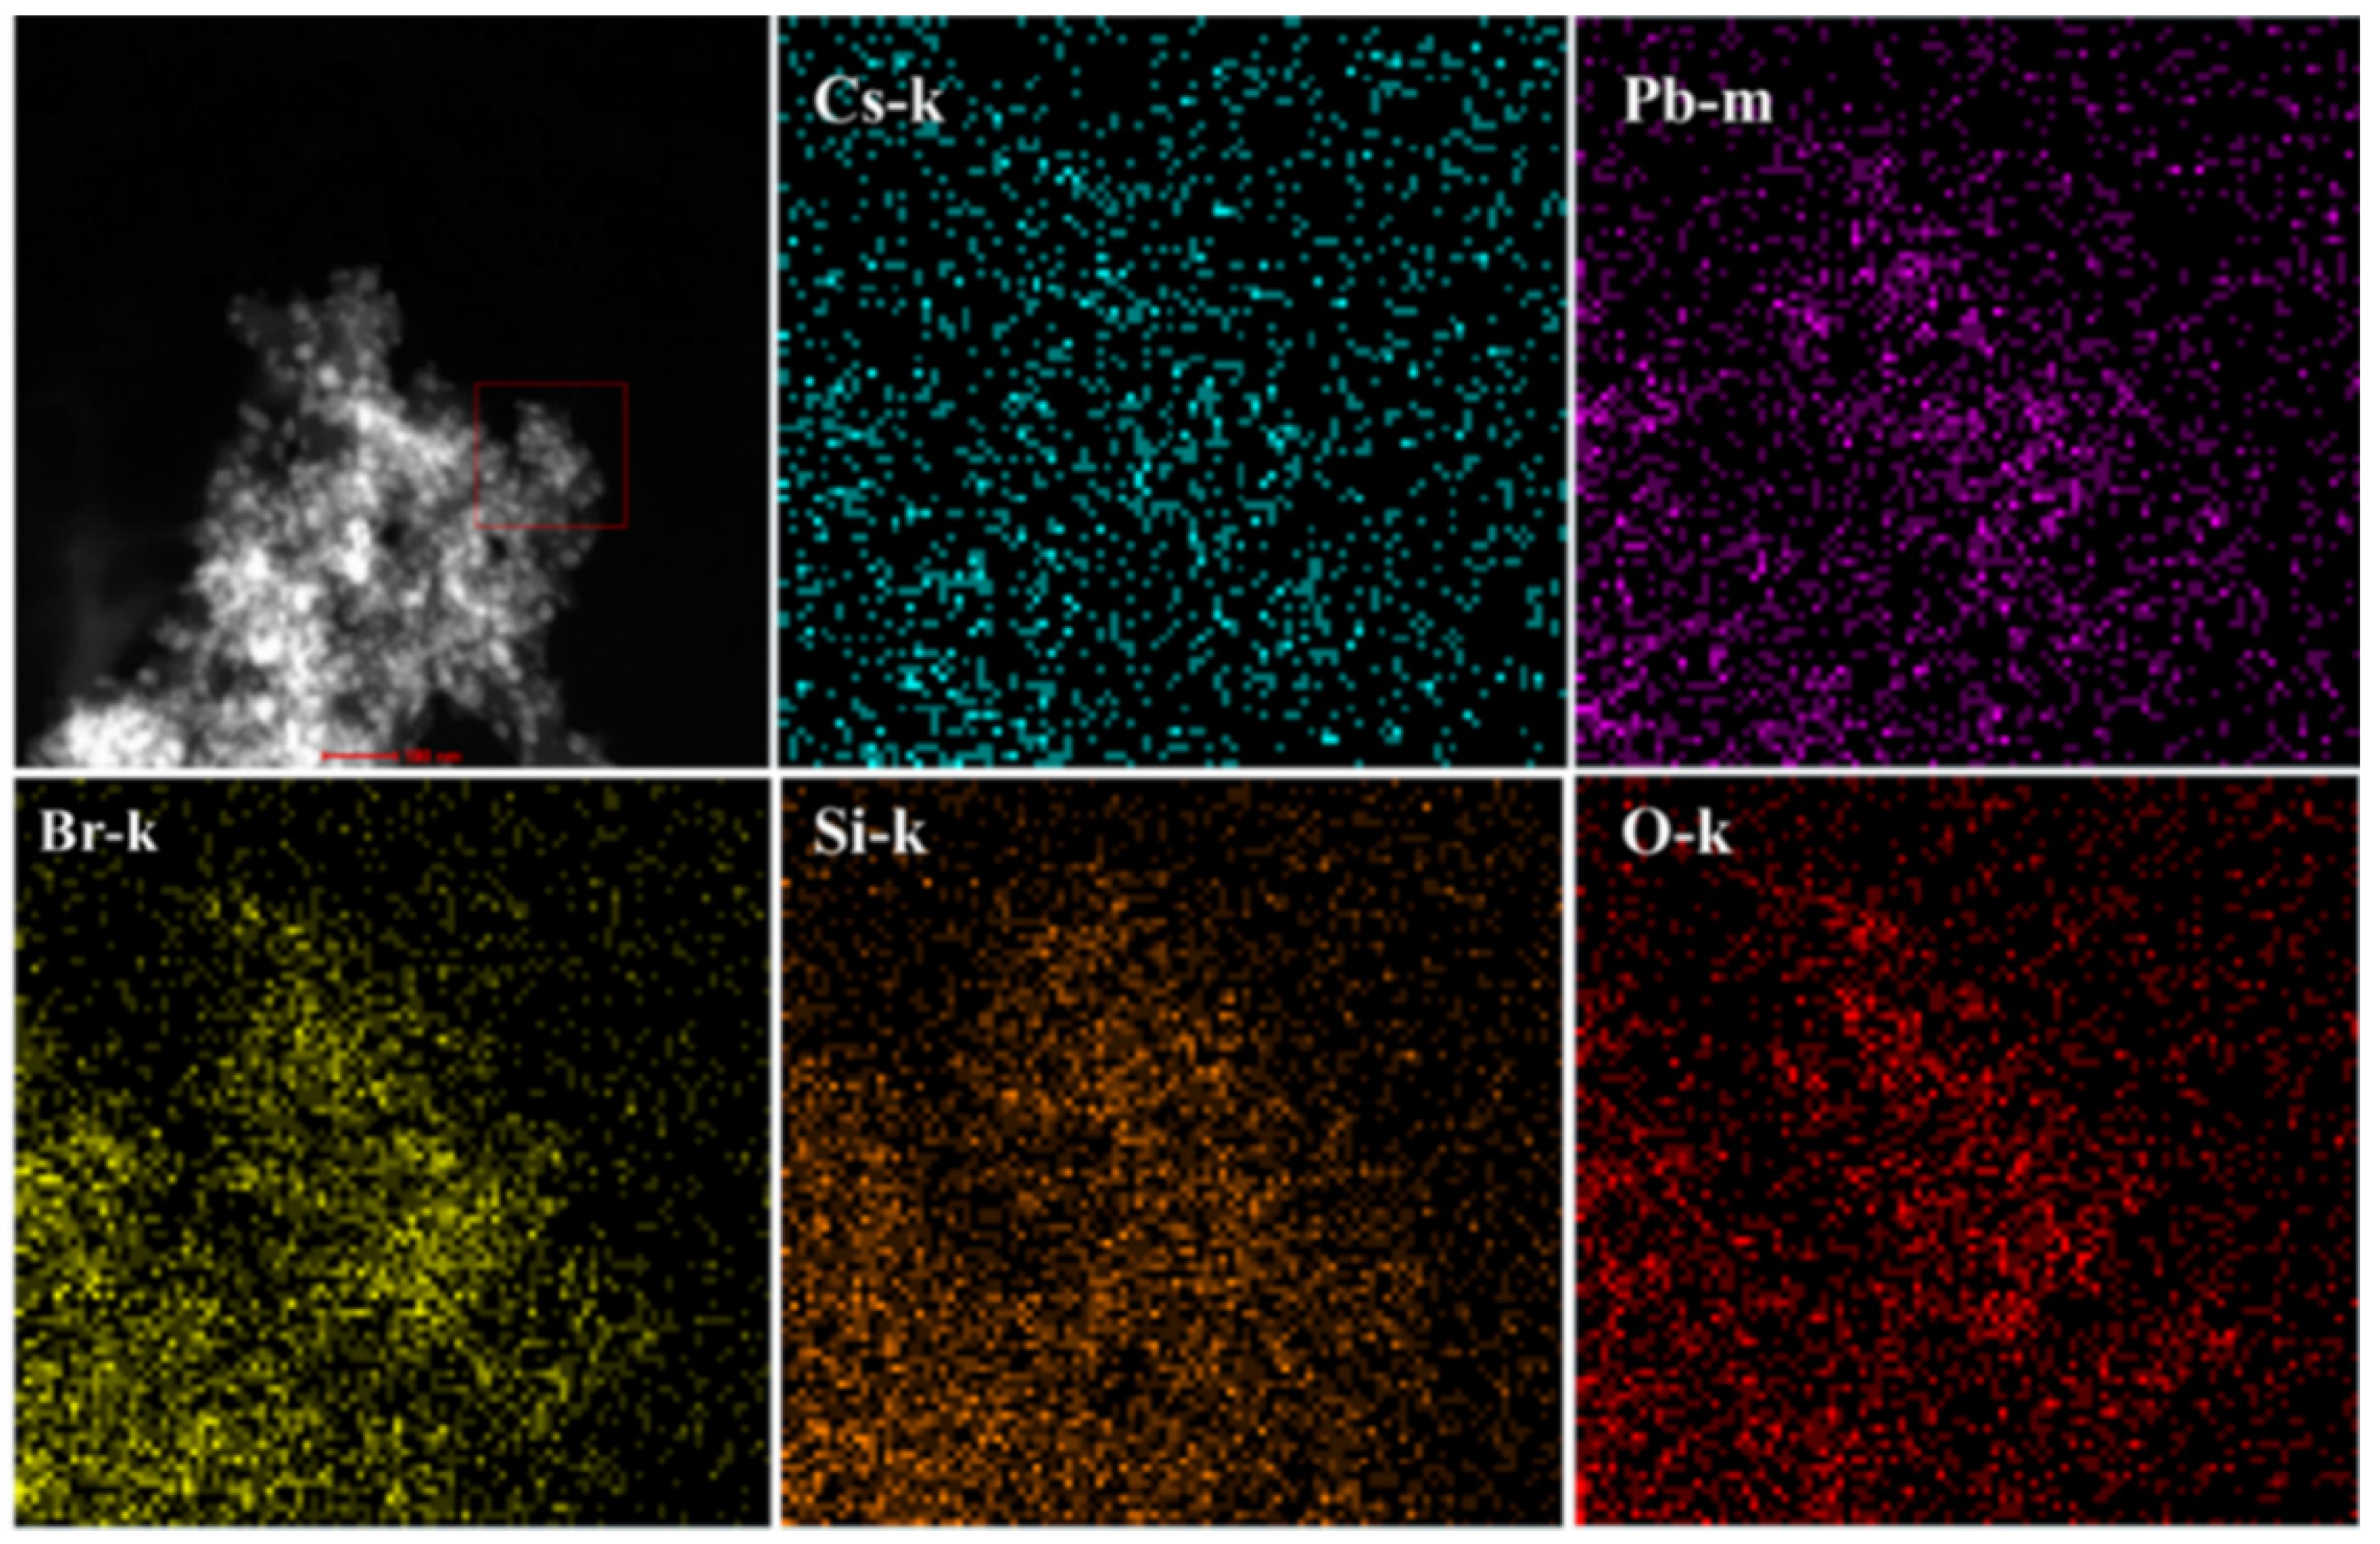
3.2. CsPbBr3@SiO2 PNCC Structure and Their Luminescent Characteristics

The structure of the obtained CsPbBr3@SiO2 PNCCs was characterized by XRD. As shown in Figure 2a, the peaks of 2θ at 15°, 21°, 29°, 33°, 37° and 43° correspond to the crystal planes of {100}, {110}, {200}, {210}, {211} and {220} for cubic crystal CsPbBr3 (cf. PDF#18-0364), indicating the cubic structure of the perovskite crystal in CsPbBr3@SiO2 PNCCs. No obvious characteristic peak of SiO2 is observed in the XRD spectrum due to its amorphous structure. FT-IR results, as shown in Figure 2b, show that obvious Si-O stretching vibration peaks are found at 781 cm−1, 902 cm−1 and 1117 cm−1. The peak at 3425 cm−1 is -OH on SiO2, indicating the formation of SiO2. The peak at 1388 cm−1 corresponds to the C-N stretching vibration of benzylamine generated after the reaction between TBB and APTES, while the 1468 cm−1 peak corresponds to the C-H stretching vibration of the benzene ring of TBB in CsPbBr3@SiO2 PNCCs, indicating that CsPbBr3@SiO2 PNCCs have a crosslinked structure. The surface structure of CsPbBr3@SiO2 PNCCs was further analyzed by XPS, and the peaks at 724.5 and 739.1 eV are attributed to Cs 3D5/2 and Cs 3D3/2. The peaks at 139.0 and 143.6 eV are attributed to the peak at 168.7 eV of Pb 4F7/2 and Pb 4F5/2, the peak at 102.6 eV is attributed to Si 2P, and the peak at 531.3 eV is attributed to O 1s [33]. In addition, the high-resolution XPS spectra of N1s were analyzed, and the peaks at 398.6 eV, 399.8 eV and 401.6 eV are attributed to imine N, amino N and protonated N, respectively. The imine N in the main C-N-C style is from the reaction between TBB and APTES, and the amino N is mainly transferred from NH2 bonded with TBB. Protonation of N can mainly be obtained from the protonation of the generated imine N and amino N reacting with HBr [32]. Abundant N groups on the surface contribute to the interface passivation of CsPbBr3 PNCs to improve their luminescence performance. In addition, the N groups can also provide anchoring sites for CsPbBr3 PNCs to enhance their stability [32].
The structure and composition of CsPbBr3@SiO2 PNCCs were further characterized by TEM, HRTEM and EDX. As shown in Figure 3, the TEM image of CsPbBr3@SiO2 PNCCs shows uniform CsPbBr3 PNCs embedded in SiO2 since the surface of SiO2 contains many N groups that act as anchor sites for the nucleation and growth of CsPbBr3 PNCs. The larger size distribution of CsPbBr3 PNCs is mainly caused by different microenvironments, as shown in Figure 3a. The content of each element in CsPbBr3@SiO2 PNCCs, as listed in Figure 3b, was found to be Cs 12.381%, Pb 5.840%, Br 23.050%, Si 18.613% and O 40.114% using EDX.
The high-angle annular dark-field imaging of CsPbBr3@SiO2 PNCCs and the imaging of their element distributions, as shown in Figure 4, indicate that CsPbBr3 PNCs are uniformly distributed in the CsPbBr3@SiO2 PNCC framework. Cs, Pb, Br, Si and O elements are uniformly distributed in the same contour region, and Pb, Br and Si elements are consistent in the darker position, which is consistent with the TEM results in Figure 3.
As shown in Figure 5a, CsPbBr3@SiO2 PNCCs revealed an emission peak of 513 nm and half-peak width of 22 nm. The fluorescence quantum yield was found to be about 60%. The time-resolved fluorescence attenuation curve of CsPbBr3@SiO2 PNCCs was fitted with three exponents (Figure 5b), where τ = (A1τ12 + A2τ22 + A3τ32)/(A1τ1 + A2τ2 + A3τ3), τ1 is 6.47 ns (A1 is 33.13%), τ2 is 23.25 ns (A2 is 45.03%), τ3 is 83.52 ns (A3 is 21.85%), and the total lifetime is about 30.86 ns. The main type of the radiative transition for CsPbBr3@SiO2 PNCCs results in their excellent luminescence performance due to the good passivation effect of abundant N groups on their surfaces, which inhibits non-radiative transition [34].

3.3. Optimization of the Sensing of Cl

Generally, CsPbBr3 PNCs are extremely unstable in a polar solution. As indicated in Figure 6a, in ethanol solution, the fluorescence of CsPbBr3 PNCs was attenuated to 30% of its original value in 20 min, and the fluorescence totally disappeared in 60 min due to structural collapse. However, compared with CsPbBr3 PNCs without the SiO2 coating, CsPbBr3@SiO2 PNCCs revealed good stability towards ethanol since the SiO2 coating and the anchoring protection of abundant N groups on the SiO2 surface will increase the stability of CsPbBr3@SiO2 PNCCs in a polar solvent. As shown in Figure 6a, CsPbBr3@SiO2 PNCCs remained at 92% of their original value after their immersion in ethanol for 180 min, which may provide an approach for the homogeneous halogen exchange of CsPbBr3@SiO2 PNCCs in polar solvents. Subsequently, the effect of H2O on the stability of CsPbBr3@SiO2 PNCCs was studied. The results in Figure 6b indicate obvious damage by H2O to the structure of CsPbBr3@SiO2 PNCCs, which is different from that in ethanol due to the different solubilities of CsBr (the solubility (25 °C) of CsBr in water and in ethanol is 122.6 g/100 g and 0.3900 g/100 g, respectively [35]). In order to meet the application requirements for the determination of Cl in water solution, a suitable volume ratio of ethanol/H2O of 200/1 (v/v, typically in experiments, 1 mL ethanol/5 μL H2O) was selected for further study. In addition, the homogeneous halogen exchange between CsPbBr3@SiO2 PNCC ethanol solution and NaCl aqueous solution was studied. In contrast to the heterogeneous exchange between CsPbBr3 PNCs n-hexane solution and NaCl aqueous solution [30], no pH adjustment or magnetic stirring is needed for the homogeneous halogen exchange. The complete halogen exchange can be realized in 15 min by adding 5 μL of NaCl solution (12.3 mg/g) to 1 mL of CsPbBr3@SiO2 PNCC ethanol solution, as indicated in Figure 6d. The blue shift of the fluorescence spectrum can be observed in the results shown in Figure 6, and the observed color changes from green to blue. It should be noted that the width of the emission peak broadens after the halogen exchange due to the wide size distribution of CsPbBr3 PNCs in CsPbBr3@SiO2 PNCCs, as revealed in Figure 3b. Furthermore, the increase in defects on their surfaces leads to a wider emission peak of CsPbBr3 PNCs after the halogen exchange with Cl.

3.4. Analytical Performance of the Sensing Approach

For the investigation of the effects of the main co-existing substances in seawater, 1.92% (330 mmol/L) NaCl was selected as a typical test concentration due to its similar Cl concentration to seawater. The results shown in Figure S2 indicate that there is no obvious interference for the selected substances in the halogen exchange between CsPbBr3@SiO2 PNCCs and Cl, revealing good selectivity for the fluorescence sensing of Cl in seawater. Generally, another halogen ion, I, will notably affect the exchange with Cl at a similar concentration. Fortunately, the concentration of NaCl in the offshore seawater sample is about 1.92%, which is much higher than that of I (about 5 μmol/L) and results in negligible effects for I.
Under the selected sensing conditions, the fluorescence sensing of Cl based on the halogen exchange between CsPbBr3@SiO2 PNCCs and Cl was investigated. As shown in Figure 7, with the increase in Cl concentration, a blue shift of the fluorescence emission wavelength of CsPbBr3@SiO2 PNCCs can be clearly observed at an excitation wavelength of 365 nm. The observed color changes from greenish-blue-green to blue, which can be used for the rapid determination of Cl concentration in sea sand. In addition, the working curve of the system was plotted and showed a good relationship between the emission wavelength shift and the Cl concentration in the range of 0 to 3.0%, with a curve equation of Δλ = 25.20 CCl + 4.94 and R2 = 0.9995, and the limit of detection (LOD = 3σ/k, where σ is the relative standard deviation of 11 blank detection results, and k is the slope of the linear equation) is found to be 0.05 mg/g.
In Figure 7c, it is easy to identify color changes for different concentrations of Cl. Typically, a green-blue to blue color was found when the Cl concentration was over 0.6 mg/g, which is the upper limit of Cl content for class III sand. As for higher-quality sand samples such as class I or II, the content of Cl should be less than 0.01% (0.1 mg/g) or 0.02% (0.2 mg/g), respectively. The observed color was bright green-blue and light blue, respectively, which makes the quality of the sand sample easy to identify with the naked eye using a color card.
In order to investigate the feasibility of the sensing approach, the NaCl concentration of seawater samples was firstly determined. The samples were directly processed in accordance with the experimental steps without any pre-treatment. As listed in the sensing results in Table S1, this method has a relatively good recovery in the range of 90% to 96.6%, indicating that the method is feasible for Cl sensing in seawater.
For the determination of the Cl concentration in sand samples, their filtrate was used to replace the Cl standard solution, and the semi-quantitative analysis of their concentration could be realized using a simple color card. As revealed in Table 1, the color difference between the three different sand samples could be easily observed. Obviously, the filtrate from the completely untreated sea sand produced the shortest emission wavelength (447 nm) and presented a blue color after 365 nm excitation. With the decrease in Cl concentration, which could be realized by freshwater cleaning, in sand samples II and III, the emission wavelength became red-shifted, and the observed color changed to dark blue-green (about 492 nm) and bright blue-green (506 nm). The quantitative analysis of the Cl concentration in the sand samples was carried out by using a fluorescence spectrophotometer. The accurate emission wavelength shifts were obtained and are listed in Table 1. The RSD and recovery results were found to be from 0.33% to 8.29% and 94% to 113%, respectively, indicating the applicability of the approach. In addition, the class discrimination for the sand samples became easy due to the obvious color differences between the different classes of sand. For example, the Sand 2 sample belongs to class III, and Sand 3 is class I.

4. Conclusions

In this study, CsPbBr3@SiO2 PNCCs were synthesized by a benzyl bromide nucleophilic substitution strategy in one step. The obtained CsPbBr3@SiO2 PNCCs reveal excellent luminescence performance and alcohol polarity stability. The homogeneous halogen exchange of NaCl solution (water)–CsPbBr3@SiO2 PNCCs (ethanol) can be achieved without pH regulation or magnetic stirring, which provides a very simple approach for Cl sensing in sand samples. The sensing color could easily be applied to identify the quality of sand samples, and of course, the quantitative analysis of Cl concentration could also be realized by their PL wavelength shift.

Supplementary Materials

The following supporting information can be downloaded at: https://0-www-mdpi-com.brum.beds.ac.uk/article/10.3390/chemosensors10050170/s1, Figure S1: Excitation spectrum of CsPbBr3@SiO2 PNCCs in the solution of 1.92% (330 mmol/L); Cl; Figure S2: The selectivity investigation on Cl determination in sea water based on CsPbBr3@SiO2 PNCCs halide exchanges with Cl (330 mmol/L). The potential coexistent ions in sea water from left to right were 20 μmol/L F, 0.7 mmol/L Br, 5 μmol/L I, 300 mmol/L Na+, 10 mmol/L K+, 20 mmol/L Mg2+, 10 mmol/L Ca2+, 50 μmol/L Sr2+, 5 mmol/L CO32-, 20 mmol/L SO42-, 5 mmol/L HCO3; Table S1: The determination of Cl in sea water. Excitation slit width, 1.5 nm; emission slit width, 5.5 nm, scan rate: 1200 nm·min−1.

Author Contributions

Data curation, conceptualization and formal analysis, H.L. and F.L.; data curation, Y.H.; methodology and validation, Y.H. and L.Z.; visualization and writing—review and editing, M.Y., J.J.; project administration, supervision and writing of the original draft, X.C. All authors have read and agreed to the published version of the manuscript.

Funding

This research was funded by the National Natural Science Foundations of China, grant number 21876141.

Institutional Review Board Statement

Not applicable.

Informed Consent Statement

Not applicable.

Data Availability Statement

Data are contained within the article.

Conflicts of Interest

The authors declare no conflict of interest. The funders had no role in the design of the study; in the collection, analyses or interpretation of data; in the writing of the manuscript; or in the decision to publish the results.

References

  1. GB/T 14684-2011; The General Administration of Quality Supervision, Inspection and Quarantine of the People’s Republic of China. Sand for Construction. Standards Press of China: Beijing, China, 2011.
  2. Calderón-Santiago, M.; Priego-Capote, F.; Jurado-Gámez, B.; Luque de Castro, M.D. Optimization study for metabolomics analysis of human sweat by liquid chromatography–tandem mass spectrometry in high resolution mode. J. Chromatogr. A 2014, 1333, 70–78. [Google Scholar] [CrossRef] [PubMed]
  3. Doorn, J.; Storteboom, T.T.R.; Mulder, A.M.; de Jong, W.H.A.; Rottier, B.L.; Kema, I.P. Ion chromatography for the precise analysis of chloride and sodium in sweat for the diagnosis of cystic fibrosis. Ann. Clin. Biochem. 2014, 52, 421–427. [Google Scholar] [CrossRef] [PubMed] [Green Version]
  4. Kubáň, P.; Greguš, M.; Pokojová, E.; Skřičková, J.; Foret, F. Double opposite end injection capillary electrophoresis with contactless conductometric detection for simultaneous determination of chloride, sodium and potassium in cystic fibrosis diagnosis. J. Chromatogr. A 2014, 1358, 293–298. [Google Scholar] [CrossRef]
  5. Bujes-Garrido, J.; Izquierdo-Bote, D.; Heras, A.; Colina, A.; Arcos-Martínez, M.J. Determination of halides using Ag nanoparticles-modified disposable electrodes. A first approach to a wearable sensor for quantification of chloride ions. Anal. Chim. Acta 2018, 1012, 42–48. [Google Scholar]
  6. Choi, D.-H.; Kim, J.S.; Cutting, G.R.; Searson, P.C. Wearable Potentiometric Chloride Sweat Sensor: The Critical Role of the Salt Bridge. Anal. Chem. 2016, 88, 12241–12247. [Google Scholar] [CrossRef] [PubMed]
  7. De Matteis, V.; Cannavale, A.; Blasi, L.; Quarta, A.; Gigli, G. Chromogenic device for cystic fibrosis precocious diagnosis: A “point of care” tool for sweat test. Sens. Actuators B Chem. 2016, 225, 474–480. [Google Scholar] [CrossRef]
  8. Chen, L.D.; Wang, W.J.; Wang, G.Z. Electrochemical Detection of Electrolytes Using a Solid-State Ion-Selective Electrode of Single-Piece Type Membrane. Biosensors 2021, 11, 109. [Google Scholar] [CrossRef] [PubMed]
  9. Tsuchiya, K.; Akatsuka, T.; Abe, Y.; Komaba, S. Design of all-solid-state chloride and nitrate ion-selective electrodes using anion insertion materials of electrodeposited poly(allylamine)-MnO2 composite. Electrochim. Acta 2021, 389, 138749. [Google Scholar] [CrossRef]
  10. Zhang, F.; Ma, C.; Jiao, Z.; Mu, S.; Zhang, Y.; Liu, X.; Zhang, H. A NIR Turn-on Fluorescent Sensor For Detection of Chloride Ions in vitro and in vivo. Spectrochim. Acta A 2020, 228, 117729. [Google Scholar] [CrossRef]
  11. Tutol, J.N.; Lee, J.; Chi, H.; Faizuddin, F.N.; Abeyrathna, S.S.; Zhou, Q.; Morcos, F.; Meloni, G.; Dodani, S.C. A single point mutation converts a proton-pumping rhodopsin into a red-shifted, turn-on fluorescent sensor for chloride. Chem. Sci. 2021, 12, 5655–5663. [Google Scholar] [CrossRef]
  12. Schazmann, B.; Alhashimy, N.; Diamond, D. Chloride Selective Calix[4]arene Optical Sensor Combining Urea Functionality with Pyrene Excimer Transduction. J. Am. Chem. Soc. 2006, 128, 8607–8614. [Google Scholar] [CrossRef] [Green Version]
  13. Madhu, S.; Kalaiyarasi, R.; Basu, S.K.; Jadhav, S.; Ravikanth, M. A boron-dipyrrin–mercury(ii) complex as a fluorescence turn-on sensor for chloride and applications towards logic gates. J. Mater. Chem. C 2014, 2, 2534–2544. [Google Scholar] [CrossRef]
  14. Bazany-Rodríguez, I.J.; Martínez-Otero, D.; Barroso-Flores, J.; Yatsimirsky, A.K.; Dorazco-González, A. Sensitive water-soluble fluorescent chemosensor for chloride based on a bisquinolinium pyridine-dicarboxamide compound. Sens. Actuators B Chem. 2015, 221, 1348–1355. [Google Scholar] [CrossRef]
  15. Kim, J.P.; Xie, Z.; Creer, M.; Liu, Z.; Yang, J. Citrate-based fluorescent materials for low-cost chloride sensing in the diagnosis of cystic fibrosis. Chem. Sci. 2017, 8, 550–558. [Google Scholar] [CrossRef] [Green Version]
  16. Riedinger, A.; Zhang, F.; Dommershausen, F.; Röcker, C.; Brandholt, S.; Nienhaus, G.U.; Koert, U.; Parak, W.J. Ratiometric Optical Sensing of Chloride Ions with Organic Fluorophore–Gold Nanoparticle Hybrids: A Systematic Study of Design Parameters and Surface Charge Effects. Small 2010, 6, 2590–2597. [Google Scholar] [CrossRef]
  17. Ding, L.; Lian, Y.; Lin, Z.; Zhang, Z.; Wang, X.D. Long-Term Quantitatively Imaging Intracellular Chloride Concentration Using a Core-/Shell-Structured Nanosensor and Time-Domain Dual-Lifetime Referencing Method. ACS Sens. 2020, 5, 3971–3978. [Google Scholar] [CrossRef]
  18. Xing, J.; Yan, F.; Zhao, Y.; Chen, S.; Yu, H.; Zhang, Q.; Zeng, R.; Demir, H.V.; Sun, X.; Huan, A.; et al. High-Efficiency Light-Emitting Diodes of Organometal Halide Perovskite Amorphous Nanoparticles. ACS Nano 2016, 10, 6623–6630. [Google Scholar] [CrossRef]
  19. Sadhanala, A.; Ahmad, S.; Zhao, B.; Giesbrecht, N.; Pearce, P.M.; Deschler, F.; Hoye, R.L.Z.; Gödel, K.C.; Bein, T.; Docampo, P.; et al. Blue-Green Color Tunable Solution Processable Organolead Chloride–Bromide Mixed Halide Perovskites for Optoelectronic Applications. Nano Lett. 2015, 15, 6095–6101. [Google Scholar] [CrossRef] [Green Version]
  20. Manser, J.S.; Christians, J.A.; Kamat, P.V. Intriguing Optoelectronic Properties of Metal Halide Perovskites. Chem. Rev. 2016, 116, 12956–13008. [Google Scholar] [CrossRef] [PubMed]
  21. Liu, F.; Zhang, Y.; Ding, C.; Kobayashi, S.; Izuishi, T.; Nakazawa, N.; Toyoda, T.; Ohta, T.; Hayase, S.; Minemoto, T.; et al. Highly Luminescent Phase-Stable CsPbI3 Perovskite Quantum Dots Achieving Near 100% Absolute Photoluminescence Quantum Yield. ACS Nano 2017, 11, 10373–10383. [Google Scholar] [CrossRef]
  22. Yan, F.; Xing, J.; Xing, G.; Quan, L.; Tan, S.T.; Zhao, J.; Su, R.; Zhang, L.; Chen, S.; Zhao, Y.; et al. Highly Efficient Visible Colloidal Lead-Halide Perovskite Nanocrystal Light-Emitting Diodes. Nano Lett. 2018, 18, 3157–3164. [Google Scholar] [CrossRef] [PubMed] [Green Version]
  23. Bekenstein, Y.; Koscher, B.A.; Eaton, S.W.; Yang, P.; Alivisatos, A.P. Highly Luminescent Colloidal Nanoplates of Perovskite Cesium Lead Halide and Their Oriented Assemblies. J. Am. Chem. Soc. 2015, 137, 16008–16011. [Google Scholar] [CrossRef] [PubMed] [Green Version]
  24. Yan, F.; Tan, S.T.; Li, X.; Demir, H.V. Light Generation in Lead Halide Perovskite Nanocrystals: LEDs, Color Converters, Lasers, and Other Applications. Small 2019, 15, 1902079. [Google Scholar] [CrossRef] [PubMed]
  25. Protesescu, L.; Yakunin, S.; Bodnarchuk, M.I.; Krieg, F.; Caputo, R.; Hendon, C.H.; Yang, R.X.; Walsh, A.; Kovalenko, M.V. Nanocrystals of Cesium Lead Halide Perovskites (CsPbX3, X = Cl, Br, and I): Novel Optoelectronic Materials Showing Bright Emission with Wide Color Gamut. Nano Lett. 2015, 15, 3692–3696. [Google Scholar] [CrossRef] [Green Version]
  26. Choi, Y.J.; Debbichi, L.; Lee, D.-K.; Park, N.-G.; Kim, H.; Kim, D. Light Emission Enhancement by Tuning the Structural Phase of APbBr3 (A = CH3NH3, Cs) Perovskites. J. Phys. Chem. Lett. 2019, 10, 2135–2142. [Google Scholar] [CrossRef]
  27. Han, Y.; Sun, J.; Ye, S.; Zhang, Q. A stimuli responsive material of perovskite quantum dots composited nano-porous glass. J. Mater. Chem. C 2018, 6, 11184–11192. [Google Scholar] [CrossRef]
  28. Sandeep, K.; Hamida, K.T. CsPbBr3 Perovskite–Coated Paper Substrate for the Cost-Effective Detection of Fluoride, Chloride, and Iodide Ions in Water. Phys. Status Solidi A 2021, 218, 2100101. [Google Scholar] [CrossRef]
  29. Vasavi Dutt, V.G.; Akhil, S.; Mishra, N. Corrigendum: Cesium Lead Bromide Perovskite Nanocrystals as a Simple and Portable Spectrochemical Probe for Rapid Detection of Chlorides. ChemistrySelect 2021, 6, 12547. [Google Scholar] [CrossRef]
  30. Li, F.; Feng, Y.; Huang, Y.; Yao, Q.; Huang, G.; Zhu, Y.; Chen, X. Colorimetric sensing of chloride in sweat based on fluorescence wavelength shift via halide exchange of CsPbBr3 perovskite nanocrystals. Microchim. Acta 2021, 188, 2. [Google Scholar] [CrossRef]
  31. Wan, S.; Ou, M.; Zhong, Q.; Wang, X. Perovskite-type CsPbBr3 quantum dots/UiO-66(NH2) nanojunction as efficient visible-light-driven photocatalyst for CO2 reduction. Chem. Eng. J. 2019, 358, 1287–1295. [Google Scholar] [CrossRef]
  32. Ou, M.; Tu, W.; Yin, S.; Xing, W.; Wu, S.; Wang, H.; Wan, S.; Zhong, Q.; Xu, R. Amino-Assisted Anchoring of CsPbBr3 Perovskite Quantum Dots on Porous g-C3N4 for Enhanced Photocatalytic CO2 Reduction. Angew. Chem. Int. Ed. 2018, 57, 13570–13574. [Google Scholar] [CrossRef]
  33. Hu, Z.; Liu, Z.; Bian, Y.; Li, S.; Tang, X.; Du, J.; Zang, Z.; Zhou, M.; Hu, W.; Tian, Y.; et al. Enhanced Two-Photon-Pumped Emission from In Situ Synthesized Nonblinking CsPbBr3/SiO2 Nanocrystals with Excellent Stability. Adv. Opt. Mater. 2018, 6, 1700997. [Google Scholar] [CrossRef]
  34. Li, X.; Wang, Y.; Sun, H.; Zeng, H. Amino-Mediated Anchoring Perovskite Quantum Dots for Stable and Low-Threshold Random Lasing. Adv. Mater. 2017, 29, 1701185. [Google Scholar] [CrossRef] [PubMed]
  35. Zhao, W.; Hu, M.; Li, S.; Jiang, Y.; Zhang, X.; Hu, L.; Chen, H. The Solubility of Ternary System RbBr/CsBr-CH3OH/C2H5OH-H2O at Different Temperatures. Acta Phys.-Chim. Sin. 2007, 23, 695–700. [Google Scholar]
Figure 1. TBB aliphatic nucleophilic substitution-guided synthesis of CsPbBr3@SiO2 PNCCs (a) and corresponding potential structure (b).
Chemosensors 10 00170 g001
Figure 2. (a,b) XRD pattern and FT-IR spectra of CsPbBr3@SiO2 PNCCs; (c,d) XPS spectra of CsPbBr3@SiO2 PNCCs and corresponding high−resolution N1s peak.
Chemosensors 10 00170 g002
Figure 3. Morphology and chemical composition of CsPbBr3@SiO2 PNCCs. (a) TEM images of CsPbBr3@SiO2 PNCCs; (b) HRTEM image of CsPbBr3@SiO2 PNCCs. (c) EDX analysis of CsPbBr3@SiO2 PNCCs.
Chemosensors 10 00170 g003
Figure 4. Elemental mapping of Cs, Pb, Br, Si and O of CsPbBr3@SiO2 PNCCs by TEM.
Chemosensors 10 00170 g004
Figure 5. (a) Absorption (red line) and PL (black line) spectra of CsPbBr3@SiO2 PNCCs with a PL maximum at 513 nm, FWHM of 22 nm and PLQY of 60% (inset photograph of CsPbBr3@SiO2 PNCCs in ethanol solution under (left) normal white light and (right) a UV lamp with λ of 365 nm); (b) time-resolved photoluminescence decay of CsPbBr3@SiO2 PNCCs.
Chemosensors 10 00170 g005
Figure 6. (a) Stability comparison between CsPbBr3@SiO2 PNCCs and CsPbBr3 PNCs in ethanol; (b) CsPbBr3@SiO2 PNCCs in ethanol solution react with H2O at different concentrations; (c) homogeneous halide exchanges between CsPbBr3@SiO2 PNCCs and Cl and their reaction optimization (d).
Chemosensors 10 00170 g006
Figure 7. Fluorescence spectra and corresponding fluorescence photographs of the solutions in the presence of different concentrations of chloride from 0–3.0% at 365 nm UV excitation (a); working curve of the established fluorescent wavelength shift for the sensing of chloride in the range from 0 to 3.0% (b), as well as the corresponding colors for different concentrations of Cl (c).
Chemosensors 10 00170 g007
Table 1. Determination of Cl in sand samples and their recoveries.
SampleEmission Wavelength (nm)Observed ColorCl (%)RSD (%)Added Amount (%)Emission Wavelength (nm)Observed ColorFound
(%)
Recovery
(%)
Sand 1447.0 ± 0.2 Chemosensors 10 00170 i0012.300.330.50438.6 ± 0.1 Chemosensors 10 00170 i0022.794.07
Sand 2492.6 ± 0.2 Chemosensors 10 00170 i0030.591.350.50477.0 ± 0.2 Chemosensors 10 00170 i0041.2110.44
Sand 3506.0 ± 0.1 Chemosensors 10 00170 i0050.0558.290.20500.2 ± 0.2 Chemosensors 10 00170 i0060.29112.85
Publisher’s Note: MDPI stays neutral with regard to jurisdictional claims in published maps and institutional affiliations.

