Article

Microwave-Assisted Synthesis of Schiff Base Metal–Ligand Complexes with Copper and Nickel Centres for Electrochemical In Vitro Sensing of Nitric Oxide in an Aqueous Solution

SensorLab, Department of Chemistry, Faculty of Natural Science, University of the Western Cape, Private Bag X17, Bellville 7535, South Africa
*
Author to whom correspondence should be addressed.
Submission received: 31 March 2022 / Revised: 30 April 2022 / Accepted: 1 May 2022 / Published: 6 May 2022

Abstract

:
Nitric oxide (NO), the smallest signalling molecule known in the human body, keeps blood vessels dilated, controls blood pressure, and has numerous other health regulatory effects. The use of Schiff base complexes incorporated onto electrodes to make electrochemical sensors has been explored as an effective method for the determination and quantification of nitric oxide in aqueous solutions. Schiff base ligands were complexed with Cu and Ni metal centres using the microwave synthesis method to produce metal–ligand complexes with enhanced capabilites for NO detection. The electrical current generated at the anode is directly proportional to NO concentrations in the solution through its oxidation to HNO3. Various characterisation techniques were implemented to verify the integrity of each step of metal–ligand synthesis as well as the final product produced, using FT-IR, UV-VIS, and TGA. The as-synthesised Schiff base complexes were electrodeposited on screen-printed carbon electrodes (SPCE) and electrochemically evaluated in a 0.1 M PBS. Furthermore, metal complexes were screened for their in vitro activity towards NO detection in an aqueous solution (PBS). The results show that the investigated sensors (SPCE/Ni-BPND and SPCE/Cu-BPND) respond positively toward NO detection. It was, therefore, identified that the two sensors also do not differ significantly in terms of precision, sensitivity, and lowest detection limit. The sensor strategies demonstrate the NO limits of detection of 0.22 µM and 0.09 µM, and they also demonstrate sensitivity values of 16.3 µA/µM and 13.1 µA/µM for SPCE/Cu-BPND and SPCE/Ni-BPND sensors, respectively.

1. Introduction

Nitric oxide (NO) is the only endogenous smallest and simplest biologically active molecule that controls almost every cellular and organ function in the mammalian body. NO in mammals is manufactured by the action of various NO synthase enzymes [1,2]. Any defects in the NO pathway lead to the development of several pathophysiological states, which may include, hypertension, stroke, cardiac failure, diabetes, etc. Furthermore, NO has also been associated with several diseases, such as cancer, sepsis, multiple sclerosis, and various autoimmune diseases which include flu, pneumonia, bronchitis, and tuberculosis [3,4,5]. The function of NO in cancer is complicated because it could promote and inhibit the progression of tumours depending on different conditions. High NO levels may result in tumour cell apoptosis, but low level induce cell proliferation by stimulating angiogenesis [6]. Hence, crucial biomarkers in the human body form an important basis for health assessment. Real-time monitoring of NO levels in physiological environments plays a vital role. However, it remains a challenge to accurately measure NO concentrations in physiological environments. This is because of its short half-life (roughly 10 s), low concentrations (nM–μM), high chemical reactivity, and possible interferences by other chemicals in biological systems [7]. Effective NO measurement and quantification thus require adequate sensitivity and fast response time. For years, analytical techniques including spectroscopic and electrochemical methods have been used for NO measurements. Among these methods, electrochemical techniques are considered the most efficient because of high calibration stability, fast response, good sensitivity, better selectivity, and simplicity. Moreover, electroanalytical methods may best be used in vivo and in vitro for in situ real-time measurements. Several spectroscopic methods involve either indirect measurements of byproducts of reactions between NO and other chemical species or employ bulky instruments, which limit them for NO measurements.
Gas-phase NO detection is time-consuming, expensive, and involves high concentrations and the use of numerous reagents. Chemistry contribution has, therefore, contributed a great deal in the synthesis of NO-releasing compounds. These include the commonly used DEA NONOate and other NONOate compounds. NONOates dissociate in acidic solutions to produce NO and, therefore, mimic the measurement of NO-produced by biological systems. Unlike in biological systems, NONOates generate NO that have an extended half-life varying from 2 s to several minutes [8,9]. Of all NONOates, DEA NONOate is the most extensively used NO precursor in NO detection studies due to its ability to release NO in neutral media, providing two moles of NO for each NONOate molecule as illustrated in chemical reaction Equation (1) below.
R2NN(O)NO + H+ → R2NH + 2NO
These NO donor molecules release NO molecules which are electrochemically detected directly as injected into a phosphate buffer solution. For this reason, the research focus in the current study is based on NO species that are suspected to play an important role in cancer biomarkers [10]. NO and its related species demonstrate therapeutic implications, which include both the diagnostic and inhibition of tumour or cancer cells. Studies show that elevated concentrations of NO may be cytotoxic for tumour cells; however, low concentrations may stimulate tumour growth [11,12]. Electrodes modification with metal–ligand Schiff base complexes has recently been recognised as one of the best electrochemical methods employed in the sensing and evaluation of the existence and fate of NO species in aqueous systems.
Ni and Cu are known metal centres surrounded by macrocyclic ligands in enzymes such as urease, nitrite reductase, laccase, hydrogenase, etc. These enzymes participate in the metabolic pathways of NO in the human body [13,14,15,16]. As much as NO electrochemical sensors have been found to be applicable in the detection of NO in vivo and in vitro, the design, use, and limit of detection of the sensor materials remain a challenge [17,18,19]. Hence, sensor materials’ novelty studied in this work relies on the synthesis protocol, which exhibited fabrication simplicity, excellent sensing response features, ligand tuning flexibility, and low cost materials. Flexibility in tuning the material led to an improved limit of detection and highly sensitive NO sensing materials. The as-synthesised materials avoid restrictions experienced by enzymatic systems as the conditions are controlled in vitro. Therefore, this field still needs development since NO is one of the important biological compounds.
Schiff bases and their metal complexes have been studied extensively in various aspects, which include, catalytic, magnetic, spectroscopic, and anticancer properties. Moreover, the studies single out the vital roles played by metal ions in biological systems [20,21]. Moreover, lanthanides Schiff base complexes are said to be effective in cancer diagnosis and therapy. However, copper Schiff base complexes generated from carboxaldehyde are more specific to prostate cancer inhibition. These compounds perform the inhibition process by promoting an imbalance between cell progression inducers and inhibitors which interrupt the cell cycle and finally lead to tumour cells’ death [22,23]. Polymer systems with conjugated –C=C- and –C=N- bonds in their main chains have recently drawn the attention of researchers due to their importance in many aspects. Among these polymers, Schiff base polymers are of considerable interest, since they possess a very good thermal stability, and some of these possess semiconductive and good electroactive properties [24,25]. In addition, these compounds also have a strong binding ability with metal ions to show interesting optical properties.
The choice of proper synthetic routes in designing materials has been a crucial aspect of the development of emerging methodologies for several decades. Furthermore, there is a need for clean, efficient, sustainable, and energy-conserving methods to process chemical reactions. Therefore, in recent years, this has led research to focus on alternative energy sources over conventional heating routes [26,27]. As new technologies are in line with the concept of green chemistry, microwave-assisted synthesis methods provide much-reduced reaction times, increased yields, achieve cleaner reactions, product reproducibility, simplify workups, and promote reaction route selectivity for the preparation of the materials [28,29,30]. In addition, the microwave-assisted method also contributes to energy saving and low waste, and it is in line with environmentally benign materials and protocols unlike conventional heating methods [31,32,33,34]. Therefore, experimental design is a powerful tool for developing experiments and data analysis to accomplish the best yields with the optimum number of trials [35] and minimise interfering species [36].
In this work, we demonstrate materials synthesis, device architectures, and fabrication strategies to accomplish electrochemical sensors capable of NO detection with limits of detection of 0.22 µM and 0.09 µM and sensitivity values of 16.3 µA/µM and 13.1 µA/µM for SPCE/Cu-BPND and SPCE/Ni-BPND sensors, respectively. Real-time NO detection demonstrated herein reveals the potential of NO sensors to be implemented in real sample analysis. This comes as a means of cancer healthcare monitoring assessments due to the complicated roles of NO in the initiation and development of cancer in mammals.

2. Materials and Methods

All commercial reagents were received chemically pure and were of analytical reagent grade. These chemical reagents were purchased from Sigma-Aldrich, Alfa Aesar, and Kimix and were used without further purification. However, the solvent (propanol) used for synthesis was first dried by molecular sieves. Infrared spectra were obtained from a PerkinElmer spectrum two spectrometer. The electronic spectra were recorded using Nicolet evolution 100 UV-Visible spectrophotometer. Electrochemical measurements were recorded using a potentiostat. Microwave reactions were performed on the Anton Paar Multi-wave PRO scientific microwave oven with a rotating platform. The microwave reactions were carried out by controlling the power output and duration of the reaction process. Synthesis and characterisation protocols have further been illustrated in Scheme S1 (see the Supplementary Materials).

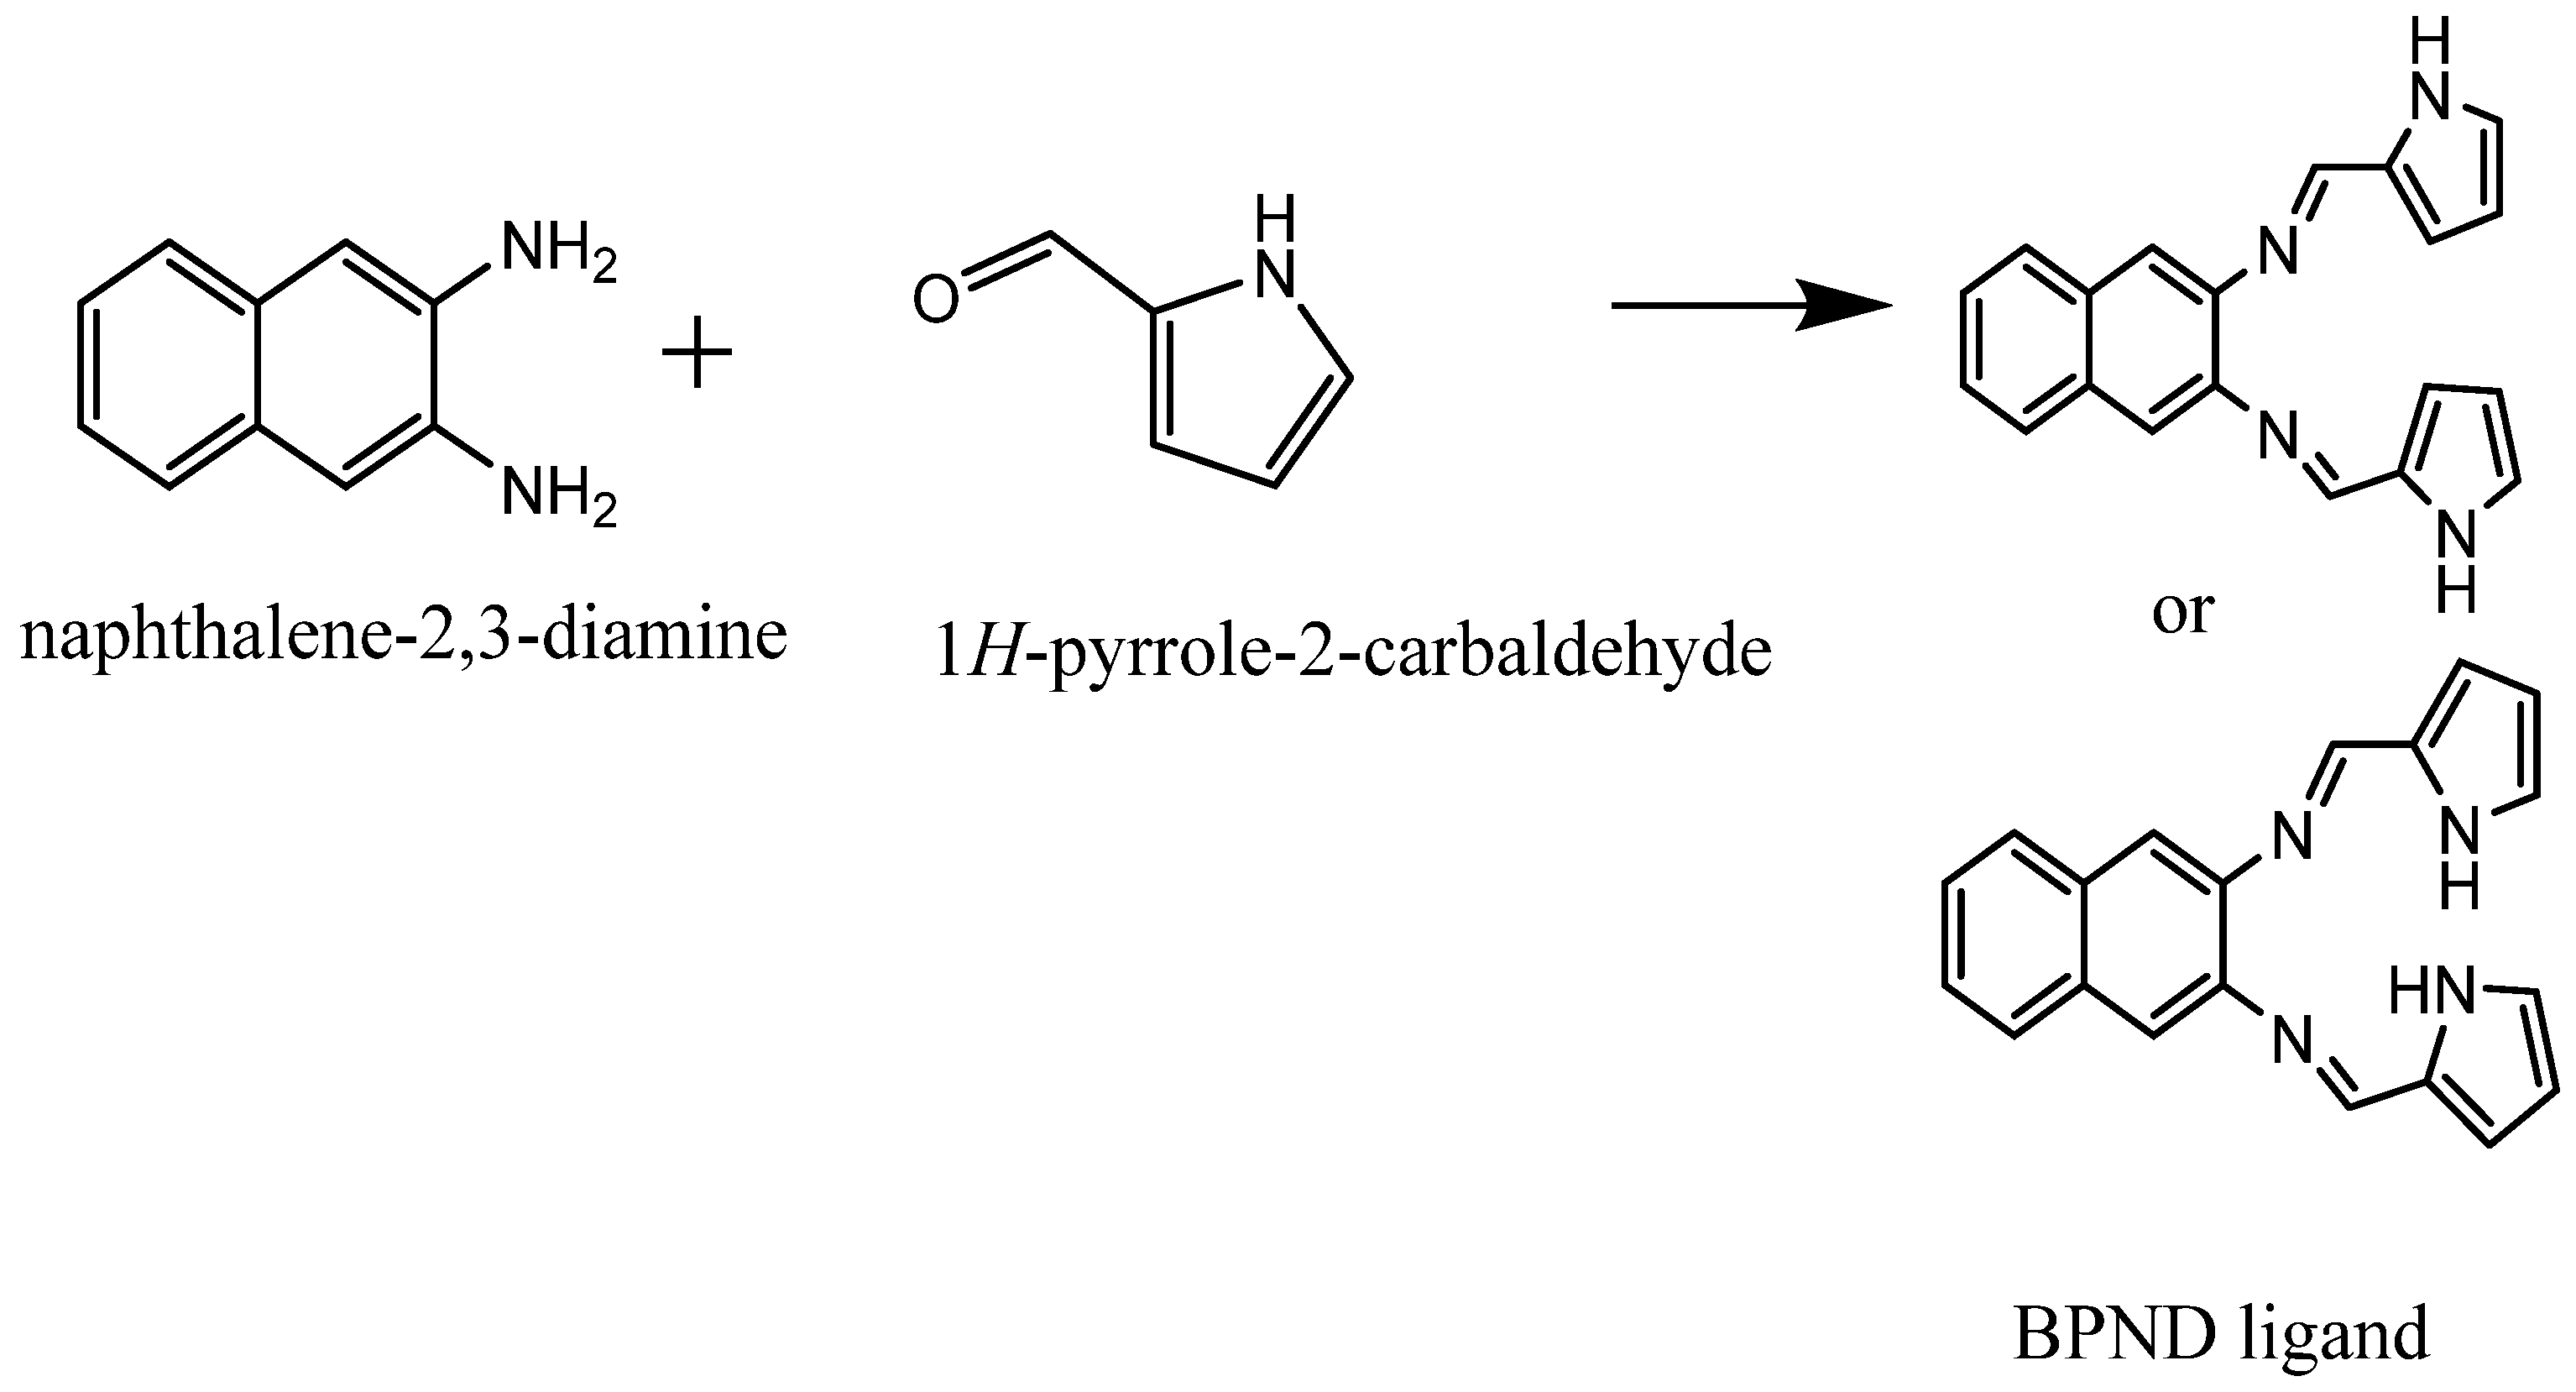
2.1. Synthesis of a Schiff Base Ligand (N,N′-bis(1H-pyrrole-2yl)methylene naphthalene-2,3-diimine)

For the synthesis of (N,N′-bis(1H-pyrrole-2yl)methylene naphthalene-2,3-diimine (BPND)), a homogeneous mixture of 2,3-diamminonaphthalene (1 mmol) and Pyrrole-2-carboxaldehyde (2 mmol) was achieved by thoroughly mixing the two. Second, 10 mL of dry propanol was added to the mixture and then irradiated in a microwave oven under a range of microwave powers of 400 W–700 W for 8 to 15 min (optimisation). The solvent was then evaporated with a rotary evaporator. The resulting solid products were recrystallised with propanol and dried at room temperature. Finally, the products were further purified with a mixture of ethanol and hexane (1:10). Schiff base ligand synthesis protocol has been illustrated in Scheme 1.

2.2. Synthesis of Schiff Base Metal Complexes

A Schiff base (3 mmol) was added to a propionic solution of copper(II) chloride (1.5 mmol). The resulting mixture was irradiated in a microwave oven with the power of 400 W for 13 min. The solid product formed was filtered and washed thoroughly with an ethanol: hexane mixture (1:10). Finally, the metal complex was dried at room temperature [37]. The same procedure was followed for the other metal (Ni).

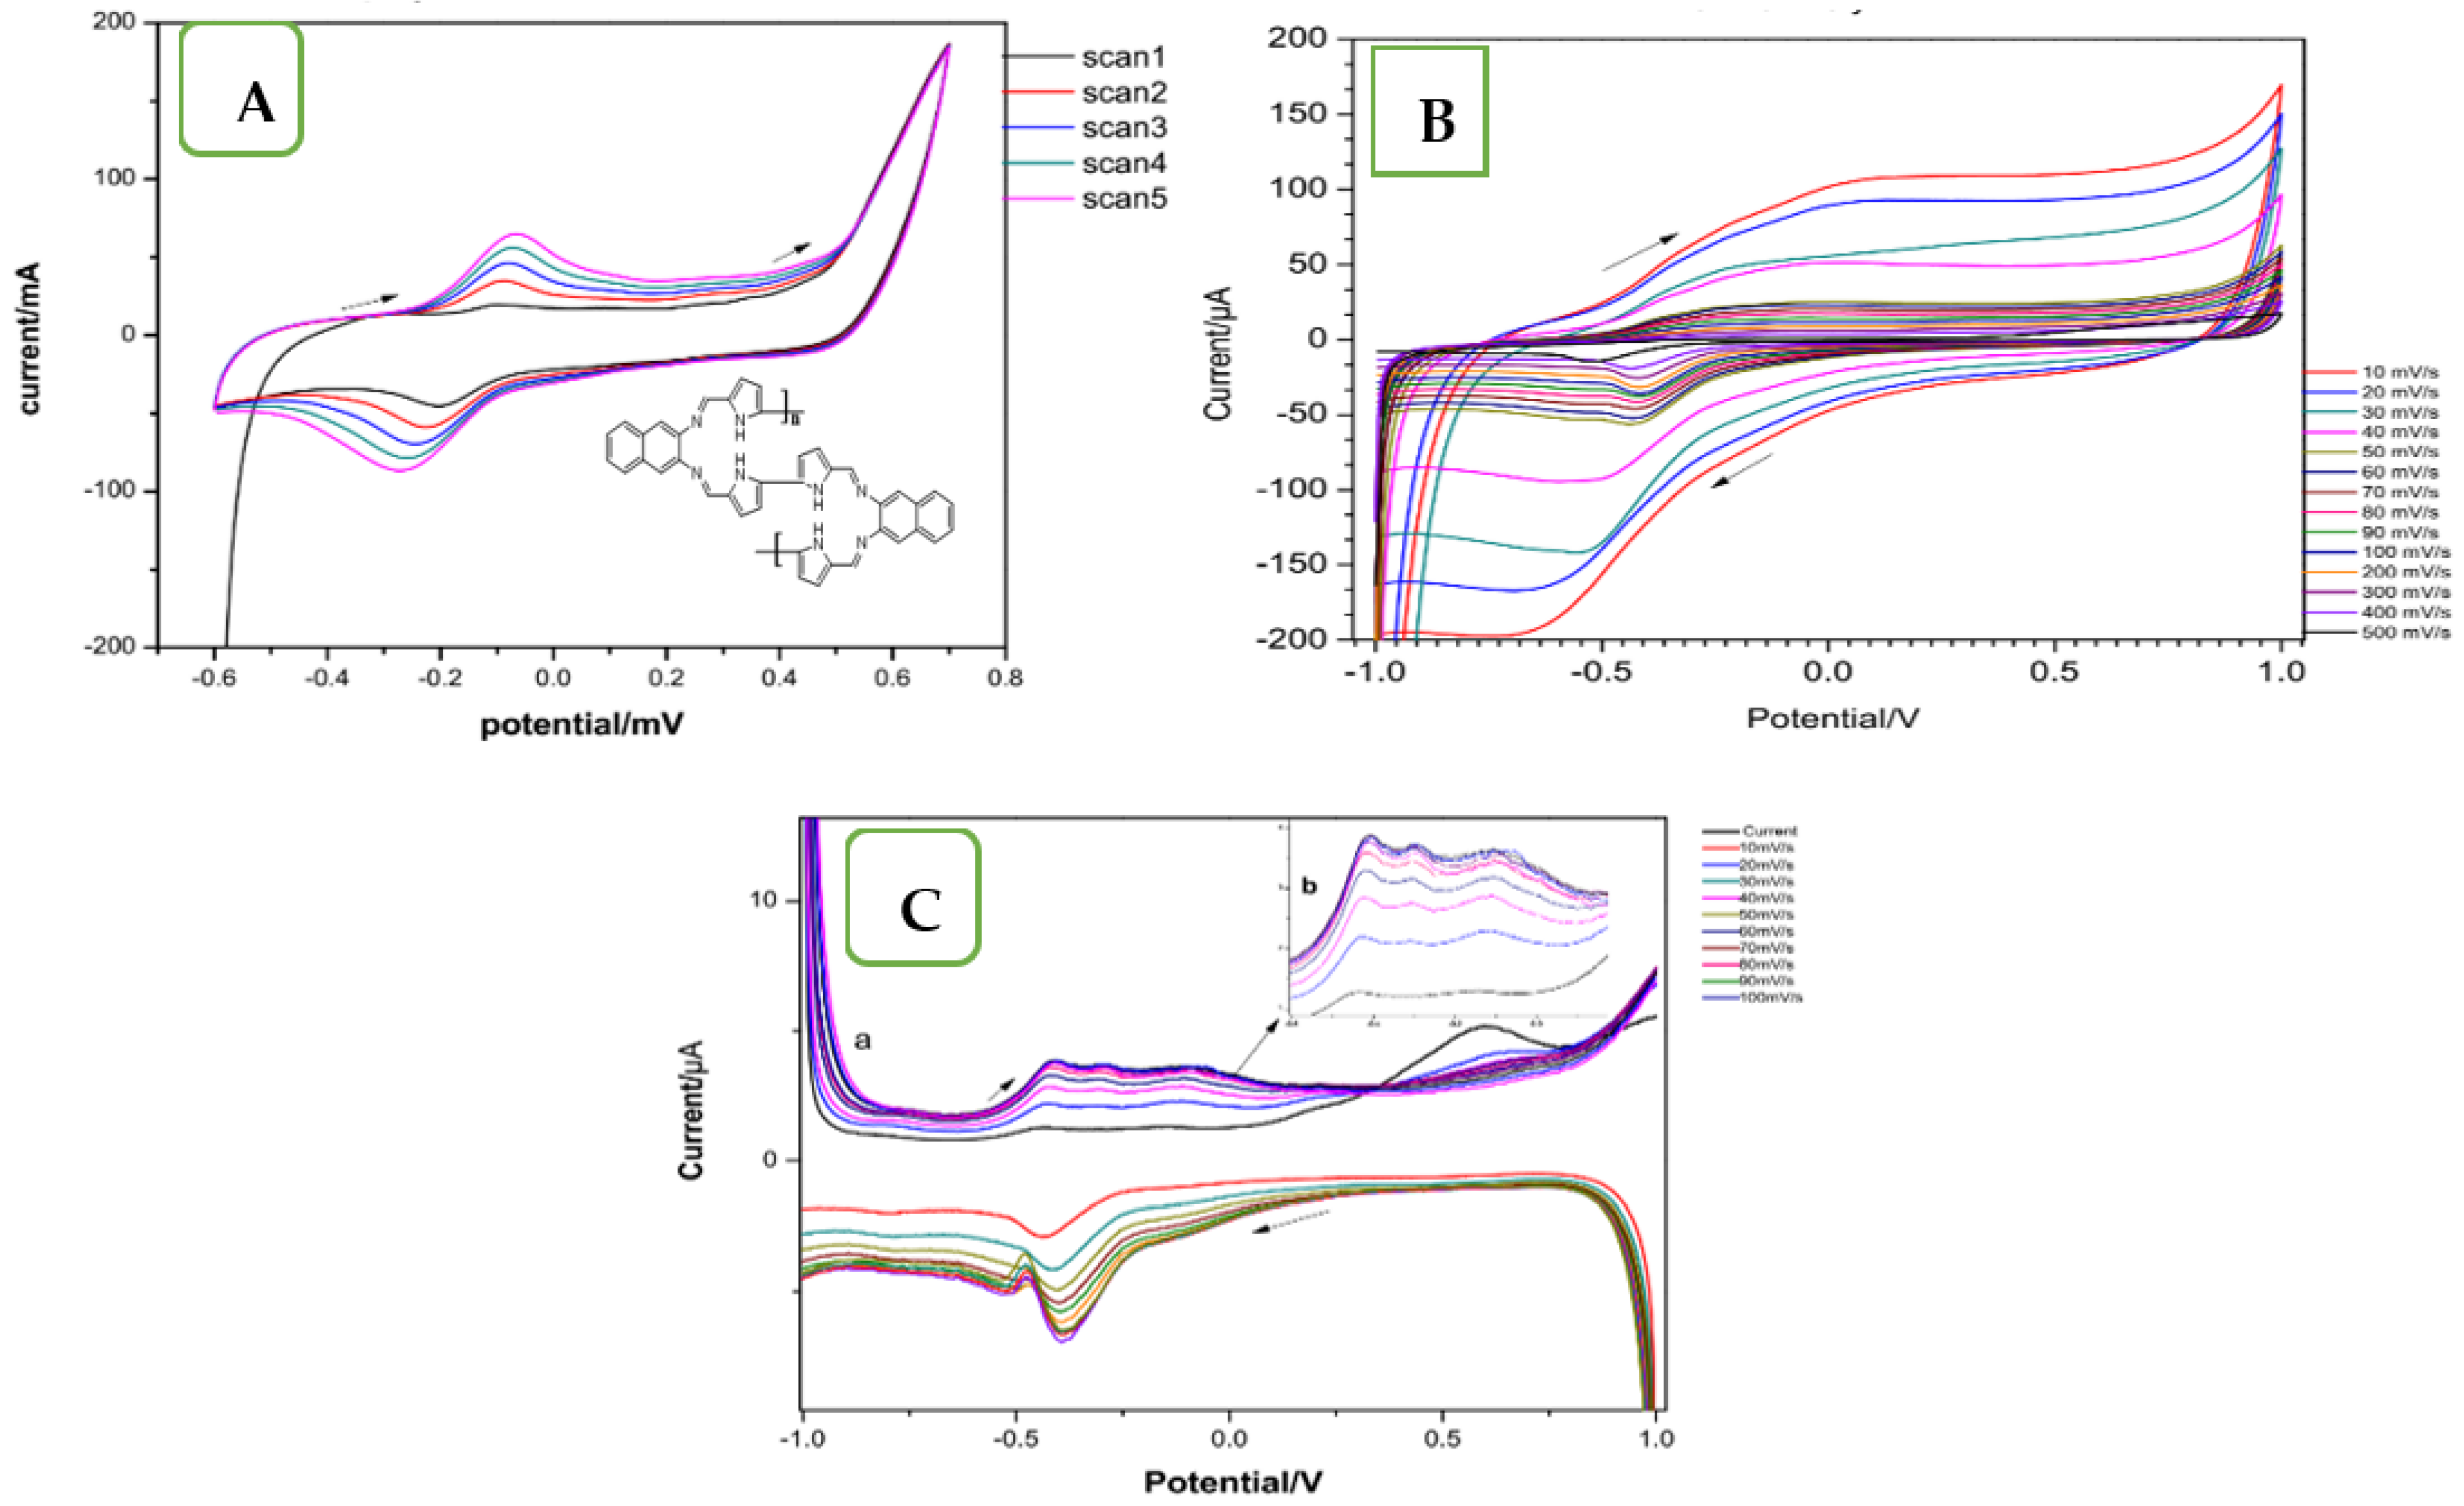
2.3. Electrochemical Synthesis of the BPND Ligand onto SPCE

The BPND deposited electrode material was prepared by the electrodeposition method. This was prepared by first dissolving 6.2 mg (10 mM) of BPND monomer in 2 mL of dimethylformamide (DMF). Second, by adding 2 mL of 0.1 M Hydrochloric Acid (HCl) to the solution to make 4 mL. In this case, HCl was used as a supporting electrolyte. Finally, CV was performed for the linking of BPND subunits to form dimmer or higher-order polymers onto a screen-printed carbon electrode (SPCE). The growth of the polymer films was achieved by CV when applying 5 cycles at the scan rate of 50 mV/s in the potential window of −600 to 700 mV. The polymerised BPND material was characterised by electrochemistry and spectroscopy [38].

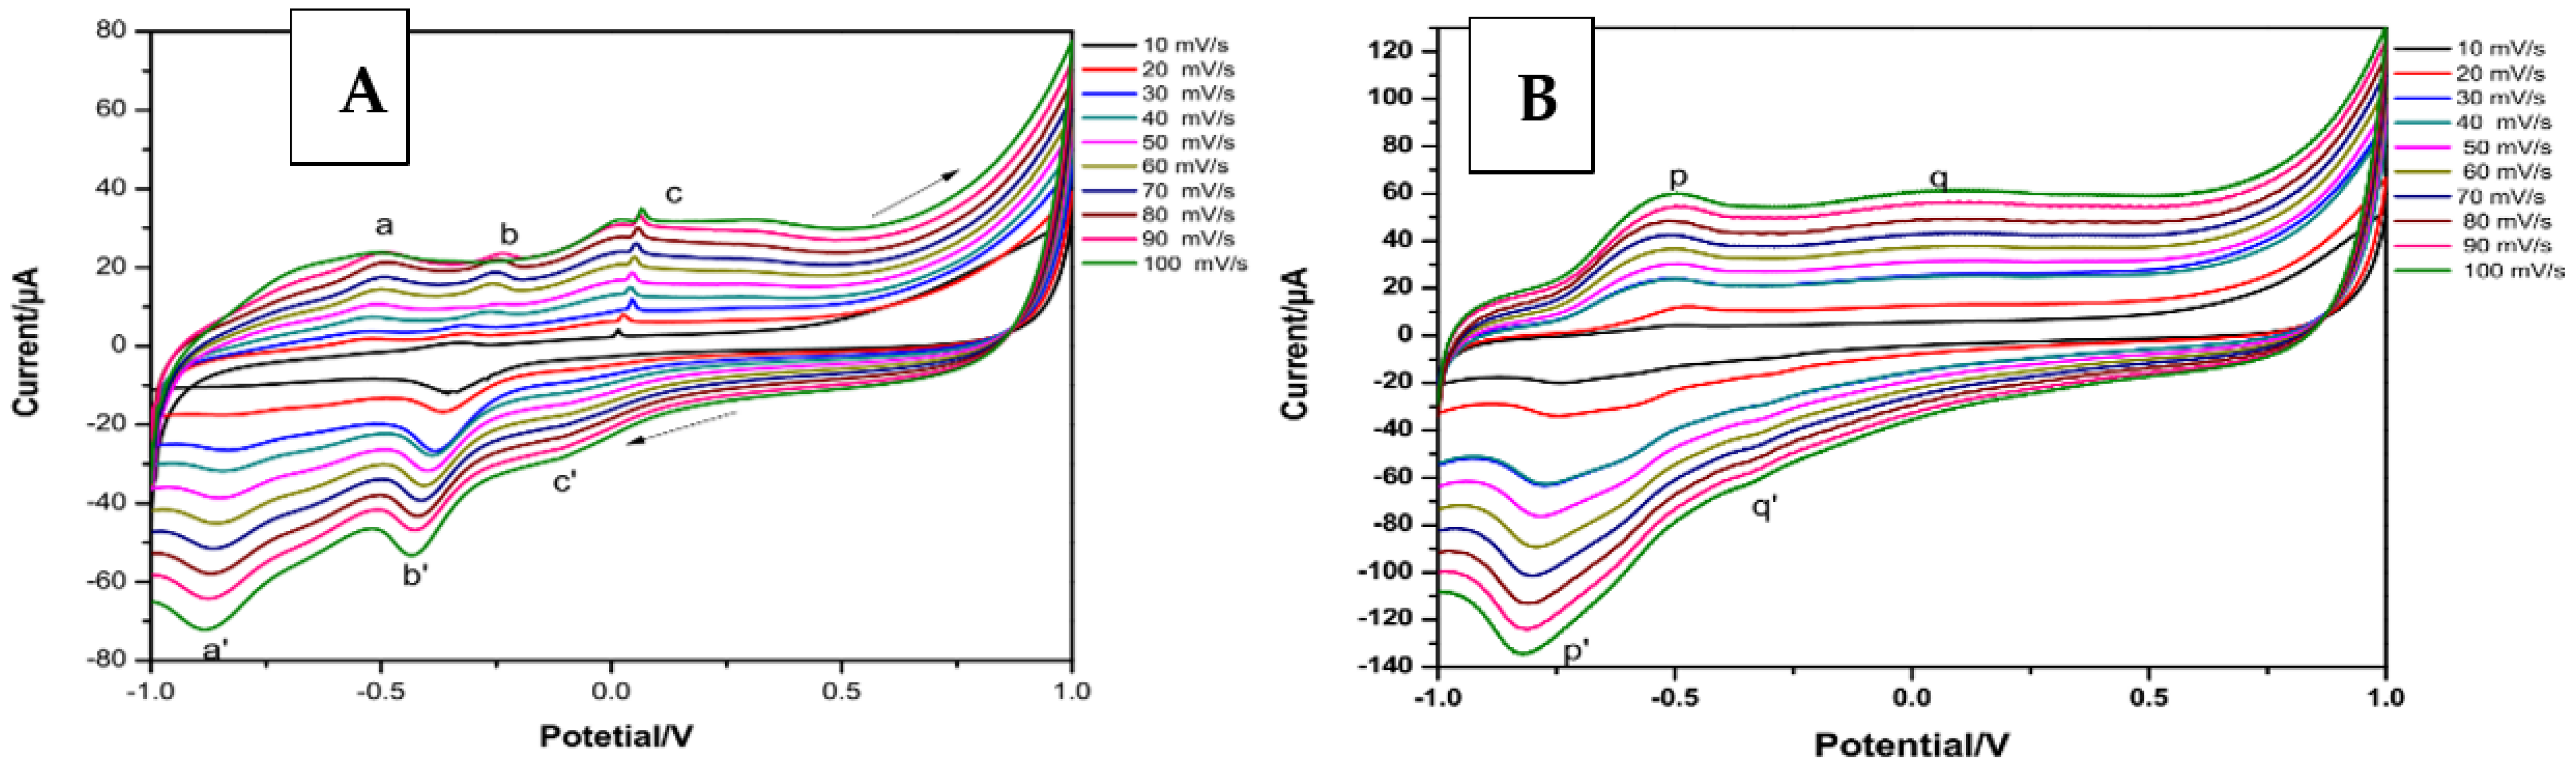
2.4. Electrodeposition of the Metal Complexes onto the Screen-Printed Carbon Electrodes: SPCE/BPND-Ni/Cu

To investigate the redox properties of the metal–ligand complexes, cyclic voltammetry was performed on SPCEs modified with the macromolecules. Ni and Cu are known metal centres in enzymes such as urease, nitrite reductase, laccase, hydrogenase, etc. These enzymes participate in the metabolic pathways of NO in the human body [15,16,39,40]. Hence, the preparation of chemical materials of their mimics has overcome the enzymatic physiological restrictions for their implementation in the chemical analyte recognition. Electrodes were prepared as follows; 2 mM of the copper and/or nickel complex was dissolved in 2 mL DMF and was mixed with 2 mL of 0.1 M NaBF4 supporting electrolyte. The solution was then degassed before the polymerization process. The metal complexes were each electrodeposited onto the SPCEs using the CV technique. The same parameters as those used in the electrochemical deposition of the ligand monomer onto SPCEs were employed. Electrodeposition was performed over a potential window of −1 V to 1 V and was cycled 5 times at a scan rate of 50 mV/s. Cyclic voltammetric measurements were performed by recording voltammograms while varying scan rates from 10 to 500 mV/s. This provided insight into the electron transfer behaviour of metal–ligand complexes.

3. Results

A microwave reactor was used to synthesise (N,N′-bis(1H-pyrrole-2yl)methylene naphthalene-2,3-diimine) (BPND) from 2,3-diamminonaphthalene and Pyrrole-2-carboxaldehyde. The same method was employed for the synthesis of Cu and Ni complexes. The initial synthesis of the ligand resulted in a two-coloured product (yellow and brown), which was reflective of two products formed due to an incomplete chemical reaction. Therefore, the optimisation of the microwave conditions was a crucial step to drive the reaction mechanism to a single product. To optimise reaction conditions, microwave synthesis was performed at different microwave powers (400 W, 500 W, 600 W, and 700 W) and varying the reaction times (8 min, 10 min, 13 min, and 15 min). By employing spectroscopic techniques (UV-Vis and FTIR), thermal, and electrochemical studies, the results of the reactions were validated. It, therefore, has been observed that the best product was obtained in the time range of 13–15 min at 400 W. However, it was also observed in power variations that a power of 500 W at 8 min also results in excellent results. Microwave powers of 600 W and higher result in the degradation of the material. Furthermore, the as-synthesised materials were electrodeposited onto SPCE and evaluated for their activities towards NO detection in an aqueous solution.

3.1. Structural Analysis of the M–Ligand Complexes

The Schiff base ligand binding to metal ions (Cu and/or Ni) has been reported to occur via two azomethine N atoms and two pyrrole N atoms [21,41,42]. The three synthesised compounds (ligand and metal complexes) were insoluble in water and partially soluble in ethanol, which made them easy to purify. Infrared spectroscopy confirmed the bonding of the ligand and ligand to metal ions in the absence of X-ray crystallography. The infrared spectra (Figure S1) displayed spectral data of the Schiff base during optimisation studies and further provided data of both BPND ligand and respective metal complexes after the coordination process (Figure 1).
As shown in Figure S1, IR spectra demonstrated the properties of the as-synthesised BPNDs under different microwave conditions. Therefore, intense sharp vibrational bands in the range of 1607–1637 cm−1 were an indication of the conversion of the amine groups into azomethine (C=N) group. Based on IR spectra (Figure S1A), a conclusion has been made that the increased time was able to produce better results. This was because as time increased from 8 to 15 min, the BPNDs spectra displayed a disappearance of the primary amine bands and experienced less scattering, which was a result of the purity of products. Hence, 15 min at 400 W was considered optimal as mentioned in the early stage. This technique has, however, been complemented by the UV-Vis data to clearly show the effect of time and power.
After metal–ligand complexation, the copper complex exhibited some changes in comparison to BPND. As presented in Figure 1A, the vibrational band at 3151 cm−1 became broad due to the formation of the bond between the metal centre and the nitrogen on pyrrole moiety, which has been reported for the same ligands [43]. There was also a frequency band shift from 3451 cm−1 on the ligand to 3151 cm−1 for metal complexes, which confirmed the coordination of the metal to pyrrole nitrogen. On the other hand, there was a redshift from 1636 cm−1 on BPND to 1595 cm−1 on the copper complex. This shift to a lower frequency on C=N designated a decrease in bond order in this group, which was associated with the involvement of the lone pairs on the azomethine nitrogen to the metal ion. This also signified the decrease in electron density around azomethine nitrogen and the formation of a strong M-N bond [44,45]. In summary, the stated information confirmed the coordination of BPND to the metal centre by both azomethine and pyrrole nitrogen for the Cu complex.
Based on the spectral data shown in Figure 1B, a comparison of the ligand and the nickel complex illustrated a redshift from 1636 to 1595 cm−1 on the azomethine group and 3225 to 2864 cm−1 on the pyrrole moiety. In addition, there was also a broadening of the band assigned to pyrrole nitrogen. All this confirmed coordination in both azomethine and pyrrole groups [41]. The weak band observed around 450 cm−1 was attributed to v(M-N) mode, and they have been reported to be in the range of 500–420 cm−1 in most metal complexes of similar compounds [46,47,48]. Based on the FT-IR results for both metal complexes, it was concluded that the ligand was tetradentate. This was brought about by the fact that coordination takes place at both pyrrole and azomethine nitrogen, which act as donor atoms.

3.2. UV-Vis Spectral Studies

The UV-Vis spectra presented in Figure 2 were used for the illustration of BPND data during the optimisation study. The three intra-ligand absorption bands at 227, 287, and 349 nm were consistent in all spectra except for some intensity and nature of the bands. The short wavelength (227 nm) was attributed to the π π * transition for aromatic moiety (C=C), in which the present case presented aromatic rings of naphthalene. The absorption band at 287 nm was assigned to the π π * transition of the azomethine moiety (C=N), and the absorption band at 349 nm was attributed to the n π * transition of the conjugated azomethine group. These transitions were reported in the literature for the same compounds, although some deviations were caused by the substituents attached [49]. Ghosh et al. (2018) have reported intense intra-ligand transitions below 400 nm to be assigned to alike BPNDs [50]. The observed absorption bands of the compound in UV-Vis spectra complement FT-IR results because they agree on most aspects. As shown in Figure 2A,B, graphical changes which were monitored during optimisation were displayed and the same information has also been presented in Table S1. The displayed data were based on the intensity of the azomethine bond of the BPND ligand after microwave synthesis based on the time variation at a constant microwave power of 400 W (A) and power variation (B).
The information displayed in Figure 2A was employed to designate the significance of time for a low microwave power of 400 W. It portrayed an increase in the population of the azomethine bond formation for the longer times as the intensity was the highest at 15 min relative to shorter times. However, different information for the increase in power intensity was presented in Figure 2B. This has shown that for the synthesis duration of 8 min, the optimum microwave power was 500 W. Beyond this power, the band intensity decreased, which was indicative of the bond-breaking due to the high energy supplied to the system. The graphical information justified UV-Vis data and complemented the data obtained in the FT-IR method for the best choice of appropriate synthetic conditions for BPND.
A comparison of the ligand and metal complex spectra displayed absorption band shifts on the Cu complex spectrum. The first two bands at high energy revealed a blue shift (Figure 3A). The shift was related to the strong electrostatic interaction between the lone pairs of electrons on the ligand to the metal ions. Furthermore, a new shoulder observed at the transition band around 350 nm was linked to the involvement of the azomethine moiety in coordination with the metal ion. Indeed, these changes in transition bands confirmed metal–ligand coordination and agreed with previous studies [45,51]. Taking a closer look at the Cu complex absorption spectra, there was a weak observable absorption band around 409 nm. This transition band was attributed to the d-d transitions of the metal ion (Cu2+). Cu(II) is a d9 metal ion and has only one transition. This is because it has one half-filled orbital; hence, the allowed transition becomes 2E→2T2g only. This absorption band presented a transition of the electron from t2g to eg of the half-filled orbital [52,53]. Finally, coordination has been further confirmed by the narrowing of the absorption bands for the metal complex by comparison to those of a free ligand.
The Ni complex spectrum (Figure 3B) disclosed several new transitions by comparison to the spectrum of the ligand. These were attributed to the ligand, metal–ligand interaction, d-d, and charge transfer transitions. The ligand transitions at 242 nm and 350 nm experienced a redshift to 246 nm and 362 nm. Therefore, the shift to lower energy was linked to the weak electrostatic interaction of the non-bonded electrons with the metal ion. The observed absorption band at 224 nm was assigned to a blue shift linked to a strong electrostatic interaction between the metal ion and the nitrogen on the pyrrole moiety [54]. Furthermore, no observable absorption band shift on the electronic transition at 295 nm. However, the same transition was very weak on the metal complex spectrum. This transition was assigned to the azomethine moiety (C=N) on the ligand spectrum; its disappearance indicates an involvement of the azomethine group in coordination with the metal ion [46,55,56,57]. Transitions between the ligand orbitals have been reported to remain always higher in energy (UV region), while transitions for the d orbitals are lower in energy (visible region). For this reason, two weak transitions observed at 408 nm and 561 nm, which were attributed to d-d transitions of the nickel ion, were indicative of the diamagnetic nature of the complex. Although there were three allowed transitions of Ni ions, the two observable transitions have been assigned to A2g3T2g and A2g3T1g. The third one was obscured by ligand absorption bands [58,59]. In summary, the electronic spectra for both copper and nickel complexes have proven coordination between the metal ions and the BPND ligand. Specifically, the spectra have revealed coordination between the azomethine group and nitrogen of the pyrrole moiety, although the bond orders might vary. These results complemented FT-IR results for M-BPND bond formation.

3.3. Thermogravimetric Analysis

The thermal decomposition characteristics of the BPND ligand, copper(II), and Nickel(II) complexes were studied using the thermogravimetric analysis (TGA) technique under nitrogen for temperatures ranging from 35 °C to 700 °C, as shown by thermograms in Figure 4. Thermal analytical data of a ligand and the metal complexes including their decomposition ranges and mass loss values were further summarised in Table 1.
The ligand presented two stages of dehydration, of which the first step involved a small mass loss of 0.06%, and this was attributed to the small residual water molecules. This was followed by a mass loss of 0.765% of water molecules, which were held to the ligand by intermolecular bonds (Figure 4). In addition, the TG curve of the Cu(II) complex indicated a total mass loss of 43%, which was observed in two stages. The first stage involved a mass loss of 11.1% in the temperature range of 35.8–155.1 °C, which was related to the loss of lattice water molecules, the second stage involved a weight loss of 32.66% in the temperature range of 230.3–435.2 °C, which was attributed to the loss of coordinated water molecules [60,61,62]. The Ni(II) complex followed similar stages with a total mass loss of 53.5%, as presented in Table 1. Based on these findings, it was evident that the lattice and coordinated water molecules were lost at different temperatures, as revealed in Figure 4. However, the mass losses seemed to differ in amounts, which was suggestive of the water holding capacity for the three compounds; hence, different compounds were identified. Furthermore, Tmax (temperature at the maximum rate of decomposition) values were also determined from a single region of the thermographs where mass loss was greatest to assess the stability of three compounds. The BPND ligand with a Tmax of 308.7 °C seemed to be more thermally stable than Cu-BPND and Ni-BPND complexes with Tmax values of 288.2 °C and 257.8 °C, respectively. This difference was associated with the water ligand held by metal complexes.

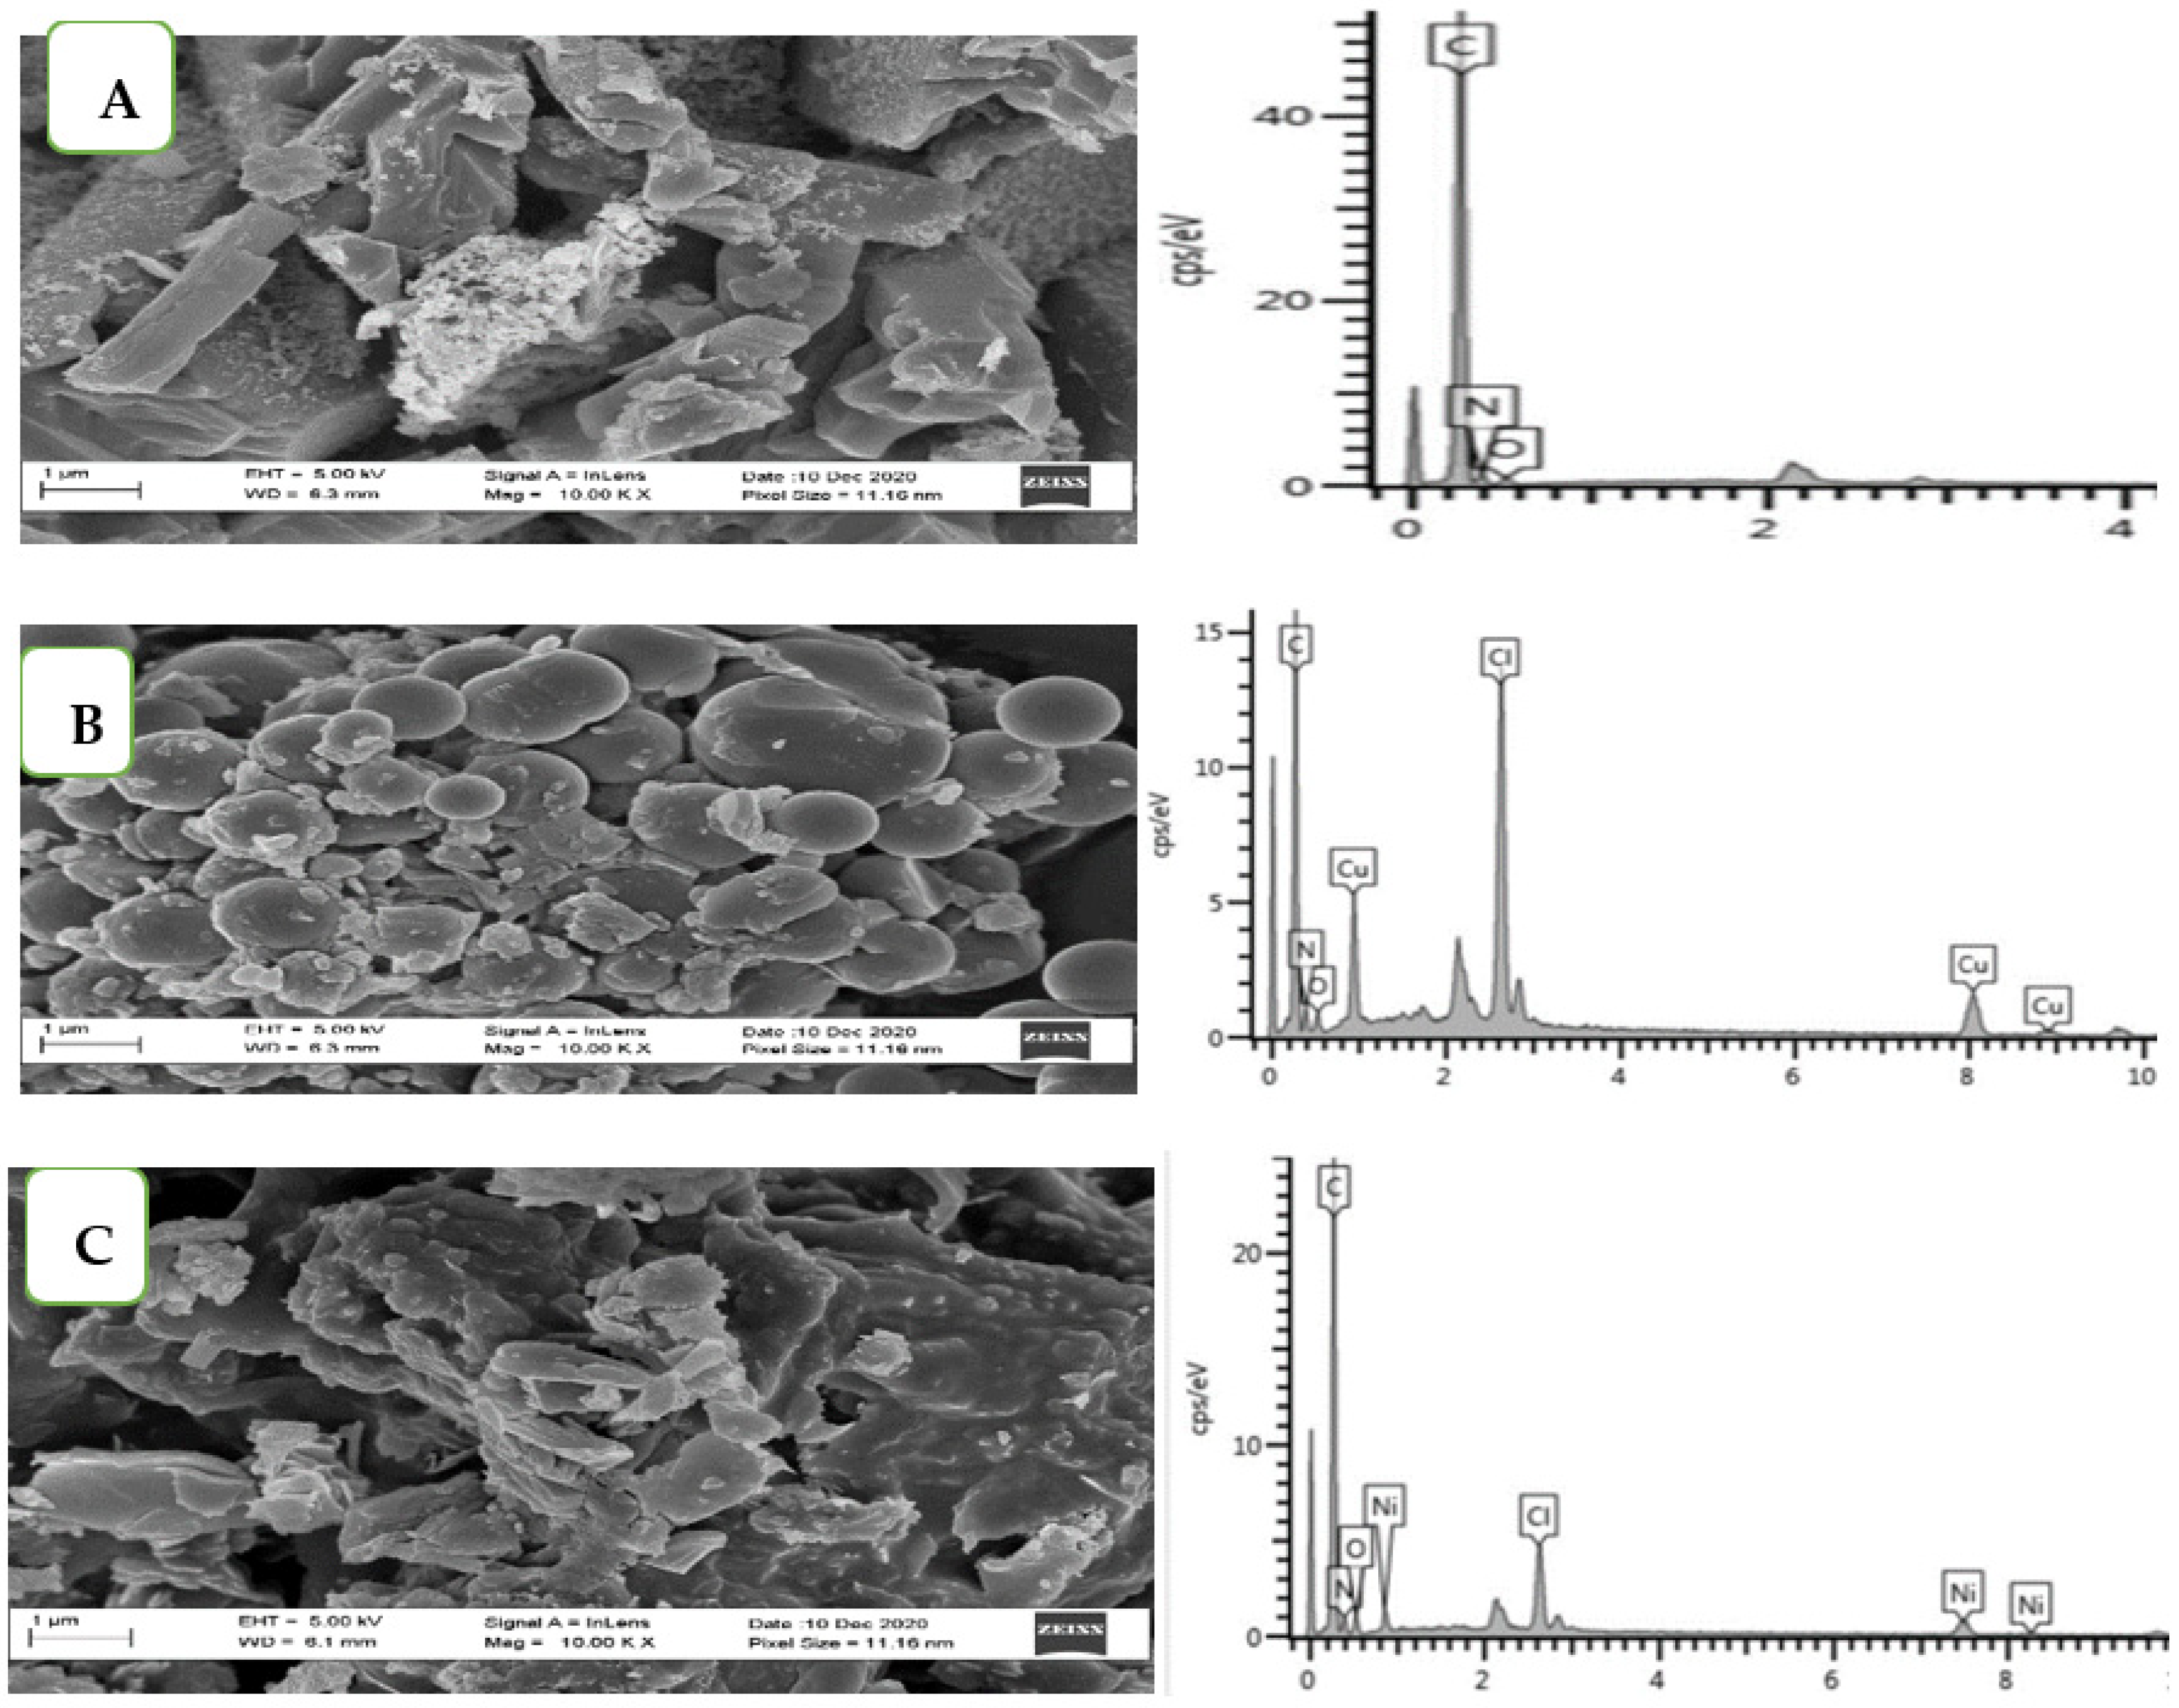
3.4. Morphology of the Ligand and the Metal Complexes

Scanning electron microscope (SEM) analysis was performed on the ligand and metal complex powders to assess the morphology of the synthesised products using SEM. Sample preparation involved a small amount of powder dispersed in alcohol, and then drops of the mixture were dripped onto carbon tapes and then tried for analysis. The analysis was performed by exposing samples to a voltage of 5 kV. The SEM micrographs (Figure 5) showed that the surfaces of the materials were irregular and heterogeneous in nature.
In general, SEM images displayed irregular and heterogeneous surfaces for ligand and metal complexes. The images also revealed some changes in the morphology of the ligand in comparison to the complexes. The BPND ligand (Figure 5A) presented large irregular rod-shaped structures. In some cases, the ligand depicted an irregular broken rock shape morphology with the smaller units randomly distributed over these structures. Cu-BPND morphology (Figure 5B) demonstrated a form of defined globular structures. The diameters presented by these spherical surfaces were approximately 1.13 µm. On the other hand, tubular structures were observed in the case of Ni-BPND (Figure 5C). The formation of bridges between the tubes led to the agglomeration of different sized structures. As shown on corresponding micrographs, EDS spectra of as-synthesised ligand and the metal complexes, respectively, were displayed. As presented in Figure 5, EDS spectra confirmed the successful coordination of metal–ligand synthesis. This was observed by the presence of Cu and Ni in the EDS spectra of as-synthesised metal complexes. The O observed in all the spectra was due to the solvent (Propanol) used in the synthesis process. In addition, a Cl displayed in the metal complexes in spectra (B and C) was from metal ion precursors. These also complemented FTIR and UV-vis data that were implemented earlier to confirm metal–ligand coordination.

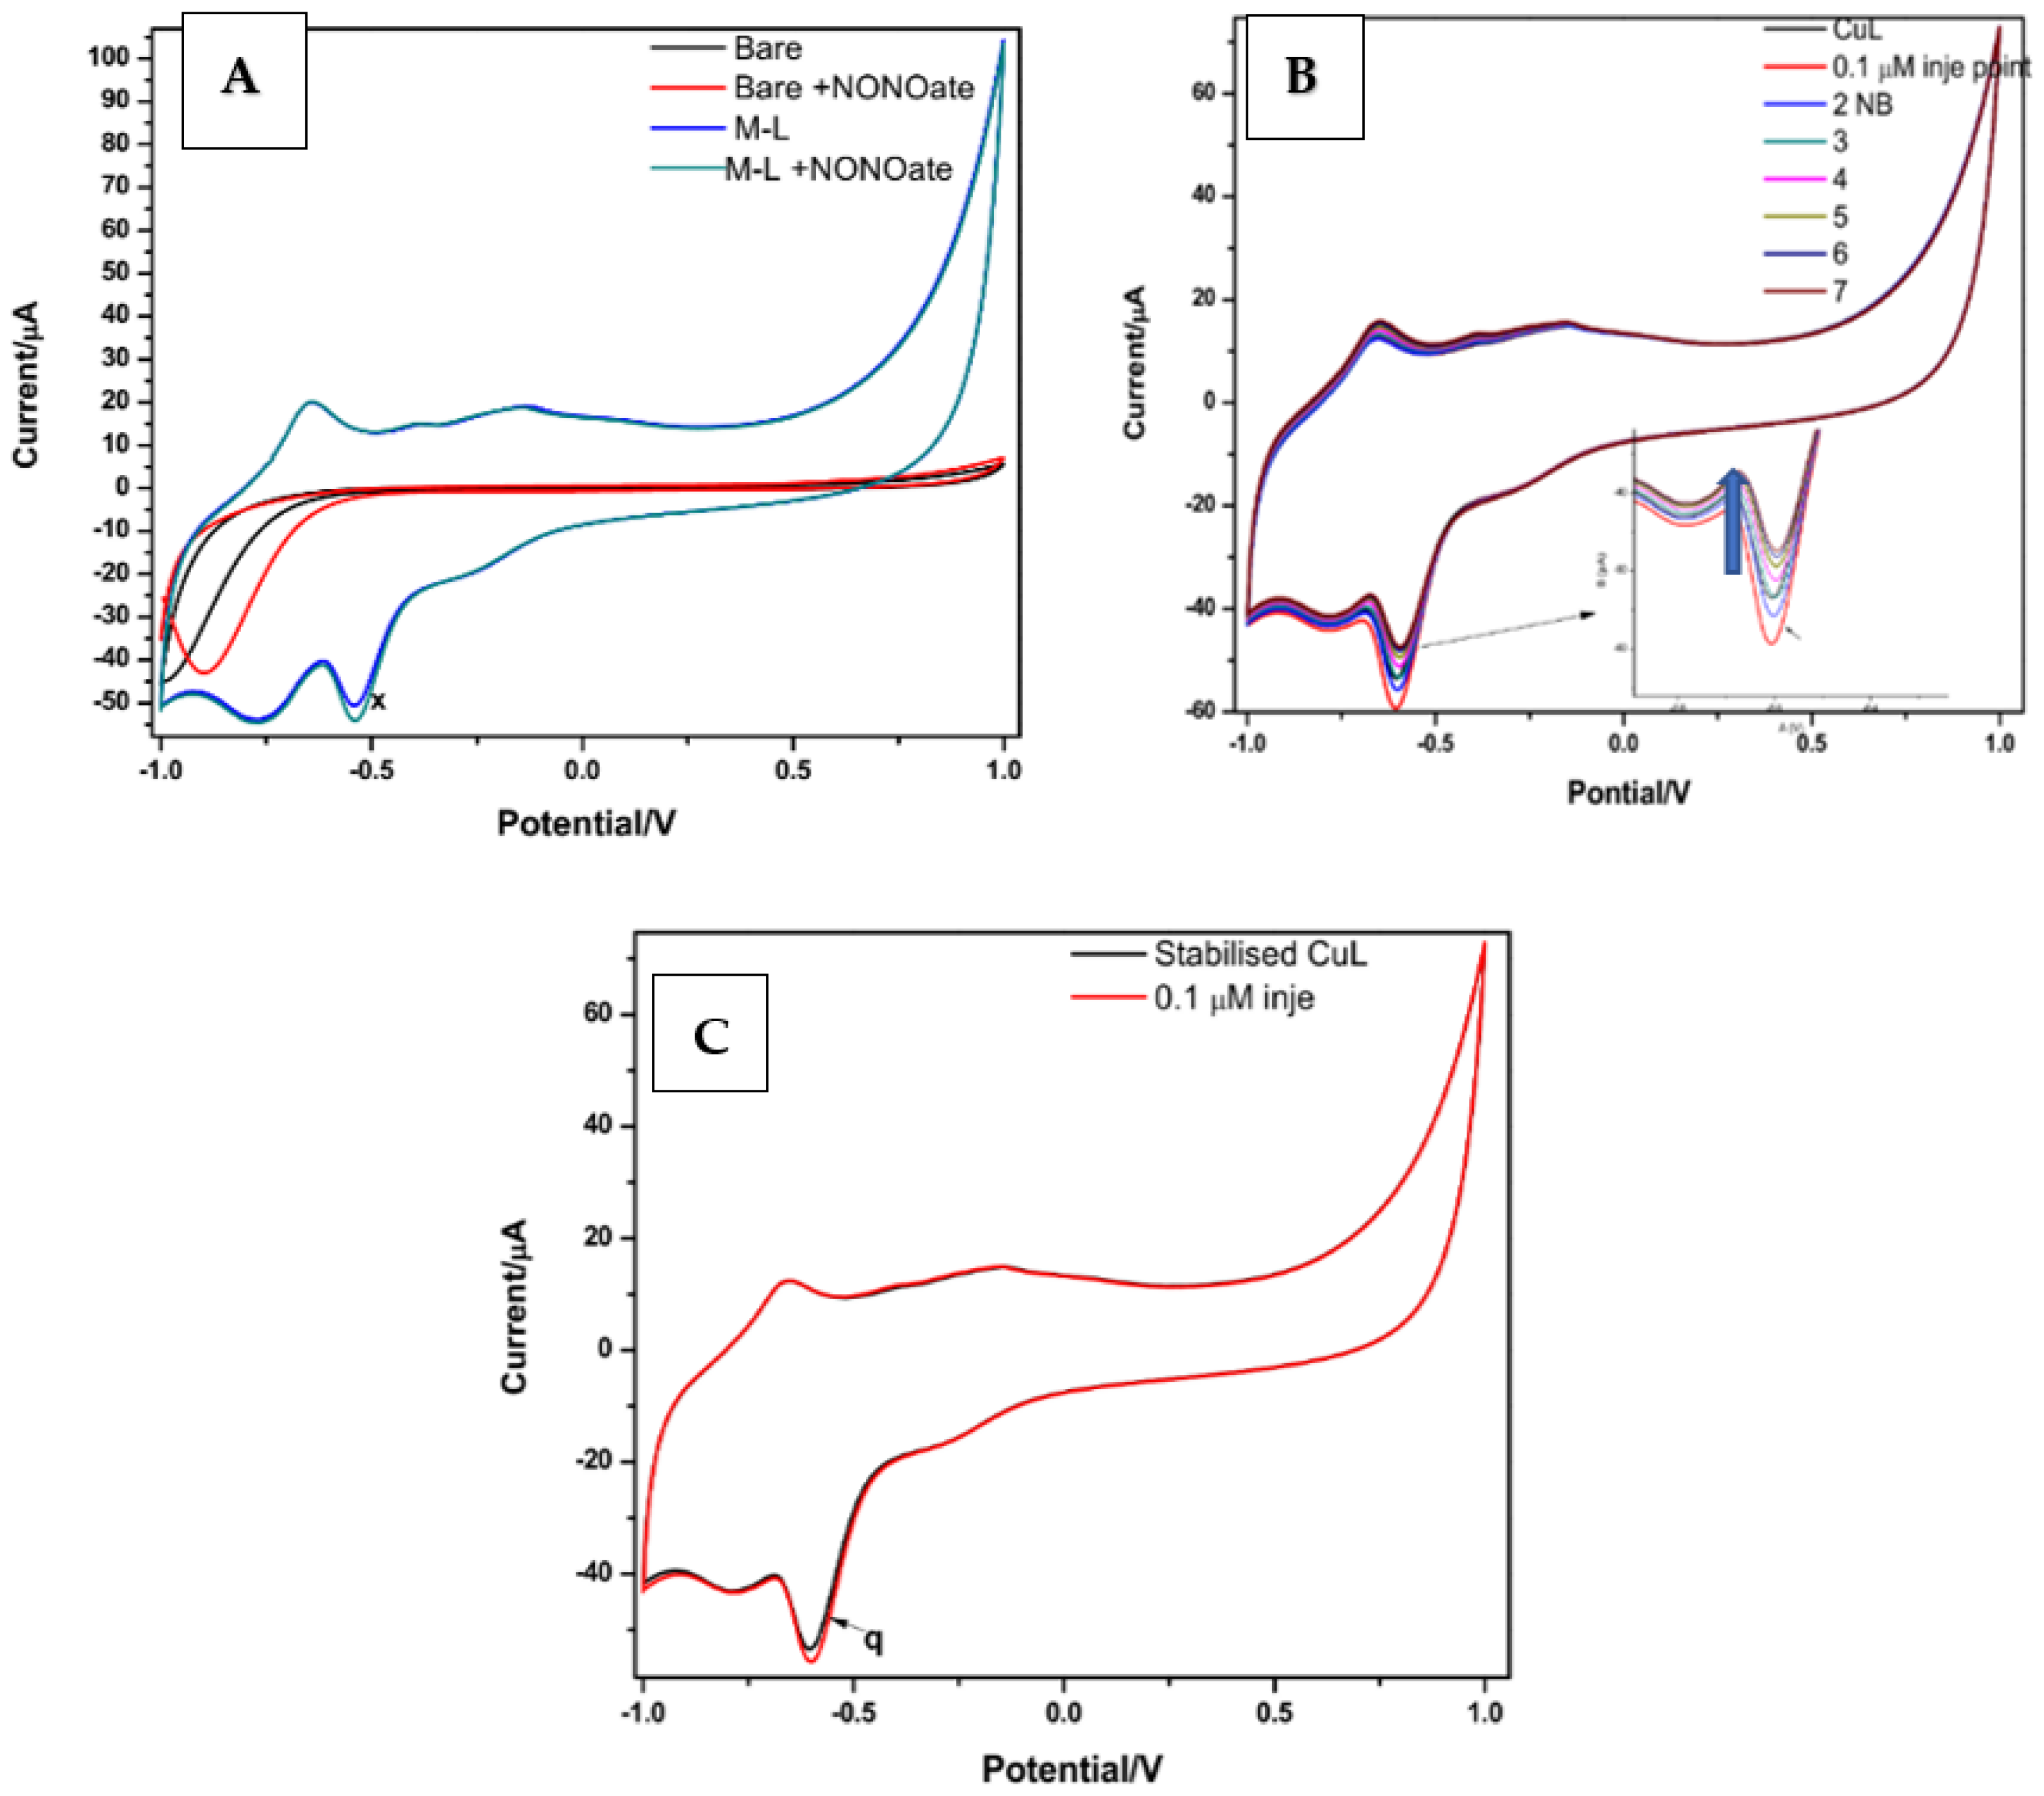
4. Electrochemical Evaluation of BPND and M-BPND Prepared as Thin Films onto SPCEs

Screen-printed carbon electrodes (SPCEs) were prepared by electrodeposition of BPND and M-BPND thin films. They were then evaluated and employed for electrochemical NO detection. Cyclic voltammetry method was used for the deposition of BPND and M-BPND synthesised under optimised microwave-assisted method. The electrodeposition process included the oxidation process, which activated the pyrrole moiety of BPND to form a radical monomer in solution. The radical material was then deposited onto the electrode by reversing the current (reduction). This process was repeated five times to allow the growth of the polymer chain and its subsequent deposition onto the electrode. The deposition was observed as an increase in current at a fixed reductive potential (Figure 6). The polymer length was dependent on the rate of polymerisation. If the rate was sluggish, the monomer radicals would not be deposited on the electrode. In return, this might limit the polymer’s length. Therefore, in the current work, a possibility of the formation of zig zag dimmers or higher-order polymers would be expected, for which they have all been referred to as BPND polymer units. This was further implied in metal complexes electrodeposited onto the SPCE. These materials were deposited at the potential window of −600 mV to 700 mV vs. Ag/AgCl at the working electrode. This potential window has been reported optimum to produce sufficient charge for the monomer deposition on the working electrode [38]. A similar protocol was employed on metal complexes, but a wide potential window of −1 V to 1 V, vs. Ag/AgCl, was employed. The increase in current intensity with small potential shifts across the potential window as the number of CV cycles was increased, which is suggestive of conductive thin film formation.
The investigation of the electrochemical behaviour of the BPND ligand by CV has presented a significant step in the present study. The investigation allowed the determination of various redox couples of the ligand and was able to provide information useful for comparisons with the metal complexes (M-BPND). The electrochemical response of BPND deposited onto SPCE (SPCE/BPND) was presented on CV and SWV. The cyclic voltammogram (Figure 6B) of this ligand exhibited two oxidation peaks, which were integrated into one broad peak at Epa1 = −0.045 V and Epa2 = −0.090 V. These were consistent at low scan rates (20–100 mVs−1). Nevertheless, there were positive potential peak shifts on higher scan rates (200–500 mVs−1). The two current peaks were attributed to the oxidation of the pyrrole moiety resulting in a radical cation BPND•+ and the oxidation of the azomethine group resulting in the dication of BPND2+ of BPND, respectively [63,64]. Nonetheless, the reduction sweep has shown one distinct main reduction peak observed at Epc = −0.415 V. However, there were some deviations at high scan rates. These include increased current intensities and peak potential shifts to negative potentials. By comparison with the literature, the observed wave could correspond to a reduction in the oxidised azomethine group, which was discussed for a forward scan, and it was evident that the pyrrole system was irreversible [20,21]. The average peak separation and peak current ratios were given as ΔE = 429 mV/n, and Ipa/Ipc = 0.412 could reflect a quasi-reversible redox process with a formal potential (E°′) of −269 mV.
In comparison to CV, a SWV technique has always been regarded as more sensitive. Therefore, the method was used to complement the CV technique (Figure 6C). The anodic peaks observed at −0.399 V, 0.278 V, and −0.096 V complemented the data obtained from CV where only two current peaks were visible. However, the additional peak was an indication of the involvement of naphthalene in a redox process, as reported in the literature [65]. It has also been reported that the possibility of obtaining a reliable current peak value of naphthalene by CV is limited, while a good signal prevails by SWV [66]. This has shown the advantage of the SWV technique. Moreover, the single peak current observed in the backward sweep was still attributed to the azomethine group since Schiff bases have been found to be prone to the reduction of the C=N bond, forming a saturated amine [42].
The cyclic CV of an electroactive copper(II) complex on SPCE (SPCE/Cu-BPND) depicted in Figure 7A presented a reversible electrochemical behaviour of the redox couple Cu(II)/Cu(I). On the forward anodic scan, the three well-defined oxidation peaks a, b, and c were observed. Similarly, on the reverse sweep, there were three reduction peaks, a′, b′, and c′, which were portrayed. Based on the scan rate of 60 mV/s, the values for the anodic and cathodic peak potentials exhibited by a redox couple a-a′ were Epa = −0.497 V and Epc = −0.856 V, respectively. This first redox couple was attributed to the redox process of the metal centre (Cu(II)/Cu(I)), with the peak separation of ΔE = 359 mV and a peak current ratio of Ipa/Ipc = −0.306. Therefore, if the redox scan was limited to the first oxidation-reduction couple, then a quasi-reversible redox couple with E1/2 = −0.677 V vs. Ag/AgCl was observed. The redox processes of Cu(II)/Cu(I) were not associated with any chemical reactions as the formal potential (E1/2) values were very similar at different scan rates (0.01–0.1 V) [67,68]. However, Cu(I) may highly be unstable in aqueous solutions, which may be associated with many factors including the complexing ligand nature, ability of the binding anions to accept π-electrons, complex geometric structure, etc. In this regard, the stability of the Cu(I) complex was enhanced by the insolubility of the complex in an aqueous solution and the pi system in the ligand structure, which allowed electron back donation favoured by Cu(I) [69,70,71]. The peak couples b-b′ and c-c′ were observed practically at the same potential values as the corresponding CV of the free ligand and were attributed to the redox processes of the azomethine group and a pyrrole ring nitrogen [72,73]. In addition, peak b was found to be well-defined in the complex material while being integrated into one broad peak in a free ligand, which reflected the interaction between the metal ion and the ligand. The formal potential (E1/2) value of −0.726 and specifically −0.689 V at the scan rate of 60 mV/s was comparable to that of −0.677 V obtained from the CV of a free ligand at the same scan rate. The ΔE of the Cu(II)/Cu(I) redox couple was 141 mV. This ΔE magnitude was larger than could be expected for a one-electron transfer process. Therefore, it reasonably revealed a quasi-reversible electrochemical process.
The Ni(II) complex deposited onto SPCE (SPCE/Ni-BPND) demonstrated both anodic and cathodic waves (cyclic voltammogram of te SPCE/Ni-BPND (B), both obtained in a 0.1 M PBS (pH 7.0) at scan rates 10 to 100 mV/s vs. Ag/AgCl7B). These occurred at approximately −0.476 V and −0.772 V, respectively, and were assigned to Ni(II)/Ni(I) redox couples. It has been reported earlier that, in advancement to larger macrocyclic rings, the Ni(II)/Ni(I) redox process has always seemed to occur with greater ease, while the Ni(II)/Ni(III) redox process requires more energy [74,75]. This complex as shown in Figure 7B displayed a quasi-reversible redox process with a peak separation (ΔE) of 0.2963V, current peak ratio (Ipa/Ipc) of 0.388 and formal potential (E1/2) of −0.624 V. In addition, the ΔE of the Ni(II)/Ni(I) redox couple was found as 186 mV, which further confirmed a quasi-reversible redox process.

4.1. Morphology of Electrode Systems

A high-resolution scanning electron microscope (HRSEM) at a 5.0 kV EHT SEM unit was used for modified electrodes evaluation. The samples were coated with carbon, and images were collected using HRSEM Leo. The magnification of the images was 20 kx. SEM analysis was performed on the ligand, and metal complexes were electrodeposited onto the SPCE surfaces to assess the morphology of the synthesised polymer films. The SEM micrographs of SPCE/BPND (A), SPCE/Cu-BPND (B), and SPCE/Ni-BPND (C) polymeric complexes are displayed in Figure 8.
Based on SEM images (Figure 8), the materials on the electrode surfaces seemed cloudier as compared to the carbon-coated on the unmodified electrode areas. This was an indication of the incorporation of materials on the electrode’s surfaces. Electrode modification has been said to increase both the roughness and active surface area of the electrode. Therefore, the increased roughness and porous net structures of the electrode surface led to a greater electron transfer rate [42,76]. In addition, a large electrode surface area has been reported to enhance an excellent magnitude of current in comparison to a bare electrode surface [42]. The images exhibited the successful deposition of the materials on the surfaces of the electrodes, although partial coverages were observed for the ligand and Cu(II) complex (Figure 8A,B). Better coverage of the electrode surface was observed on the Ni(II) complex-modified SPCE with faceted particles. Particles were agglomerated onto the electrode’s surface (Figure 8C). However, the small spherical agglomerated particles were related to a residual amorphous ligand material. The irregular and heterogeneous morphology of the films could be related to the growth mechanism and geometrical influence of the material; hence, it is suggestive of three-dimensional growth on the surface [77].
The SEM image of SPCE/BPND (A) was particularly found to be different from those of the corresponding metal complexes. The shown film layers may reveal a zigzag continuous polymer of four units or a cluster of dimer units. However, as displayed in Figure 8B,C, the islands of dimer units SPCE/Cu-BPND were portrayed. SPCE/Ni-BPND also displayed the island clusters of dimer units. This was an indication that the insertion of the metal centres played a vital role in changing the structure and nature of the material.

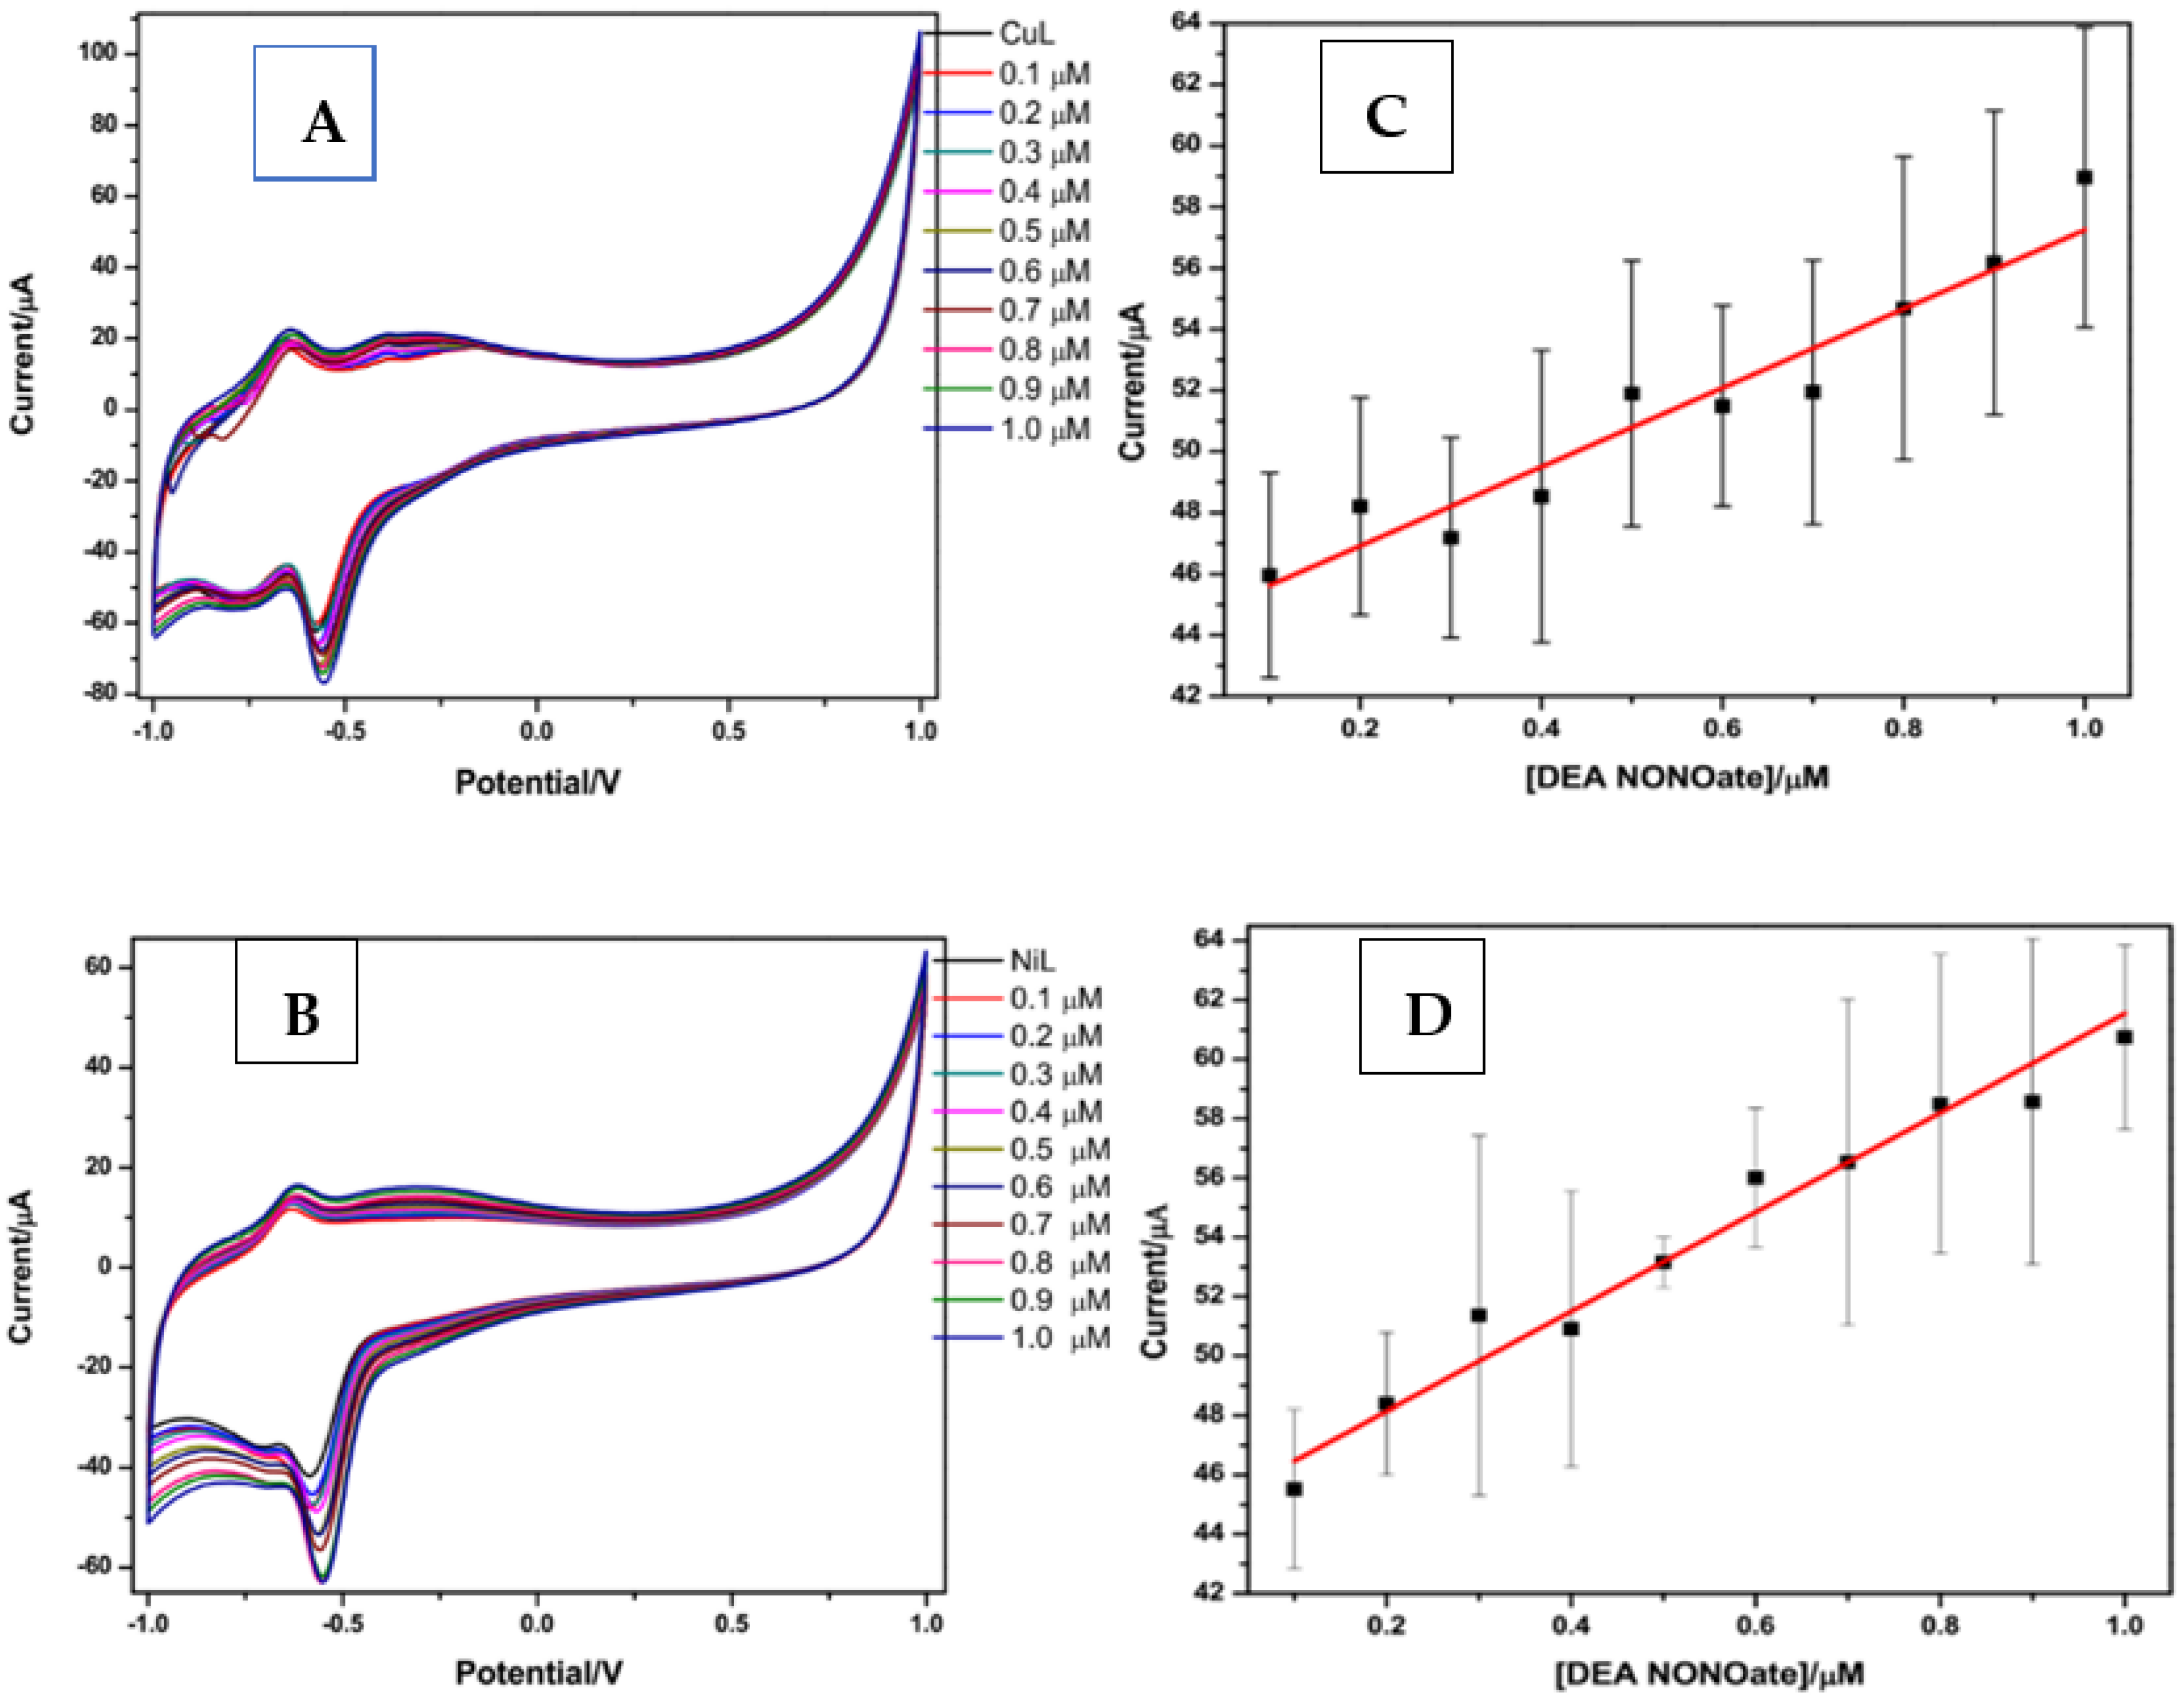
4.2. Analytical Response of Chemical Sensors towards NO Detection

NO is one of the vital chemical species synthesised within the mammalian body by NO synthase. As much as research mostly concentrates on NO free radical (NO), it is also important to consider its anionic (NO) and cationic (NO+) forms as they are chemically related. In contrast to the NO produced endogenously, NO may also be produced exogenously using NO donors, which are chemical compounds that generate NO. These compounds include organic nitrates, sydnonimines, S-nitrosothiols, NONOates, etc. [12,78,79]. The latter is always preferred because of its spontaneous decomposition under physiological conditions (37 °C at pH 7.4) to release two NO moles per every mole of a donor molecule.

4.2.1. DEA NONOate Standard Solutions

Diethylamine NONOate (DEA NONOate) was used as a NO donor for the current detection study. However, NONOates being pH-dependent for their decomposition into 2:1 NO to parent amines do not dissociate in basic solutions. In this regard, a DEA NONOate stock solution (50 mM) was prepared by dissolving the commercially bought DEA NONOate salt in 1 mL of 0.1 M NaOH solution. The stock solution was then divided into 10 vials of 100 µL each. A 0.5 mM sample of DEA NONOate was prepared from a 50 mM stock solution and kept at temperatures < 0 °C in the dark. The release of NO was initiated by injecting different amounts of aliquots (0.1 to 5 µM) of the NONOate stock solution in 4 mL of 0.1 M phosphate buffer solution (PBS, pH 7.2). As NO release has been found rapid in acidic solutions, the use of a PBS of pH 7.2 has been ideal for the rate retardation of DEA NONOate dissociation as a means of providing time for a detection process. Again, this pH did not lead to fouling of the electrodeposited materials on the electrode’s surfaces as acidic solutions could.

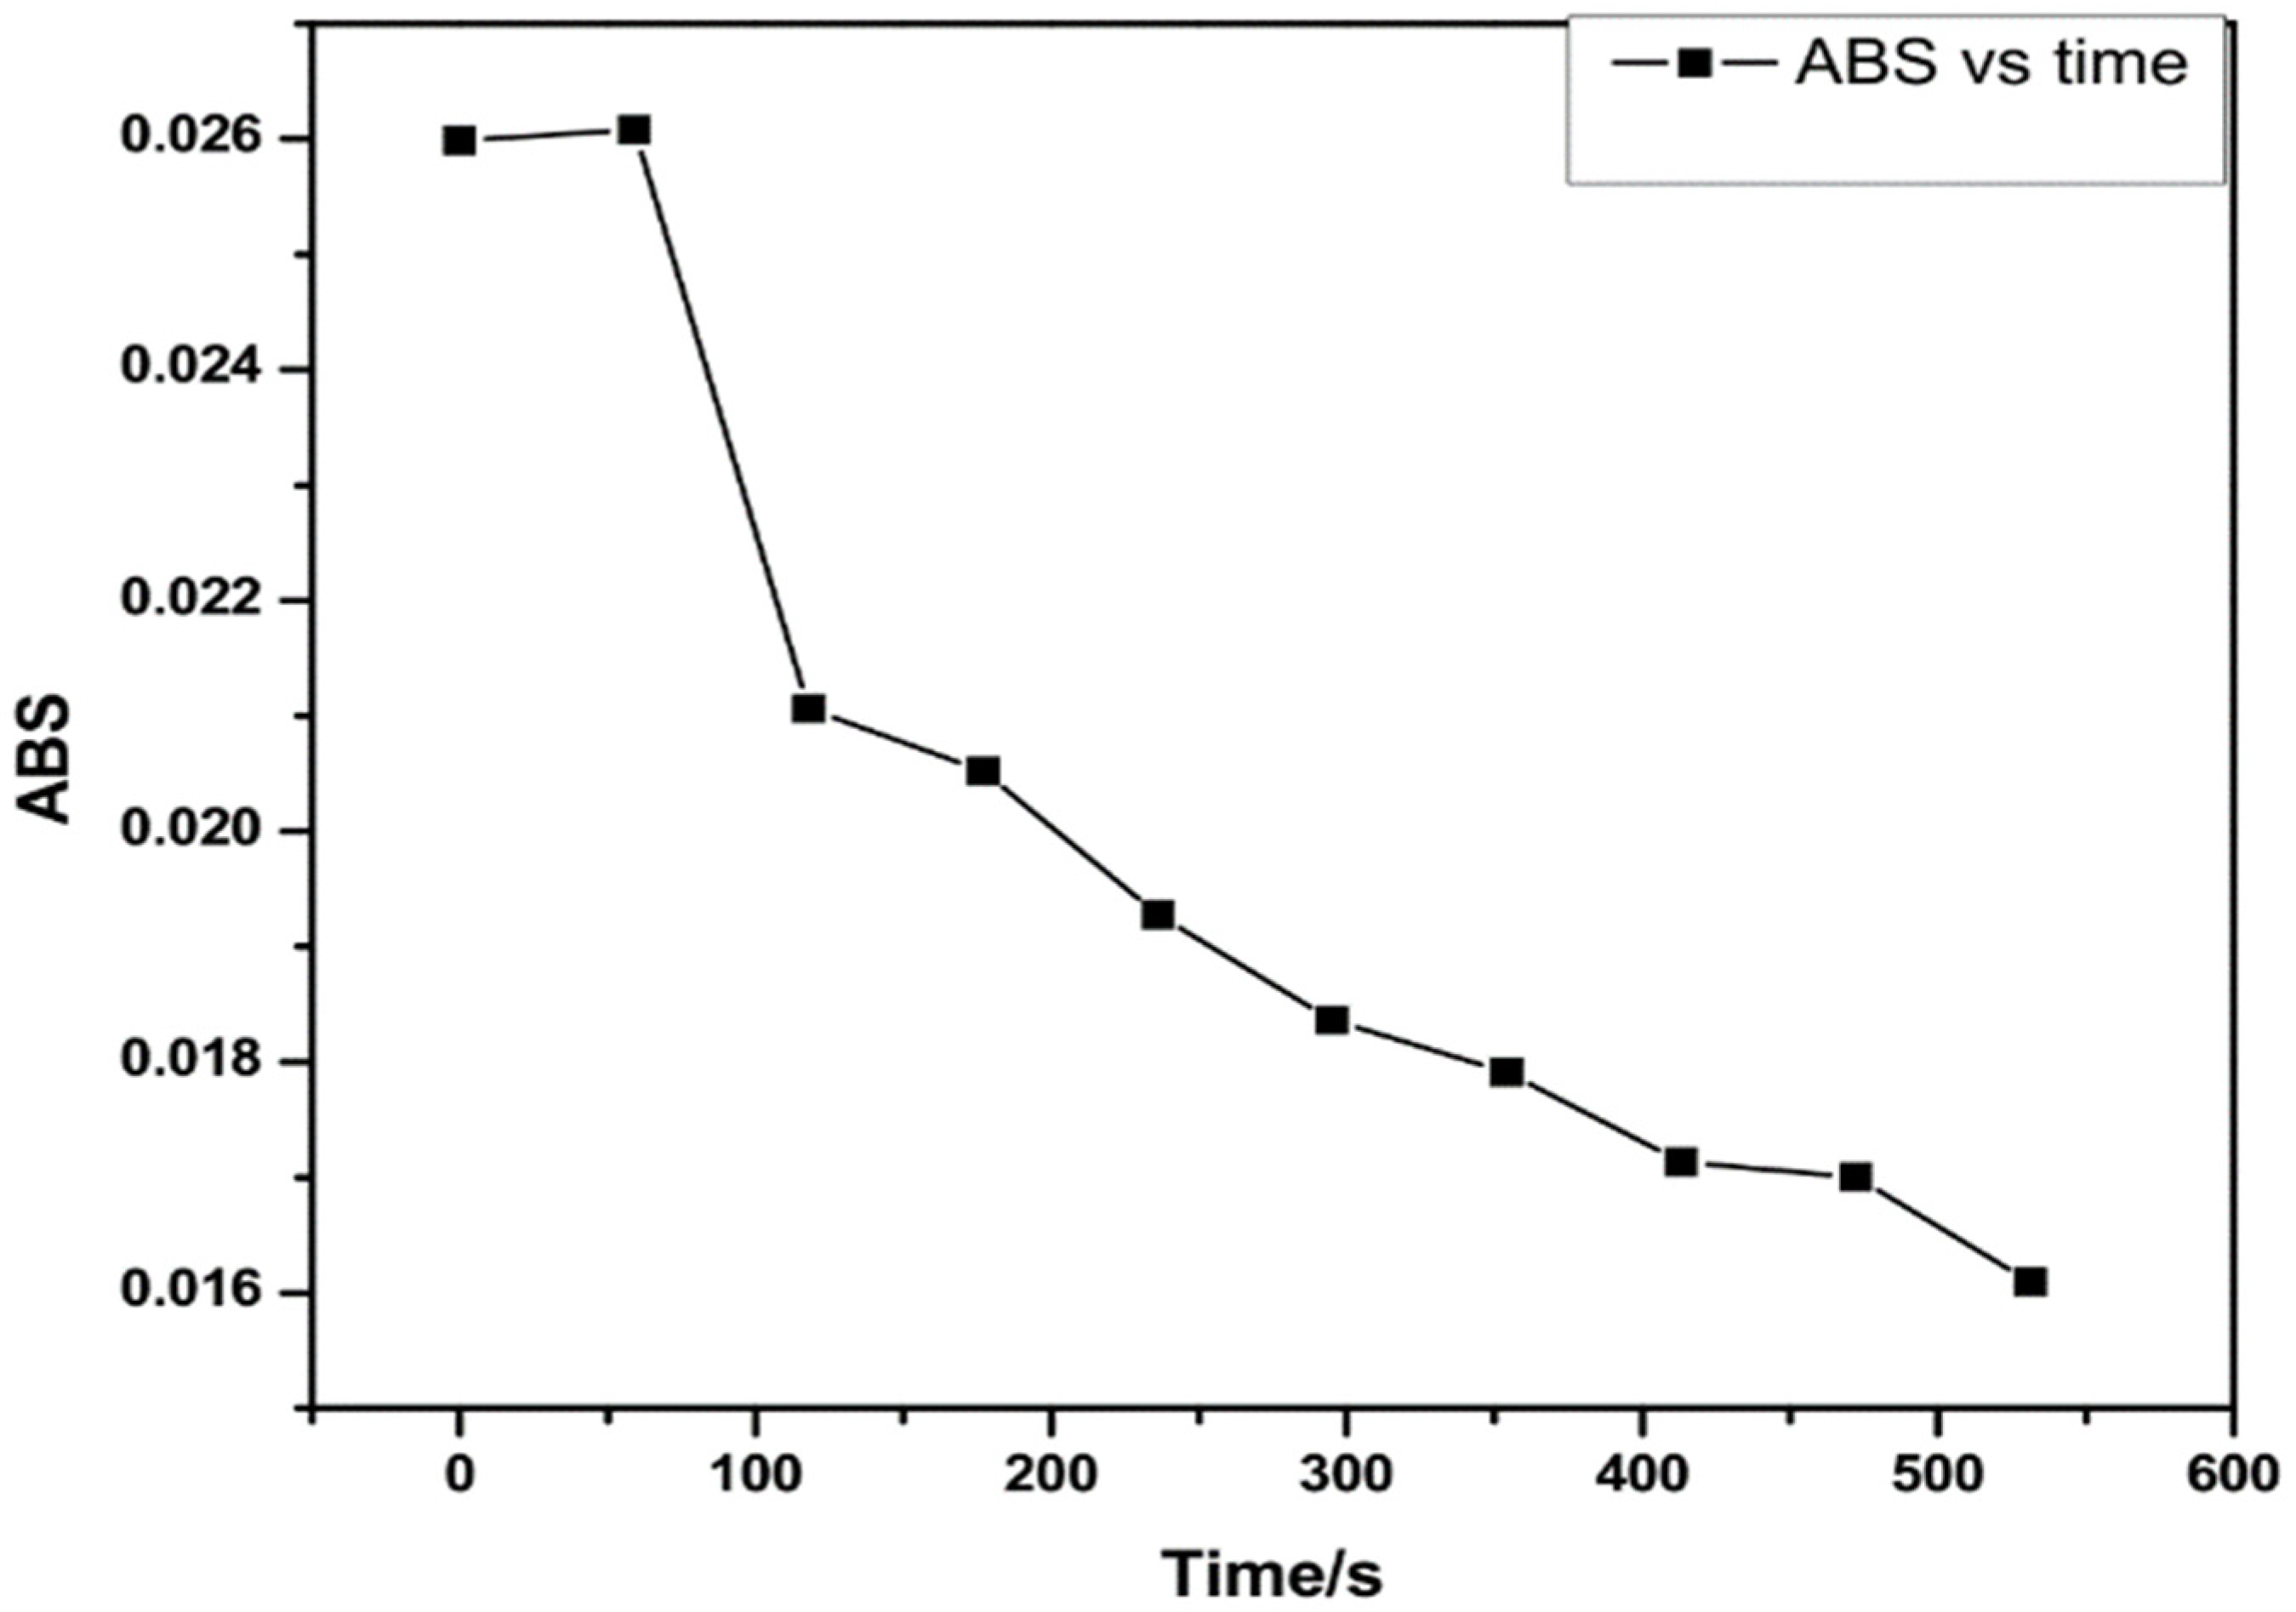
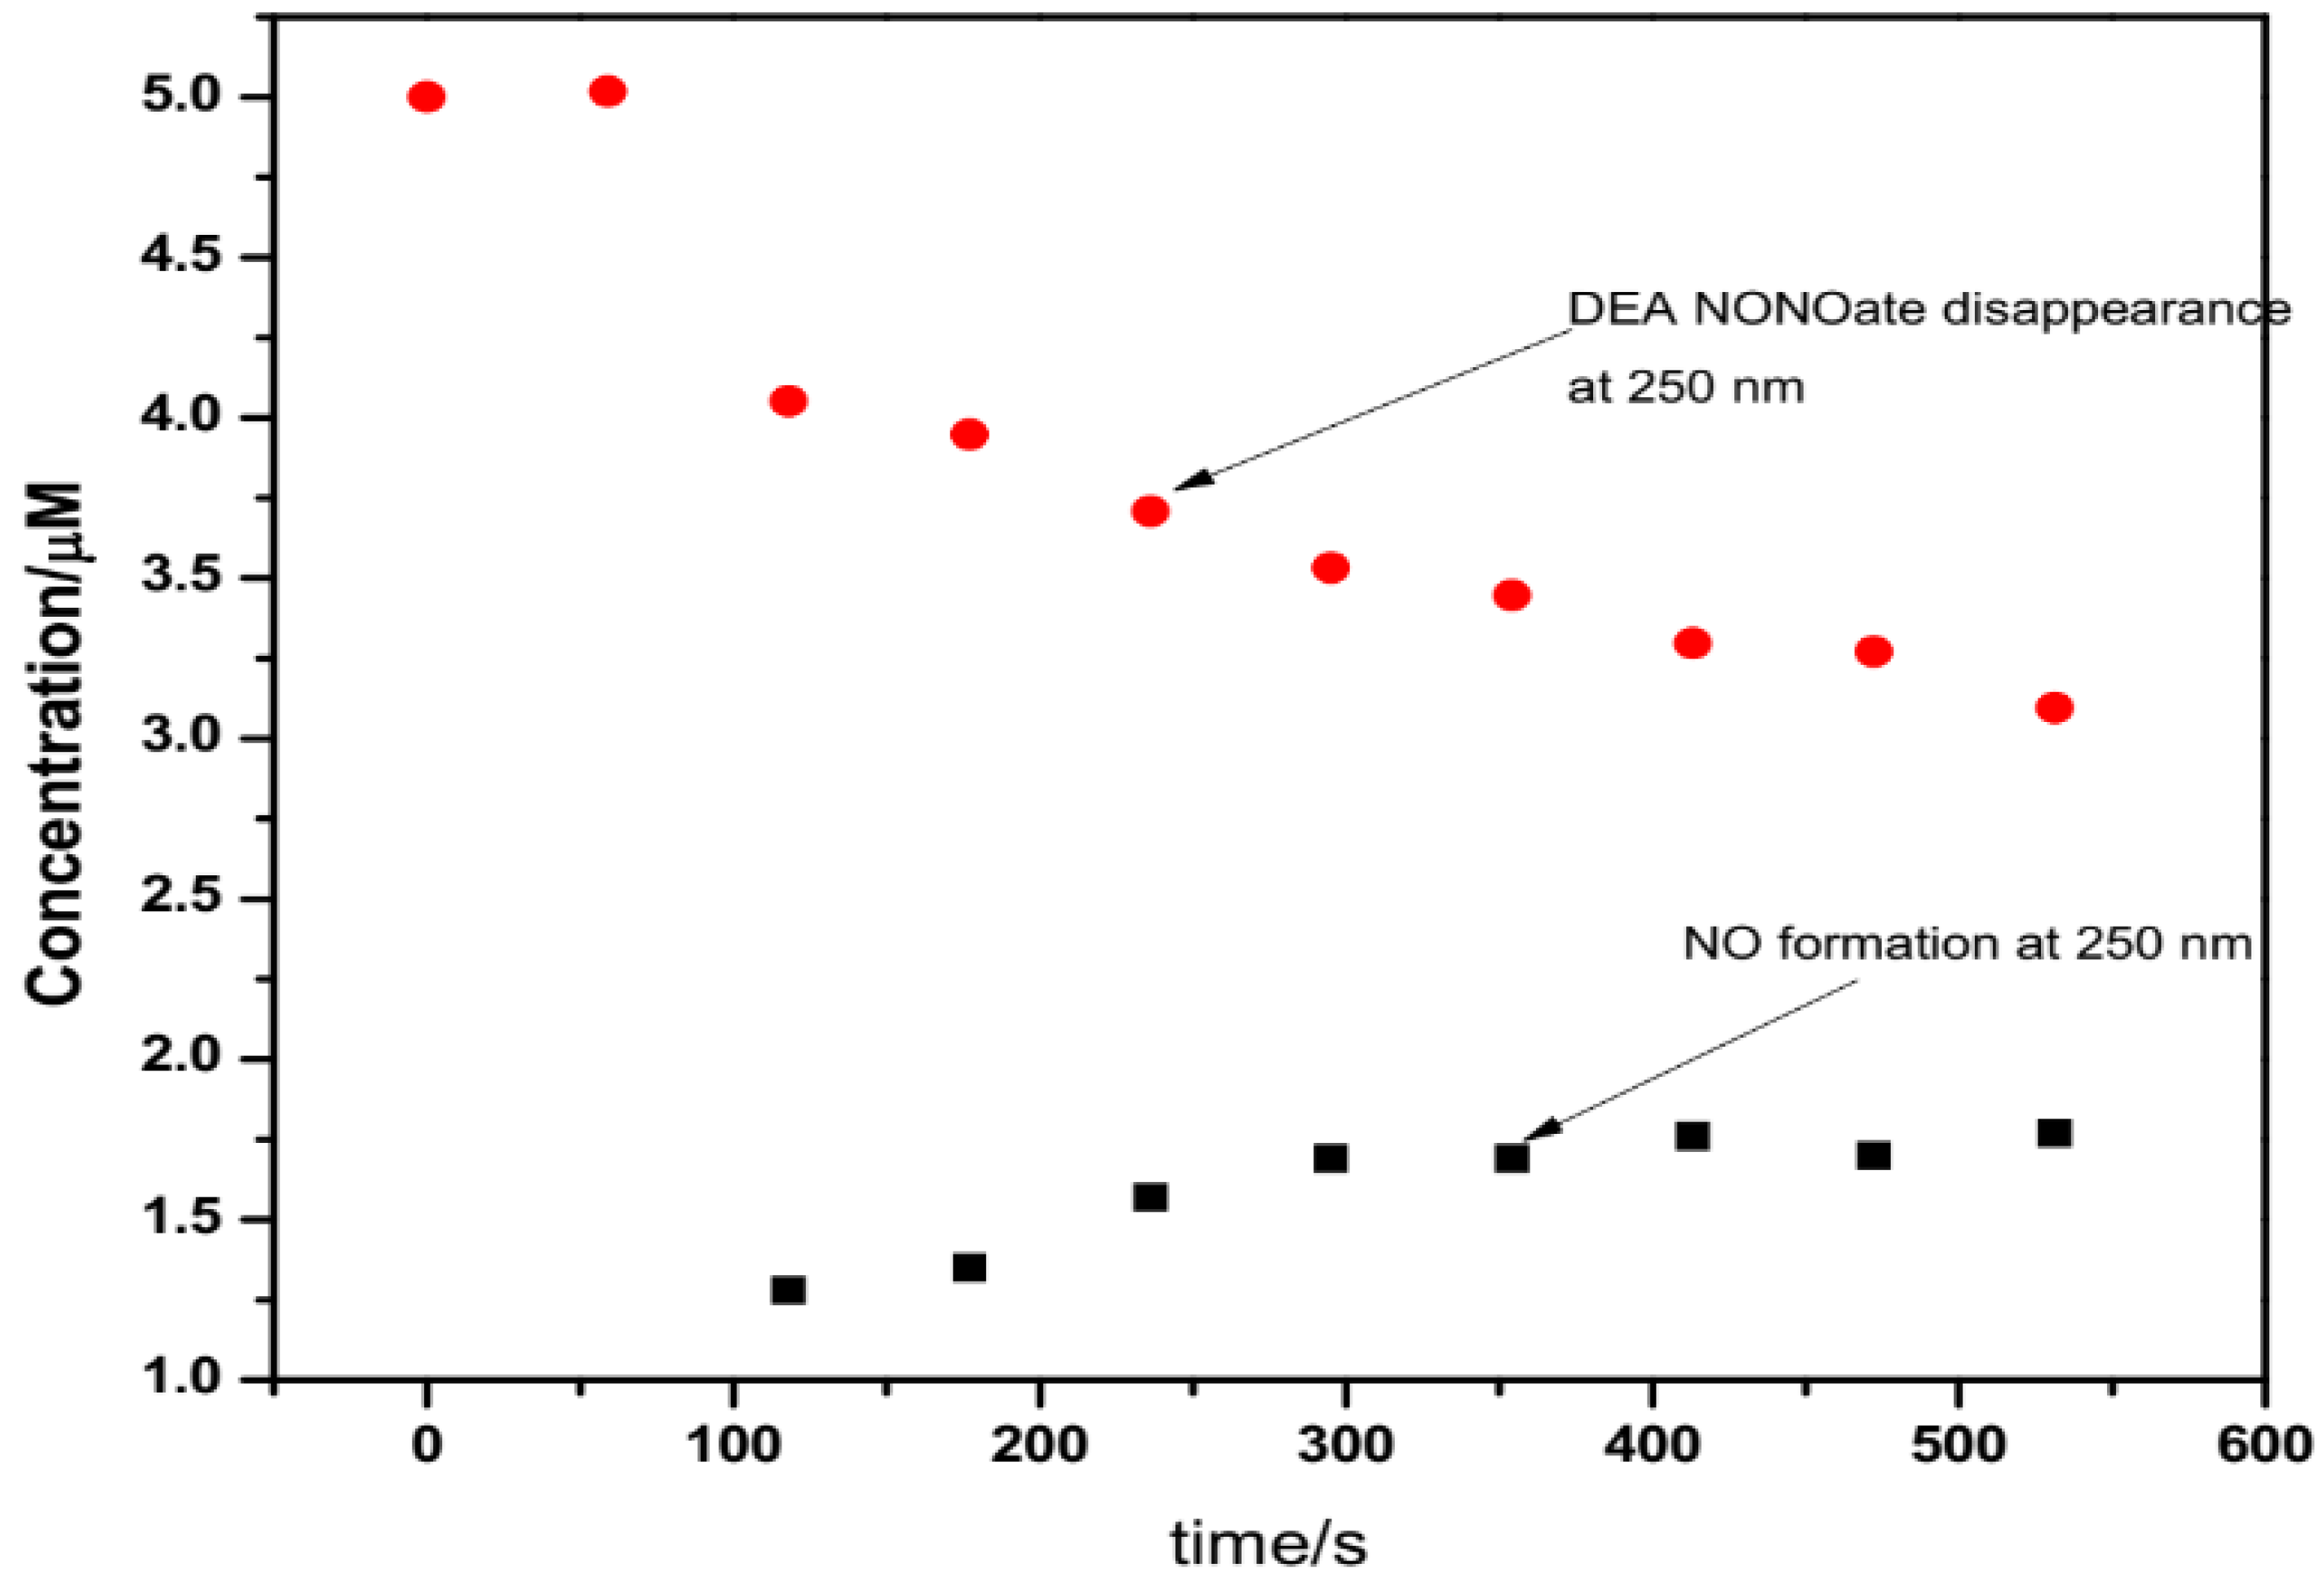
4.2.2. UV/Vis Analysis of DEA NONOate Dissociation

The dissociation of DEA NONOate was observed under changes taking place in UV-Vis absorption. To study this behaviour, a time-dependent dissociation of a 5 µM DEA NONOate solution in 3 mL 0.1 M PBS was evaluated over 2 min intervals. The half-life of DEA NONOate at pH 7.4 and 26 °C was reported as 9 min and <10 sec for NO to be released [80]. This has given enough time to monitor a release of NO from the parent compound under the oxic environment.
DEA NONOate dissociation was characterised by first-order reaction kinetics. The NONOate compound (N) obeyed the kinetics relationship given by [N] = [N]0 exp(−kt), where k was the first-order decomposition rate constant. As demonstrated in Figure 9, a 5 µM DEA NONOate time-dependent decomposition in a 0.1 M PBS was monitored over 10 min interval. The curve illustrated the decrease in absorbance with time at the wavelength of 250 nm. This was achieved by using the absorbance data from the same figure, which has been associated with decaying absorbance of the NO donor concentration at a given time interval. By employing Beer–Lamberts Law, A = εcl a decomposition rate constant (k) was found from the UV data as 2.22 × 10⁻³ M−1 s−1. UV data are further presented in Table 2 and summarised graphically in Figure 10.
As presented in Figure 10, the nitric oxide release as a function of DEA NONOate dissociation in a 0.1 M PBS over a time range of 600 s has been recorded under UV. The steepness of the plot was an indication of the NO generation rate, which was 10.5 nM/s in the time range of 2 to 4 min. However, the NO release rate changed to 0.60 nM/s in the time range of 5 to 7 min. This has been a sign that the NO release was highest in the first 4 min, while it gradually decreased from 5 to 7 min; finally, the curve almost seemed to level off. This information was vital for electrochemical analysis. In this case, the choice of the analytical cycle current intensity on the CV technique was based on optimal NO signals in relation to UV results. The current experimental design employed Diethylamine NONOate (DEA NONOate) as a NO donor because of its capability in dissociating into nitric oxide and the parent amine compound. DEA NONOate has been used to model the behaviour of NO for a series of experiments during the detection process.
As a first approach, the cyclic voltammetry method was implemented for the detection of NO and to explore the electrochemical behaviour of DEA NONOate during its dissociation. The strategy for NO detection involved recording the peak current from the chosen CV cycle at the respective sensors. Data were acquired in 4 mL of a 0.1 M PBS (pH 7.2), which also involved a controlled NONOate injection in the concentration range of 0.1 to 5 µM in a 4 mL PBS (pH 7.2). The potential windows of −1 to +1 V and the scan rate of 50 mV/s vs. Ag/AgCl were employed throughout the detection process. The stabilisation of the respective sensors was achieved by performing repeated cycles until the current peak intensity was maintained. Following the stabilisation process, DEA NONOate aliquots were injected into the sensor vicinity, and cyclic voltammetry was instantly performed. It should be noted that DEA NONOate takes about 10 min to dissociate. Therefore, 10 min of repeated 8 CV cycles wase performed to monitor the effect of the NO release in each stage. The addition of the analyte into the sensor system was performed without any delay between the cycles. Of these eight cycles, the second cycle (120 s) was used as an analytical signal reporting cycle of the current response for quantification. The protocol was further illustrated on the concept map in Scheme S2. The results have been displayed in Figure 11 to illustrate a protocol followed in the study.
As illustrated in Figure 11, the general approach employed for the NO detection study was established. Based on this illustration, there was no observable redox activity of NO at the unmodified electrode. However, after electrode modification with metal complexes, a redox couple was observed between −0.54 and −0.56 V. It was in that potential range where the activity of NO has been observed upon DEA NONOate injection. The effect for the peak of interest was more pronounced in the reduction peak around 0.56 V (x). Following the CV of the stabilised material, the reduction peak current was monitored for analytical reporting of NO. This was vital in monitoring a sensor response upon introduction of DEA NONOate in a PBS solution. As illustrated in Figure 11B,C, sensor response after injection of a 0.1 µM DEA NONOate solution was visible. The current intensity of the reduction peak around −560 mV (labelled q in Figure 11), and it was also identified as the peak responding to NONOate introduction that has reached a maximum (in 2–3 min) and then slowly decreased for the following six scans. These data have complemented UV results, which showed high NO release in the time range of 2 to 4 min. Similar results have been reported for metallophthalocyanines with Ni and Copper centres [9].
The mechanism below was meant to demonstrate the possible NO detection protocol by using electroreductive means and mediated via metal centres M (Ni or Cu) [81,82]. Hence, the same signal outcome upon introducing the same substrate amount has been observed, revealing electrocatalytic behaviour.
M(II) + NO → M(II)-NO    electrostatics(binding)
M(II)-NO + e → M(II)-NO    electroreduction
2M(II)-NO + 2H+ → + 2M(II) + N2O + H2O    catalyst recovery
As demonstrated in the mechanism above, it has become natural that the role of metal centres in complexes have for long played a role of simply binding NO by the static charges. In this regard, the material enabled the electron transfer from the electrode to the bound NO species to form NO. As a result, a measurable signal was generated [9].
Following the qualitative analysis of NO detection, further investigations on quantitative analysis strategy had to be employed. The same conditions were employed, in which a 4 mL 0.1 M PBS was used for NO determination by using CV in the potential range of −1 to 1 V and the scan rate of 50 mV/s vs. Ag/AgCl. The modification was on the amount of the NONOate solution injected into the system. In this case, instead of injecting the same amount of the NONOate solution into the sensor system, the concentration was varied by increasing the volume of the successive injected analyte as a means of increasing concentration in each step. Therefore, the current response measured resulted from different injected analyte volumes (4, 8, 12 µL…for 0.1, 0.2, 0.3… µM). The resulting voltammograms have been displayed in Figure 12A,B, while complementary data were tabulated in Tables S2 and S3 for 10-point sampling, which was vital for the calibration curves.
The current responses displayed by the two types of sensors were for DEA NONOate concentration in the range of 0.1 to 1 µM, as measured in 0.1 M PBS. As presented in Figure 12C, an SPCE/Cu-BPND based sensor has a lower limit of detection (LOD) and lower limit of quantification (LOQ) of 0.53 µM 1.61 µM, respectively, for DEA NONOate. On the other hand, the SPCE/Ni-BPND-based sensor (Figure 12D) has a lower limit of detection (LOD) and lower limit of quantification (LOQ) of 0.21 µM and 0.64 µM, respectively, for DEA NONOate. The two sensors have also shown a sensitivity of 13.1 µA/µM and 16.3 µA/µM for SPCE/Cu-BPND and SPCE/Ni-BPND sensors, respectively (Table 3). Although the results have shown the SPCE/Ni-BPND-based sensor to be better than the SPCE/Cu-BPND sensor, based on the data for limits of detection and sensitivity of the materials towards NO detection, statistically, the two seemed to have performed in almost the same manner. However, regression coefficients (R2) of 0.92 (SPCE/Cu-BPND) and 0.96 (SPCE/Ni-BPND) (Table 3) for the average plotted data have shown the compromised precision and linearity of the data points, and the situation was even worse on SPCE/Cu-BPND. The Standard deviations provided a measure of deviation from the mean values. In general, the sensors displayed error bars indicative of good reproducibility but could be improved to yield exciting results for the direct detection of NO from aqueous samples.

5. Conclusions

Schiff base ligands (N,N′-bis(1H-pyrrole-2yl)methylene naphthalene-2,3-diimine (BPND) were synthesised by the condensation reaction of pyrrole-2-carboxaldehyde and 2,3-diaminonaphthalene under microwave irradiation. Microwave-assisted synthesis drastically reduced synthesis time from 48 h to less than 15 min compared to the classical heating method. The optimised synthesis conditions were determined to be 13–15 min with a microwave power of 400–500 W. Shorter times resulted in incomplete reactions, while longer times and high microwave power resulted in the degradation of the product. A similar protocol was followed for the synthesis of corresponding Schiff base-metal complexes with Cu and Ni. The materials were evaluated electrochemically as thin films electrodeposited onto screen printed carbon electrodes. These materials presented good adherence to the electrode’s surface and redox electrochemistry between −1 and +1 V vs. Ag/AgCl.
NO sensing capability was demonstrated using an in situ donor species for which Cu- and Ni-modified sensors reported 13.1 ± 1.25 and 16.3 ± 1.04 µM NO detection sensitivities, respectively. The results reported by the Cu- and Ni-modified Schiff base sensors, were found to be statistically similar toward NO detection. These electrochemical sensors demonstrate a promising, quick, and inexpensive concept for direct NO sensing. However, further validation is required for the detection of NO in real samples as a means of tracing cancer biomarkers in vivo.
Furthermore, the successful synthesis and characterisation of the metalated monomeric Schiff base materials demonstrated in this work open the doors for the development of similar materials with alternative metal centres (i.e., Mo, Mn, La, Au, Li, Zn, etc.), which may be applied to the diagnosis of health glitches such as cancer, arthritis, depression, wounds, chronic kidney diseases, etc.

Supplementary Materials

The following are available online at https://0-www-mdpi-com.brum.beds.ac.uk/article/10.3390/chemosensors10050175/s1. Figure S1: FT-IR spectra of the BPND ligand synthesised at 400 W for 8, 10 13, and 15 min (A) and power variation from 500 W to 700 W with an increase of 100 W only at 8 min and 13 min (B) in the spectral range 400–4000 cm−1, Figure S2: Electronic spectra of a BPND ligand after microwave synthesis based on the time variation of 8, 10, 13 and 15 min for the constant microwave power of 400 W (A), power variation of 400, 500, 600 and 700 W for both 8 and 13 min (B), Table S1: BPND optimization studies parameters, Table S2: Analytical data for SPCE/Cu-BPND sensor response for DEA NONOate detection, Table S3: Analytical data for SPCE/Ni-BPND sensor response for DEA NONOate detection, Scheme S1: Synthesis protocol and characterization techniques performed, Scheme S2: Concept map for NO detection process.

Author Contributions

All the authors contributed equally as one team for the entire research project, from planning and experimental work to writing and editing. The corresponding author is the main project supervisor and has been responsible for obtaining funding for this research project. All authors have read and agreed to the published version of the manuscript.

Funding

The authors express their gratitude to the University of the Western Cape, South Africa and National Manpower Development Secretariat, Lesotho for the financial support they provided in this research project.

Institutional Review Board Statement

Not applicable.

Informed Consent Statement

Not applicable.

Data Availability Statement

Not applicable.

Acknowledgments

We gradefully acknowledge the resources and expertise of SensorLab research group in the Department of Chemistry and the support of the postgraduate studies at the University of the Western Cape, South Africa.

Conflicts of Interest

The authors declare no conflict of interest.

References

  1. Taha, Z.H. Nitric oxide measurements in biological samples. Talanta 2003, 61, 3–10. [Google Scholar] [CrossRef]
  2. Thatcher, G.R.J.; Nicolescu, A.C.; Bennett, B.M.; Toader, V. Nitrates and no release: Contemporary aspects in biological and medicinal chemistry. Free Radic. Biol. Med. 2004, 37, 1122–1143. [Google Scholar] [CrossRef] [PubMed]
  3. Meier, J.; Stapleton, J.; Hofferber, E.; Haworth, A.; Kachman, S.; Iverson, N.M. Quantification of nitric oxide concentration using single-walled carbon nanotube sensors. Nanomaterials 2021, 11, 243. [Google Scholar] [CrossRef] [PubMed]
  4. Tang, W.; Zhang, Y.; Bai, J.; Li, J.; Wang, J.; Li, L.; Zhou, T.; Chen, S.; Rahim, M.; Zhou, B. Efficient denitrification and removal of natural organic matter, emerging pollutants simultaneously for RO concentrate based on photoelectrocatalytic radical reaction. Sep. Purif. Technol. 2020, 234, 116032. [Google Scholar] [CrossRef]
  5. Chandran, B.; Janakiraman, K. New Disposable Nitric Oxide Sensor Fabrication Using GaN Nanowires. ACS Omega 2019, 4, 17171–17176. [Google Scholar] [CrossRef] [Green Version]
  6. Liao, W.; Ye, T.; Liu, H. Prognostic value of inducible nitric oxide synthase (iNOS) in human cancer: A systematic review and meta-analysis. BioMed Res. Int. 2019, 2019, 6304851. [Google Scholar] [CrossRef] [Green Version]
  7. Li, R.; Qi, H.; Ma, Y.; Deng, Y.; Liu, S.; Jie, Y.; Jing, J.; He, J.; Zhang, X.; Wheatley, L.; et al. A flexible and physically transient electrochemical sensor for real-time wireless nitric oxide monitoring. Nat. Commun. 2020, 11, 1. [Google Scholar] [CrossRef]
  8. Griveau, S.; Dumézy, C.; Goldner, P.; Bedioui, F. Electrochemical analysis of the kinetics of nitric oxide release from two diazeniumdiolates in buffered aqueous solutions. Electrochem. Commun. 2007, 9, 2551–2556. [Google Scholar] [CrossRef]
  9. Bedioui, F.; Griveau, S. Electrochemical Detection of Nitric Oxide: Assessement of Twenty Years of Strategies. Electroanalysis 2013, 25, 587–600. [Google Scholar] [CrossRef]
  10. Glynn, S.A. Emerging novel mechanisms of action for nitric oxide in cancer progression. Curr. Opin. Physiol. 2019, 9, 18–25. [Google Scholar] [CrossRef]
  11. Xu, W.; Liu, L.Z.; Loizidou, M.; Ahmed, M.; Charles, I.G. The role of nitric oxide in cancer. Cell Res. 2002, 12, 311–320. [Google Scholar] [CrossRef] [Green Version]
  12. Choudhari, S.K.; Chaudhary, M.; Bagde, S.; Gadbail, A.R.; Joshi, V. Nitric oxide and cancer: A review. World J. Surg. Oncol. 2013, 11, 1–11. [Google Scholar] [CrossRef] [Green Version]
  13. Wu, W.Y.; Liaw, W.F. Nitric oxide reduction forming hyponitrite triggered by metal-containing complexes. J. Chin. Chem. Soc. 2020, 67, 206–212. [Google Scholar] [CrossRef]
  14. Housein, Z.; Kareem, T.S.; Salihi, A. In vitro anticancer activity of hydrogen sulfide and nitric oxide alongside nickel nanoparticle and novel mutations in their genes in CRC patients. Sci. Rep. 2021, 11, 2536. [Google Scholar] [CrossRef]
  15. Ragsdale, S.W. Nickel-based enzyme systems. J. Biol. Chem. 2009, 284, 18571–18575. [Google Scholar] [CrossRef] [Green Version]
  16. Torres, J.; Svistunenko, D.; Karlsson, B.; Cooper, C.E.; Wilson, M.T. Fast reduction of a copper center in laccase by nitric oxide and formation of a peroxide intermediate. J. Am. Chem. Soc. 2002, 124, 963–967. [Google Scholar] [CrossRef]
  17. Brown, M.D.; Schoenfisch, M.H. Electrochemical Nitric Oxide Sensors: Principles of Design and Characterization. Chem. Rev. 2019, 119, 11551–11575. [Google Scholar] [CrossRef]
  18. Jeong, D.W.; Kim, K.H.; Kim, B.S.; Byun, Y.T. Characteristics of highly sensitive and selective nitric oxide gas sensors using defect-functionalized single-walled carbon nanotubes at room temperature. Appl. Surf. Sci. 2021, 550, 149250. [Google Scholar] [CrossRef]
  19. Luo, P.; Xie, M.; Luo, J.; Kan, H.; Wei, Q. Nitric oxide sensors using nanospiral ZnO thin film deposited by GLAD for application to exhaled human breath. RSC Adv. 2020, 10, 14877–14884. [Google Scholar] [CrossRef] [Green Version]
  20. Khandar, A.A.; Cardin, C.; Hosseini-Yazdi, S.A.; McGrady, J.; Abedi, M.; Zarei, S.A.; Gan, Y. Nickel(II) and copper(II) complexes of Schiff base ligands containing N4O2 and N4S2 donors with pyrrole terminal binding groups: Synthesis, characterization, X-ray structures, DFT and electrochemical studies. Inorg. Chim. Acta 2010, 363, 4080–4087. [Google Scholar] [CrossRef]
  21. Meghdadi, S.; Amirnasr, M.; Mereiter, K.; Molaee, H.; Amiri, A. Synthesis, structure and electrochemistry of Co(III) complexes with an unsymmetrical Schiff base ligand derived from 2-aminobenzylamine and pyrrole-2-carboxaldehyde. Polyhedron 2011, 30, 1651–1656. [Google Scholar] [CrossRef]
  22. Adsule, S.; Barve, V.; Chen, D.; Ahmed, F.; Dou, Q.P.; Padhye, S.; Sarkar, F.H. Novel Schiff base copper complexes of quinoline-2 carboxaldehyde as proteasome inhibitors in human prostate cancer cells. J. Med. Chem. 2006, 49, 7242–7246. [Google Scholar] [CrossRef]
  23. Kaczmarek, M.T.; Zabiszak, M.; Nowak, M.; Jastrzab, R. Lanthanides: Schiff base complexes, applications in cancer diagnosis, therapy, and antibacterial activity. Coord. Chem. Rev. 2018, 370, 42–54. [Google Scholar] [CrossRef]
  24. Khuhawar, M.Y.; Mughal, M.A.; Channar, A.H. Synthesis and characterization of some new Schiff base polymers. Eur. Polym. J. 2004, 40, 805–809. [Google Scholar] [CrossRef]
  25. Bilici, A.; Kaya, I.; Saçak, M. Oxidative polymerization of N202 type schiff base monomer and its metal complexes: Synthesis and thermal, optical and electrochemical properties. J. Inorg. Organomet. Polym. Mater. 2010, 20, 124–133. [Google Scholar] [CrossRef]
  26. Ayinde, W.B.; Gitari, W.M.; Samie, A. Optimization of microwave-assisted synthesis of silver nanoparticle by Citrus paradisi peel and its application against pathogenic water strain. Green Chem. Lett. Rev. 2019, 12, 225–234. [Google Scholar]
  27. Cantón-Díaz, A.M.; Muñoz-Flores, B.M.; Moggio, I.; Arias, E.; Turlakov, G.; Del Angel-Mosqueda, C.; Ramirez-Montes, P.I.; Jiménez-Péreza, V.M. Molecular structures, DFT studies and their photophysical properties in solution and solid state. Microwave-assisted multicomponent synthesis of organotin bearing Schiff bases. J. Mol. Struct. 2019, 1180, 642–650. [Google Scholar] [CrossRef]
  28. Chen, Y. Microwave-assisted synthesis of a novel steroid-derived Schiff base chemosensor for detection of Al3+ in aqueous media. J. Chem. Res. 2020, 44, 750–755. [Google Scholar] [CrossRef]
  29. More, M.S.; Joshi, P.G.; Mishra, Y.K.; Khanna, P.K. Metal complexes driven from Schiff bases and semicarbazones for biomedical and allied applications: A review. Mater. Today Chem. 2019, 14, 100195. [Google Scholar] [CrossRef]
  30. Fahim, A.M.; Shalaby, M.A.; Ibrahim, M.A. Microwave-assisted synthesis of novel 5-aminouracil-based compound with DFT calculations. J. Mol. Struct. 2019, 1194, 211–226. [Google Scholar] [CrossRef]
  31. Shaikh, M.; Wagare, D.; Farooqui, M.; Durrani, A. Microwave Assisted Synthesis of Novel Schiff Bases of Pyrazolyl Carbaldehyde and Triazole in PEG-400. Polycycl. Aromat. Compd. 2020, 40, 1315–1320. [Google Scholar] [CrossRef]
  32. Shi, Y.; Jiang, K.; Zhen, R.; Fu, J.; Yan, L.; Gu, Q.; Zhang, Y.; Ling, F. Design, Microwave-Assisted Synthesis and in Vitro Antibacterial and Antifungal Activity of 2,5-Disubstituted Benzimidazole. Chem. Biodivers. 2019, 16, 3. [Google Scholar] [CrossRef]
  33. Kang, K.; Nanda, S.; Sun, G.; Qiu, L.; Gu, Y.; Zhang, T.; Zhu, M.; Sun, R. Microwave-assisted hydrothermal carbonization of corn stalk for solid biofuel production: Optimization of process parameters and characterization of hydrochar. Energy 2019, 186, 115795. [Google Scholar] [CrossRef]
  34. Kumar, A.; Kuang, Y.; Liang, Z.; Sun, X. Microwave chemistry, recent advancements, and eco-friendly microwave-assisted synthesis of nanoarchitectures and their applications: A review. Mater. Today Nano 2020, 11, 100076. [Google Scholar] [CrossRef]
  35. Sharma, A.; Kodgire, P.; Kachhwaha, S.S. Biodiesel production from waste cotton-seed cooking oil using microwave-assisted transesterification: Optimization and kinetic modeling. Renew. Sustain. Energy Rev. 2019, 116, 109394. [Google Scholar] [CrossRef]
  36. Bordei (Telehoiu), A.T.; Nuță, D.C.; Muşat, G.C.; Missir, A.V.; Căproiu, M.T.; Dumitraşcu, F.; Zarafu, I.; Ioniță, P.; Bădiceanu, C.L.; Limban, C.; et al. Microwave assisted synthesis and spectroscopic characterization of some novel schiff bases of carprofen hydrazide. Farmacia 2019, 67, 955–962. [Google Scholar] [CrossRef]
  37. Pagadala, R.; Ali, P.; Meshram, J.S. Microwave assisted synthesis and characterization of N,N′-bis(salicylaldehydo)ethylenediimine complexes of Mn(II), Co(II), Ni(II), and Zn(II). J. Coord. Chem. 2009, 62, 4009–4017. [Google Scholar] [CrossRef]
  38. Ward, M.; Botha, S.; Iwuoha, E.; Baker, P. Actuation Behaviour of a Derivatized Pyrrole Accordion Type Polymer. Int. J. Electrochem. Sci. 2014, 9, 4776–4792. [Google Scholar]
  39. Monzani, E.; Anthony, G.J.; Koolhaas, A.; Spandre, A.; Leggieri, E.; Casella, L.; Gullotti, M.; Nardin, G.; Randaccio, L.; Fontani, M.; et al. Binding of nitrite and its reductive activation to nitric oxide at biomimetic copper centers. J. Biol. Inorg. Chem. 2000, 5, 251–261. [Google Scholar] [CrossRef]
  40. Ermler, U.; Grabarse, W.; Shima, S.; Goubeaud, M.; Thauer, R.K. Active sites of transition-metal enzymes with a focus on nickel Abbreviations ACS acetyI-CoA synthase CoA coenzyme A CoB coenzyrne B CODH carbon monoxide dehydrogenase CoM coenzyme M EPR spectroscopy electron paramagnetic resonance spectroscopy MCR methyI-CoM reductase SOD superoxide dismutase. Curr. Opin. Struct. Biol. 1998, 8, 749–758. [Google Scholar]
  41. BSingh, K.; Prakash, A.; Rajour, H.K.; Bhojak, N.; Adhikari, D. Spectroscopic characterization and biological activity of Zn(II), Cd(II), Sn(II) and Pb(II) complexes with Schiff base derived from pyrrole-2-carboxaldehyde and 2-amino phenol. Spectrochim. Acta–Part A Mol. Biomol. Spectrosc. 2010, 76, 376–383. [Google Scholar] [CrossRef]
  42. Rana, S.; Mittal, S.K.; Singh, N.; Singh, J.; Banks, C.E. Schiff base modified screen printed electrode for selective determination of aluminium(III) at trace level. Sens. Actuators B Chem. 2017, 239, 17–27. [Google Scholar] [CrossRef]
  43. Vogt, A.; Prasad, L.; Gupta, A. Synthesis and characterization of nickel (ll), copper (II), manganese (III) and iron (III) complexes with new chiral salen-type ligand. Science 1998, 17, 8. [Google Scholar]
  44. Percy, G.C.; Thornton, D.A. Infrared spectra of N-aryl salicylaldimine complexes substituted in both aryl rings. J. Inorg. Nucl. Chem. 1973, 35, 2319–2327. [Google Scholar] [CrossRef]
  45. Kumar, S.P.; Suresh, R.; Giribabu, K.; Manigandan, R.; Munusamy, S.; Muthamizh, S.; Narayanan, V. Synthesis and characterization of chromium(III) Schiff base complexes: Antimicrobial activity and its electrocatalytic sensing ability of catechol. Spectrochim. Acta–Part A Mol. Biomol. Spectrosc. 2015, 139, 431–441. [Google Scholar] [CrossRef]
  46. Çelik, C.; Tümer, M.; Serin, S. Complexes of tetradentate Schiff base ligands with divalent transition metals. Synth. React. Inorg. Met. Chem. 2002, 32, 1839–1854. [Google Scholar] [CrossRef]
  47. Mohanan, K.; Kumari, B.S.; Rijulal, G. Microwave assisted synthesis, spectroscopic, thermal, and antifungal studies of some lanthanide(III) complexes with a heterocyclic bishydrazone. J. Rare Earths 2008, 26, 16–21. [Google Scholar] [CrossRef]
  48. Kaushik, A.; Kumar, R.; Arya, S.K.; Nair, M.; Malhotra, B.D.; Bhansali, S. Organic-Inorganic Hybrid Nanocomposite-Based Gas Sensors for Environmental Monitoring. Chem. Rev. 2015, 115, 4571–4606. [Google Scholar] [CrossRef]
  49. Ourari, A.; Aggoun, D.; Ouahab, L. A novel copper(II)-Schiff base complex containing pyrrole ring: Synthesis, characterization and its modified electrodes applied in oxidation of aliphatic alcohols. Inorg. Chem. Commun. 2013, 33, 118–124. [Google Scholar] [CrossRef] [Green Version]
  50. Ghosh, K.; Drew, M.G.B.; Chattopadhyay, S. Synthesis and structure of a cobalt(III) complex containing pendant Schiff base ligand: Exploration of its catechol oxidase and phenoxazinone synthase like activity. Inorg. Chim. Acta 2018, 482, 23–33. [Google Scholar] [CrossRef]
  51. Mehta, P.K.; Oh, E.T.; Park, H.J.; Lee, K.H. Ratiometric detection of Cu+ in aqueous buffered solutions and in live cells using fluorescent peptidyl probe to mimic the binding site of the metalloprotein for Cu+. Sens. Actuators B Chem. 2018, 256, 393–401. [Google Scholar] [CrossRef]
  52. Fekri, R.; Shaabani, B. Synthesis and Characterization of Ni (II) Complex with Tridentate Ligand of Schiff ’ s Bases of Salicylaldehyde with Thiocyanate Ligand. Appl. Environ. Biol. Sci. 2013, 3, 75–80. [Google Scholar]
  53. Elango, G.; Arumugam, A.; Guhanathan, S. Co (II), Ni (II) and Cu (II) Complexes with Schiff Base Ligand: Syntheses, Characterization, Antimicrobial Studies and Molecular Docking Studies. SOJ Mater. Sci. Eng. 2017, 5, 1–12. [Google Scholar] [CrossRef]
  54. Mangamamba, T.; Ganorkar, M.C.; Swarnabala, G. Characterization of Complexes Synthesized Using Schiff Base Ligands and Their Screening for Toxicity Two Fungal and One Bacterial Species on Rice Pathogens. Int. J. Inorg. Chem. 2014, 2014, 1–22. [Google Scholar] [CrossRef] [Green Version]
  55. Júnior, G.C.; Silva, A.P.S.; Guinesi, L.S. Synthesis, characterization and electropolymerization of a new polypyrrole iron(II) Schiff-base complex. Polyhedron 2004, 23, 1953–1960. [Google Scholar] [CrossRef]
  56. Tümer, M. Polydentate Schiff-base ligands and their Cd(II) and Cu(II) metal complexes: Synthesis, characterization, biological activity and electrochemical properties. J. Coord. Chem. 2007, 60, 2051–2065. [Google Scholar] [CrossRef]
  57. Hassaan, A.M.A.; Khalifa, M.A. Metal chelates of some transition and non-transition metal ions with Schiff base derived from isatin with o-phenylenediamine. Monatshefte für Chem. Chem. Mon. 1993, 124, 803–808. [Google Scholar] [CrossRef]
  58. Sumrra, S.H.; Ibrahim, M.; Ambreen, S.; Imran, M.; Danish, M.; Rehmani, F.S. Synthesis, Spectral Characterization, and Biological Evaluation of Transition Metal Complexes of Bidentate N, O Donor Schiff Bases. Bioinorg. Chem. Appl. 2014, 2014, 812924. [Google Scholar] [CrossRef]
  59. Yousif, E.; Majeed, A.; Al-Sammarrae, K.; Salih, N.; Salimon, J.; Abdullah, B. Metal complexes of Schiff base: Preparation, characterization and antibacterial activity. Arab. J. Chem. 2017, 10, S1639–S1644. [Google Scholar] [CrossRef] [Green Version]
  60. Kavitha, N.; Lakshmi, P.V.A. Synthesis, characterization and thermogravimetric analysis of Co(II), Ni(II), Cu(II) and Zn(II) complexes supported by ONNO tetradentate Schiff base ligand derived from hydrazino benzoxazine. J. Saudi Chem. Soc. 2017, 21, S457–S466. [Google Scholar] [CrossRef] [Green Version]
  61. Yilmaz, F.; Yilmaz, V.T.; Topcu, S.; Menek, N. Syntheses, spectral, thermal and electrochemical studies of 3-carboxylacetonehydroxamic acid and its iron(II), cobalt(II), nickel(II), copper(II) and zinc(II) complexes. J. Coord. Chem. 2003, 56, 903–911. [Google Scholar] [CrossRef]
  62. Nejo, A.A.; Kolawole, G.A.; Nejo, A.O. Synthesis, characterization, antibacterial, and thermal studies of unsymmetrical Schiff-base complexes of cobalt(II). J. Coord. Chem. 2010, 63, 4398–4410. [Google Scholar] [CrossRef]
  63. Amer, A.A.; Ilikti, H.; Beyens, C.; Lyskawa, J.; Maschke, U. Elaboration of new modified electrodes (MEs) by electropolymerization of Cu(II)-Schiff base complexes bearing pyrrole moieties: Application in electroreduction of acetophenone and carbon dioxide. Eur. Polym. J. 2019, 112, 569–580. [Google Scholar] [CrossRef]
  64. Banasz, R.; Wałęsa-Chorab, M. Polymeric complexes of transition metal ions as electrochromic materials: Synthesis and properties. Coord. Chem. Rev. 2019, 389, 1–18. [Google Scholar] [CrossRef]
  65. Fuku, X.; Iftikar, F.; Hess, E.; Iwuoha, E.; Baker, P. Cytochrome c biosensor for determination of trace levels of cyanide and arsenic compounds. Anal. Chim. Acta 2012, 730, 49–59. [Google Scholar] [CrossRef]
  66. Tabares, J.S.F.; Blas, M.L.; Sereno, L.E.; Silber, J.J.; Correa, N.M.; Molina, P.G. Electrochemistry in large unilamellar vesicles. the distribution of 1-naphthol studied by square wave voltammetry. Electrochim. Acta 2011, 56, 10231–10237. [Google Scholar] [CrossRef]
  67. Khandar, A.A.; Hosseini-Yazdi, S.A.; Zarei, S.A. Synthesis, characterization and X-ray crystal structures of copper(II) and nickel(II) complexes with potentially hexadentate Schiff base ligands. Inorg. Chim. Acta 2005, 358, 3211–3217. [Google Scholar] [CrossRef]
  68. Zolezzi, S.; Spodine, E.; Decinti, A. Electrochemical studies of copper(II) complexes with Schiff-base ligands. Polyhedron 2002, 21, 55–59. [Google Scholar] [CrossRef]
  69. Bulut, I. Study of binary complexes of nickel(II), copper(II), and vanadium(V) with acetazolamide in aqueous medium by voltammetry. J. Chem. 2009, 33, 507–520. [Google Scholar]
  70. Bott, R.C.; Bowmaker, G.A.; Davis, C.A.; Hope, G.A.; Jones, B.E. Crystal Structure of [ Cu 4 (tu) 7 ](SO 4) 2 ] ‚ H 2 O and Vibrational Spectroscopic Studies of Some Copper (I) Thiourea Complexes. Inorg. Chem. 1998, 4, 651–657. [Google Scholar] [CrossRef]
  71. Rizvi, M.A. Complexation Modulated Redox Behavior of Transition Metal Systems (Review). J. Gen. Chem. 2015, 85, 959–973. [Google Scholar] [CrossRef]
  72. Ourari, A.; Ouennoughi, Y.; Aggoun, D.; Mubarak, M.S.; Pasciak, E.M.; Peters, D.G. Synthesis, characterization, and electrochemical study of a new tetradentate nickel(II)-Schiff base complex derived from ethylenediamine and 5′-(N-methyl-N-phenylaminomethyl)-2′-hydroxyacetophenone. Polyhedron 2014, 67, 59–64. [Google Scholar] [CrossRef]
  73. Losada, J.; del Peso, I.; Beyer, L. Electrochemical and spectroelectrochemical properties of copper(II) Schiff-base complexes. Inorg. Chim. Acta 2001, 321, 107–115. [Google Scholar]
  74. Lovecchio, F.V.; Gore, E.S.; Busch, D.H. The Oxidation and Reduction Behavior of Macrocyclic Complexes of Nickel. Electrochemical and Electron Spin Resonance Studies. J. Am. Chem. Soc. 1974, 96, 3109–3118. [Google Scholar] [CrossRef]
  75. Kadish, K.M.; Sazou, D.; Maiya, G.B.; Han, B.C.; Liu, Y.M.; Saoiabi, A.; Ferhat, M.; Guilard, R. Electrochemistry of Nickel ‘Picket Fence’ Porphyrin: Electrogeneration and Spectral Characterization of Nickel Complexes In Unusual Oxidation States. Inorg. Chem. 1989, 28, 2542–2547. [Google Scholar] [CrossRef]
  76. Shi, W.; Li, J.; Wu, J.; Wei, Q.; Chen, C.; Bao, N.; Yu, C.; Gu, H. An electrochemical biosensor based on multi-wall carbon nanotube–modified screen-printed electrode immobilized by uricase for the detection of salivary uric acid. Anal. Bioanal. Chem. 2020, 412, 7275–7283. [Google Scholar] [CrossRef] [PubMed]
  77. da Cruz, A.G.B.; Wardell, J.L.; Simão, R.A.; Rocco, A.M. Preparation, structure and electrochemistry of a polypyrrole hybrid film with [Pd(dmit)2]2-, bis(1,3-dithiole-2-thione-4,5-dithiolate)palladate(II). Electrochim. Acta 2007, 52, 1899–1909. [Google Scholar] [CrossRef]
  78. Naghavi, N.; de Mel, A.; Alavijeh, O.S.; Cousins, B.G.; Seifalian, A.M. Nitric oxide donors for cardiovascular implant applications. Small 2013, 9, 22–35. [Google Scholar] [CrossRef]
  79. Willmot, M.; Gray, L.; Gibson, C.; Murphy, S.; Bath, P.M.W. A systematic review of nitric oxide donors and L-arginine in experimental stroke; effects on infarct size and cerebral blood flow. Nitric Oxide Biol. Chem. 2005, 12, 141–149. [Google Scholar] [CrossRef]
  80. Griveau, S.; Seguin, J.; Scherman, D.; Chabot, G.G.; Bedioui, F. In vivo electrochemical detection of nitroglycerin-derived nitric oxide in tumor-bearing mice. Electroanalysis 2009, 21, 631–634. [Google Scholar] [CrossRef]
  81. Brown, M.D.; Schoenfisch, M.H. Catalytic selectivity of metallophthalocyanines for electrochemical nitric oxide sensing. Electrochim. Acta 2018, 273, 98–104. [Google Scholar] [CrossRef]
  82. Mao, L.; Yamamoto, K.; Zhou, W.; Jin, L. Electrochemical nitric oxide sensors based on electropolymerized film of M(salen) with central ions of Fe, Co, Cu, and Mn. Electroanalysis 2000, 12, 72–77. [Google Scholar] [CrossRef]
Scheme 1. Schiff base ligand synthesis protocol.
Chemosensors 10 00175 sch001
Figure 1. FT-IR spectra for a BPND and Cu-BPND complex (A) and FT-IR spectra for a BPND and Ni-BPND complex (B). KBr was used as a sample matrix, such as in BPNDs in the spectral range of 400–4000 cm−1.
Chemosensors 10 00175 g001
Figure 2. Graphical representation for monitoring the intensity of azomethine bond of the BPND ligand after microwave synthesis based on the time variation of 8, 10, 13, and 15 min at a constant microwave power of 400 W (A) and power variation of 400, 500, 600, and 700 W for both 8 and 13 min (B).
Chemosensors 10 00175 g002
Figure 3. Electronic spectra for BPND free ligand and Cu-BPND complex (A) and BPND free ligand and Ni-BPND complex (B). Ethanol was used as a solvent for both complexes.
Chemosensors 10 00175 g003
Figure 4. A thermogram for a Schiff base ligand only (A) and an overlay of thermograms for the Schiff base ligand, nickel(II), and copper(II) complexes (B) in the temperature range 35.8 °C to 700 °C under nitrogen gas.
Chemosensors 10 00175 g004
Figure 5. SEM micrographs of Schiff base ligand (A), Cu(II) complex (B), and Ni(II) complex (C) with their corresponding EDS spectra on each side. Each image was taken at a magnification of 10,000×.
Chemosensors 10 00175 g005
Figure 6. Cyclic voltammogram for electrodeposition of the BPND ligand on an SPCE in a 4 mL of a 1:1 mixture of 0.1 mM HCl and DMF recorded at the scan rate of 50 mV/s (A), a CV data of SPCE/BPND (B) and SWV of both anodic and cathodic waves (C) both in PBS of pH 7.0 in the potential window of −1 to 1 V vs. Ag/AgCl.
Chemosensors 10 00175 g006
Figure 7. Cyclic voltammogram of SPCE/Cu-BPND (A), cyclic voltammogram of te SPCE/Ni-BPND (B), both obtained in a 0.1 M PBS (pH 7.0) at scan rates 10 to 100 mV/s vs. Ag/AgCl.
Chemosensors 10 00175 g007
Figure 8. SEM micrographs of a Schiff base ligand polymer (A), Cu complex polymer (B), and Ni complex polymer (C) on the screen print carbon electrode.
Chemosensors 10 00175 g008
Figure 9. A plot of absorbance data versus time for NONOate decomposition in 0.1 M PBS (PH 7.2) under ambient conditions.
Chemosensors 10 00175 g009
Figure 10. UV data for both decomposition of DEA NONOate and production of NO measured λ = 250 nm in a 0.1 M PBS.
Chemosensors 10 00175 g010
Figure 11. Cyclic voltammograms of an unmodified SPCE before NONOate injection (black), unmodified SPCE after NONOate injection (red), a modified electrode with the metal complex (blue) and a modified electrode in the presence of NONOate (green) and their current responses (A), current response after the 1st injection of a 0.1 µM of a DEA NONOate solution in a 0.1 M PBS (B), and the current response relative to the stabilised material and 1st cycle only (C); all performed in 0.1 M PBS (pH 7.2) in the potential range of −1 to 1 and a scan rate of 50 mV/s under ambient conditions.
Chemosensors 10 00175 g011
Figure 12. Cyclic voltammograms of the current response of the copper–ligand sensor to DEA NONOate dissociation (A); the current response of the nickel–ligand sensor to DEA NONOate dissociation (B) both in 0.1 M PBS (pH = 7.2) at a scan rate of 50 mV/s for successive independent concentration increase (0.1, 0.2, 0.3…1 µM). Calibration curves of the average current responses data of copper–ligand (C) and nickel–ligand (D) materials deposited on SPCE, which also include error bars obtained from standard deviation.
Chemosensors 10 00175 g012
Table 1. Thermoanalytical data of the BPND ligand and its metal complexes.
CompoundTemp Range
(°C)
Sample Tmax
(°C)
Mass Loss
(%)
Total Mass Loss
(%)
BPND ligand35.8–200.2 0.06
224.5–396.1308.70.7650.835
Cu-BPND35.8–155.1 11.11
230.3–35.2288.232.6643.8
Ni-BPND35.8–212.3 10.20
222.4–409.2257.843.3053.5
Table 2. Data relating NONOate concentration to that of NO obtained from time-dependent NONOate absorbance.
Time (s)DEA NONOate Concentration/µMAbsorbanceNO Concentration/µM
05.00.02600.00
59.0255.0170.02610.00
118.0504.0530.02111.28 × 10−6
177.0753.9480.020521.35 × 10−6
236.1003.7090.01931.57 × 10−6
295.1253.5330.01841.69 × 10−6
354.1503.4460.01791.69 × 10−6
413.1753.2970.01711.76 × 10−6
472.2003.2710.01701.70 × 10−6
531.2253.0960.01611.77 × 10−6
Table 3. Linear regression analysis of SPCE/Cu-BPND and SPCE/Ni-BPND sensors for DEA NONOate detection.
MaterialR2Slope
(A/M)
LOD
(µM)
LOQ
(µM)
Linear Range/µMSTD
(n = 10)
SPCE/Cu-BPND0.92413.10.531.610.1–11.25
SPCE/Ni-BPND0.96416.30.210.640.1–11.04
Publisher’s Note: MDPI stays neutral with regard to jurisdictional claims in published maps and institutional affiliations.

