Article

A Microphysiometric System Based on LAPS for Real-Time Monitoring of Microbial Metabolism

1
Biosensor National Special Laboratory, Key Laboratory for Biomedical Engineering of Education Ministry, Department of Biomedical Engineering, Zhejiang University, Hangzhou 310027, China
2
The MOE Frontier Science Center for Brain Science & Brain-Machine Integration, Zhejiang University, Hangzhou 310058, China
3
State Key Laboratory of Transducer Technology, Chinese Academy of Sciences, Shanghai 200050, China
4
Research Center for Quantum Sensing, Zhejiang Lab, Hangzhou 310000, China
*
Author to whom correspondence should be addressed.
Submission received: 7 April 2022 / Revised: 29 April 2022 / Accepted: 3 May 2022 / Published: 6 May 2022

Abstract

:
Macronutrients (carbohydrates, fat and protein) are the cornerstones of daily diet, among which carbohydrates provide energy for the muscles and central nervous system during movement and exercise. The breakdown of carbohydrates starts in the oral cavity, where they are primarily hydrolyzed to glucose and then metabolized to organic acids. The end products may have an impact on the oral microenvironment, so it is necessary to monitor the process of microbial metabolism and to measure the pH change. Although a pH meter has been widely used, it is limited by its sensitivity. We then introduce a light addressable potentiometric sensor (LAPS), which has been used in extracellular acidification detection of living cells with the advantages of being objective, quantitative and highly sensitive. However, it is difficult to use in monitoring bacterial metabolism because bacteria cannot be immobilization on the LAPS chip as easily as living cells. Therefore, a microphysiometric system integrated with Transwell insert and microfluidic LAPS chip was designed and constructed to solve this problem. The decrease in pH caused by glucose fermentation in Lactobacillus rhamnosus was successfully measured by this device. This proves the feasibility of the system for metabolism detection of non-adhere targets such as microorganisms and even 3D cells and organoids.

1. Introduction

Macronutrients (carbohydrates, fat and protein) are the main components of most foods and beverages. As essential energy sources for humans, the breakdown of macronutrients starts in the oral cavity. The primary hydrolysis of the ingested biomolecules is catalyzed by digestive enzymes supplied by host and microbial sources [1]. Then, after complex metabolic activities, the ecology and biology of the oral microenvironment changes due to a series of end products. Carbohydrates, for example, are primarily hydrolyzed into monosaccharides such as glucose, which can be further catabolized by microorganisms in the oral cavity. Organic acids and other substances produced by metabolism can impact the balance of the local oral environment and can even lead to diseases such as tooth decay. Hence, it is necessary to monitor the process of microbial metabolism.
The microbial ecology of the oral cavity is very complex, with over 700 species of bacteria colonizing on mucosal and tooth surfaces [2]. Numerous studies have shown that lactic acid bacteria (LAB) exist in human oral cavity, especially in saliva, as normal flora [3,4], by which monosaccharides can be fermented to lactic acid and other organic acids [5]. By contrast, sugar substitutes that are increasingly used in food to replace sucrose cannot be broken down by LAB. The purpose of the present study is to detect the pH change in glucose and sugar substitutes solutions caused by metabolism of LAB and to provide the basis for studying the change in oral microenvironment.
It has been reported that a pH meter was used to detect the pH-lowering potential caused by acid production of Lactobacillus rhamnosus [3], but this method has low sensitivity and is time-consuming. In contrast, light addressable potentiometric sensor (LAPS) is more suitable for monitoring metabolic activity of microorganisms due to its outstanding superiority with its high sensitivity toward pH [6,7]. However, LAPS was commonly used to detect the metabolism of living cells, which can be immobilized [8,9]. Only a few studies have investigated the acidification of non-adherent targets such as microorganism directly in suspension [10,11,12]. In this work, a microphysiometer based on the LAPS principle and a microfluidic system combined with an innovative structure fabricated by a Transwell insert was constructed for real-time and long-term monitoring of fermentation process conducted by Lact. rhamnosus. Compared with the traditional microphysiometer [13], the combination of Transwell and LAPS is a simpler and lower-cost structure, which can be promoted as a model system for detecting the metabolism of microorganisms and other non-adherent targets.

2. Methods and Experiments

2.1. Principle

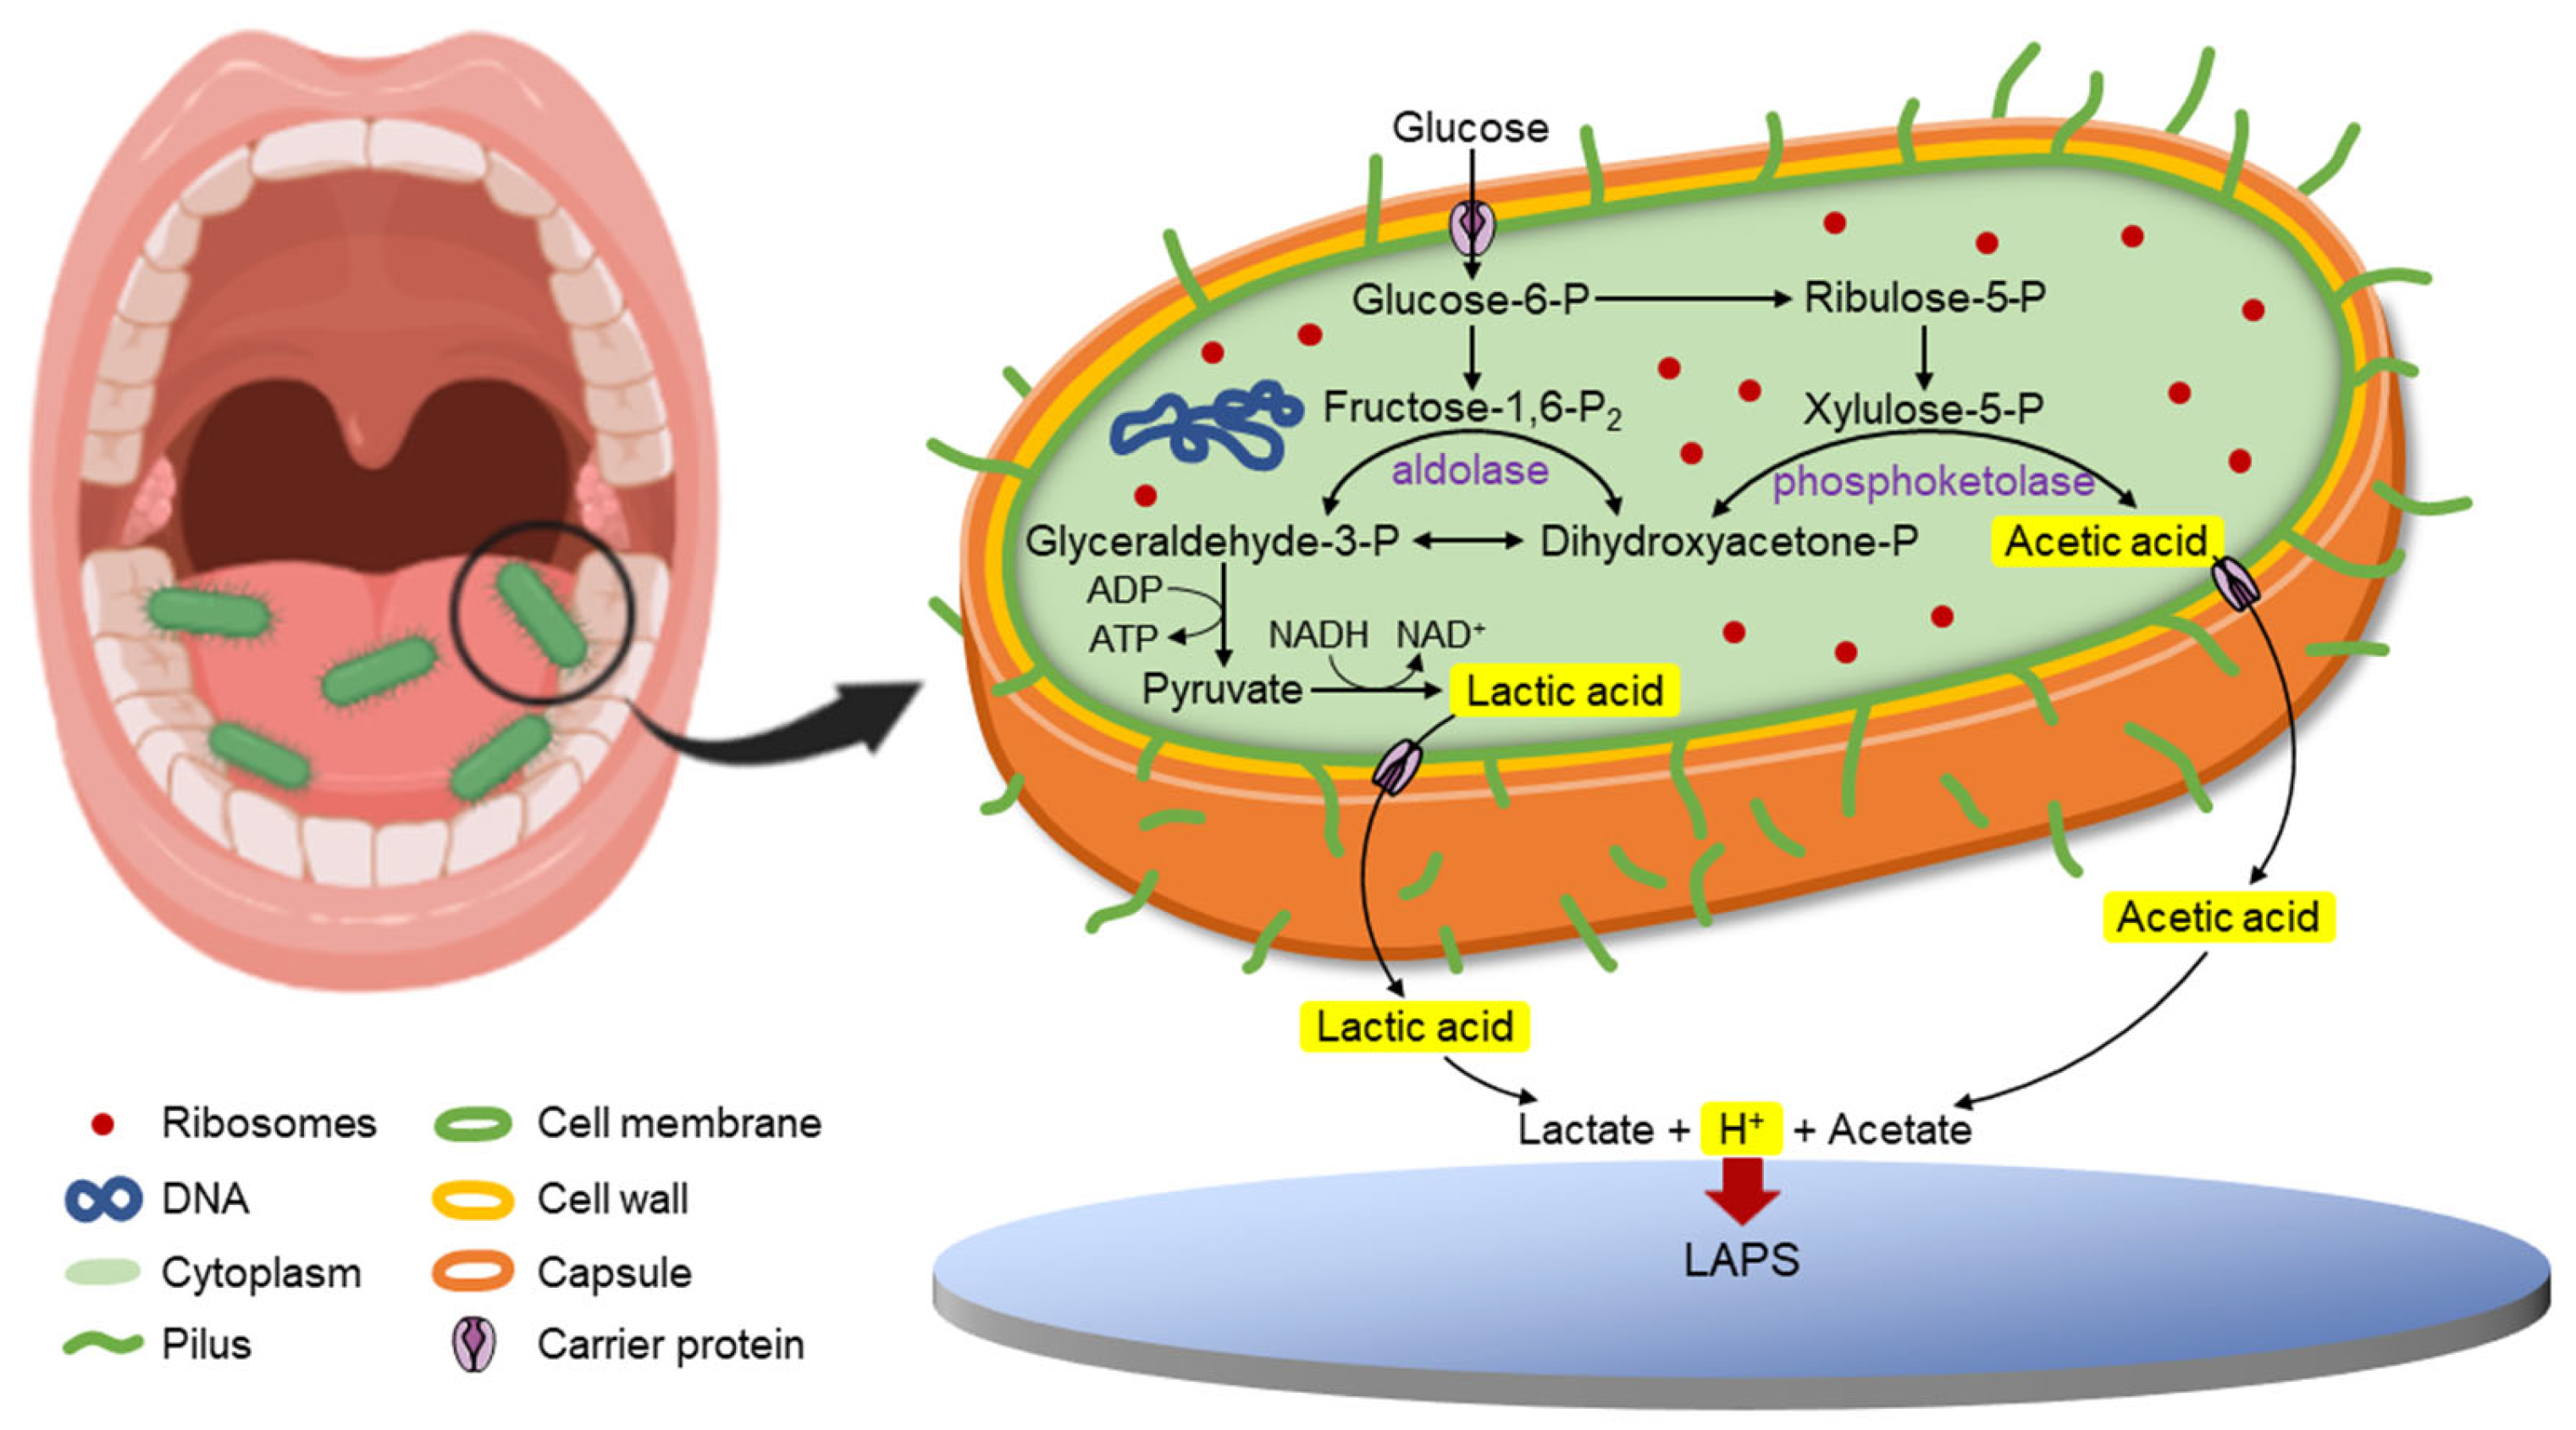
2.1.1. Biological Basis of Metabolism in LAB

According to the pathways of glucose fermentation with different end-products, LAB can be categorized into three main types: homofermentative, heterofermentative and facultative heterofermentative. Lact. rhamnosus belongs to the third type [3], which can either produce several end products such as lactic acid and acetic acid similar to heterofermentative bacteria or only produce lactic acid such as homofermentative bacteria. Figure 1 illustrates the principal steps involved in the fermentation process of Lact. rhamnosus, in which protons are generated and released using glucose as a carbon source. In the homolactic fermentation, one molecule of glucose is transformed to fructose-1,6-diphophate and then converted to two pyruvate molecules through the Embden-Meyerhof-Parnas (EMP) pathway. Lactic acid is formed by the reduction of pyruvate. In contrast, during the process of heterolactic fermentation, glucose is converted to xylulose-5-phosphate which is then catalyzed by phosphoketolase to glyceraldehyde-3-phosphate and acetyl phosphate. The former is transformed into lactic acid, while the latter is transformed into acetic acid [5,14,15]. In conclusion, regardless of the kind of fermentation, a large amount of acidic substance is produced, so the physiological state and activity of LAB can be reflected by monitoring the pH change during the metabolism process.

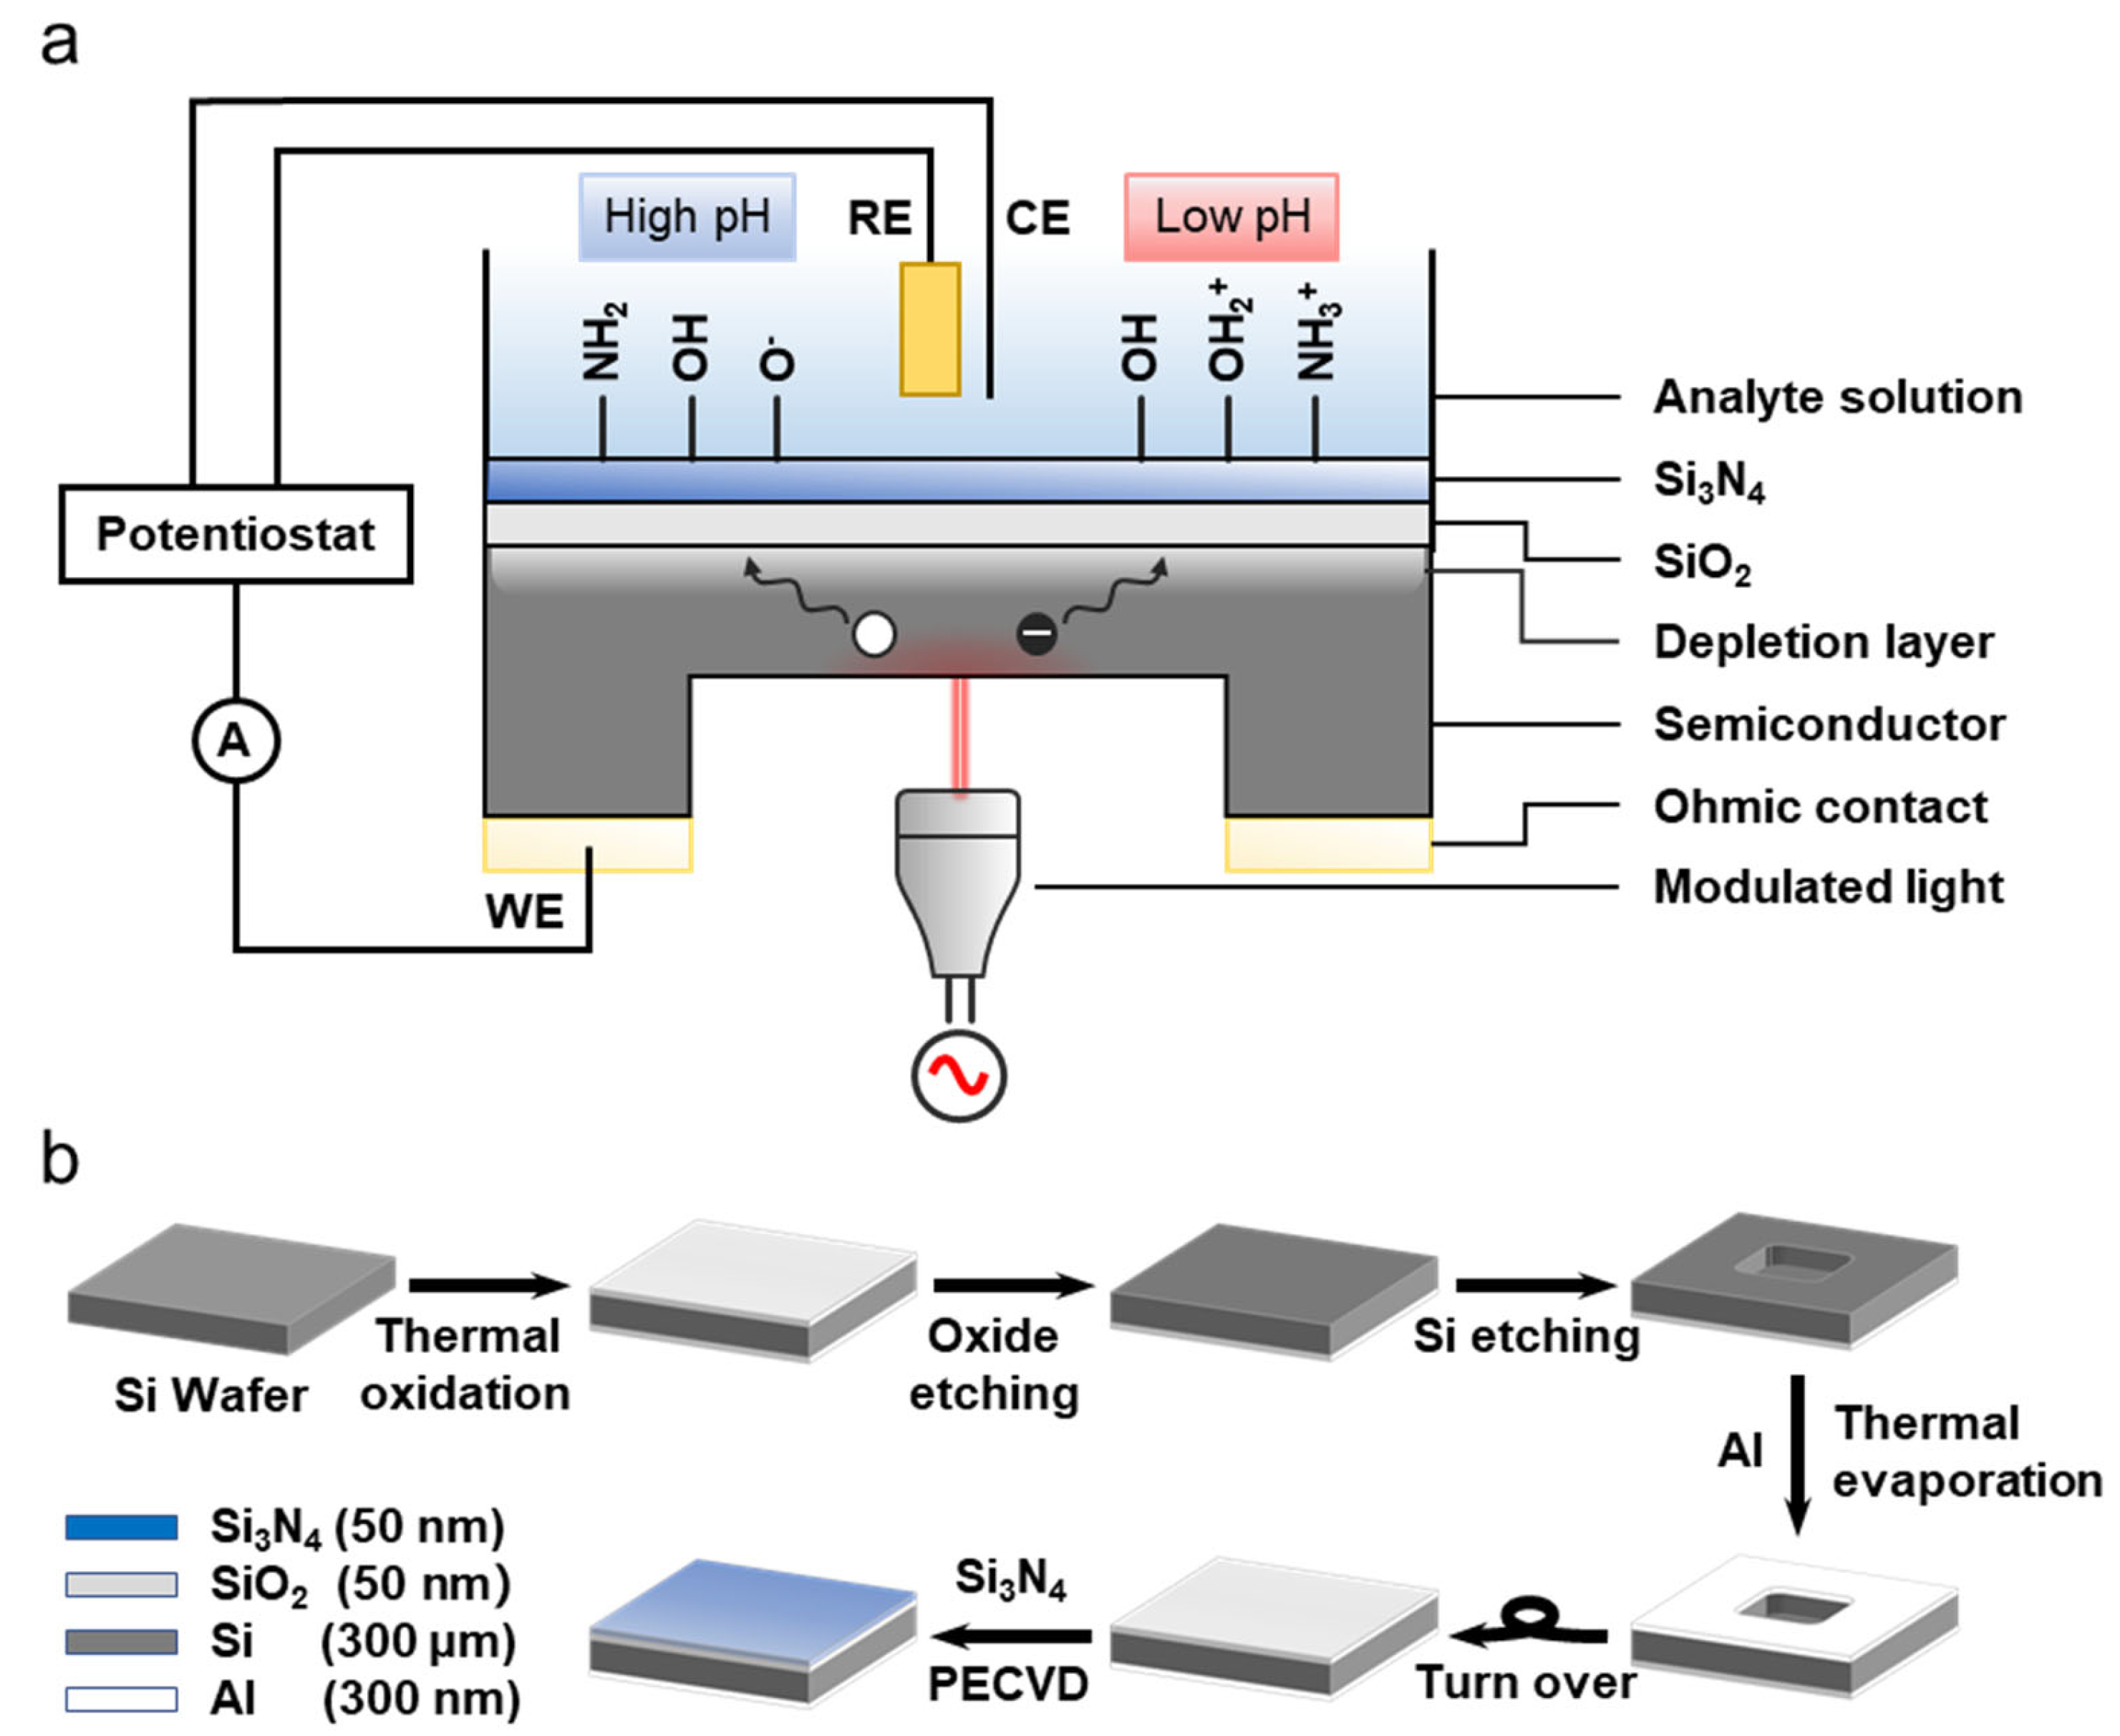
2.1.2. The Principle of LAPS Based Bacterial Metabolism Detection

The principle of detecting acidic metabolites of LAB by LAPS was similar to that of cellular acidification detection described previously, Si3N4 was still used as the H+ sensitive material [8,9]. The H+ concentration in the solution can affect the surface potential of the LAPS chip, which can affect the width of the depletion layer formed between the silicon layer and the insulating layer when a DC bias voltage is applied onto the reference electrode (RE) of the sensor. Due to the frequency-modulated illumination at the bottom of the sensor, hole–electron pairs and, subsequently, an AC photocurrent with the same frequency are generated [16]. The back-side illumination was chosen instead of front-side because the solution with bacteria is a suspension and bacteria are difficult to be immobilized on the surface of sensor chip. Since the light needs to pass through the whole silicon layer to reach the depletion layer, the LAPS chip was partially thinned to improve the signal-to-noise ratio of the sensor. A schematic illustration of the thinned LAPS chip for detecting acidic metabolites is depicted in Figure 2a.

2.2. Sensor Preparation

2.2.1. LAPS Chip Fabrication

The LAPS chip was partially thinned to achieve a backside illumination. Silicon was used as the sensor substrate, SiO2 was used as the insulating layer, and Si3N4 was used as the sensing material for pH detection. The procedures of the LAPS chip fabrication are demonstrated in Figure 2b, and the 300 μm single-polished silicon wafer (4″, <100>) was thermally oxidized to grow 50 nm SiO2 layers on both sides. Then, the SiO2 on the rough side was removed by 5% HF etching, and the central part of the Si substrate was thinned to 100 μm. After deionized water washing and nitrogen drying, a 300 nm aluminum layer was thermally evaporated outside the thinned part to form an ohmic contact. Finally, a 50 nm Si3N4 layer was deposited by plasma-enhanced chemical vapor deposition (PECVD) to achieve a pH sensor. The processed LAPS chip was cut into 1.7 cm × 1.7 cm with a thinned central part of 7 mm × 7 mm and then in turn washed by acetone, ethanol and deionized water for storage and use. The thicknesses of the Si3N4 and SiO2 layer and the thinned central part were confirmed using a field emission scanning electron microscope (Zeiss, Sigma300, Jena, Germany) and a surface profiler (KLA–Tencor, Alpha Step D–100, San Jose, CA, USA), respectively (Figure S1).

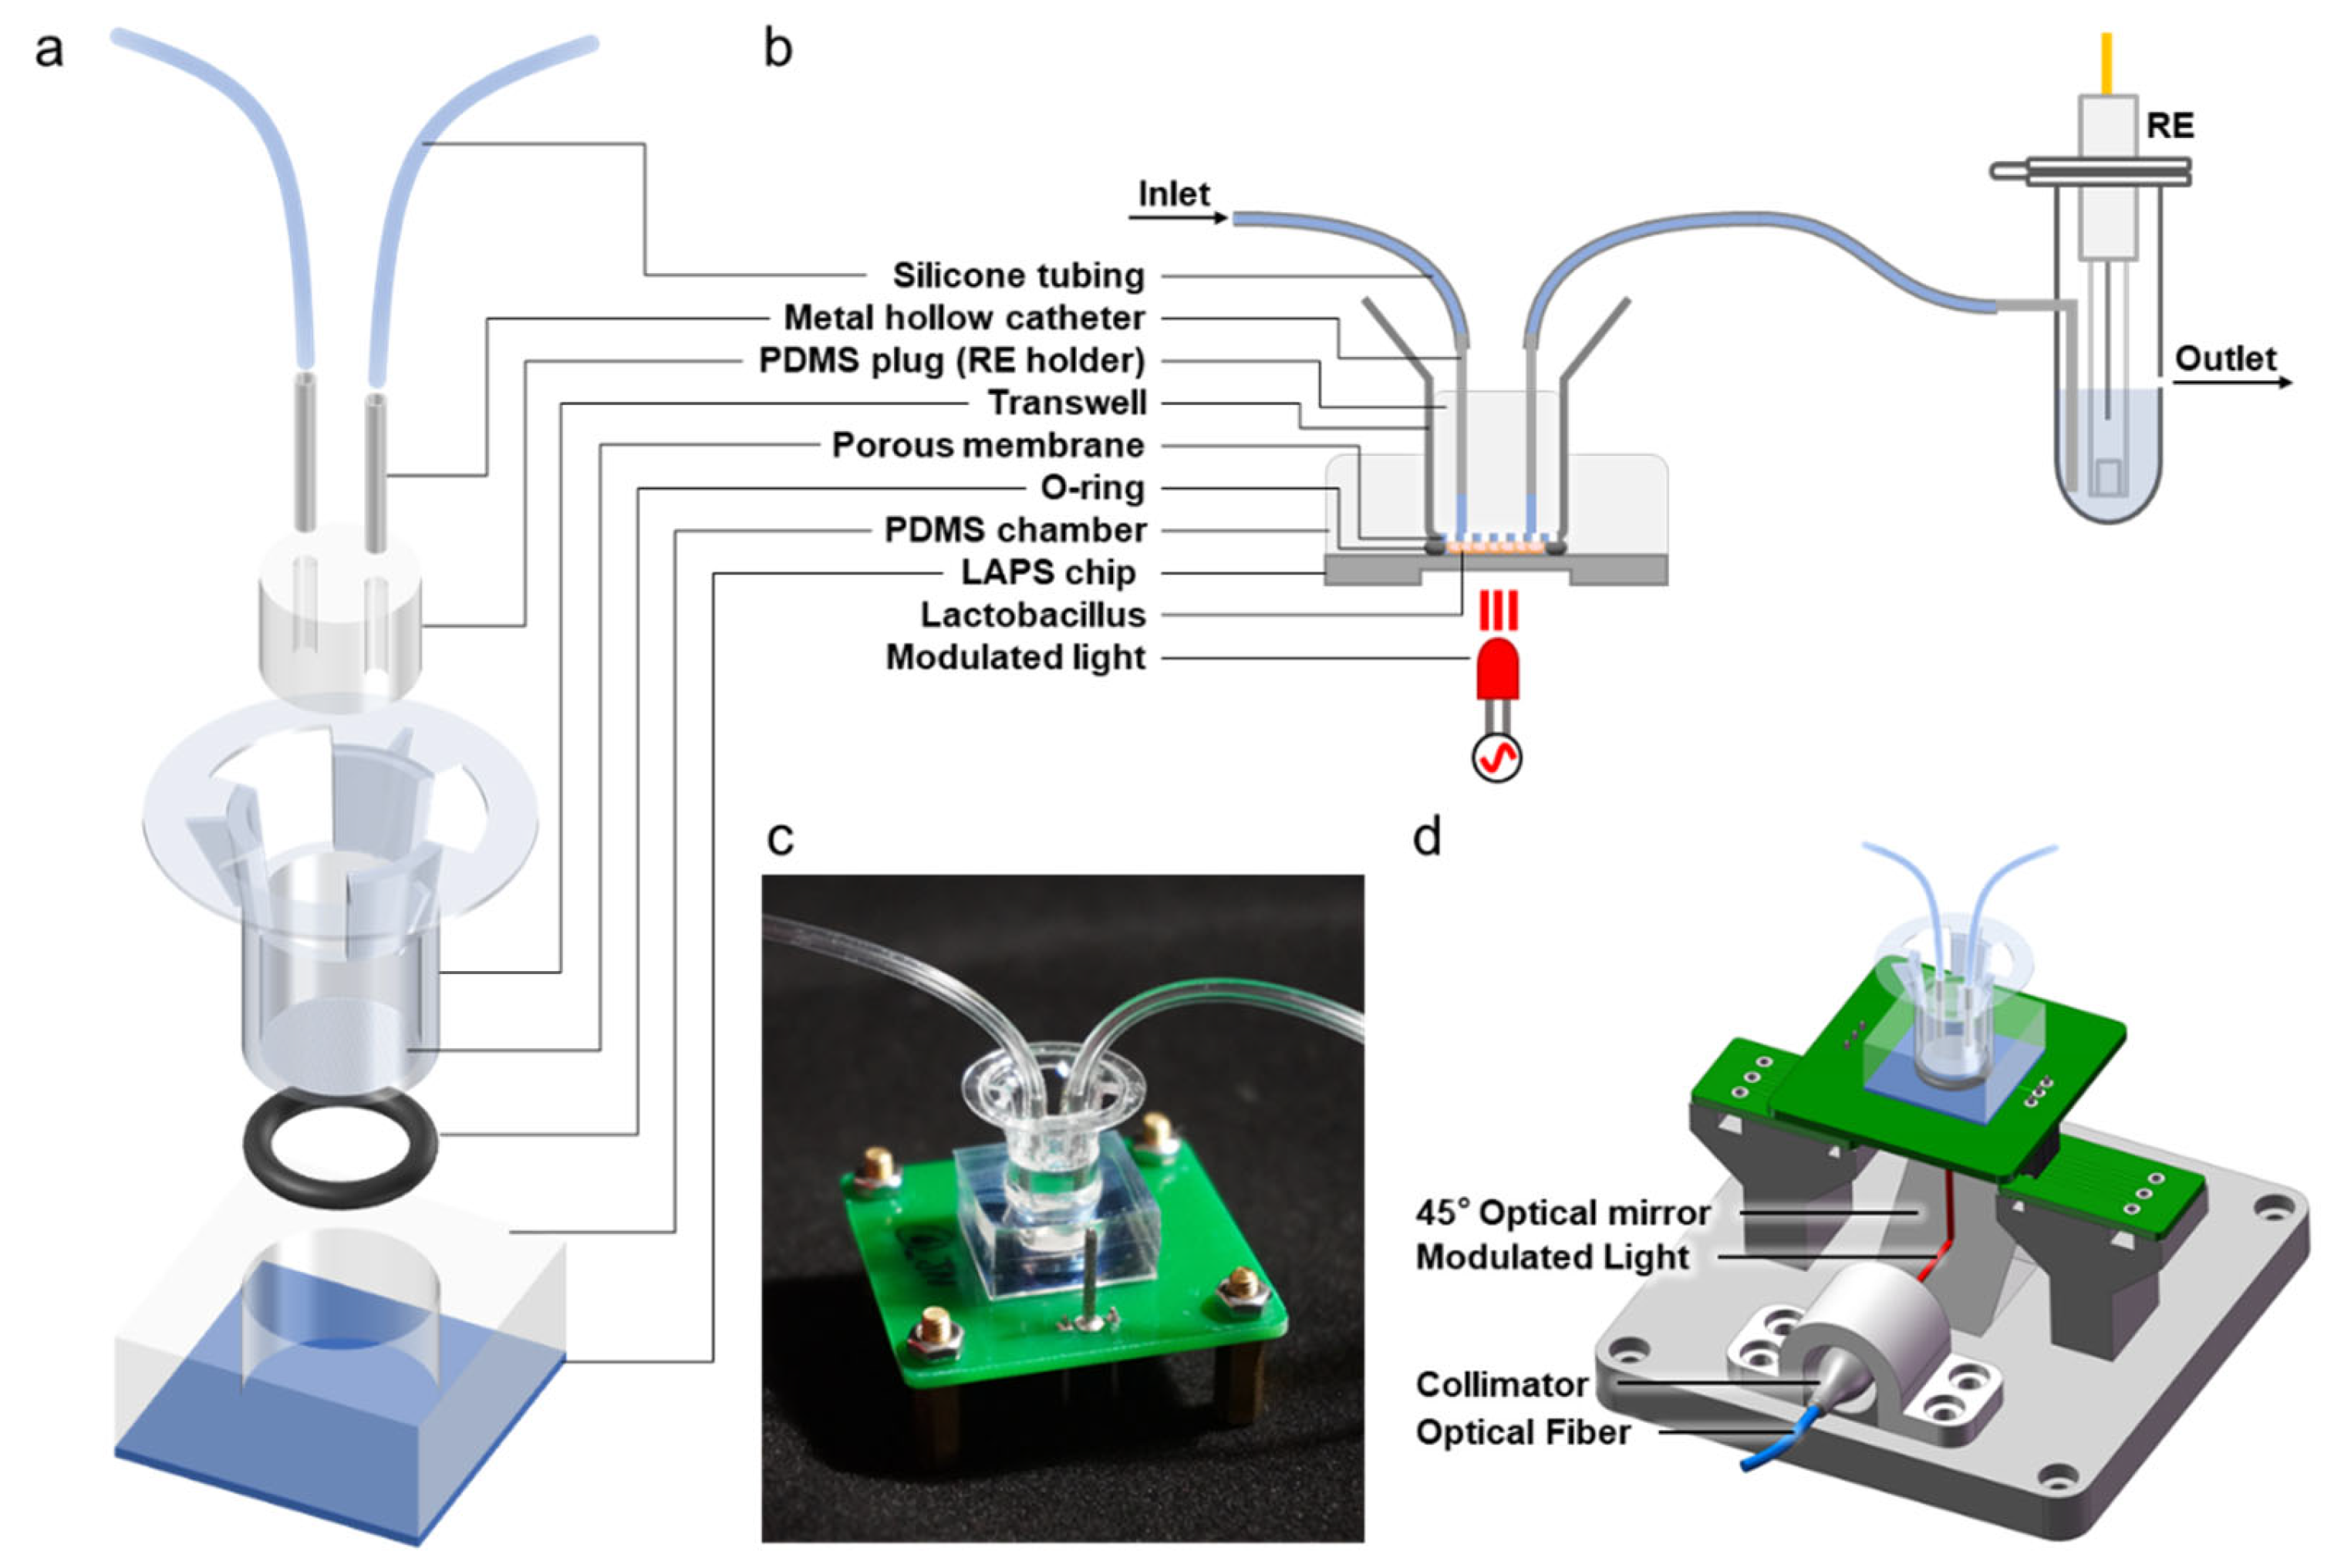
2.2.2. Manufacture of Sensor Unit with Transwell Insert

The Transwell insert with a 0.4 μm pore polycarbonate membrane (6.5 mm, Corning, CLS3413, New York, NY, USA), which can block the LAB while allowing liquids to pass through, was used innovatively to solve the problem that bacteria are difficult to adhere to the surface of LAPS chip. The polydimethylsiloxane (PDMS) chamber was made by mold casting, and the diameter of the through hole in the center was 9.5 mm to fix the Transwell insert. Then, the PDMS chamber was bonded with the LAPS chip by O2 plasma treatment, and an O-ring was placed at the bottom of the chamber to maintain a constant space between the Transwell insert and the sensor chip. The LAB was placed within the scope of the O-ring. The PDMS plug in the Transwell insert was also achieved by the casting method, with two holes used as the inlet and outlet made by a puncher (0.5 mm, WPI). Then, two stainless-steel catheters (20 ga × 15 mm, Instech laboratories, Plymouth Meeting, PA, USA) were fixed into the inlet and outlet connecting the microbore tubings (0.031″ ID × 0.094″ OD, Cole-Parmer, Vernon Hills, IL, USA). The plug (with the stainless-steel catheters) was put into the upper compartment of the Transwell insert, and a small amount of uncured PDMS was used to encapsulate the edges to prevent liquid leakage. It is worth noting that the PDMS stopper was in the shape of a truncated cone, with the bottom edge closely attached to the inner wall of the Transwell insert to prevent contamination of the polycarbonate membrane from the uncured PDMS. The backside of the chip was pasted on a PCB pad with a hole using conductive silver glue to expose the thinned area and connected to the working electrode (WE). The counter electrode (CE) was connected to the stainless-steel catheter of the outlet. The reference electrode was held in a reservoir made of a PE tube, and the hole on the side wall was made to maintain the liquid volume. Figure 3a,b describe the composition of the sensor unit with Transwell insert, and the physical map is shown in Figure 3c.

2.3. LAPS System Set-Up

A 3D-printed resin scaffold was used to fix the optical path and the sensor unit (Figure 3d). The modulated laser with a wavelength at 685 nm was connected to the adjustable focusing collimator via pigtail. The parallel light after collimation (spot of about 1 mm) passed through the 45° optical mirror and illuminated vertically to the thinned area on the back of the LAPS chip. The optical mirror was fixed in a groove at the bottom of the resin scaffold so that the front and back positions could be fine-tuned when necessary. The sensor unit was fixed by the pin header and female header on the PCB pad, which was convenient for installation and disassembly. The scaffold and the sensor unit were placed together in a 37 °C thermostatic incubator for experiment. The medium was delivered to the chamber by the syringe pump (TYD02-10, Lead Fluid Technology Co., Ltd., Baoding, China). The other parts of the detection system were similar to those in a previous study [9].

2.4. Lactobacillus rhamnosus Cultivation

The Lactobacillus rhamnosus (ATCC 7469) strain was purchased from the China general microbiological culture collection center (CGMCC). Before the experiment, the Lact. rhamnosus was inoculated into MRS (Solarbio, M8540, Beijing, China) broth medium, which was sterilized at 121 °C for 15 min. The bacteria were cultivated in an incubator (37 °C) for two generation to restore its activity and were identified by colony morphology and Gram staining. An optical density (OD) measurement (λ = 600 nm, OD600) was carried out to evaluate the growth density and to obtain the growth curve of Lact. rhamnosus (SpectraMax Paradigm, Molecule Device, Sunnyvale, CA, USA).

2.5. Preparation of Test Solutions

Glucose (Macklin, G6172), which is commonly used in food, as well as a commercial sugar substitute (Shandong Youlezi Biotechnology Co., Ltd., Zibo, China) wer selected. Glucose is about 0.75 times sweeter than sucrose, while the substitute sweetener, which is a mixture of sucralose and erythritol, is about twice as sweet as sucrose. Most commercially available sugary beverages have 8–12% (w/v) added sugar, so the concentration of glucose solution was chosen as 12% (w/v) and the concentration of substitute sweetener of corresponding sweetness was 4.5% (w/v). All sugar solutions were prepared with artificial saliva (Dongguan Xinheng Technology Co., Ltd., Dongguan, China) to mimic the human oral environment while providing supporting electrolytes. The artificial saliva containing the same inorganic components as actual saliva was prepared according to ISO 10271 and was sterilized. The artificial saliva without sugar was used as a blank control group. Moreover, the 2.4% (w/v) glucose solution, which has a similar concentration to the glucose in the MRS broth medium, was selected for the experiment as well to verify that the acidification rate of glucose metabolism was different in glucose solutions of different concentrations. In addition, 1% (w/v) tryptone (Solarbio, T8490) was added to each solution to ensure the survival of Lact. Rhamnosus.

2.6. Bacterial Metabolism Monitoring

At the beginning of each measurement, the bacterial suspension was centrifuged at 3000 r/min for 10min and washed three times with artificial saliva, and the pellet was then resuspended in about 40 μL of artificial saliva. Subsequently, Lact. rhamnosus in suspension was pipetted into the sensor chamber formed by the Transwell insert, sensor chip and O-ring, where the bacteria were entrapped by the microporous membrane, while the nutrients and metabolites can pass through freely. The microbore tubing at the inlet was connected to the syringe pump and that at the outlet was connected to the PE tube. Glucose and substitute sweetener solutions were injected at 6 min intervals by the syringe pump to provide nutrients for the bacteria. The medium temperature was maintained at a constant 37 °C using a thermostatic water bath for the duration of the experiment. It is worth noting that all the materials such as O-ring, silicone tubing and metal hollow catheter were autoclaved prior to use and kept sterile until needed in order to avoid biofouling, which may affect the accuracy of the results.

3. Results and Discussion

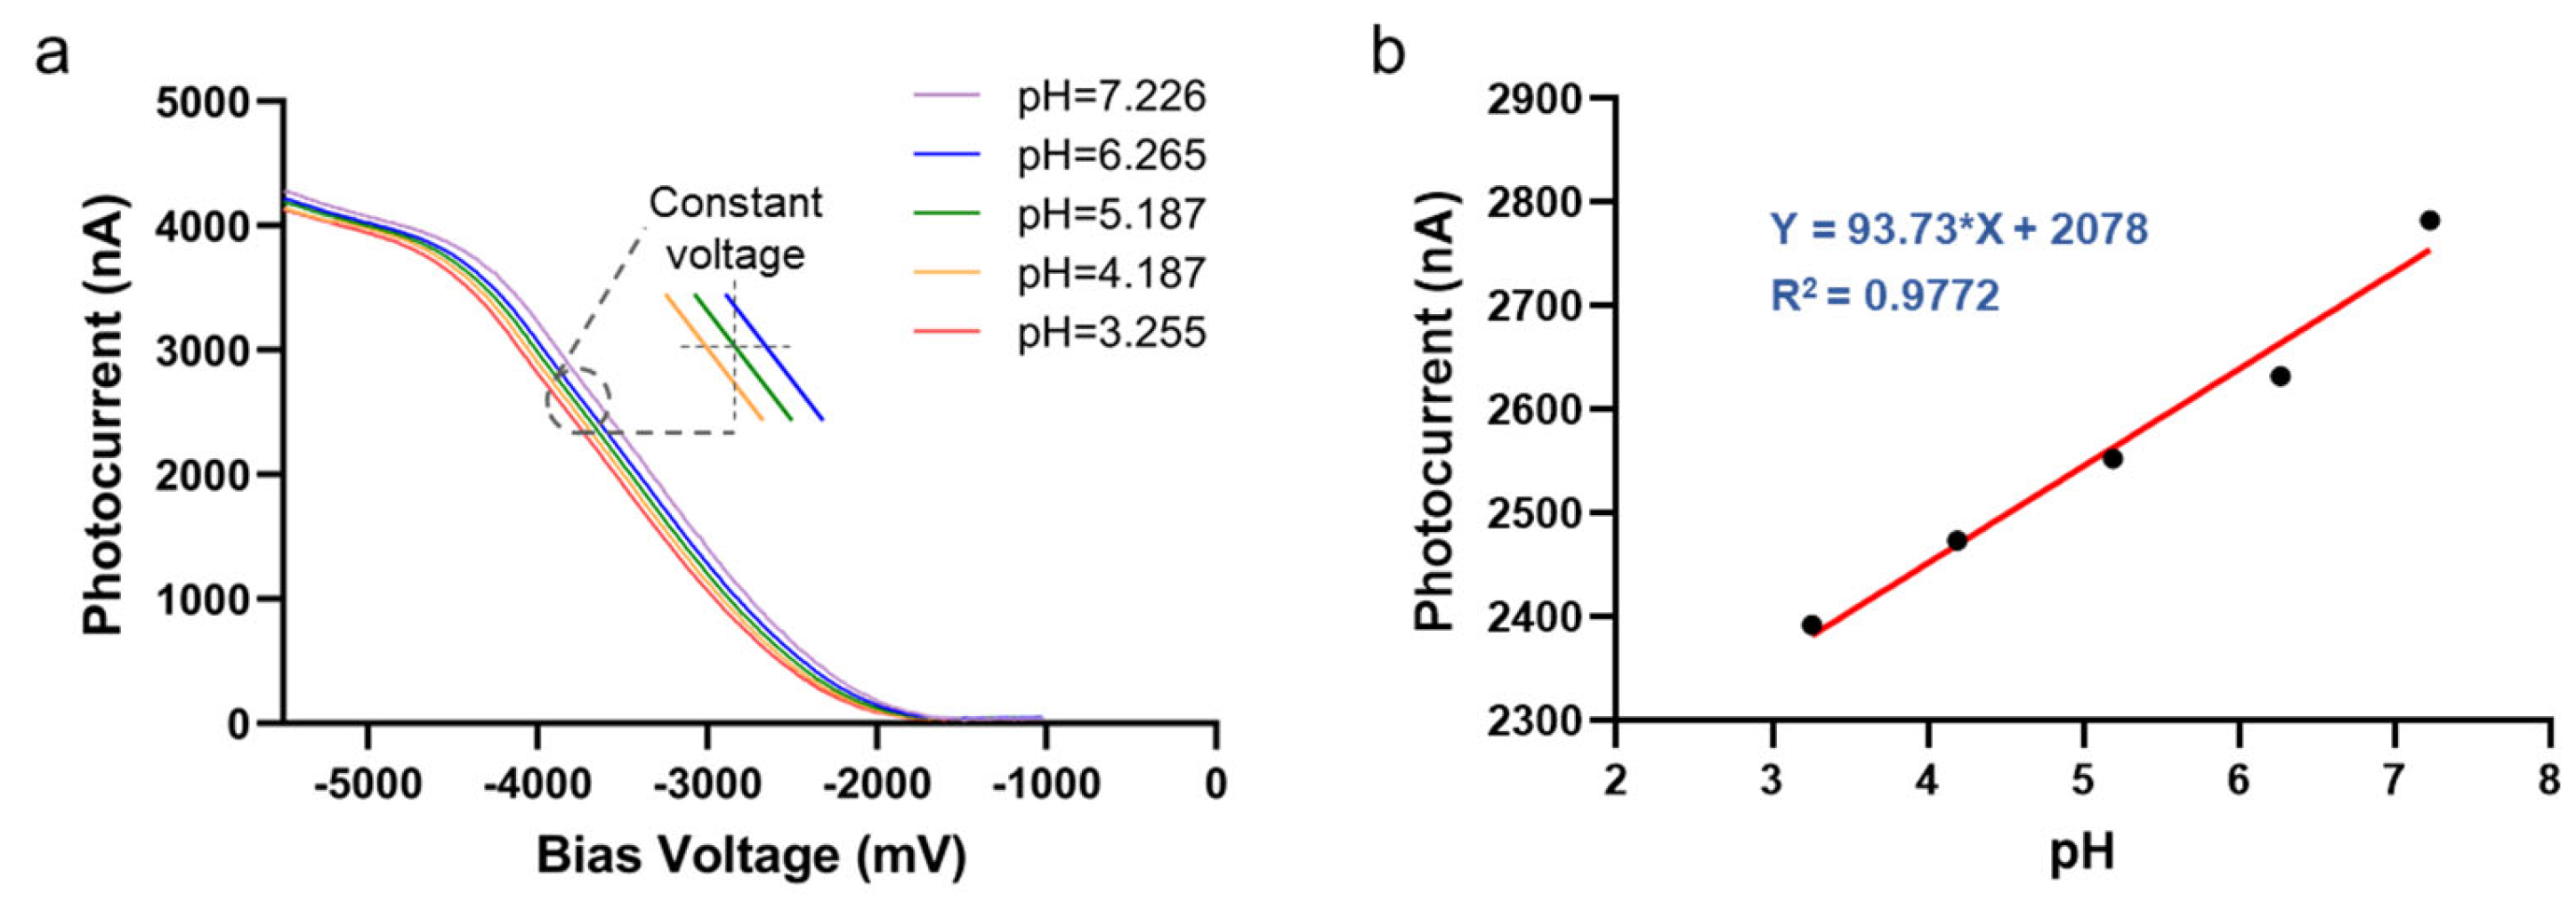
3.1. Sensor Unit Characteristic Test

Phosphate buffer saline (PBS) was used in the experiment for sensor calibration, and the pH in a series of PBS solutions was adjusted between 3.2 and 7.2 using 0.1 mol/L HCl and NaOH solutions. The measurement parameters were as follows: the bias voltage between RE and WE ranged from −5500 mV to −1000 mV, with a step voltage of 10 mV. The modulated light frequency was 10 kHz with a wavelength at 685 nm. Figure 4a shows the detected I–V (photocurrent vs. bias voltage) curves in solutions with different pH gradients. It can be observed that the I–V curve shifts to the left as the pH decreases. The photocurrent value in the greatest slope was selected as the working point [17]. In this work, the goal was to detect the bacterial acidification; the pH change was small and did not exceed the linear part of I–V curve. Therefore, the constant voltage mode was chosen and the sensitivity at the working point was 93.73 nA/pH, as shown in Figure 4b.
In addition, the stability and repeatability of the LAPS sensor was verified by PBS solution (pH = 7.4). In constant voltage mode, the photocurrent was continuously recorded for more than 30 min at the working point voltage. In three replicate experiments, photocurrent showed good stability, and the similar results also demonstrated good repeatability (Figure S2a). The fluid exchange capability of the designed microfluidic system with porous membrane was also verified. The photocurrent curve was obtained by alternately injecting PBS and 10-fold diluted PBS into the sensor chamber because the photocurrent amplitude was affected by the impedance of the solution (Figure S2b). The photocurrent value varied with the solution concentration and showed good consistency when the solution was repeatedly injected. Thus, the microfluidic system with porous membrane presents good fluid exchange capability, which can be used for bacterial metabolism monitoring.

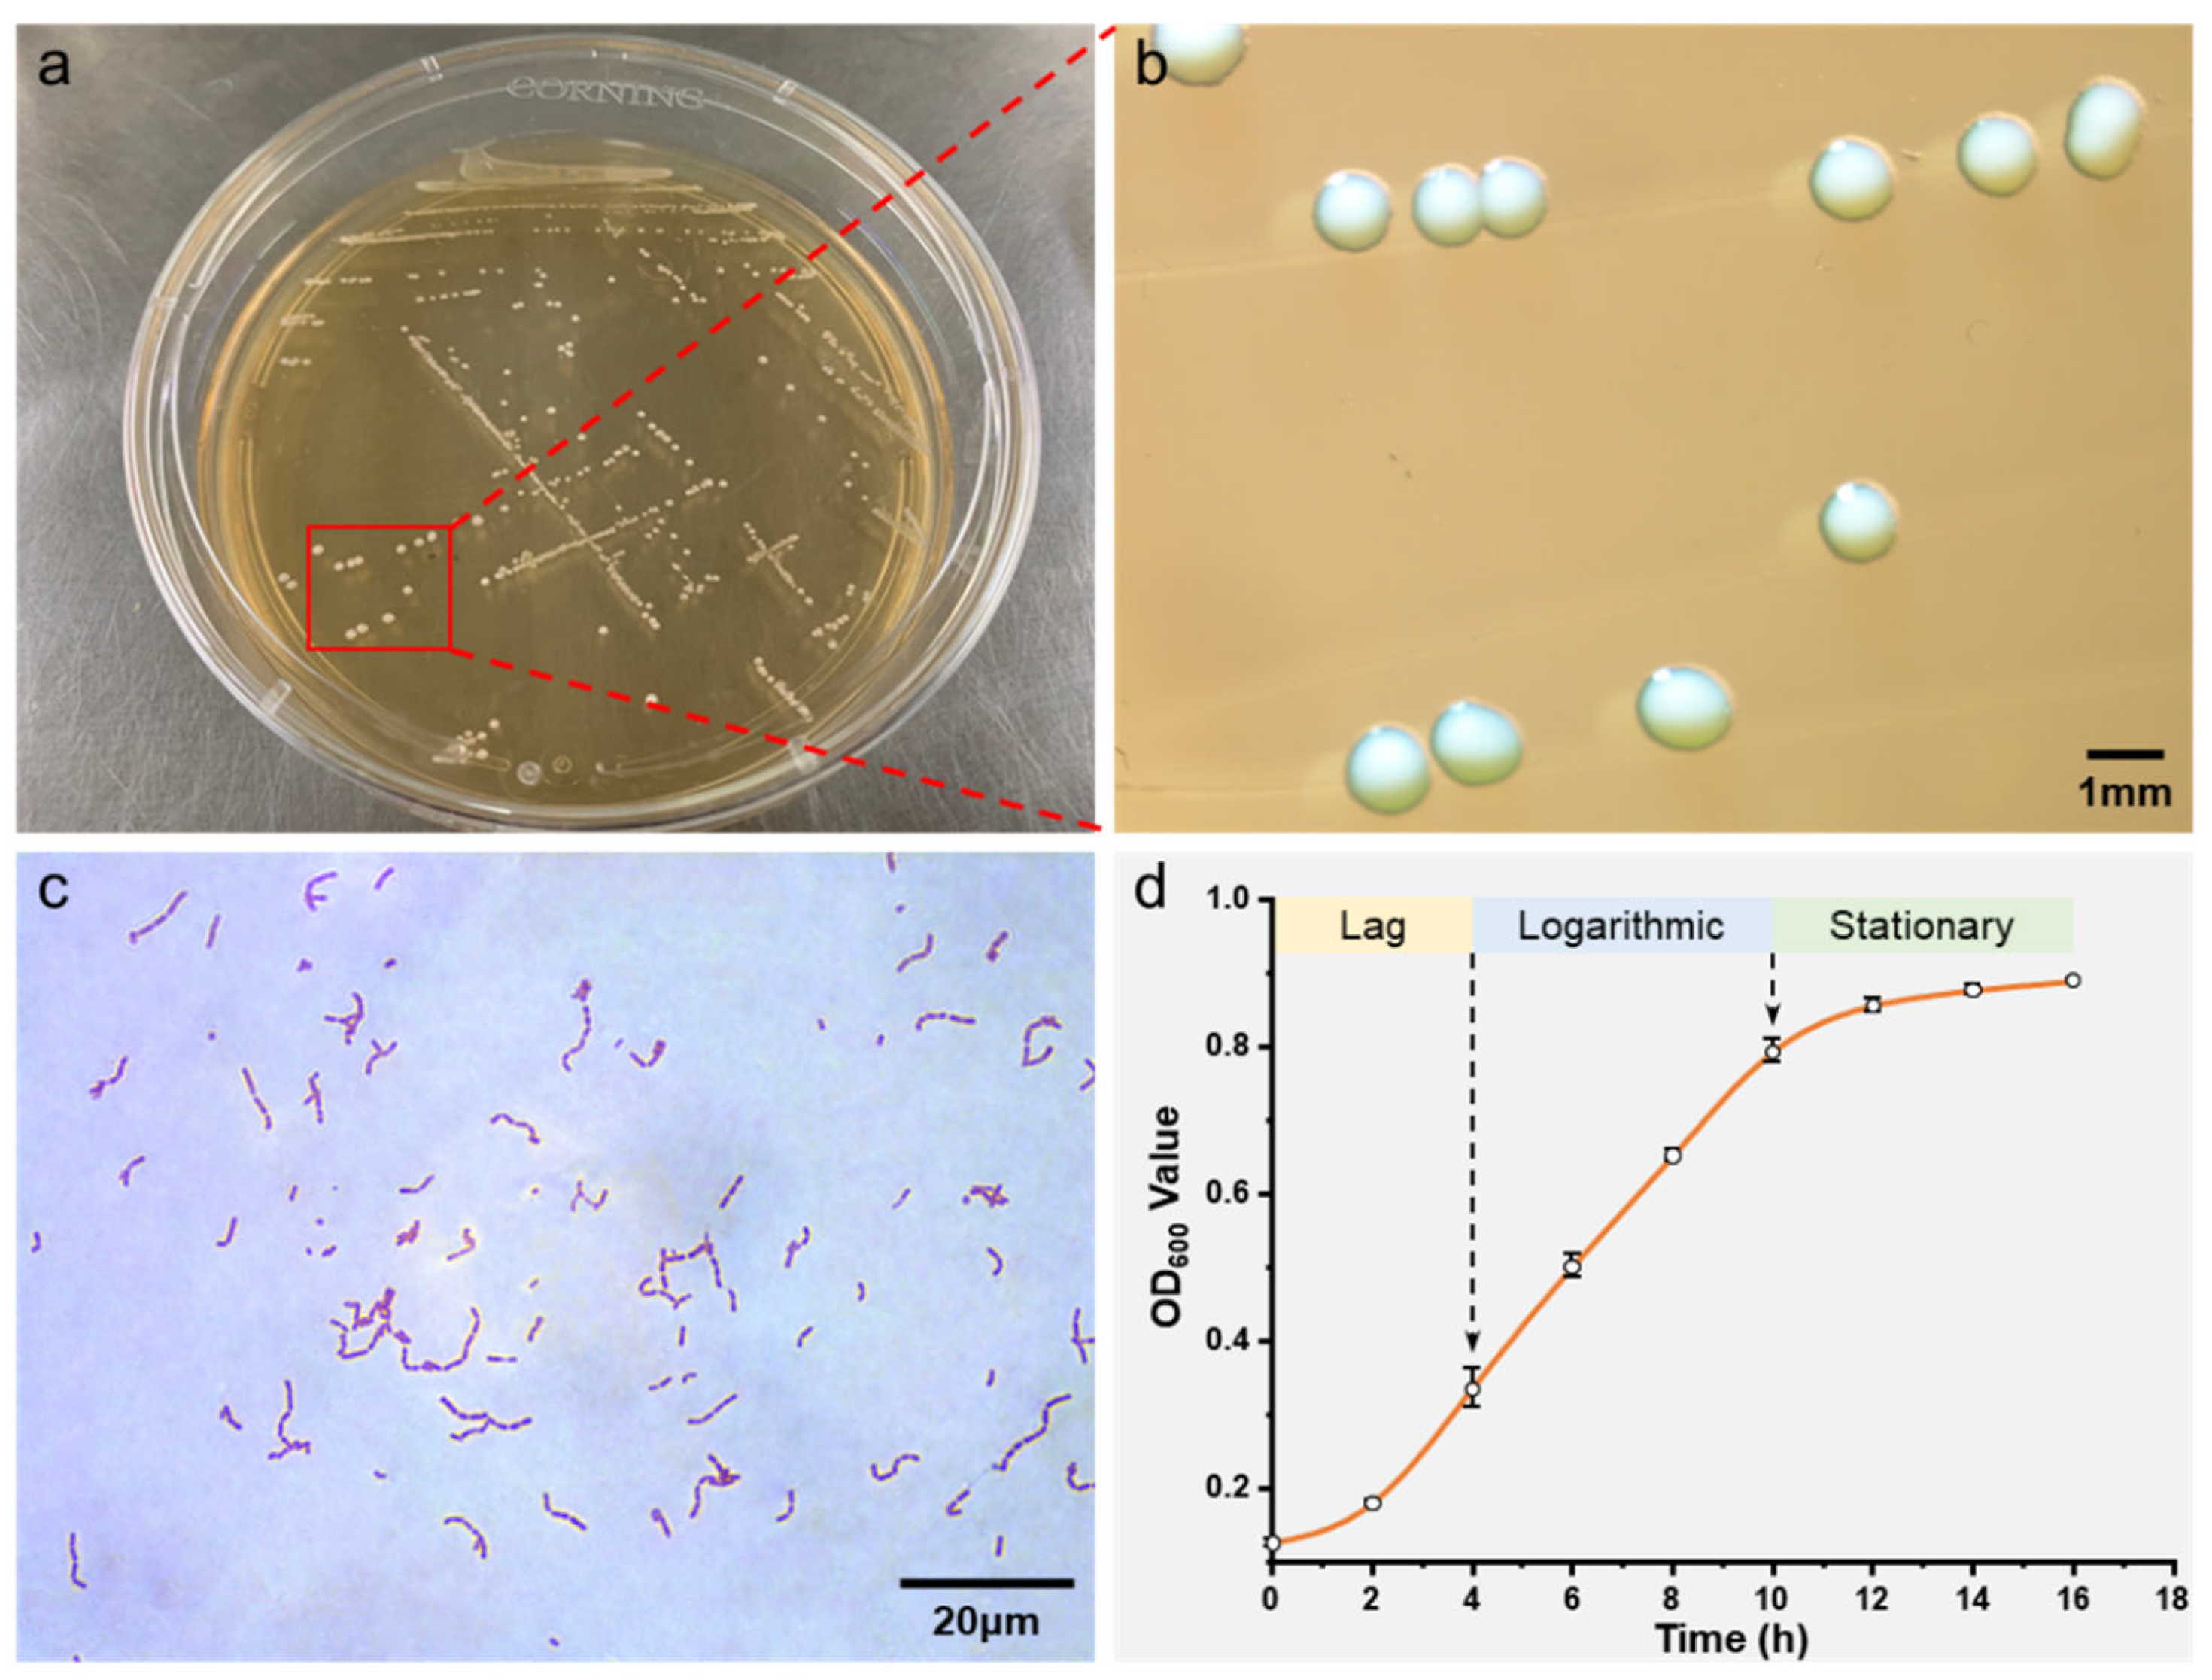
3.2. Lactobacillus rhamnosus Cultivation and Identification

Figure 5a,b showed that the colony of Lact. rhamnosus was light yellow, smooth, moist, round with neat edges, slightly raised center, and about 1 mm in diameter. Microscopically, the bacteria had a shape of a slender, flexuous rod and yielded a positive result in Gram stain test (Figure 5c), which was consistent with the characteristics of Lact. rhamnosus.
In order to create a growth curve of Lact. rhamnosus, the OD600 value of the bacterial suspension was detected every two hours until the growth of the bacteria became visibly slow. As shown in Figure 5d, the curve was S-shaped, indicating that Lact. rhamnosus underwent various stages from rapid proliferation to steady growth. The bacteria entered the logarithmic phase at 2–4 h and the number began to increase exponentially. Moreover, the curve tended to be flat after 10 h, demonstrating that the bacteria entered a stationary phase. The bacteria at post-log phase, that is, about 8 h after inoculation into MRS broth medium, were chosen because of the strong reproduction ability and vigorous metabolism, which was conductive to the experiment.

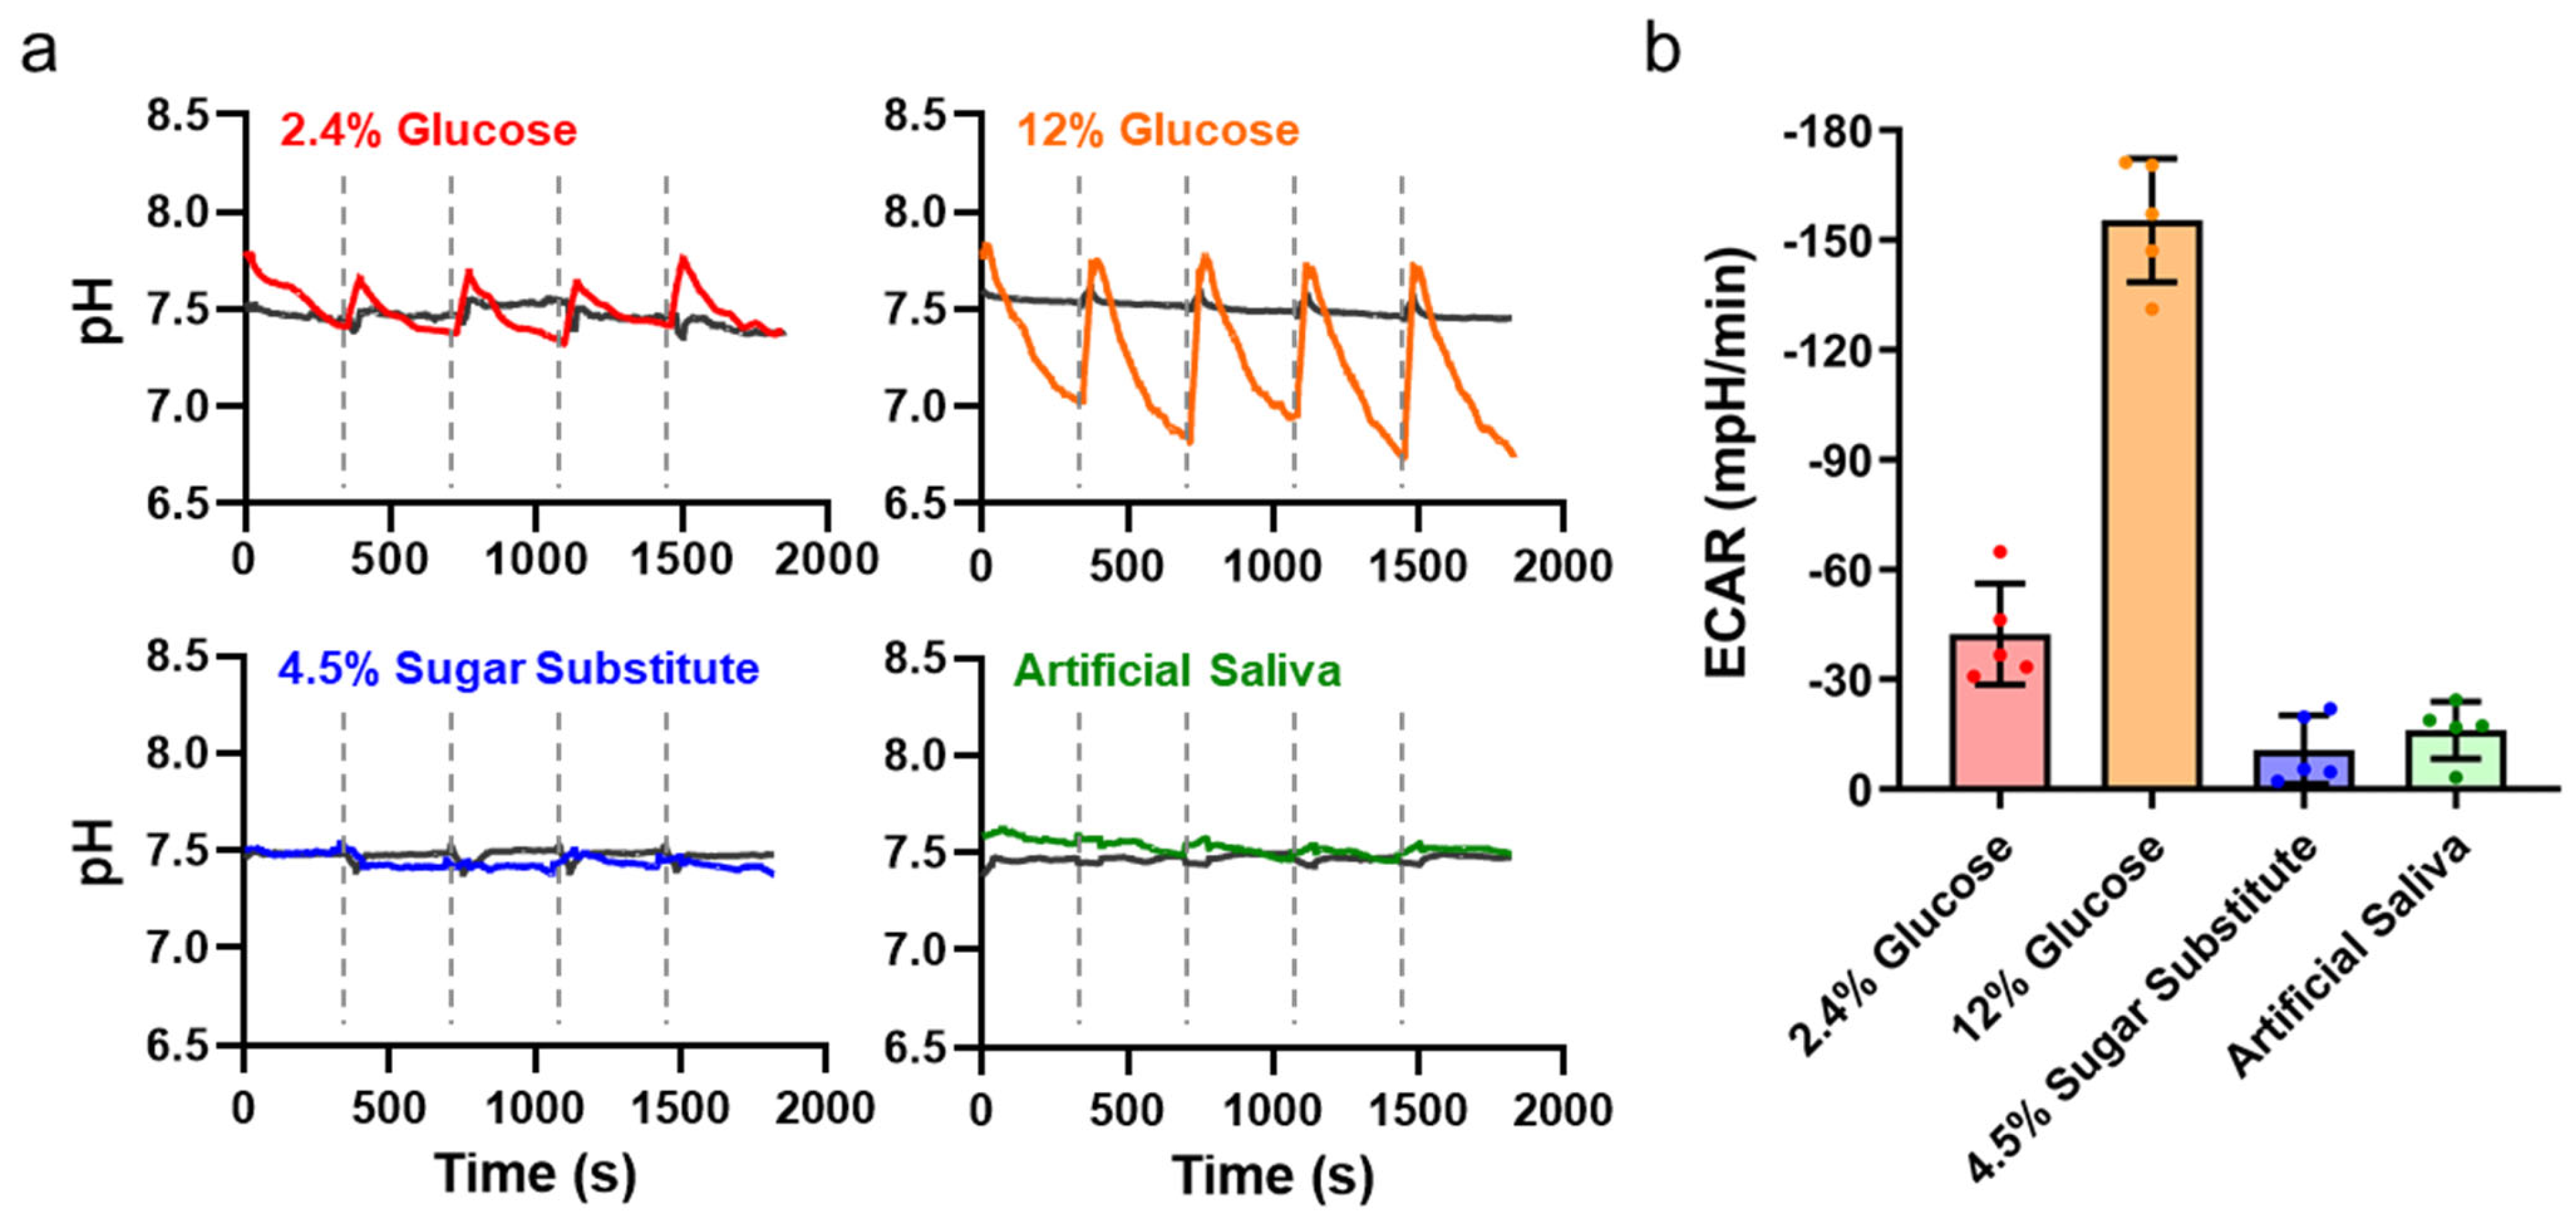
3.3. Lactobacillus rhamnosus Metabolism Monitoring by the Microphysiometer

The sensor unit was always placed in the 37 °C thermostatic incubator during the experiment to maintain the strain vitality, and all of the medium was placed in the 37 °C thermostatic water bath. Initially, the 2.4% glucose solution was injected until there was liquid flowing out of the hole on the side wall of the PE tube. The bias voltage of the working point was applied, and the photocurrent was recorded continuously under constant voltage mode. The solution was injected at 6 min intervals by the syringe pump, and the photocurrent–time curve was obtained. After five flow–stop cycles, 12% glucose solution was injected, replacing the solution in the whole device completely, and the acidity change was also recorded, followed by the 4.5% sugar substitute solution and artificial saliva. The blank group had the same condition as the experimental group except the absence of Lact. rhamnosus.
According to the formula in Figure 4b, the photocurrent value was converted to a pH value to obtain the pH–time curves, which demonstrated the pH changes in the process of Lact. rhamnosus metabolism (Figure 6a). In the 2.4% glucose solution, the pH decreased because Lact. rhamnosus used glucose to produce acid substances such as lactic acid. After the glucose concentration was increased to 12%, a steeper decrease in pH occurred due to the enhanced metabolism. However, sucralose and erythritol could not be utilized as a carbon source by Lact. rhamnosus, so the pH the solution hardly changed, which was similar to the results of artificial saliva.
Due to the addition of fresh solution, the peak of the photocurrent appeared at the beginning of each cycle. It could be seen from the blank group that the photocurrent decreased slightly after 80 s in each cycle; thus, it could be inferred that the change in pH after 80 s was caused by bacterial metabolism. Therefore, the difference in pH change between the experimental group and the blank group 80 s after the beginning of each cycle was defined as ΔpH. Then, the extracellular acidification rate (ECAR) was obtained by the ratio of the ΔpH value to the time interval (280 s), and the average ECAR values of each group were calculated and shown in Figure 6b. The average of ECAR in the 2.4% glucose solution was −42.38 mpH/min but changed to −155.41 mpH/min in the 12% glucose solution. Additionally, the averages of ECAR in the 4.5% sugar substitute solution and artificial saliva were −10.79 mpH/min and −16.12 mpH/min, respectively. It can be concluded that the glucose fermentation in Lact. rhamnosus caused the pH of the solution to decrease, and with the increase in glucose concentration, the acidification rate also significantly increased. However, the pH of the sugar substitute solution and artificial saliva almost did not change, which confirmed that sugar substitute combined with sucralose and erythritol could not be utilized by Lact. rhamnosus.
In a previous study, the 24 h pH drop caused by glucose fermentation of LAB include Lact. rhamnosus was detected using a pH meter [3]. However, it has obvious limitations, such as the accuracy and sensitivity not being high and achieving real-time detection being difficult, which were overcome in this study with the newly designed microphysiometric system. In addition, there also exist several studies that use LAPS-based differential sensors to detect the extracellular acidification of bacteria [10,11]. Since the solution cannot be renewed, there are still problems in realizing continuous long-term monitoring. The results of this study confirmed that the microphysiometric system integrated with the Transwell insert and LAPS could monitor the metabolism of microorganisms such as Lact. rhamnosus in real time and with high sensitivity. The microfluidic system ensured continuous renewal of the medium to achieve long-term monitoring, and the stable illumination avoided disturbances in the large photocurrent fluctuation. In this way, long-term monitoring for metabolism of living microorganisms can be achieved.

3.4. Verification of Activity of Lactobacillus rhamnosus after Experiment

After the experiment, the bacterial suspension was collected and streaked on a MRS agar plate. After 48 h of incubation at 37 °C, single colonies of Lact. rhamnosus but no other types of colonies were observed (Figure S3). This indicated that the bacteria remained alive after a long time of detection, and there was no other bacterial contamination during the experiment. However, it could be found that the colony density was not high, which indicated that the number of viable bacteria decreased, or the ability of growth and reproduction reduced. It may be because the bacteria had left the most suitable medium environment for a long time, and sugar substitute and artificial saliva could not be used as carbon sources. According to the results, it can be concluded that the pH change in the glucose solution was caused by the metabolism of Lact. rhamnosus.

4. Conclusions

Although LAPS is widely used in extracellular acidification detection of living cells, it is rarely used to investigate non-adherent targets directly in suspension. In this study, a microphysiometric system with a novel structure fabricated by a Transwell insert and a microfluidic LAPS chip was used to detect the pH change in glucose and sugar substitutes solutions in the presence of Lact. rhamnosus, respectively. All of the solutions were prepared with artificial saliva to mimic the human oral environment. A polydimethylsiloxane (PDMS) chamber was manufactured for bacterial culture, and microfluidic flow paths were designed for medium delivery. A Transwell insert with a 0.4 μm pore polycarbonate membrane was used innovatively to solve the problem that adhering bacteria to the surface of a LAPS chip is difficult, which not only prevents bacteria from being washed away but also allows nutrients and metabolites to pass through. Additionally, the existence of O-ring restricts the bacteria to the effective detection area and avoids contact between the Transwell and the LAPS chip. Similar to previous studies, the experiment was carried out in several flow–stop cycles and compared with the control groups without the presence of bacteria. Lact. rhamnosus caused a decrease in the pH of the glucose solution, and the change became more significant when the glucose concentration increased, while the pH of other solutions hardly changed. The results presented that this microphysiometric system performed well in real-time monitoring of microbial metabolism. The functions of a traditional microphysiometer were achieved with simpler structure devices. Although changes in acidity can be evaluated by sensory evaluation, the pH change can be measured more objectively and quantitatively by this microphysiometric system. Further work can be carried out to improve the sensitivity of the sensor, such as using Al2O3 [18] or Ta2O5 [19] layers deposited on an insulator. In summary, our work presents a model system for non-adhere targets such as microorganisms and even 3D cells and organoids.

Supplementary Materials

The following supporting information can be downloaded at https://0-www-mdpi-com.brum.beds.ac.uk/article/10.3390/chemosensors10050177/s1, Figure S1: Verification of the thickness of the thinned LAPS chip; Figure S2: Verification of stability, repeatability and fluid exchange capability of the system; Figure S3: Verification of the activity of Lactobacillus rhamnosus after experiment.

Author Contributions

Conceptualization, N.J., T.L. and L.Z.; methodology, N.J., T.L. and Q.Y.; validation, N.J., T.L. and C.Q.; formal analysis and investigation, N.J. and T.L.; resources, N.J., C.Q. and M.L.; data curation, N.J. and T.L.; writing—original draft preparation, N.J. and T.L.; writing—review and editing, L.Z. and P.W. All authors have read and agreed to the published version of the manuscript.

Funding

This research was funded by the National Natural Science Foundation of China (No. 62120106004), National Key Research and Development Program of China (2021YFF1200803, 2021YFB3200801 and SQ2021AAA010032), Natural Science Foundation of Zhejiang Province (No. LBY21H180001 and LY21C100001) and China Postdoctoral Science Foundation Funded Project (No. 2020M671728 and 2021T140605).

Institutional Review Board Statement

Not applicable.

Informed Consent Statement

Not applicable.

Data Availability Statement

Not applicable.

Conflicts of Interest

The authors declare no conflict of interest.

References

  1. Barbour, A.; Elebyary, O.; Fine, N.; Oveisi, M.; Glogauer, M. Metabolites of the oral microbiome: Important mediators of multikingdom interactions. FEMS Microbiol. Rev. 2022, 46, fuab039. [Google Scholar] [CrossRef] [PubMed]
  2. Kilian, M.; Chapple, I.L.; Hanning, M.; Marsh, P.D.; Meuric, V.; Pedersen, A.M.L.; Tonetti, M.S.; Wade, W.S.; Zaura, E. The oral microbiome—An update for oral healthcare professionals. Br. Dent. J. 2016, 221, 657–666. [Google Scholar] [CrossRef] [PubMed]
  3. Badet, M.C.; Richard, B.; Dorignac, C. An in vitro study of the pH-lowering potential of salivary lactobacilli associated with dental caries. J. Appl. Microbiol. 2001, 90, 1015–1018. [Google Scholar] [CrossRef] [PubMed]
  4. Ahrné, S.; Nobaek, S.; Jeppsson, B.; Adlerberth, I.; Wold, A.; Molin, G. The normal Lactobacillus flora of healthy human rectal and oral mucosa. J. Appl. Microbiol. 1998, 85, 88–94. [Google Scholar] [CrossRef] [PubMed]
  5. Kandler, O. Carbohydrate metabolism in lactic acid bacteria. Antonie Van Leeuwenhoek 1983, 49, 209–224. [Google Scholar] [CrossRef] [PubMed]
  6. Werner, C.F.; Krumbe, C.; Schumacher, K.; Groebel, S.; Spelthahn, H.; Stellberg, H.; Wagner, T.; Yoshinobu, T.; Selmer, T.; Keusgen, M.; et al. Determination of the extracellular acidification of Escherichia coli by a light-addressable potentiometric sensor. Phys. Status Solidi 2011, 208, 1340–1344. [Google Scholar] [CrossRef]
  7. Dantism, S.; Takenaga, S.; Wagner, T.; Wagner, P.; Schöning, M.J. Differential imaging of the metabolism of bacteria and eukaryotic cells based on light-addressable potentiometric sensors. Electrochim. Acta 2017, 246, 234–241. [Google Scholar] [CrossRef]
  8. Hu, N.; Wu, C.; Ha, D.; Wang, T.; Liu, Q.; Wang, P. A novel microphysiometer based on high sensitivity LAPS and microfluidic system for cellular metabolism study and rapid drug screening. Biosens. Bioelectron. 2013, 40, 167–173. [Google Scholar] [CrossRef] [PubMed]
  9. Liang, T.; Gu, C.; Gan, Y.; Wu, Q.; He, C.; Tu, J.; Pan, Y.; Qiu, Y.; Kong, L.; Wan, H.; et al. Microfluidic chip system integrated with light addressable potentiometric sensor (LAPS) for real-time extracellular acidification detection. Sens. Actuators B 2019, 301, 127004. [Google Scholar] [CrossRef]
  10. Dantism, S.; Takenaga, S.; Wagner, P.; Wagner, T.; Schöning, M.J. Determination of the extracellular acidification of Escherichia coli K12 with a multi-chamber-based LAPS system. Phys. Status Solidi 2016, 213, 1479–1485. [Google Scholar] [CrossRef]
  11. Dantism, S.; Röhlen, D.; Wagner, T.; Wagner, P.; Schöning, M.J. A LAPS-Based Differential Sensor for Parallelized Metabolism Monitoring of Various Bacteria. Sensors 2019, 19, 4692. [Google Scholar] [CrossRef] [PubMed] [Green Version]
  12. Dantism, S.; Röhlen, D.; Dahmen, M.; Wagner, T.; Wagner, P.; Schöning, M.J. LAPS-based monitoring of metabolic responses of bacterial cultures in a paper fermentation broth. Sens. Actuators B 2020, 320, 128232. [Google Scholar] [CrossRef]
  13. Hafner, F. Cytosensor® Microphysiometer: Technology and recent applications. Biosens. Bioelectron. 2000, 15, 149–158. [Google Scholar] [CrossRef]
  14. Eiteman, M.A.; Ramalingam, S. Microbial production of lactic acid. Biotechnol. Lett. 2015, 37, 955–972. [Google Scholar] [CrossRef] [PubMed]
  15. Wang, Y.; Wu, J.; Lv, M.; Shao, Z.; Hungwe, M.; Wang, J.; Bai, X.; Xie, J.; Wang, Y.; Geng, W. Metabolism Characteristics of Lactic Acid Bacteria and the Expanding Applications in Food Industry. Front. Bioeng. Biotechnol. 2021, 9, 612285. [Google Scholar] [CrossRef] [PubMed]
  16. Owicki, J.C.; Bousse, L.J.; Hafeman, D.G.; Kirk, G.L.; Olson, J.D.; Wada, H.G.; Parce, J.W. The Light-Addressable Potentiometric Sensor: Principles and Biological Applications. Annu. Rev. Biophys. Biomol. Struct. 1994, 23, 87–114. [Google Scholar] [CrossRef] [PubMed]
  17. Stein, B.; George, M.; Gaub, H.; Behrends, J.; Parak, W. Spatially resolved monitoring of cellular metabolic activity with a semiconductor-based biosensor. Biosens. Bioelectron. 2003, 18, 31–41. [Google Scholar] [CrossRef]
  18. Schöning, M.J.; Tsarouchas, D.; Beckers, L.; Schubert, J.; Zander, W.; Kordoš, P.; Lüth, H. A highly long-term stable silicon-based pH sensor fabricated by pulsed laser deposition technique. Sens. Actuators B 1996, 35, 228–233. [Google Scholar] [CrossRef]
  19. Yoshinobu, T.; Ecken, H.; Poghossian, A.; Lüth, H.; Iwasaki, H.; Schöning, M. Alternative sensor materials for light-addressable potentiometric sensors. Sens. Actuators B 2001, 76, 388–392. [Google Scholar] [CrossRef]
Figure 1. Schematic of the main steps of glucose metabolism in lactic acid bacteria in human oral cavity. The major intermediate and end products are shown in yellow background, of which lactic acid and acetic acid are the key substance causing pH change in the solution.
Chemosensors 10 00177 g001
Figure 2. The detection principle and fabrication of the thinned LAPS chip. (a) The principle of acidic metabolites detection by the thinned LAPS chip. (b) The processing flow of the thinned LAPS chip.
Chemosensors 10 00177 g002
Figure 3. Schematic of microphysiometer sensor unit with the Transwell insert. (a) Schematic of the detection chamber fabricated by the Transwell insert with a microporous membrane. (b) Schematic of the microphysiometer sensor unit with a microfluidic structure. (c) Photography of the device. (d) Schematic of the 3D-printed resin scaffold used to fix the optical path and the sensor unit.
Chemosensors 10 00177 g003
Figure 4. Performance evaluation of sensor unit. (a) I–V curves in different gradient pH solutions. (b) Sensor calibration curve in constant voltage mode (U = −3760 mV).
Chemosensors 10 00177 g004
Figure 5. Morphological characteristics and growth curve of Lactobacillus rhamnosus. (a) The growth state of Lact. rhamnosus on MRS agar plate. (b) Observation of single colony under an optical microscope. (c) Bacterial morphology with Gram staining (×100 magnification). (d) Growth curve of Lact. rhamnosus.
Chemosensors 10 00177 g005
Figure 6. The pH change and ECAR values of sweetener metabolism of Lactobacillus rhamnosus. (a) The pH changed with time, and a fresh medium was injected every 360s; the 2.4% (w/v) glucose solution, the 12% (w/v) glucose solution, the 4.5% (w/v) sugar substitute solution and artificial saliva were injected successively. (b) The average ECAR values of different sweetener solutions and artificial saliva.
Chemosensors 10 00177 g006
Publisher’s Note: MDPI stays neutral with regard to jurisdictional claims in published maps and institutional affiliations.

