Fabrication of Functional Super-Hydrophilic TiO2 Thin Film for pH Detection


1
School of Mechanical Engineering, Jiangsu University, Zhenjiang 212013, China
2
College of Electrical Engineering, Henan University of Technology, Zhengzhou 450001, China
*
Author to whom correspondence should be addressed.
Chemosensors 2022, 10(5), 182; https://0-doi-org.brum.beds.ac.uk/10.3390/chemosensors10050182
Submission received: 14 April 2022
/
Revised: 5 May 2022
/
Accepted: 7 May 2022
/
Published: 11 May 2022
(This article belongs to the Section Electrochemical Devices and Sensors)
Abstract
:A super-hydrophilic pH-sensitive electrode with a porous TiO2 thin film is proposed in this work and fabricated using the chemical etching method. In total, 30 groups of porous TiO2 thin film were obtained by immersing a Ti sheet in NaOH, with the solution concentration ranging from 0.5–4 M and the reaction time ranging from 15–240 min. SEM, XRD, XPS, and a contact angle meter were used to investigate the influence of the chemical etching parameters on the morphology, composition, and wettability of the fabricated electrodes. The chemical etching parameters were found to have a significant influence on the specific surface area and the component of the films, which strongly affected the wettability and pH sensing characteristics of the electrodes. The electrode obtained with a solution concentration of 1 M and reaction time of 120 min is the ideal product because of its excellent wettability, with a contact angle of 5.46°, and good pH sensing characteristics in pH buffer solutions. The electrode also showed good stability regarding its wettability and pH sensing properties during storage and utilization.
1. Introduction
In 1997, Fujishima demonstrated the super-hydrophilic effect of a TiO2 polycrystalline film exposed to UV [1]. Since then, super-hydrophilic surfaces have been extensively applied, such as for improving the performance of sensors. Humidity sensors based on super-hydrophilic surfaces were found to show the advantages of a high sensitivity, fast response, and short recovery time [2,3]. A super-hydrophilic surface has an extremely low contact angle and allows fast spreading of water on its surface. Thus, a small water drop can cover a large area of the super-hydrophilic surface, producing a large effective area for electrochemical reaction and thus improving the pH sensing performance [4,5,6].
pH sensors based on metal oxides, such as RuO2, ZnO, SnO2, TiO2, and V2O5, are alternatives to glass electrodes and have the advantages of good stability over a wide pH range, high mechanical robustness, miniaturization, wide-ranging working temperature, and a fast response in aqueous or non-aqueous environments [7]. Among pH sensing metal oxides, TiO2 is a promising material for new pH sensors owing to its superior chemical stability, non-toxicity, relatively inexpensive costs, and easy fabrication. Various methods have been proposed for TiO2 films for pH detection. Yao reported a sol-gel TiO2 pH sensor that was deposited on ITO glass and post-annealed at 200 °C, which showed a sensitive response of 79.9 μA/pH [8]. Yusof used an RF magnetron sputtering system to fabricate a TiO2 sensing membrane of an EGFET pH sensor, which showed a Nernstian response of 59.89 mV/pH [9]. Huang prepared a pH sensor with TiO2 nanowire arrays using the hydrothermal growth method, and a sensitivity of 62 mV/pH was detected [10]. Doghmane used the spin coating method to fabricate a TiO2- and AgCl-based pH sensor with a sensitivity of 45.229 mV/pH [11].
TiO2 has also received significant attention regarding its application on super-hydrophilic surfaces. Anatase-phase TiO2 has a good hydrophilic ability and can become a super-hydrophilic surface when exposed to UV [1,12]. Zhao reported that the sensitivity of a pH sensor based on TiO2 nanotube arrays increased from 54.5 to 59 mV/pH and achieved good hydrophilicity when UV mediation was used [5]. However, the hydrophilic TiO2 films obtained using UV mediation reportedly became hydrophobic within several hours or several days of storage [13,14,15].
The fabrication of a microstructure with a large specific surface area on its surface is another method that is used to obtain a super-hydrophilic surface. Ohishi and Tanaka reported the formation of porous TiO2 on the surface of a Ti sheet by immersing the Ti sheet in NaOH solution [16,17]. Tanaka indicated that the presence of TiH2, formed during the pretreatment, is one of the factors crucial to obtaining a porous TiO2 membrane on Ti [17]. He explained the reaction mechanism by using the following equation:
The formation of the porous structure is due to the ability of Ti to absorb hydrogen:
where Hab is the hydrogen absorbed by Ti. The formed H2 escapes and leaves holes on the surface, generating its porous structure. Conversely, Ohishi believed that the reaction is driven by the following equation:
Although the mechanism of the formation of the porous TiO2 through the chemical etching of titanium is ambiguous, the influence factor and rules of the reaction process and products are specific. Tanaka reported that pore size and film thickness are significantly influenced by the reaction time, temperature, and concentration of NaOH solution [17,18]. He used 5 M NaOH solution to form the porous TiO2 membrane and indicated that the products were only Ti and TiO2 when the solution temperature was 80 °C [18]. Chen obtained a porous TiO2 membrane using NaOH solutions with relatively low concentrations (0.5 M–4 M). They reported that some titanates formed after a long reaction time at 80 °C, but the main products were TiO2 [19]. Kamarozaman reported that the final structure of the TiO2 surface is affected by the position of the substrates in the NaOH solution [20].
Compared with the reported methods for TiO2 pH sensing films, chemical etching is a simple, safe, mild, and inexpensive one. A porous surface is helpful for enhancing the wettability of an electrode. Thus, it is a promising method for the fabrication of a super-hydrophilic TiO2 thin film for pH detection.
In this current work, 30 groups of porous TiO2 films were obtained using the chemical etching method. The polished Ti sheets were immersed in NaOH solution, with solution concentrations of 0.5, 1, 2, 3 and 4 M and reaction times of 15, 30, 60, 120, 180 and 240 min. To determine the optimum fabrication parameters, the obtained electrodes were compared for their wettability and pH sensing performances, including the sensitivity, response time, drift, hysteresis, selectivity, and stability.
2. Materials and Methods
2.1. Fabrication of a Sensitive Electrode with Super-Hydrophilic TiO2 Thin Film
The degreasing agent was prepared with 50 g/L NaOH, 25 g/L Na2CO3, 30 g/L Na3PO4, and 2 g/L Triton X-100. A Ti sheet (99.8% purity, 100 × 100 × 0.1 mm, Jinxin Advanced Metal Co., Xingtai, China) was cut to a size of 10 × 30 mm, ultrasonically cleaned in degreasing agent for 20 min, rinsed using deionized water (DI water), and air dried. Subsequently, the Ti sheet was mechanically polished on 1500 mesh abrasive paper and further polished with aluminum oxide abrasives to a size of 1 μm. The specimen was finally polished with aluminum oxide abrasives to a size of 0.3 μm. Then, it was ultrasonically cleaned with degreasing agent for 10 min and washed with DI water.
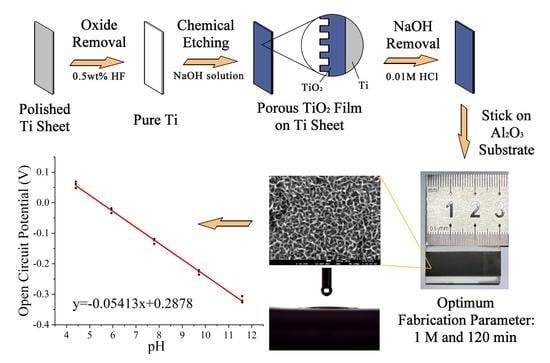
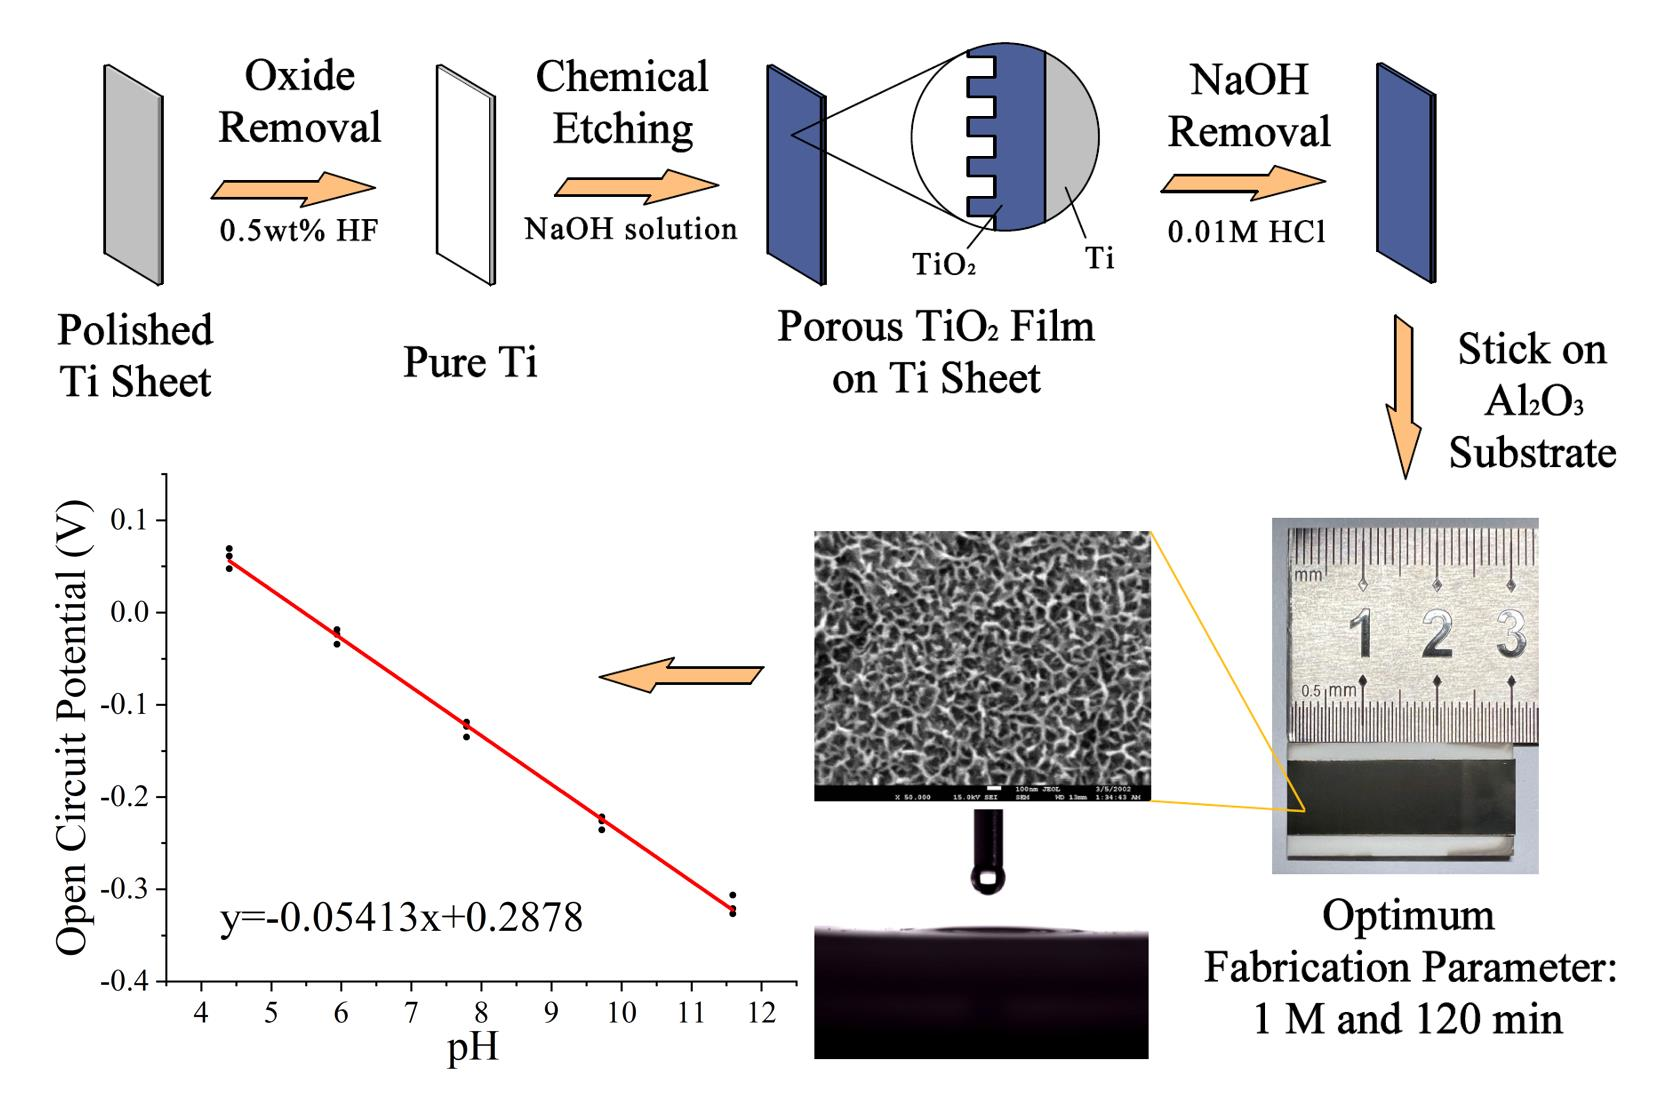
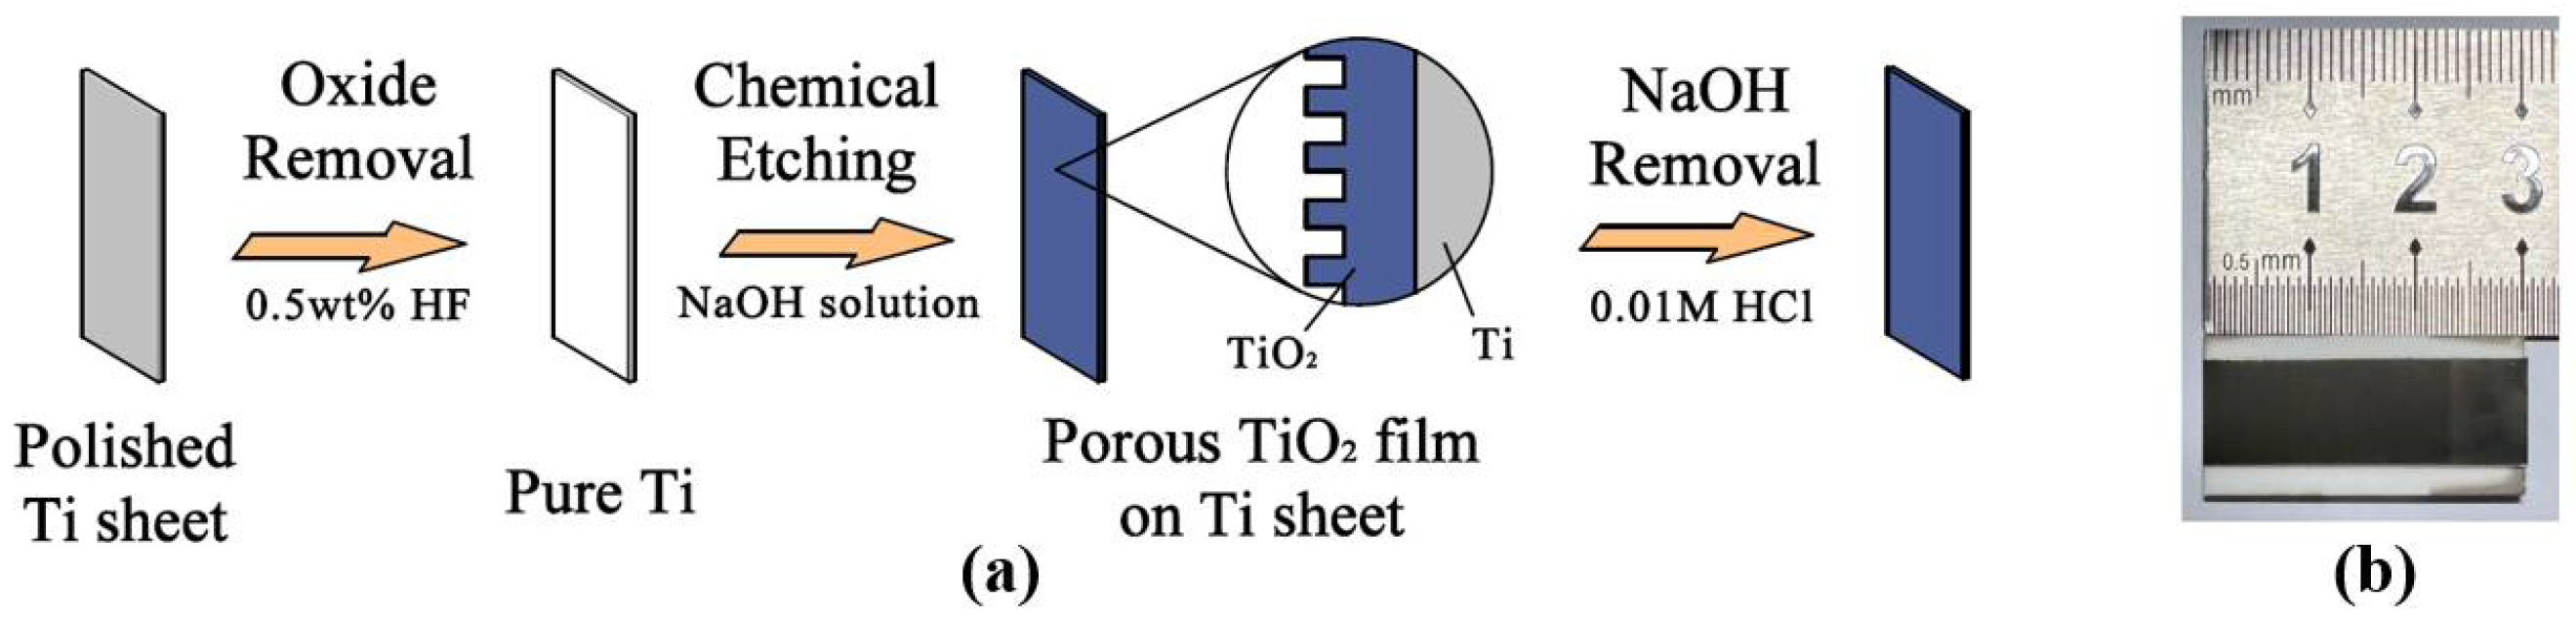
Figure 1a shows the fabrication procedure of the super-hydrophilic TiO2 thin film. The polished Ti sheet was immersed in HF (0.5 wt%, Haibiao, China) for about 100 s to form the white surface. Afterwards, it was washed with DI water and air dried. Then, 0.5, 1, 2, 3 and 4 M NaOH solutions were prepared in 200 mL beakers and placed in a water bath kettle at 80 °C. The Ti sheets were inserted in PTFE baskets to maintain their vertical positioning and immersed in NaOH solutions for 15, 30, 60, 120, 180 or 240 min. Subsequently, the specimens were rinsed with 0.01 M HCl to remove the remaining NaOH. Finally, the Ti sheets were rinsed with DI water and air dried. Figure 1b shows that the prepared sensitive electrode consisted of Al2O3 substrates (96% purity, 15 × 30 × 1 mm, Jiawei Ceramic Tech Co., Zhuhai, China) and a treated Ti sheet attached to the substrate.
2.2. Characterization of the Porous TiO2 Films and Their pH Sensing Performance
The morphological and structural characterization of the porous films were investigated by field emission scanning electron microscopy (JSM-7001F, JOEF, Japan), X-ray photoelectron spectroscopy (ESCALAB 250Xi, Thermo Scientific, USA), and X-ray diffractometer (D8 ADVANCE, Bruker, Germany). Wettability was measured using a contact angle meter (JC2000D, POWEREACH, Shanghai, China).
The sensitivity, response time, drift, hysteresis, repeatability, stability, and selectivity of the fabricated electrodes versus a commercial Ag/AgCl reference electrode (E218, Leici, China) were studied to investigate the influence of the chemical etching parameters on the pH sensing performance. The response potential was measured using an electrochemical workstation (CHI660E, Chenhua Instrument, Shanghai, China) and recorded with a computer. pH buffer solutions (PBSs) were prepared by mixing 0.01 M HCl (Beyotime Biotechnology, Shanghai, China) and 0.01 M NaOH solutions with different ratios. pH of each PBS was measured by a commercial glass pH meter (PHS-3E, Leici, China), which was calibrated using standard pH buffer solutions (pH 4.01 and 9.18, Leici, China).
To measure the sensitivity, response time, and potential deviation, each TiO2 electrode was dipped in the same PBS for 100 s, tested 3 times, cleaned with deionized water, and air dried. The response potentials were recorded at 0.1 s intervals. The drift effect was measured by dipping the electrodes in PBS (pH = 6.86) at 25 °C for 2 h, and the potential was recorded at 2 s intervals. The TiO2-sensitive electrodes were dipped in PBS with loops of 7.84–5.91–4.41–5.91–7.84–10.13–12.01–10.13–7.84 and 7.84–10.13–12.01–10.13–7.84–5.91–4.41–5.91–7.84 without cleaning and drying to measure the hysteresis width. The TiO2-sensitive electrode was dipped in each PBS for 200 s, and the potential was recorded at 1 s intervals. To evaluate the selectivity of the developed electrode, 200 μL of 0.1 M KCl, NaCl, NiCl2, CaCl2, and FeCl3 were added to 19.8 mL of prepared PBS to ensure the concentration of interfering ions reached 0.001 M. Each electrode was dipped in the solution for 100 s and tested 3 times.
3. Results and Discussion
3.1. XRD and XPS
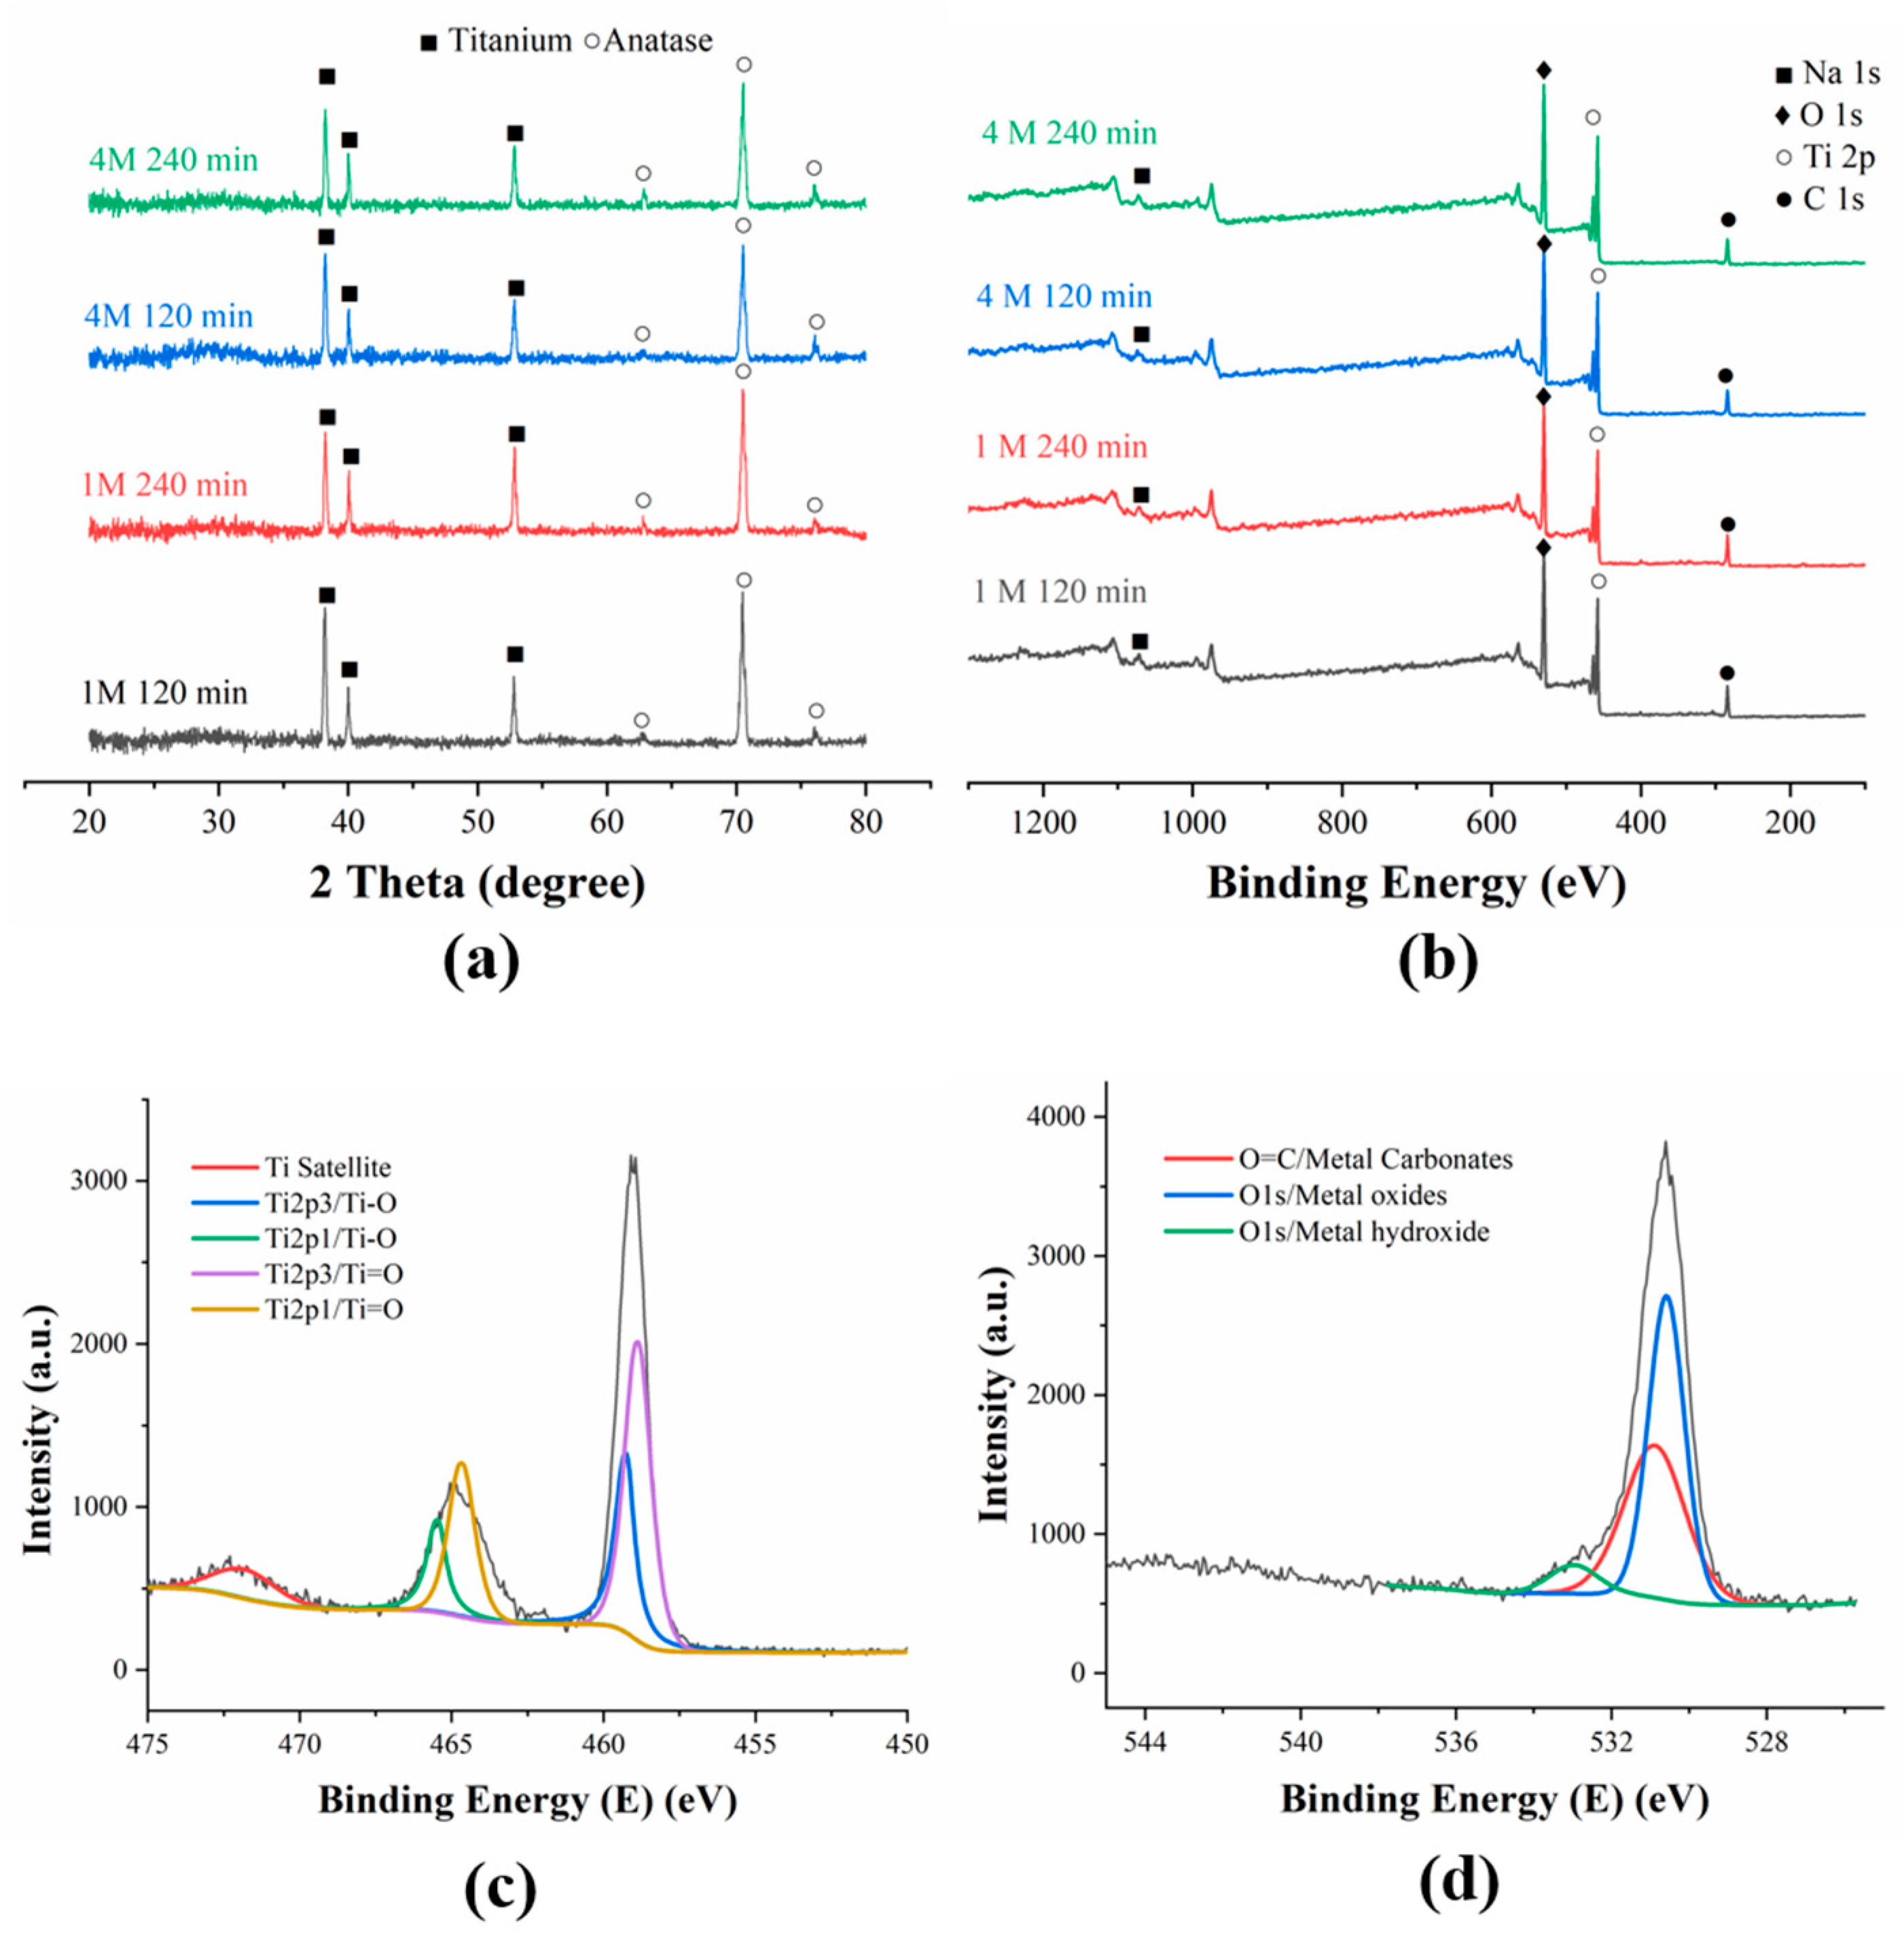
XRD and XPS analyses were conducted on electrodes obtained using 1 M–120 min, 1 M–240 min, 4 M–120 min, and 4 M–240 min to investigate the influence of the fabrication parameters. As shown in Figure 2a, titanium and anatase peaks were detected on the pattern of the electrodes treated using different fabrication parameters. The pattern also revealed irregular background noise and no other characteristic peaks, indicating the presence of amorphous TiO2 film.
Surface analysis of the films was carried out using XPS and is plotted in Figure 2b. Na 1s, O 1s, Ti 2p, and C 1s peaks were observed in the pattern. The Ti 2p and O 1s deconvoluted core excitations of the electrode treated using 1 M–120 min are presented in Figure 2c,d, respectively, and the core excitations and atomic percentage are listed in Table S1. The Ti 2p and O 1s deconvoluted core excitations of the other three electrodes are plotted in Figure S1. Figure 2c shows that the Ti 2p spectrum exhibits five contributions: Ti-O 2p 3/2, Ti=O 2p 3/2, Ti-O 2p 1/2, Ti=O 2p 1/2, and a satellite state. All Ti 2p spectra from the different electrodes showed a similar envelope. These intensive peaks matched the standard TiO2 pattern, indicating the main components of the Ti 2p spectrum were assigned to Ti=O and Ti-O in TiO2. The quantitative analysis confirmed that the main component of all the films obtained with different fabrication parameters was TiO2. As shown in Figure 2d, the O 1s core excitation was deconvoluted into three components. The most intensive peak was observed at BE. 530.6 eV and assigned to oxygen–metal bonding, which is present in a metal oxides lattice [21]. The component at BE. 533 eV was ascribed to metal hydroxyl and the component at BE. 530.45 eV was ascribed to a carbon–oxygen double bond, indicating the presence of a small quantity of NaOH and adsorbed CO2 on the surface.
Tanaka reported weak peaks of rutile and anatase in a film fabricated using GIXRD, indicating their minor production on the surface [17]. Ohishi identified the porous film as TiO2 using XPS [16]. As shown in Table S1, when the reaction time increased from 120 to 240 min, the atomic percentage of Na increased from 1.92% to 2.28% (1 M NaOH) and 1.49% to 2.61% (4 M NaOH). This result confirmed that the prolonged reaction time led to an increase in the titanate content.
3.2. Morphology
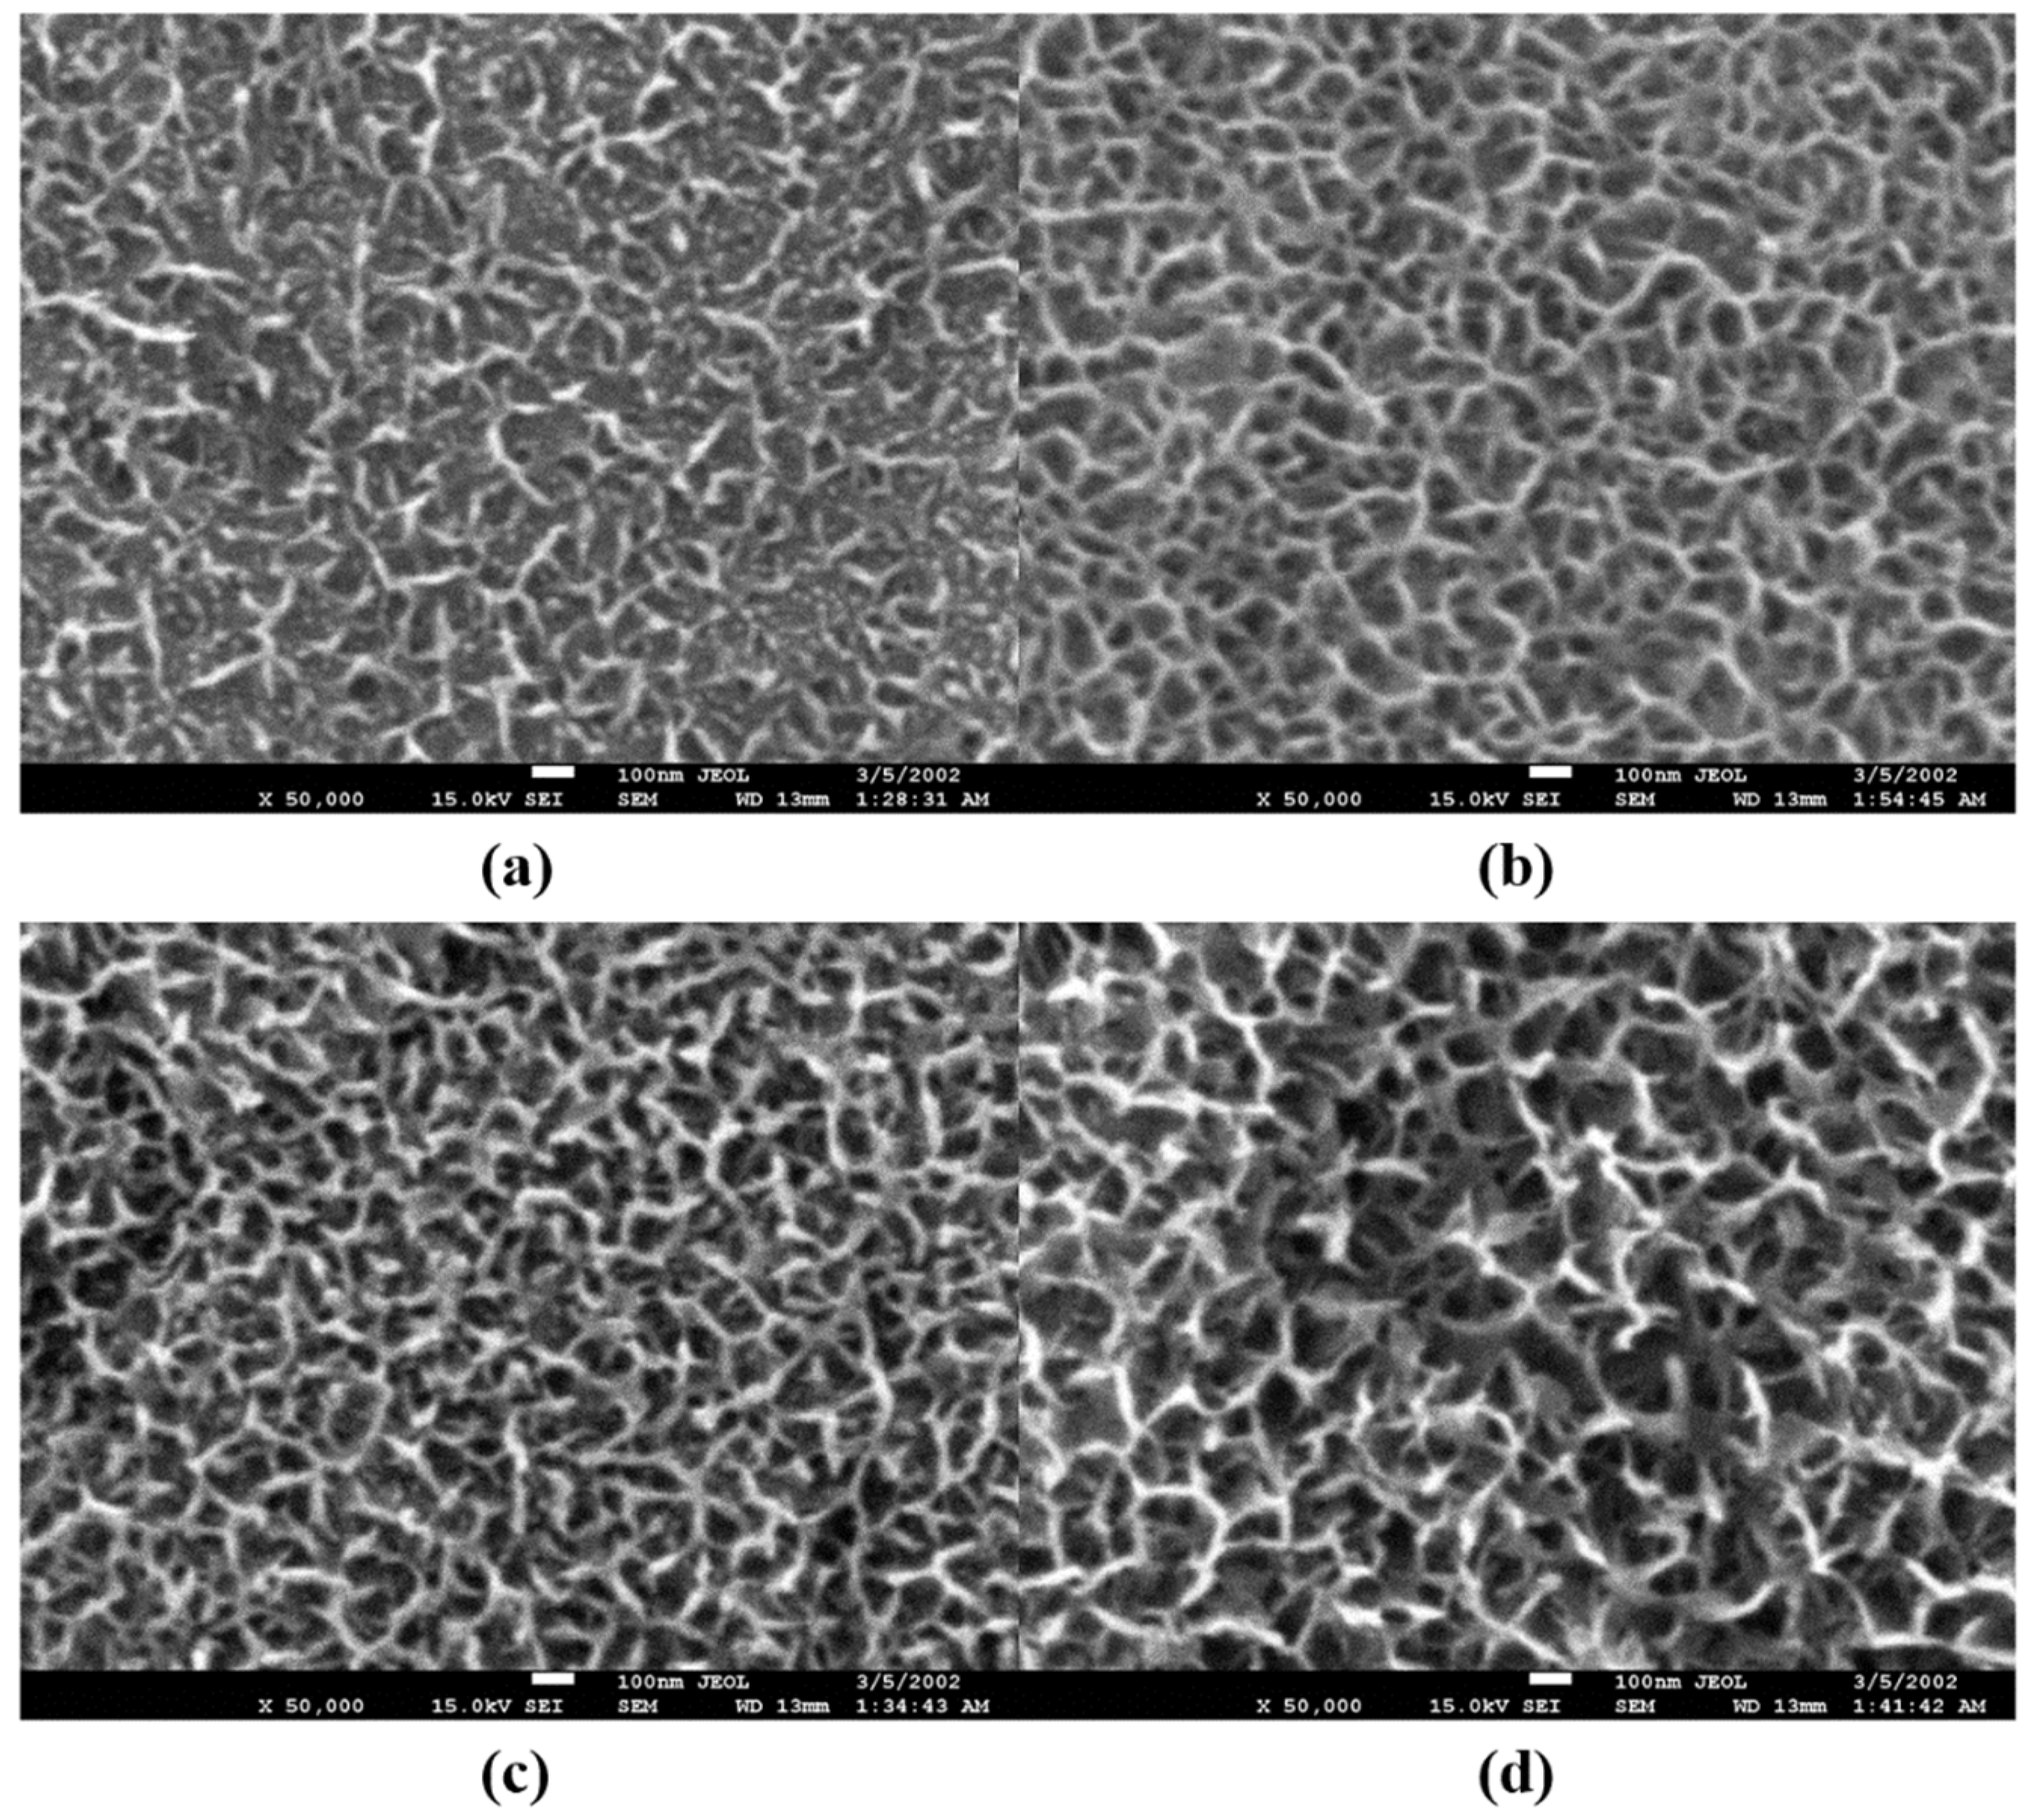
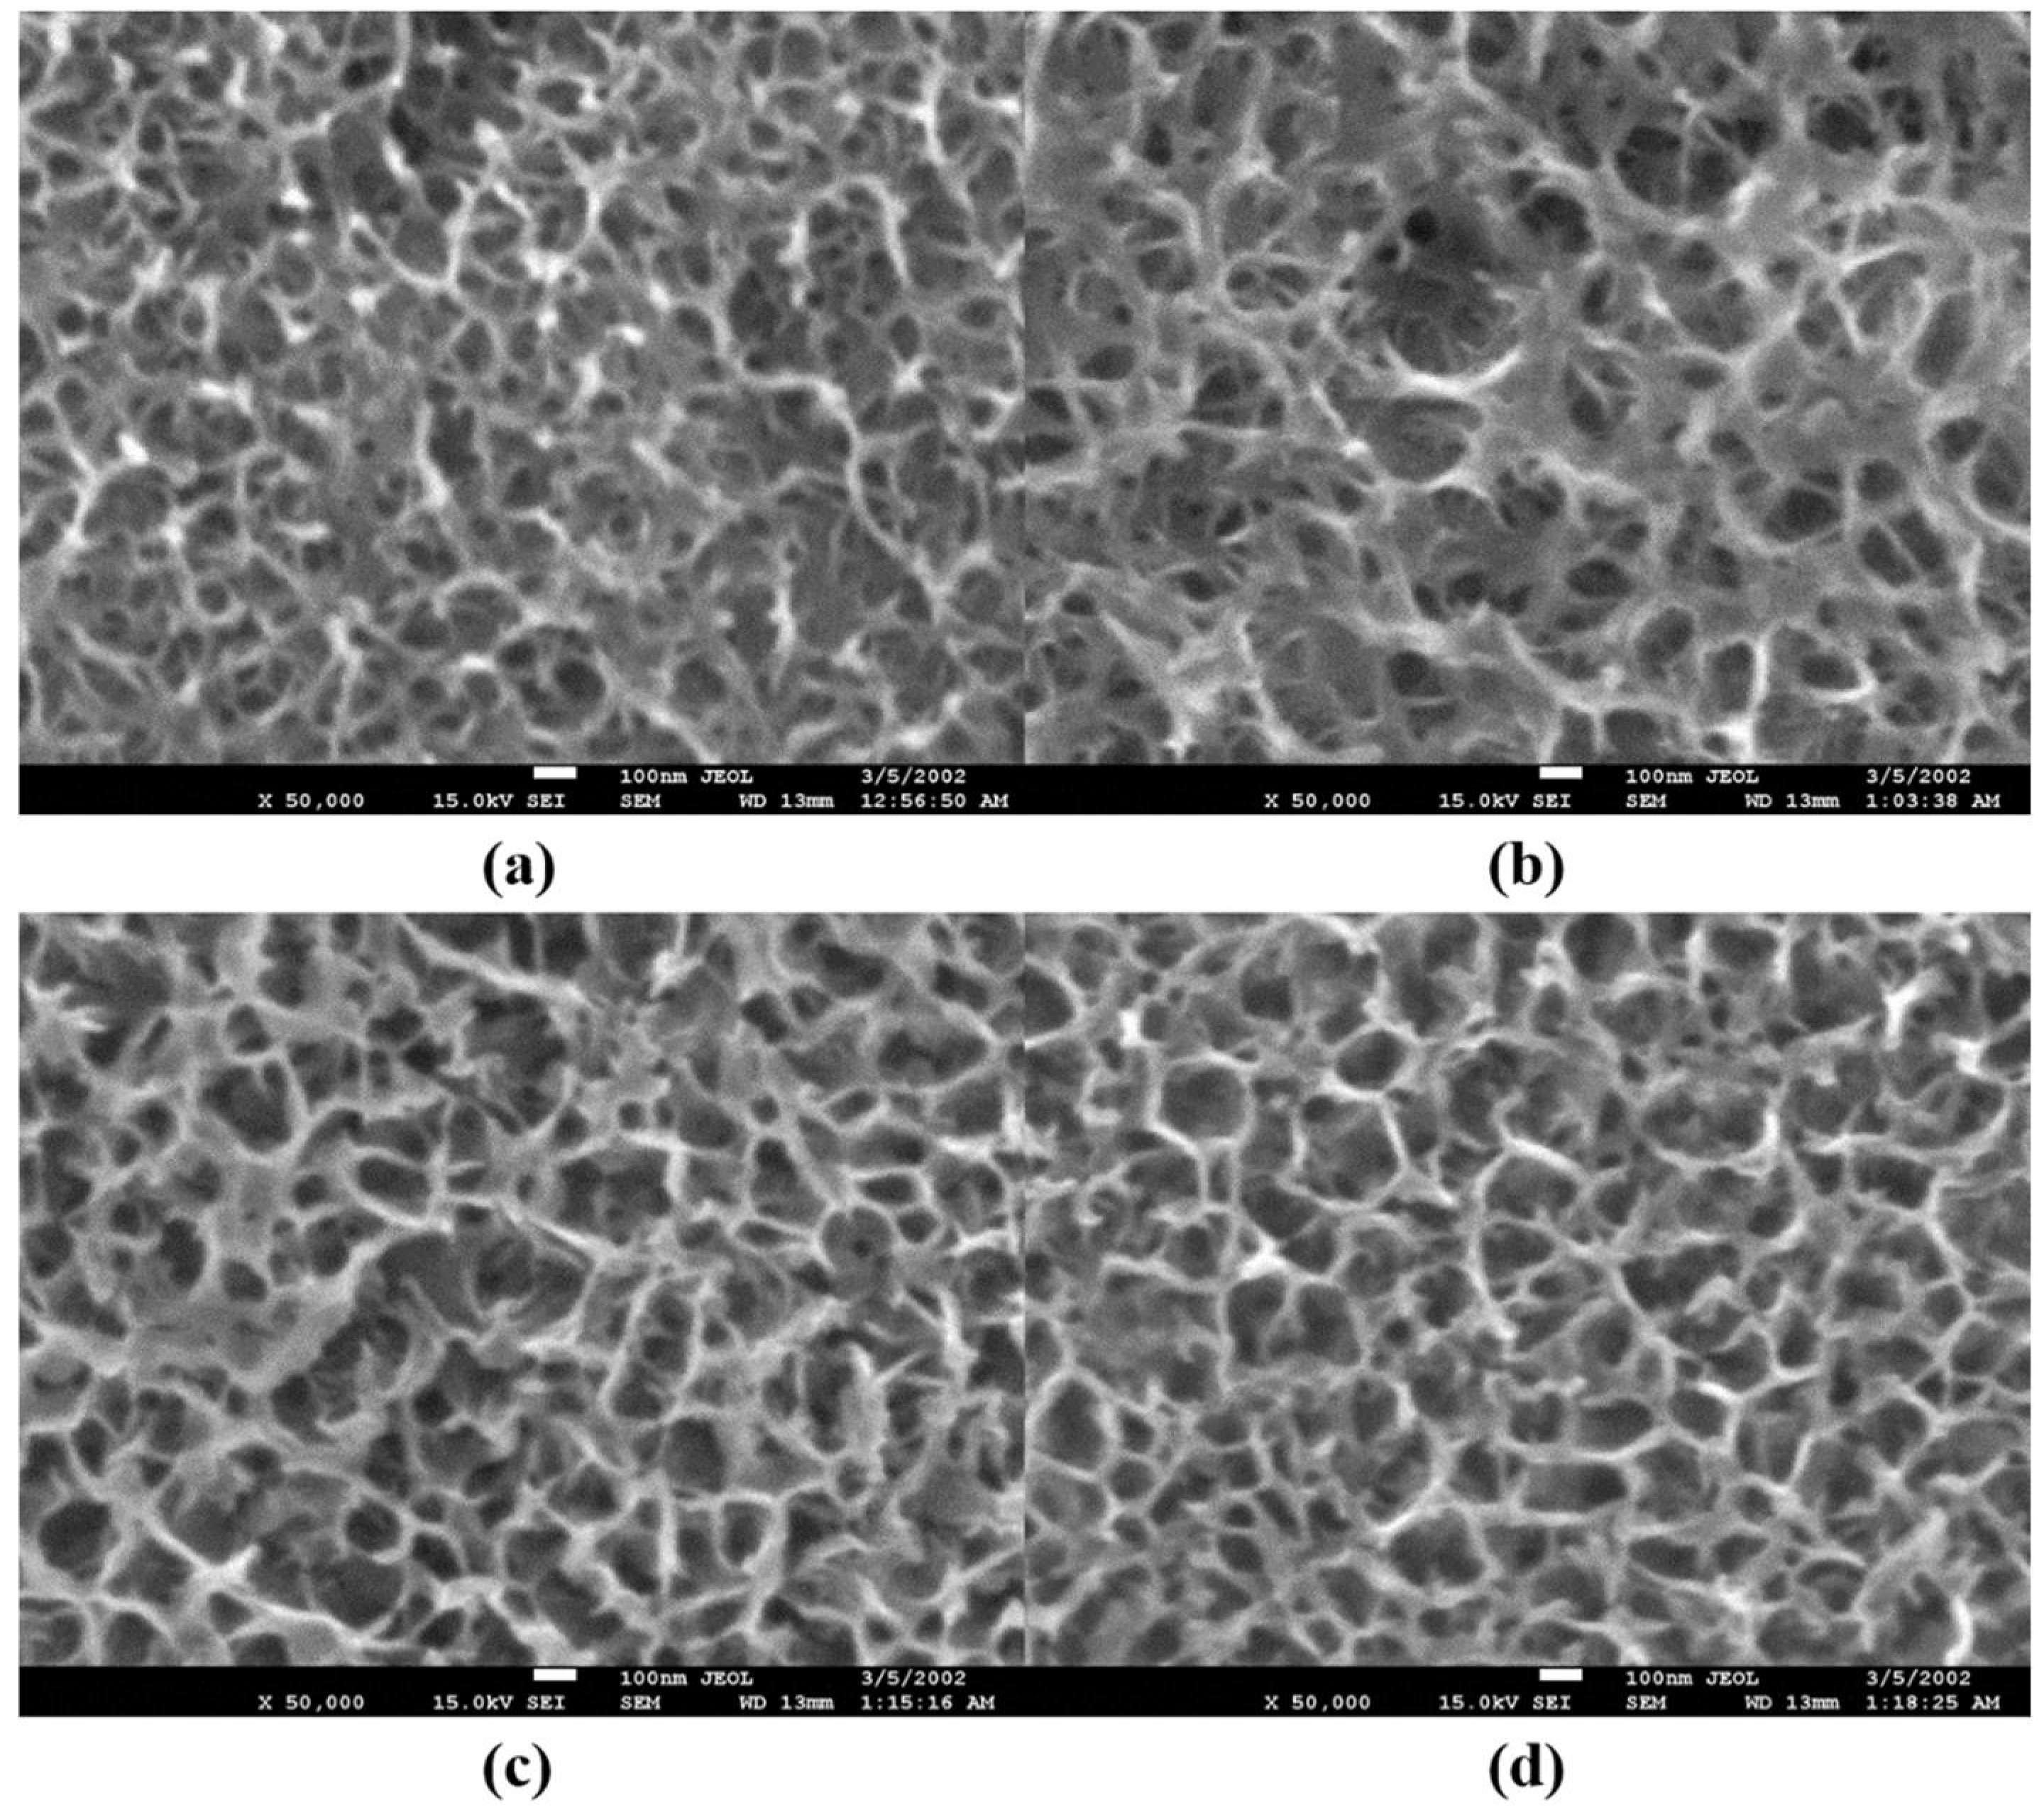
To investigate the influence of the fabrication parameters, SEM was performed on 4 pieces of the electrodes treated with 1 M NaOH and four pieces treated with 4 M NaOH. The reaction time was 15, 60, 120, or 240 min. The original SEM images are presented in Figure 3 and Figure 4, and the SEM images with the size of the pores and ridges are shown in Figures S2 and S3.
As shown in Figure 3a, abundant TiO2 nanowires and some small holes formed on the surface, and the original surface could still be identified. As estimated from Figure 3a and Figure S2a, the hole diameters were 36.46–66.92 nm, and the ridge thickness was 22.71–36.35 nm. Figure 3b shows that the surface was entirely covered by the TiO2 nanowires, which combined with one another and formed nets. Meanwhile, more holes were observed on the surface. As shown in Figure 3c and Figure S2c, the ridges ranged from 27.26–39.19 nm, and the diameters ranged from 47.71–60.31 nm, indicating that the microstructures became more uniform and denser than those shown in Figure S2a,b. As shown in Figure 3d, with the further prolonged reaction time, the ridge thickness and hole diameters were enlarged. Tanaka indicated that hydrogen penetration continuously occurs during a reaction, providing sufficient hydrogen to produce porous TiO2 [18]. Thus, the surface morphology was continuously changed with the prolonged reaction time.
Figure 4 and Figure S3 show that the original surface can hardly be identified. The holes and ridges are larger than those shown in Figure S2. As estimated from Figure S3a–d, with the prolonged reaction time, the maximum size of the diameters and ridges increased from 75.34 to 134.06 nm and 46.29 to 65.07 nm, respectively, indicating that the higher concentration resulted in a more drastic reaction and a larger-sized microstructures. Tanaka suggested that the hydrogen content increases with an increase in the NaOH concentration as hydrogen penetration is affected by the content of alkali cations in the solution [18,22].
3.3. Wettability
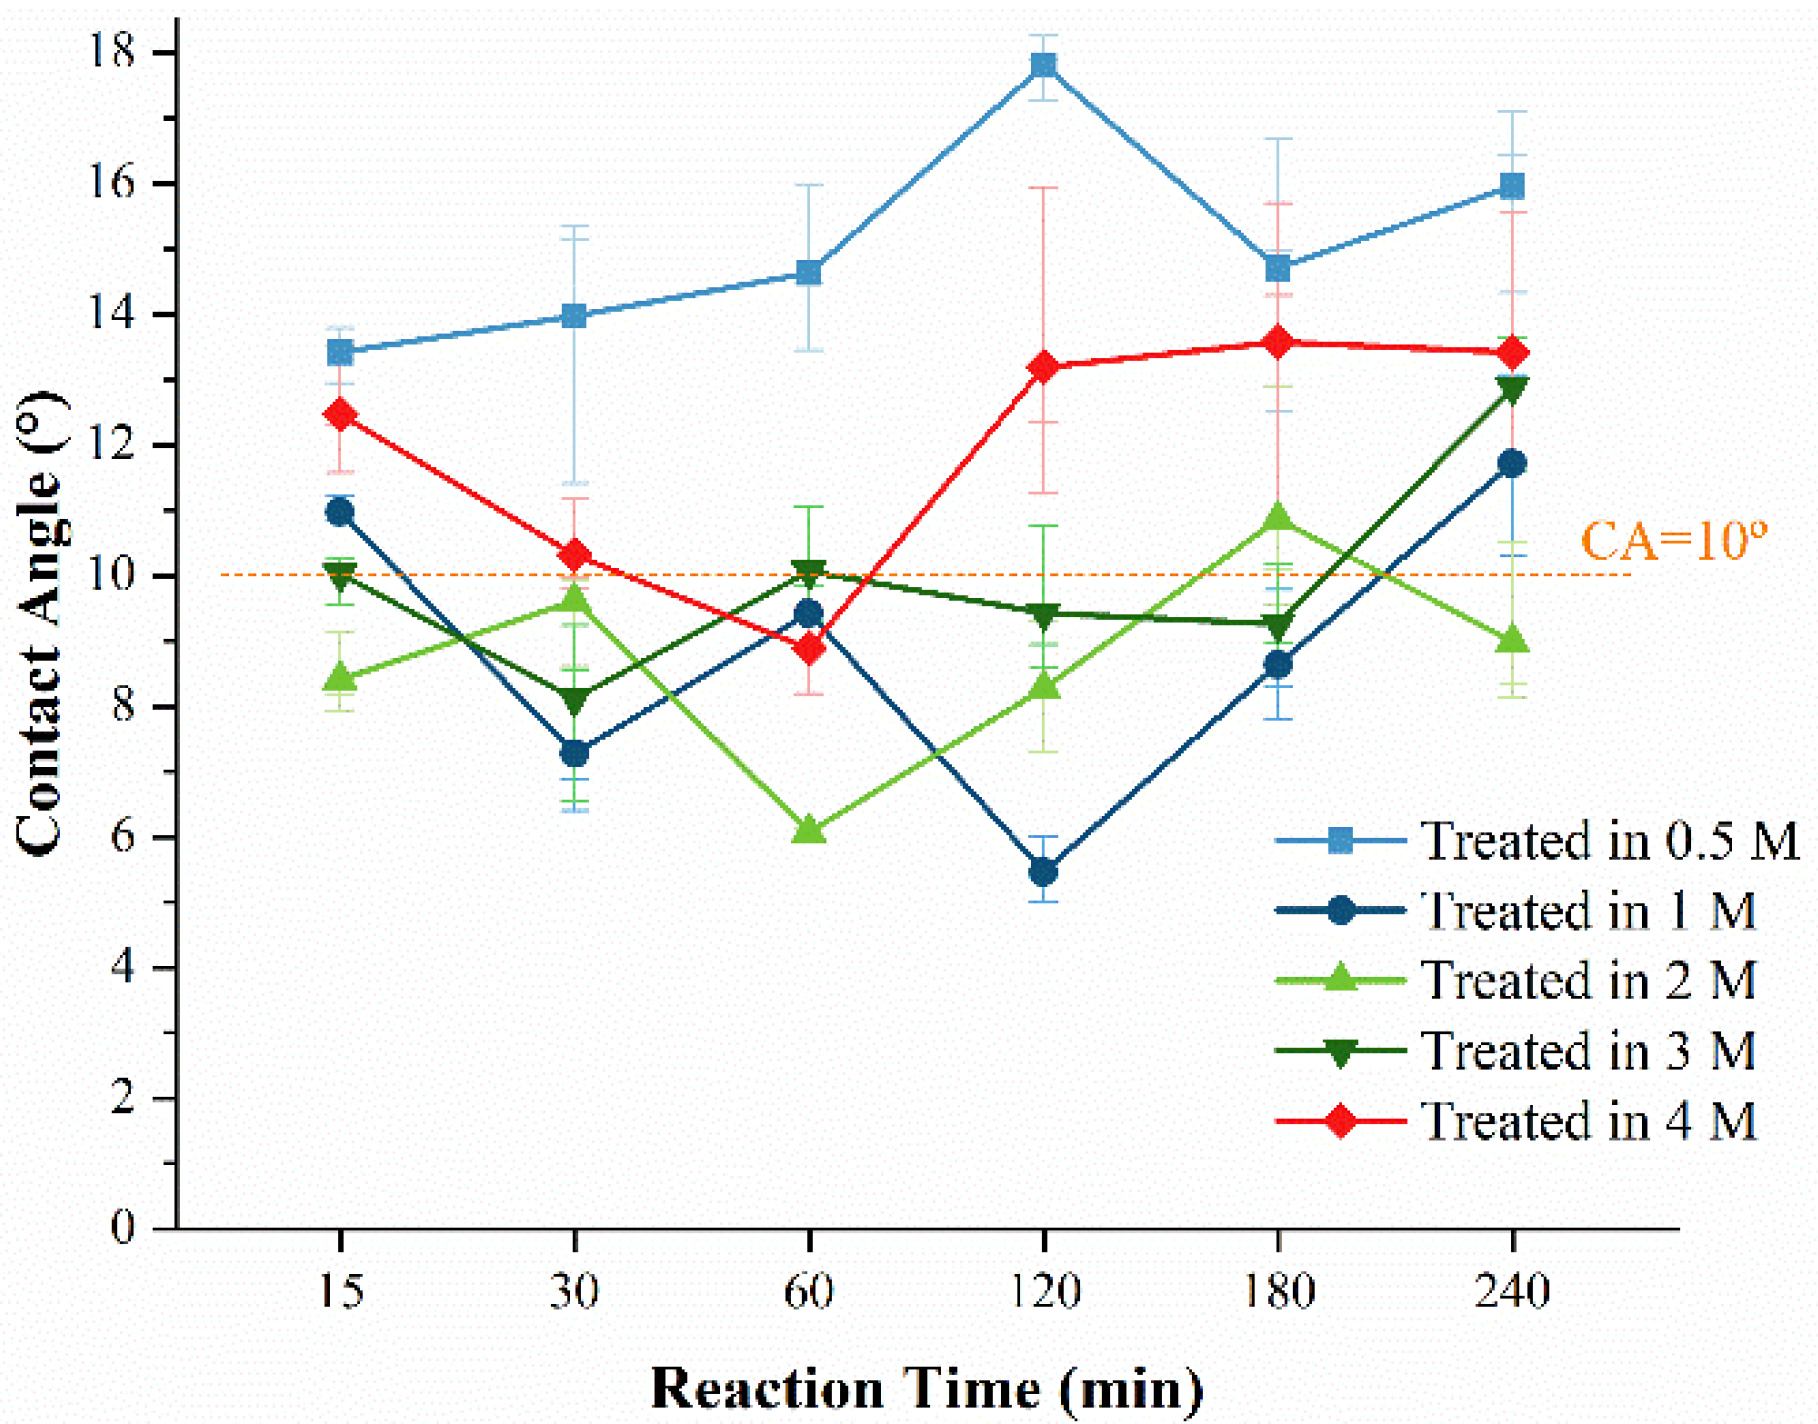
A super-hydrophilic surface is a material whose water contact angles (CAs) are less than 10° [23]. Figure S4 presents the photographs of the CAs of the electrodes obtained using different fabrication parameters. Figure 5 illustrates the change trend of the CAs. Few electrodes fabricated in 0.5 and 4 M NaOH could satisfy the super-hydrophilic standard, whereas most electrodes obtained in 1, 2, and 3 M NaOH achieved good wettability. Figure 5 also indicates that a short reaction time may result in weak wettability, which could be explained by Wenzel’s equation:
where θer represents the apparent contact angle over a practical surface, θe is the contact angle on an ideal smooth surface, and r is the roughness of the solid surface, which is described by the specific surface area (SSA). For a hydrophilic surface, an increased r reduces θer and contributes to a super-hydrophilic case [24,25,26]. The SEM images showed that increasing the concentration and reaction time enhanced the surface roughness, resulting in increased SSA. Meanwhile, with further continued etching, the wettability of the electrodes was reduced. XPS analysis revealed that the titanate content increased with the prolonged reaction time. Tanaka indicated that porous TiO2 films have a “sandwich” structure, i.e., the titanate covers TiO2, which forms on the Ti sheet and thus explains the decreased wettability with further prolonged reaction times [17].
3.4. pH Response of the Fabricated Electrodes
3.4.1. Sensitivity
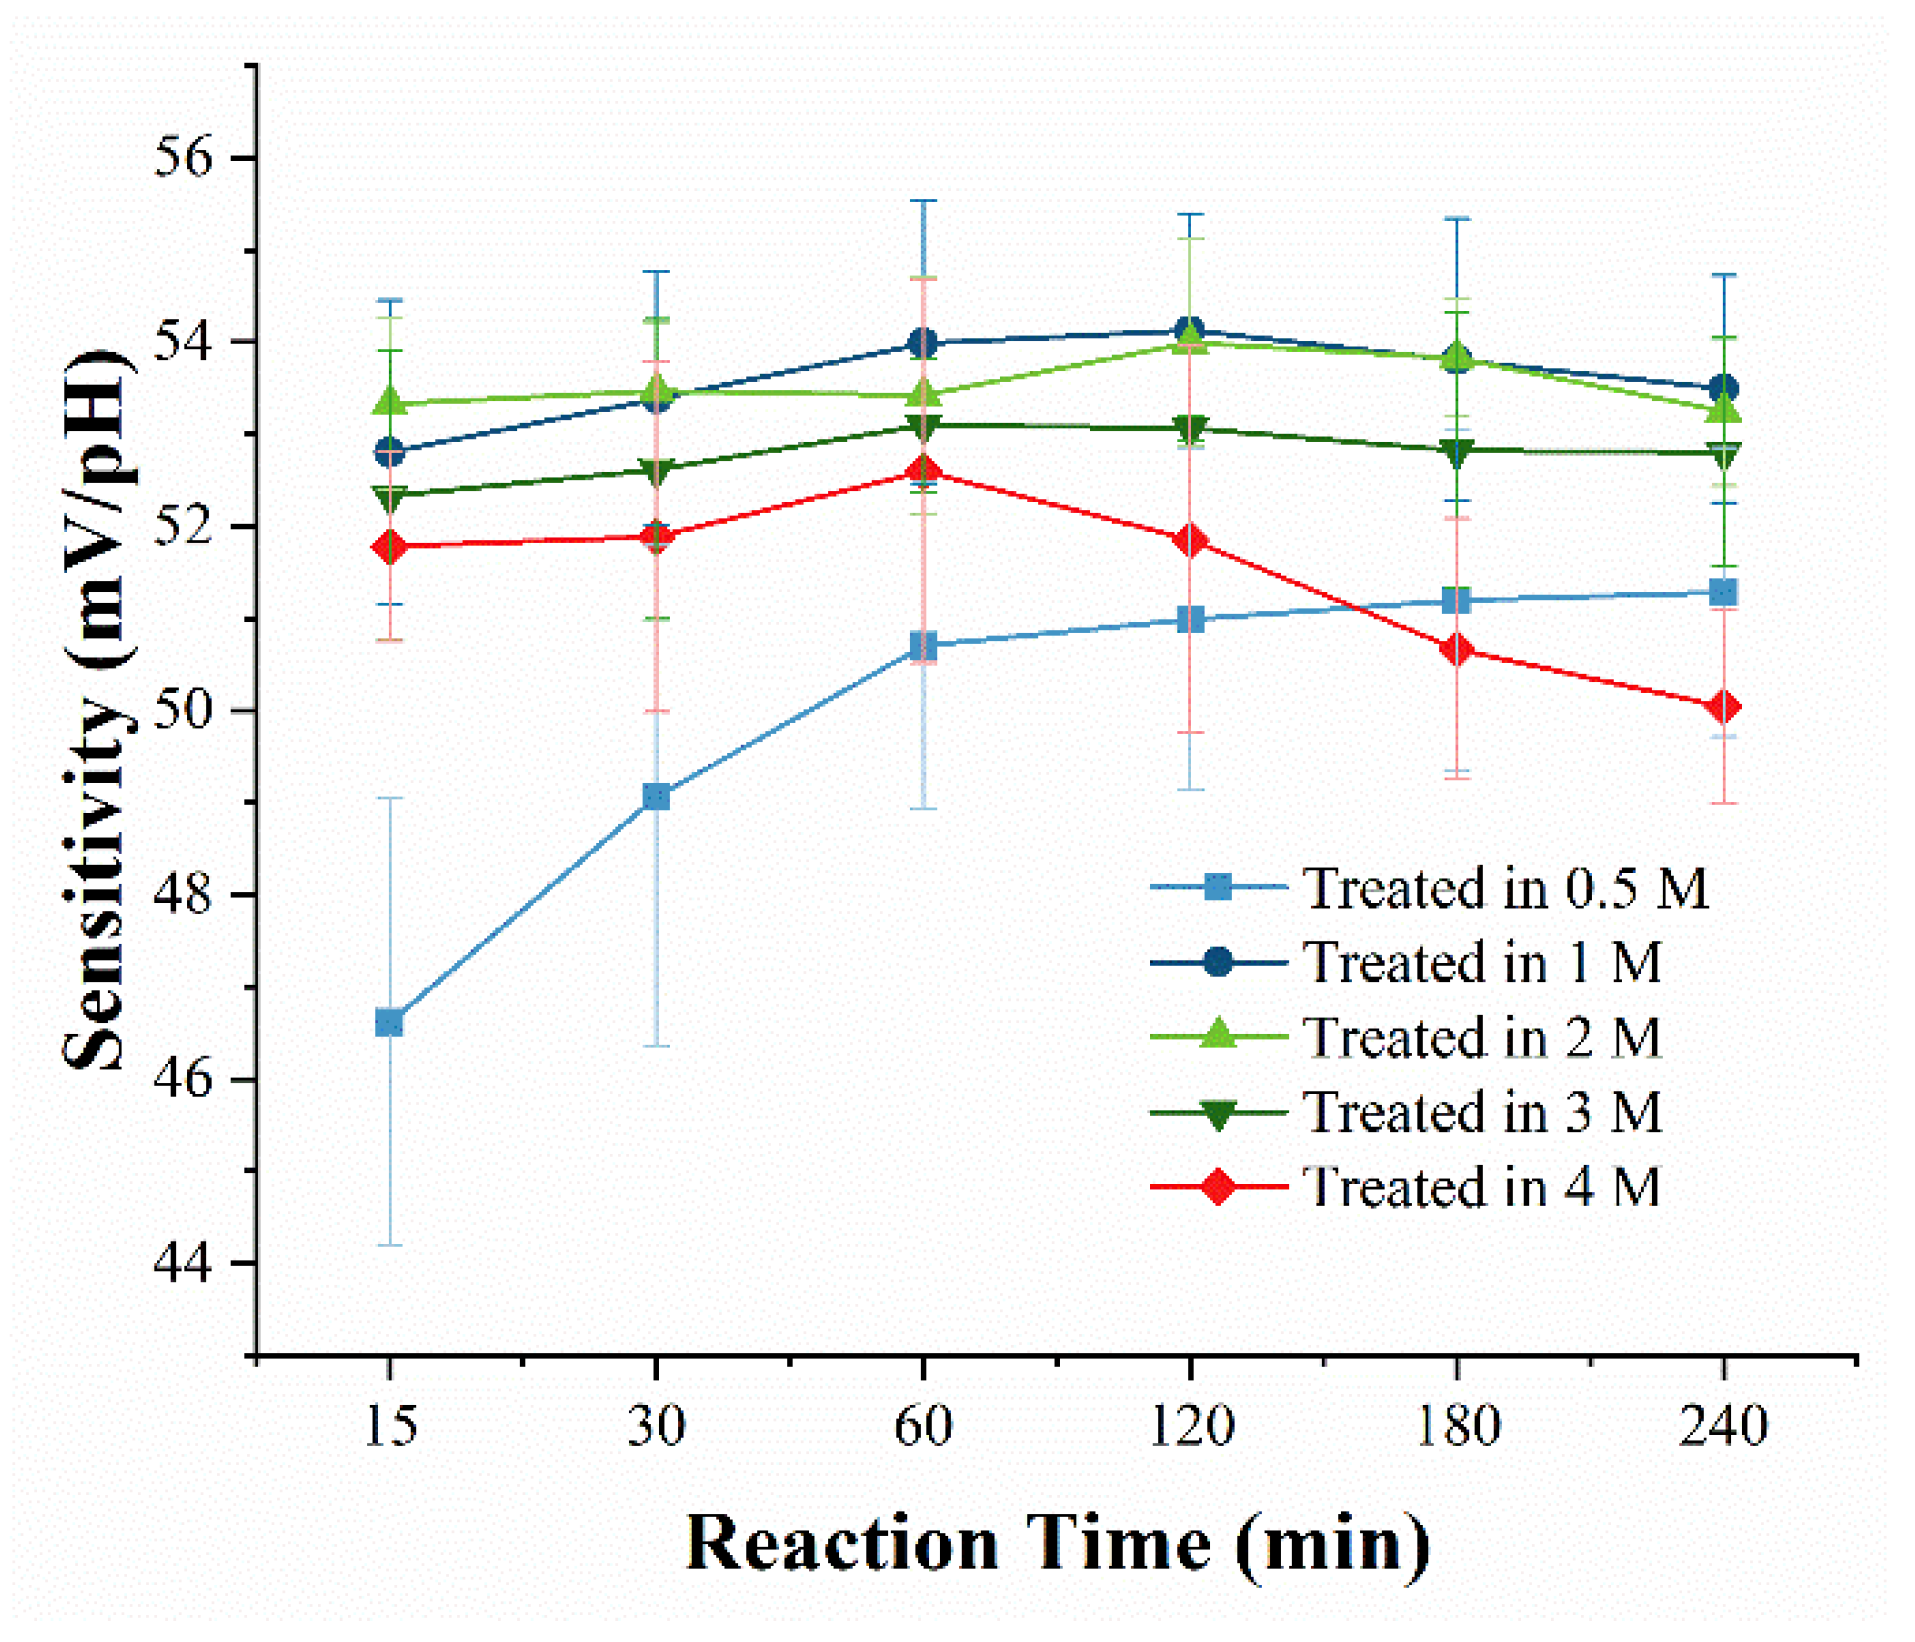
Table S2 indicates that most of the electrodes satisfied the quasi-Nernstian response [27], and the highest sensitivity was 54.13 mV/pH with a correlation coefficient of 0.997. Figure 6 presents the influence of the fabrication parameters on the sensitivity, which apparently depends on the NaOH concentration. The electrodes obtained in 0.5 M and 4 M NaOH showed poor sensitivity, whereas those obtained in 1 M and 2 M NaOH showed high sensitivity.
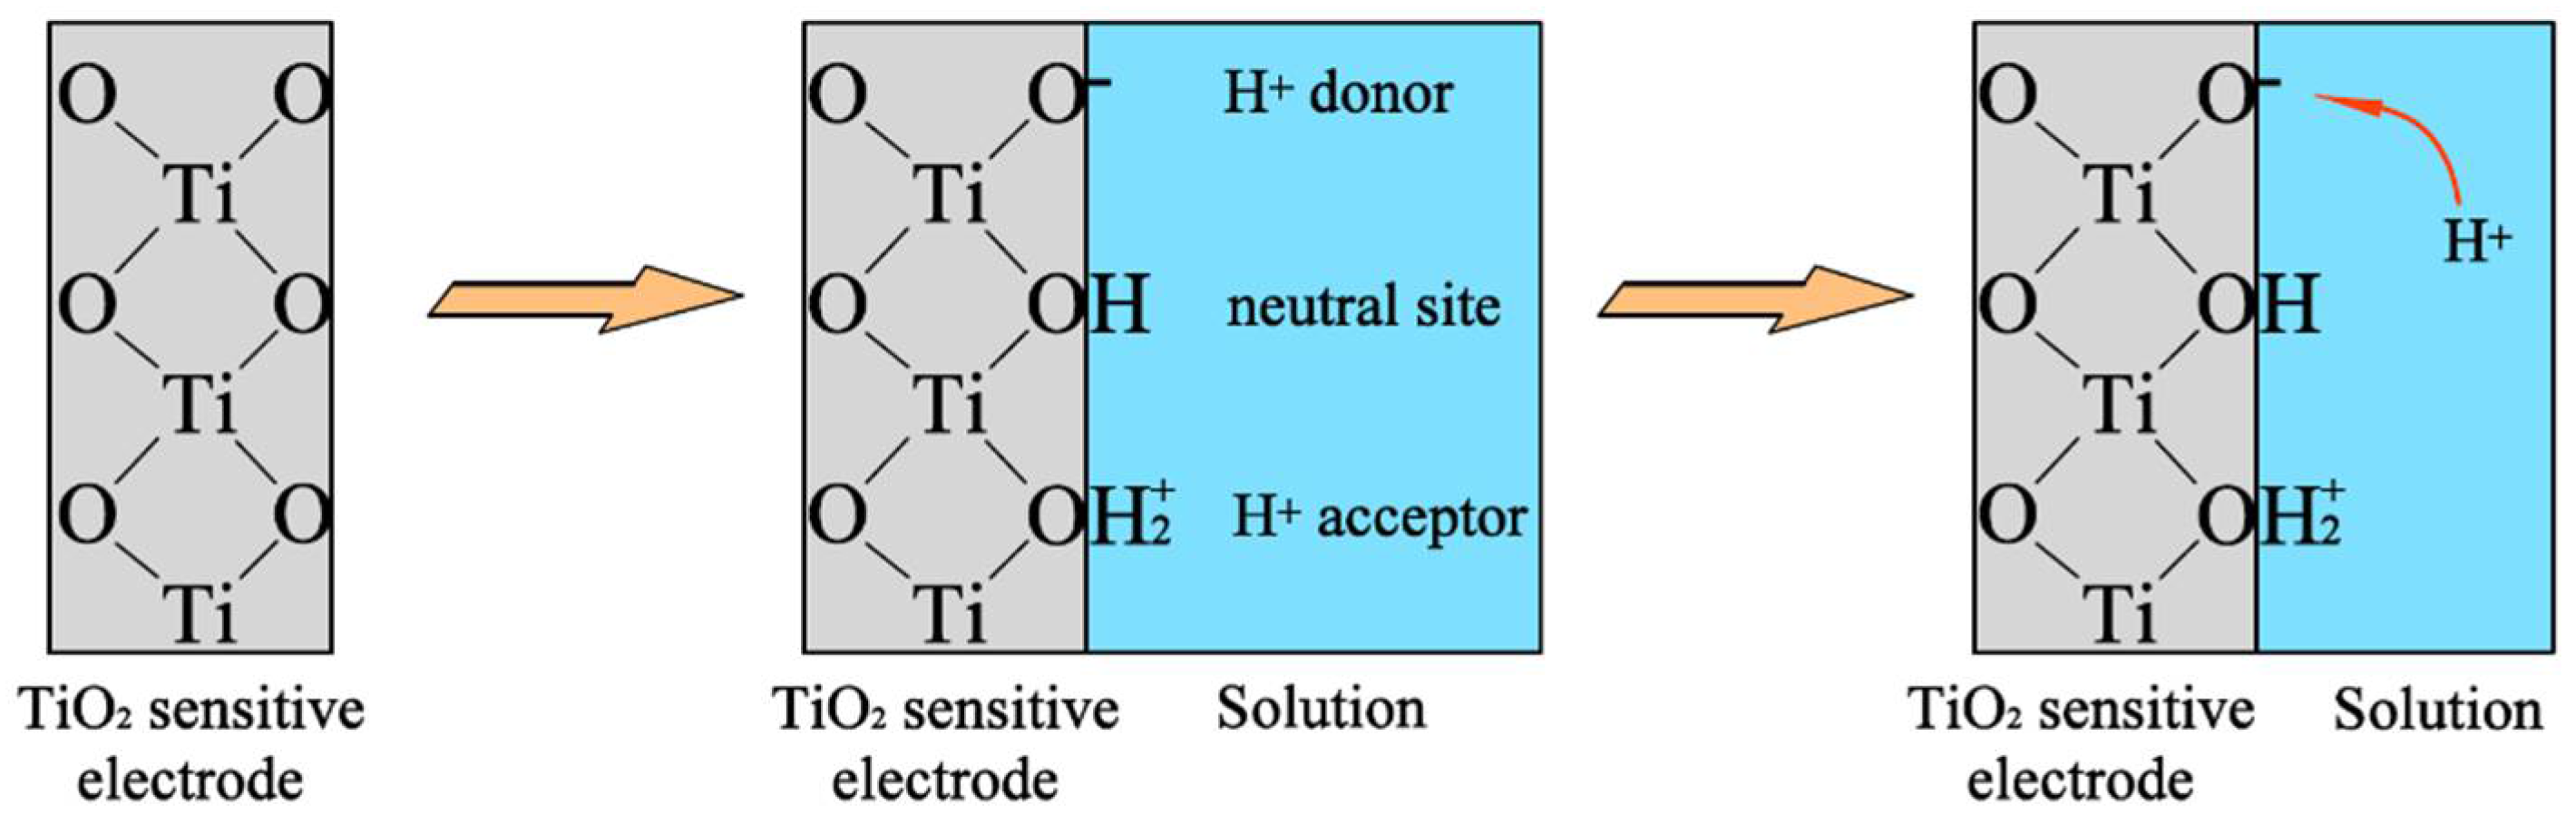
As shown in Figure 7, the site-binding theory is used to explain the reaction on the surface of the metal oxides: during the reaction, the surface of the TiO2-sensitive electrode is covered by hydroxide groups due to the dissociative adsorption of water [28,29], and protons and hydroxide ions from the solution are attracted to oxygen ions from the TiO2 crystal lattice and to the surface cations, respectively [30,31,32]. According to the site-bonding model, the sensitivity of the sensing film can be described as [30]:
where β is the sensitivity of the sensing film, q is the electronic charge, Ns is the total number of sites per unit area, ka and kb are equilibrium constants, k is Boltzmann’s constant, T is the temperature of the system, and CDL is the double-layer capacitance at the interface. The dense and rough microstructures on the surface lead to an increase in the total number of sites per unit area (Ns) [10]. The sensitivity of the electrodes obtained in 0.5 M NaOH was positively correlated with the reaction time because the surface morphology depends primarily on the reaction time at a low NaOH concentration [18]. The electrodes obtained in 4 M NaOH were negatively correlated with the reaction time, which can be attributed to the increased titanate that formed on TiO2.
Compared with other literature, the electrodes obtained in our work did not achieve the highest sensitivity. Zhao reported a pH sensor based on a TiO2 nanotube array-modified Ti electrode with a sensitivity of 57.1 mV/pH [5]. Liao prepared a pH sensing layer using sol-gel spin coating technology and showed a high pH sensitivity of approximately 58.73 mV/pH [32]. The differences in the sensitivity may contribute to the different fabrication methods and compositions, which affects the microstructure, porosity, surface homogeneity, and crystalline structure [7]. Meanwhile, a small amount of titanates form on, and cover the surface of the sensing film, thereby reducing the hydrophilic sites for H+ and leading to decreased sensitivity [10].
3.4.2. Response Time
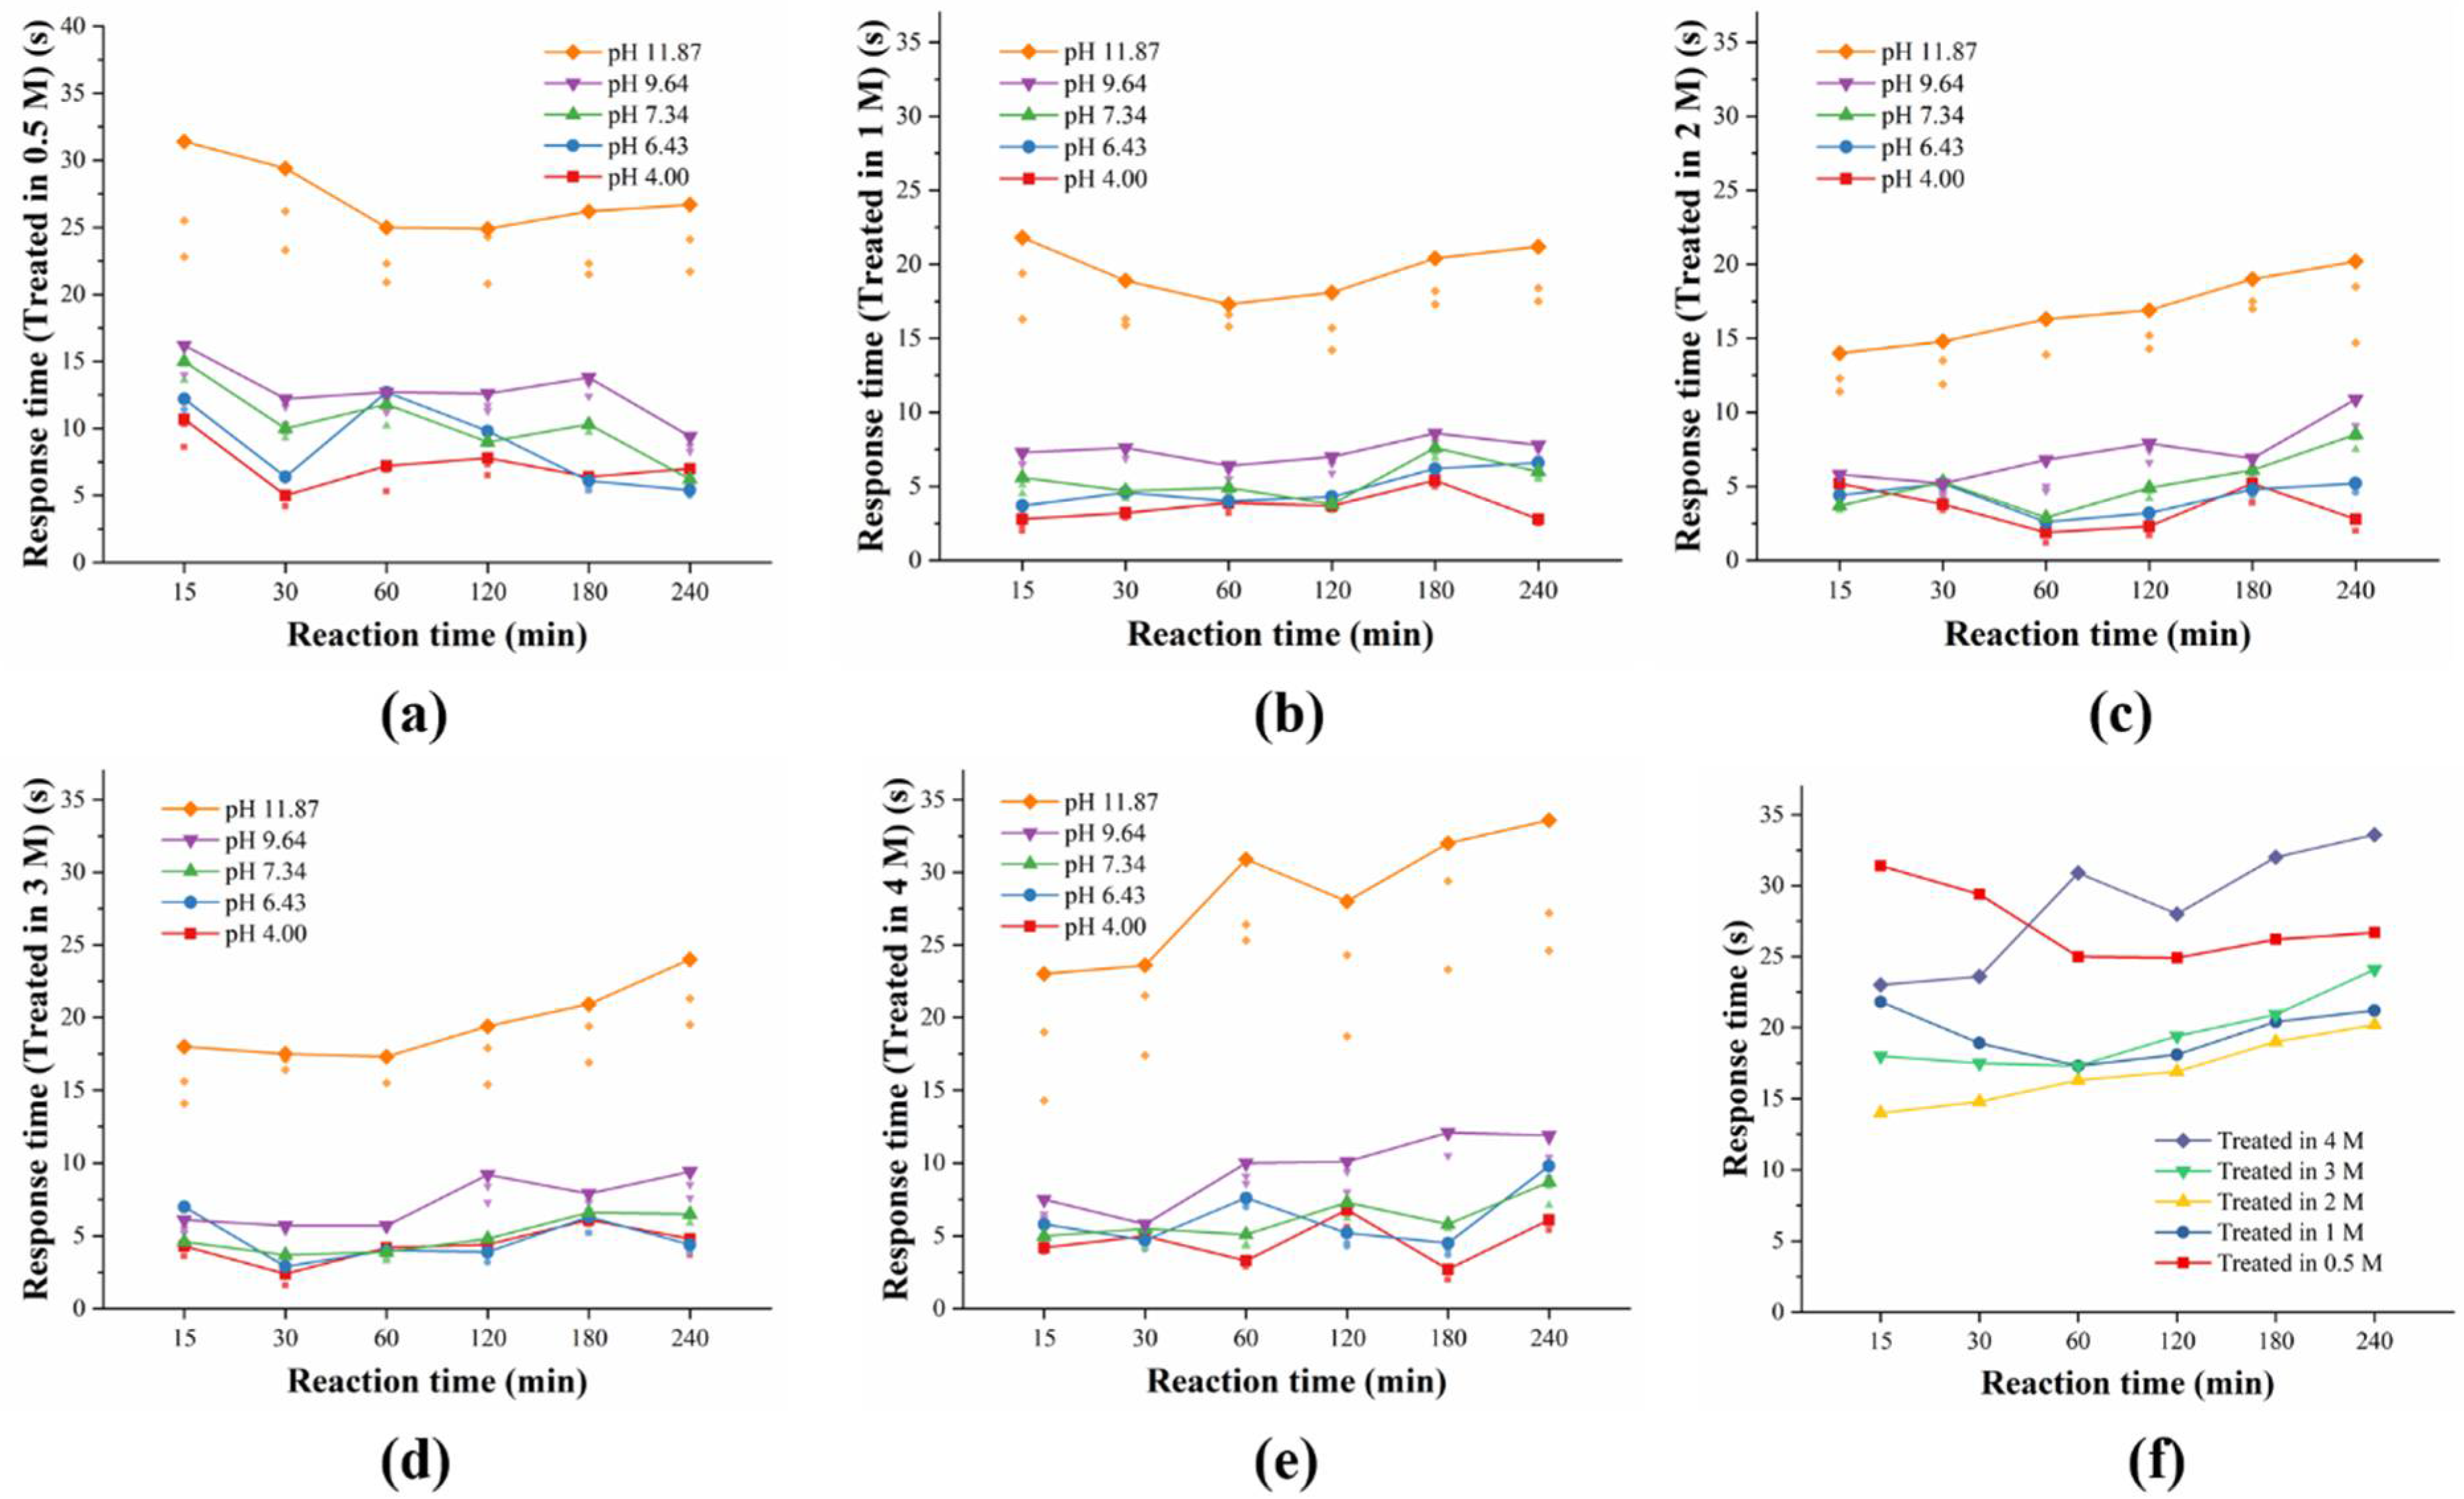
The response time of each electrode is shown in Figure 8. As shown in Figure 8a–e, the response time of each electrode obviously depends on the pH level. The electrodes exhibited a fast response in acidic and neutral solutions but a much slower response in basic ones because of the dominant diffusion of H+ ions in acidic solutions as reported in the literature [33,34,35,36]. As shown in Figure 8f, the response time of the electrodes was obviously affected by the fabrication parameters. Electrodes obtained in the 1, 2, and 3 M NaOH solutions showed a faster response than those obtained in the 0.5 and 4 M solutions. The response time of the electrodes was affected by the structural properties and morphology, indicating that the sensing film with a developed pore network had a fast response time [34,37]. SEM analysis revealed that the pH-sensitive electrodes treated with 1 M NaOH showed more uniform and denser microstructures on the surface than those treated with 4 M NaOH, so the former exhibited a faster response.
3.4.3. Potential Deviation
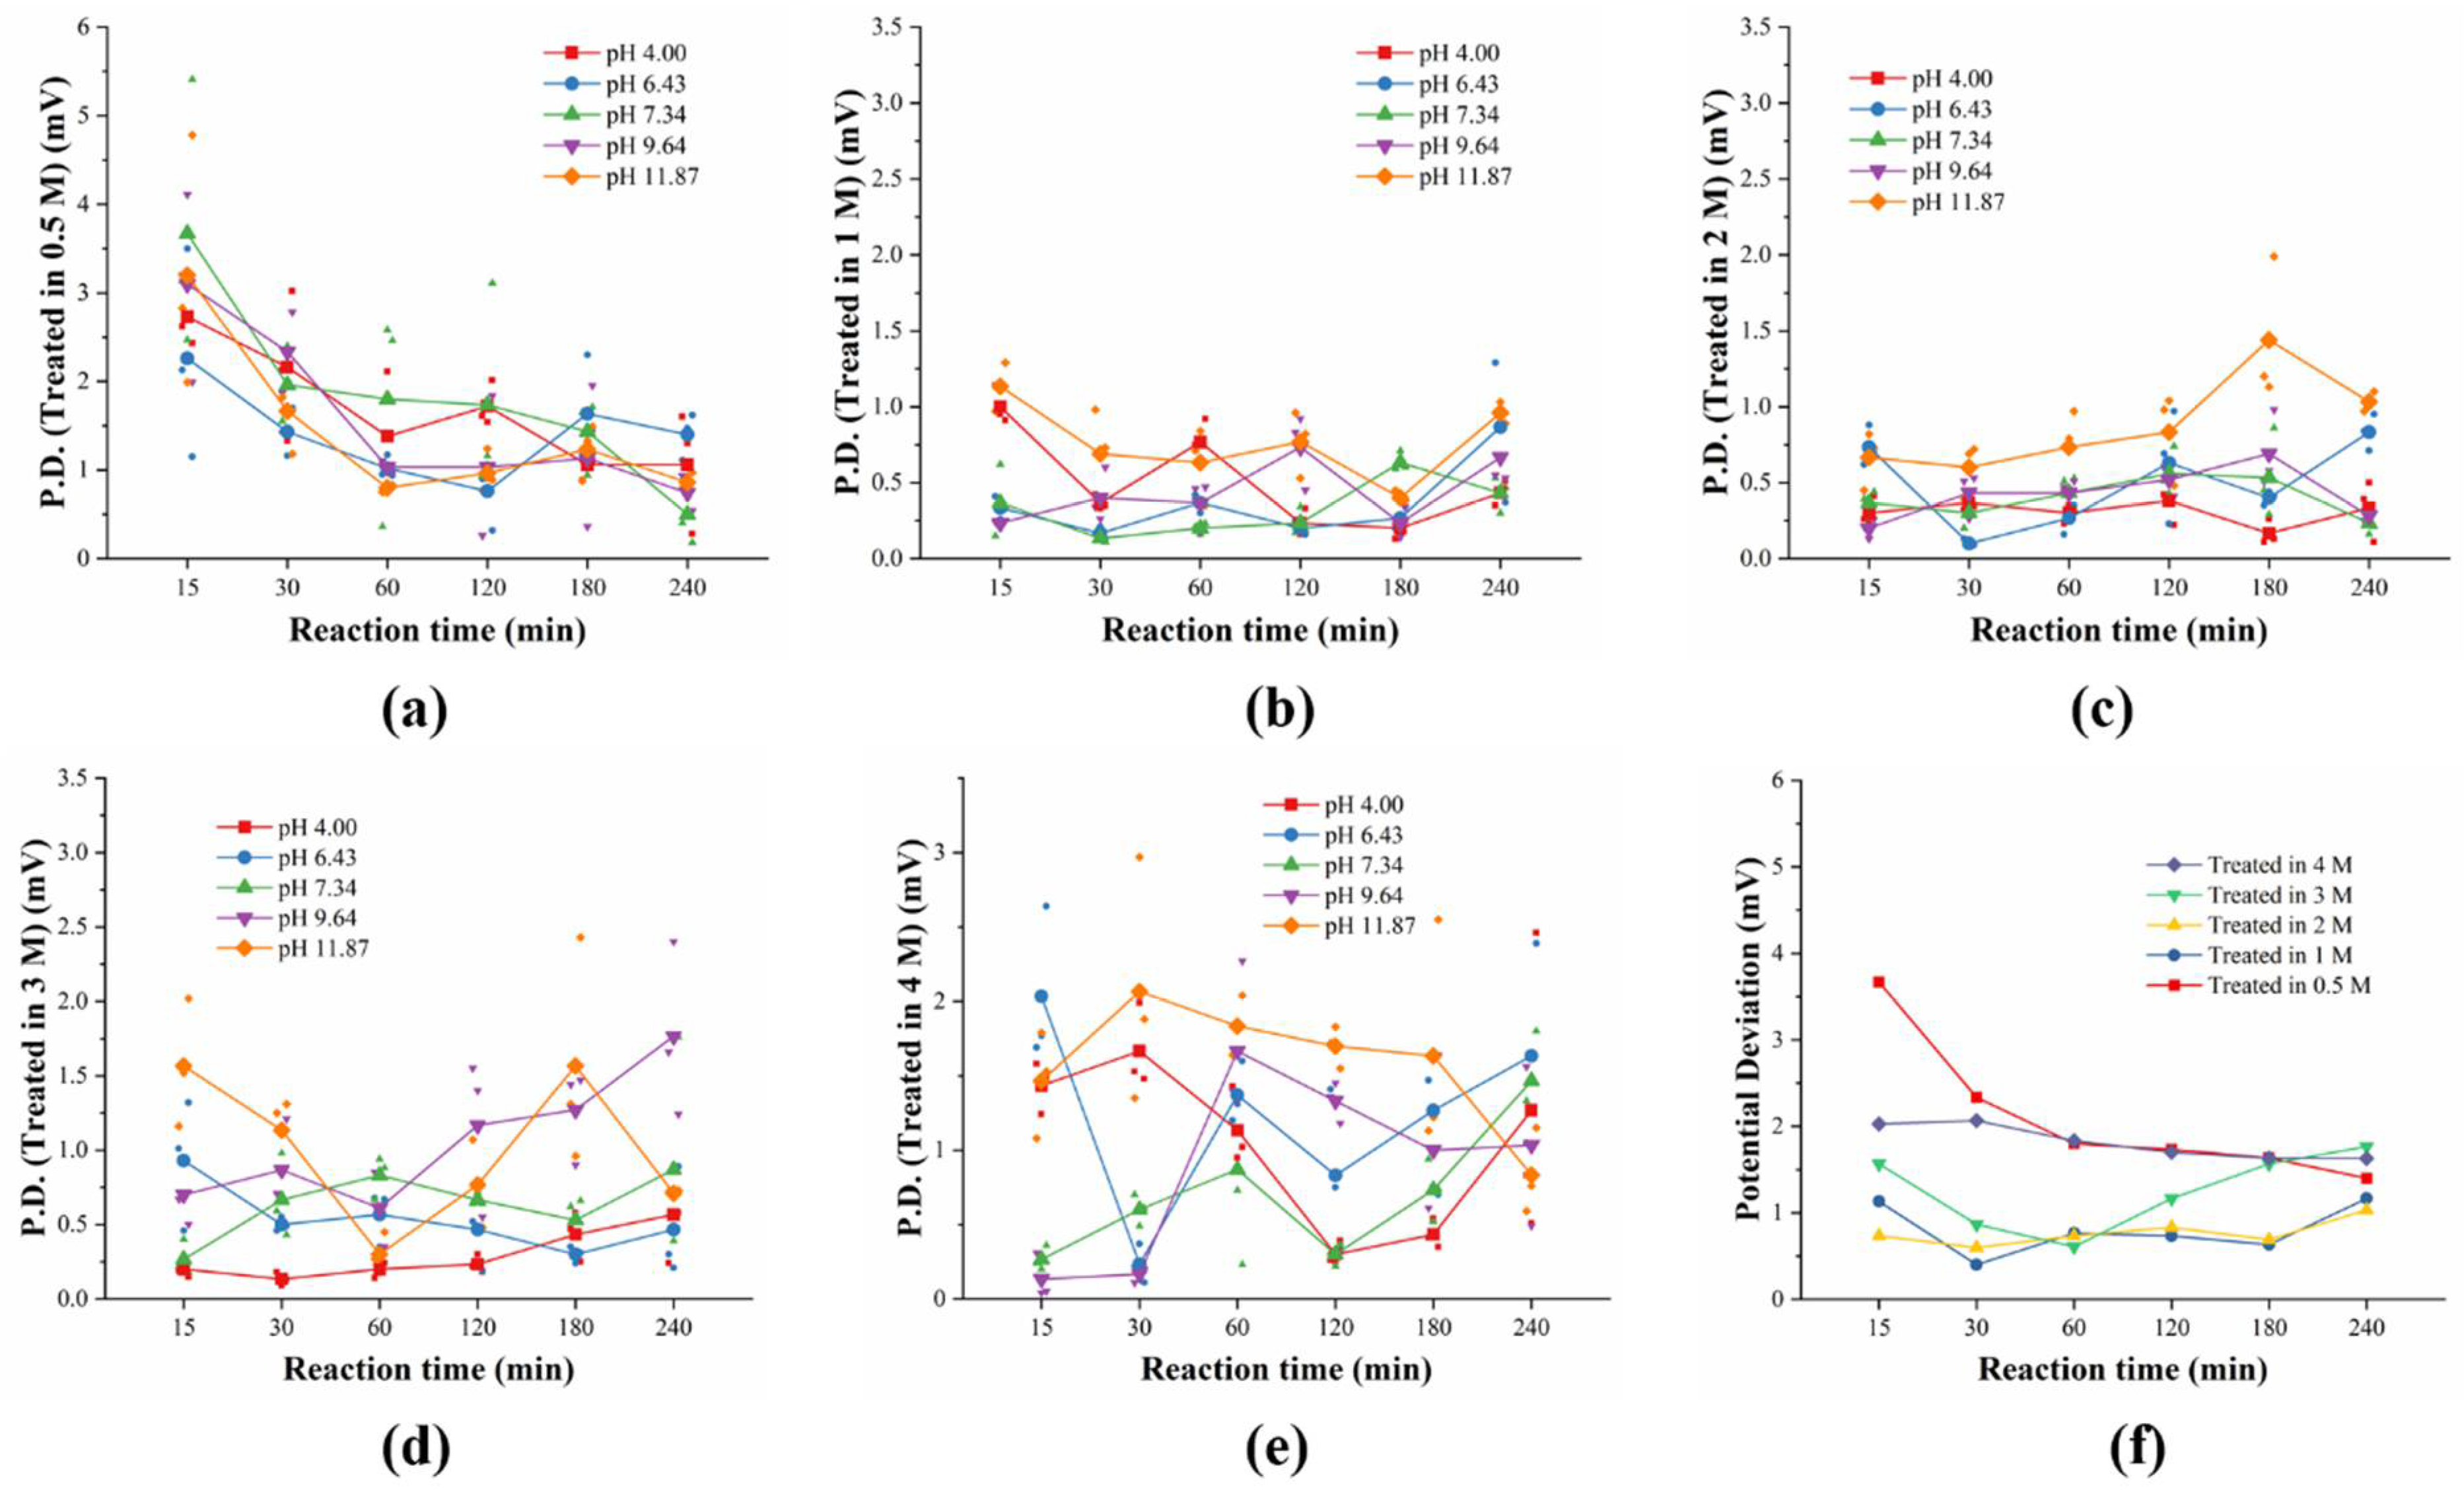
Potential deviation is defined herein to enable an investigation of the electrodes’ short-term stability. It is described as the potential difference between the peak potential value and the potential at a response time within 60 s. Each electrode was tested three times and the average potential deviations are presented in Figure 9a and Figure 8e (note the ordinate value of Figure 9a). Figure 9f shows the maximum potential deviation of each electrode at different pH levels.
Figure 9a–e show that the potential deviation of the electrode also depended on the fabrication parameters but not the pH levels. Figure 9f indicates that electrodes obtained in 1 and 2 M NaOH solutions showed relatively low potential deviations, ranging from 0.63 to 1.17 mV. Thus, the drift effect of the electrodes treated with 1 and 2 M NaOH solutions was further studied.
3.4.4. Drift Effect
The drift effect was explored using 4 pieces of electrodes treated with 1 M NaOH and 4 pieces treated with 4 M NaOH for various reaction times (15, 60, 120, or 240 min). As listed in Table 1, with an increase in the reaction time from 15 to 240 min, the drift of the electrodes obtained in 1 and 2 M NaOH solutions showed an apparent decrease from 36.18 to 6.4 mV/h and 22.53 to 5.16 mV/h, respectively. Similarly, the increased solution concentration also resulted in decreased drift.
Compared with previous results, the drift of the prepared electrode was relatively high, which may contribute to the high resistance and intrinsic properties of TiO2 films [37]. Yusof reported a TiO2 sensing membrane fabricated using the RF sputtering method with a drift of 4.41 mV/h. Chou doped ruthenium metallic ions on TiO2 film using a co-sputtering system to decrease the resistivity and increase its carrier mobility, which resulted in a very low drift effect of 1.67 mV/h [38].
3.4.5. Hysteresis
The hysteresis widths of the electrodes are listed in Table 2. The results showed that the increased NaOH concentration and reaction time decreased the hysteresis width. The hysteresis width of the TiO2 pH sensor was reported to be 30 mV in the cycle of 2–12–2 by Fog and Buck in 1984 [39]. Afterwards, few studies have mentioned the hysteresis width of TiO2-based pH electrodes. Compared with other metal oxide-based pH-sensitive electrodes, the prepared electrodes showed a relatively high hysteresis. Xu reported an RuO2 pH sensor fabricated using the magnetron sputtering method with a hysteresis of 6.4 mV in the loop of 7–4–7–10–7 and 5.1 mV in the loop of 7–10–7–4–7 [40]. An electrodeposited iridium oxide pH sensor was reported to have a hysteresis of 0.5–1.5 in neutral solution. Santos used the hydrothermal synthesis method to develop a WO3 pH sensor with a hysteresis of 6–10 mV [41]. This feature may contribute to the intrinsic properties, the surface area, crystalline properties, and the composition of TiO2 films [7].
3.4.6. Repeatability
Based on the characterization studies, 1 M and 120 min were selected as the optimum fabrication parameters for the super-hydrophilic TiO2 pH electrode. The SEM image confirmed the presence of dense and uniform microstructures on the surface, leading to its small CA of 5.46°. It also showed the highest sensitivity of 54.13 mV/pH, a fast response of 18.1 s in pH 4–12, an acceptable drift of 9.29 mV/h, and a hysteresis width of 11.4 mV.
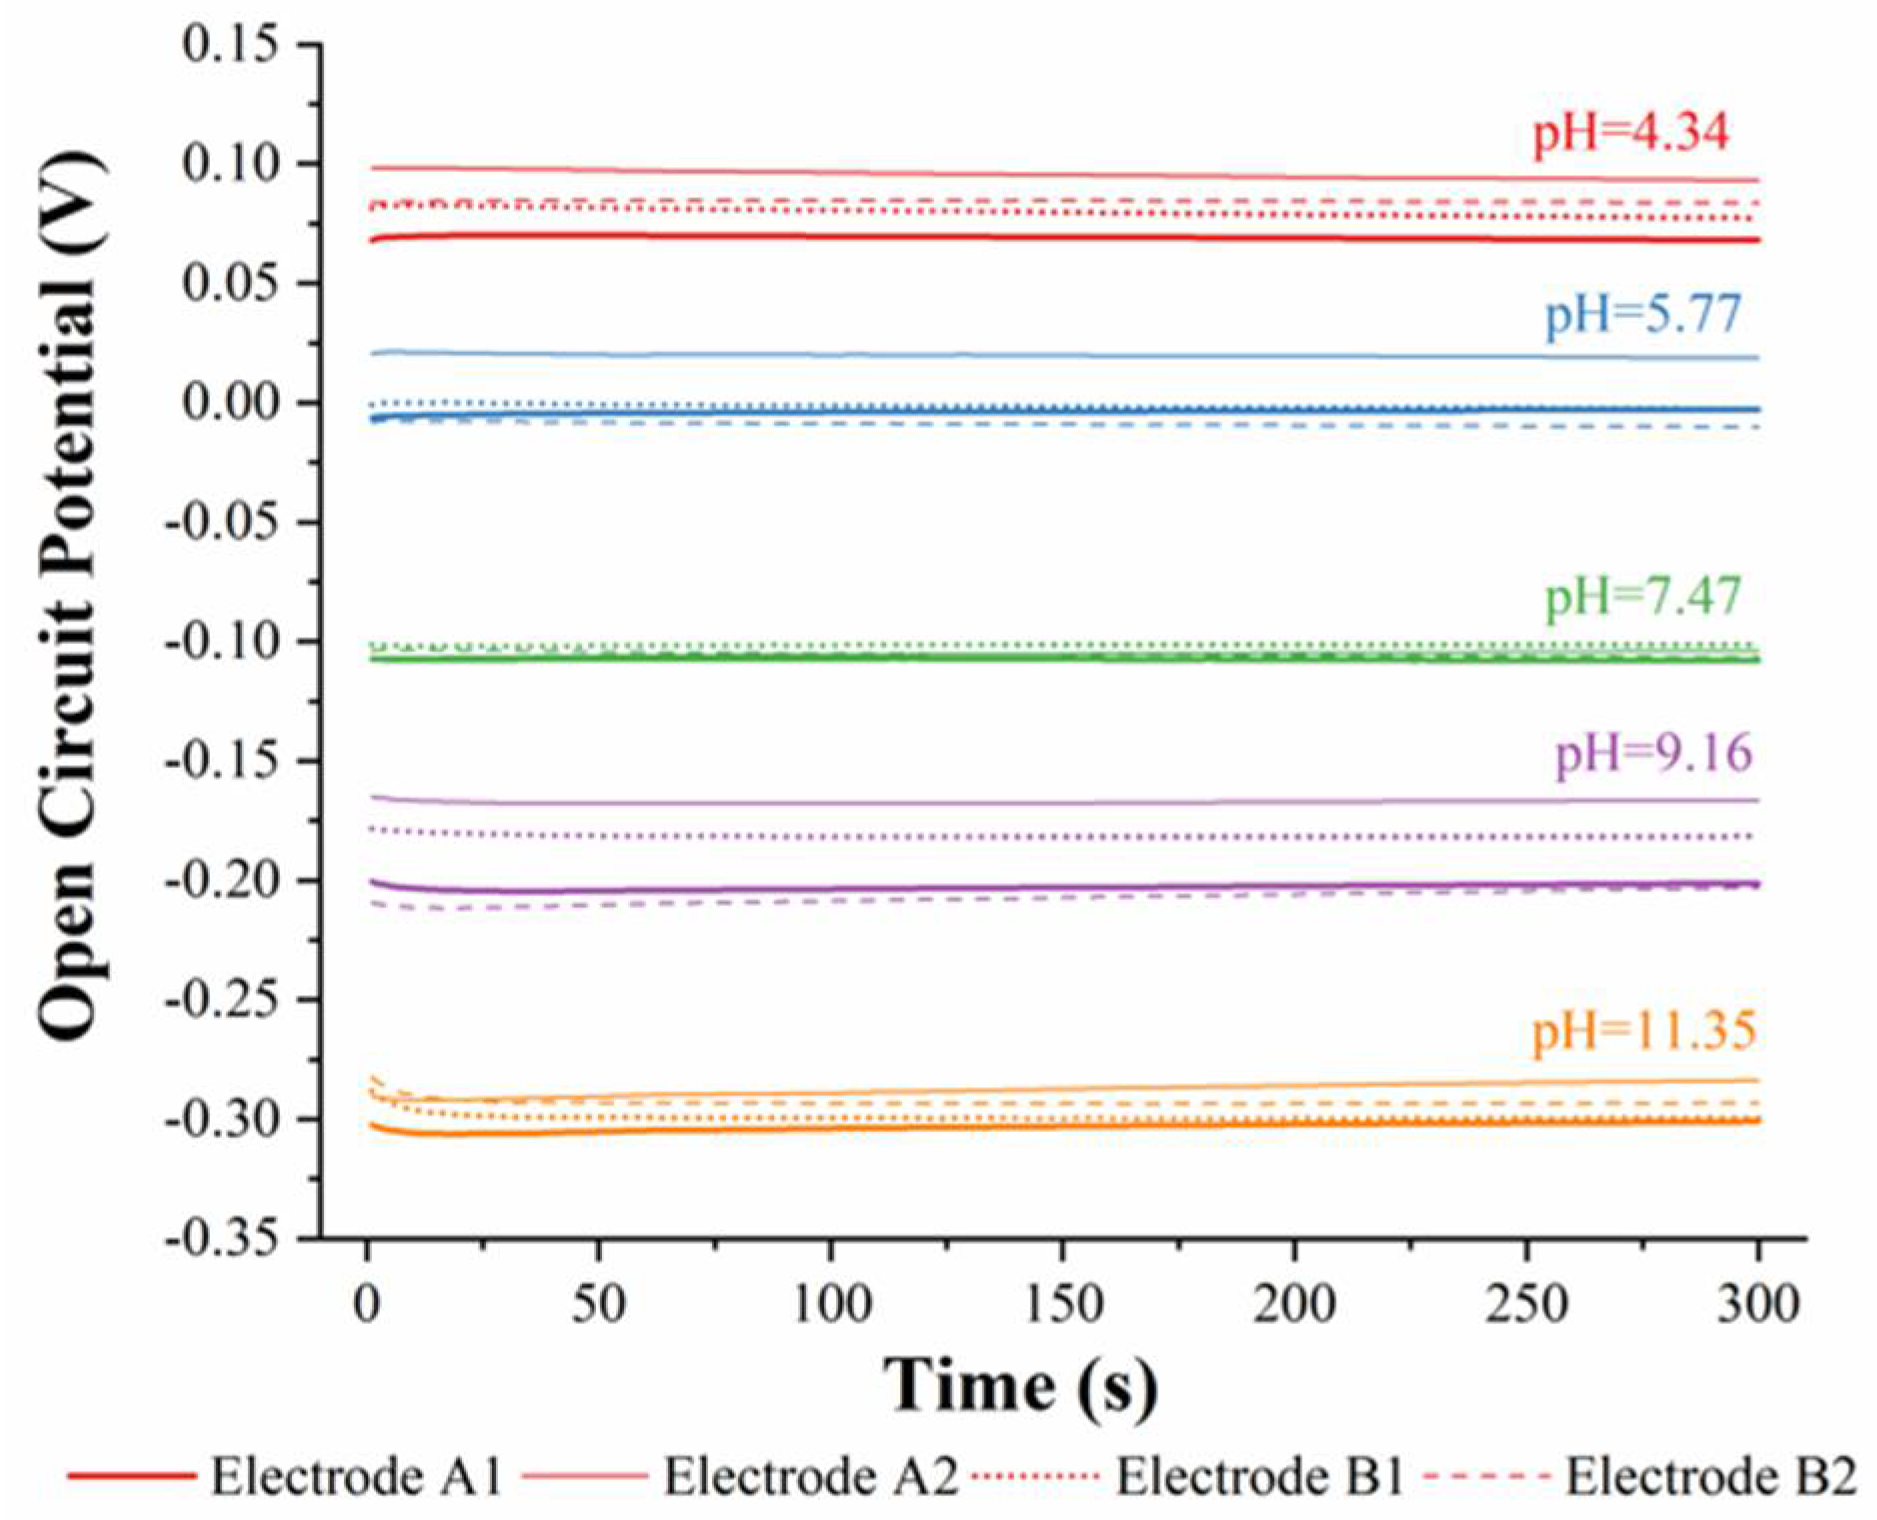
Subsequently, a new series of electrodes were fabricated to evaluate their repeatability. Thus, 2 electrodes from the initial lot (electrodes A1 and A2) and 2 from the new lot (electrodes B1 and B2) were dipped in PBS with different pH levels for 300 s, respectively. The OCP changes were recorded at 1 s intervals, and the results are presented in Figure 10. The electrodes from the different lots showed stable and consistent response potentials for each pH level. As shown in Table 3, the electrodes from the new lot showed a similar Nernstian response, with a sensitivity of 53.47 and 54.58 mV/pH. Thus, the discrepancy in the sensitivity for the different lots was less than 1.95 mV/pH, indicating the good repeatability compared with previously reported electrodes [35].
3.4.7. Selectivity
The selectivity coefficient of an electrode characterizes its ability to distinguish a particular ion from others and is commonly evaluated using the fixed interference method (FIM), which is defined by the following equation:
where F is Faraday Constant, R is gas constant, T is Kelvin Temperature, E is the experimentally measured potential, Ei0 is a constant that includes the standard sensing potential of the primary ion, Ej0 is the sensing potential of the interfering ion, and Zi is the charge numbers of the principal ion I [33].
The interference effects of the five cations are compared in Table 4. The selectivity coefficients of the fabricated electrodes for Na+, K+, Ca2+, Ni2+, and Fe3+ were −3.02, −3.44, −2.51, −3.52, and −3.29, respectively. The selectivity coefficients for the tested interfering ions were smaller than 1 and Kijpot was less than 10−2, indicating its good selectivity [42,43].
3.4.8. Stability of the Super-Hydrophilic TiO2-Sensitive Electrode
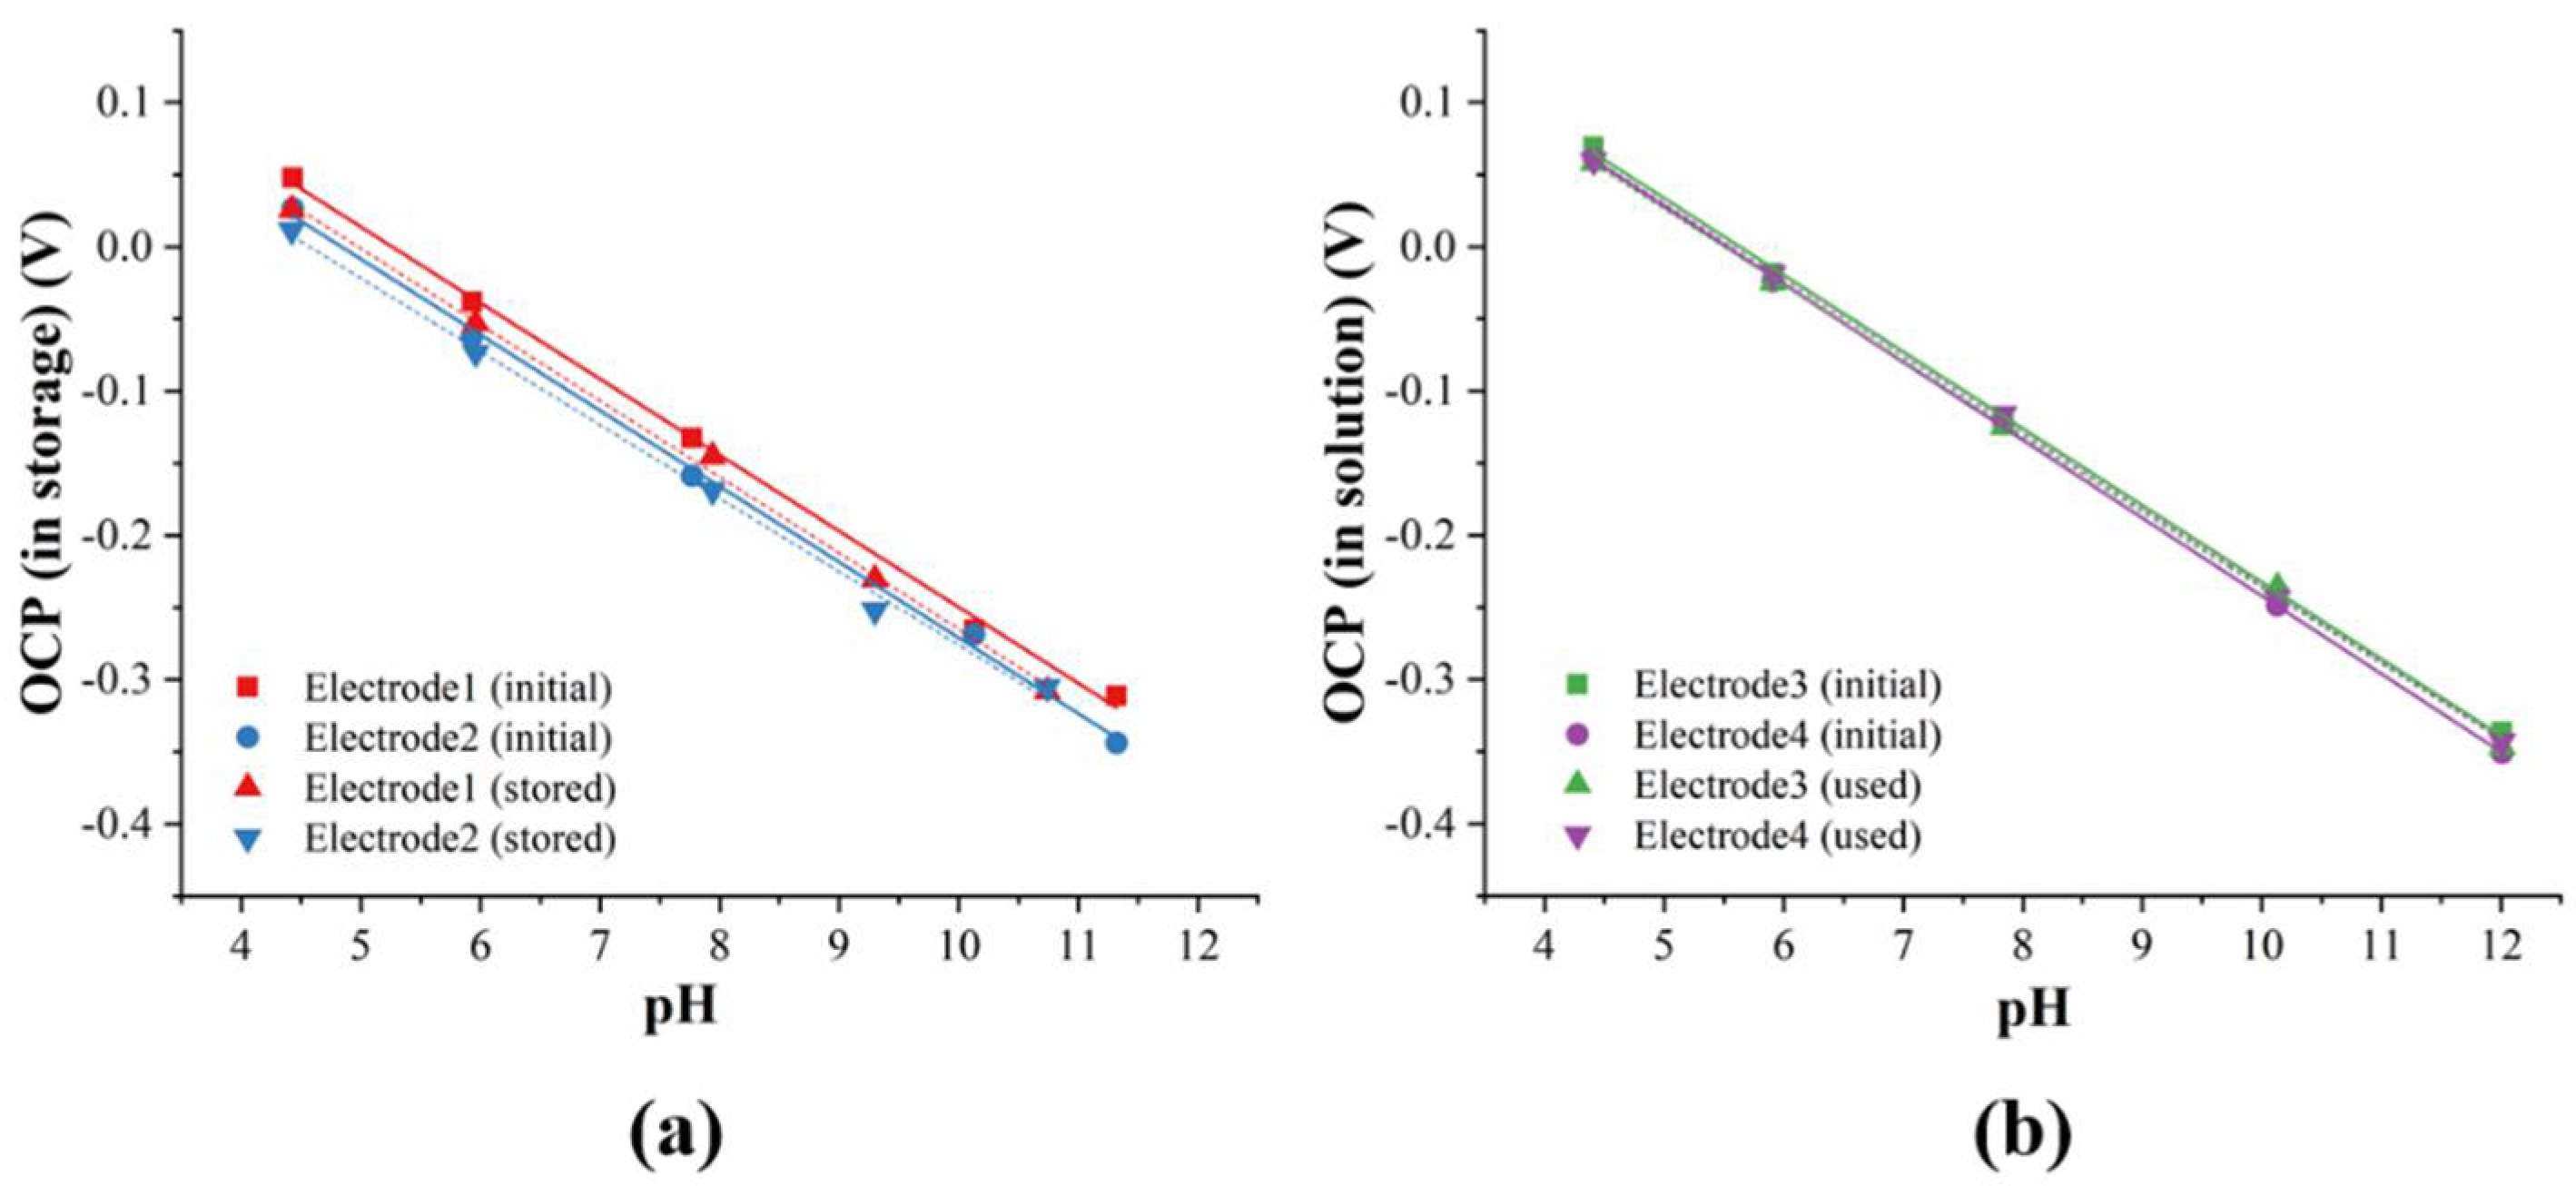
The fabricated electrodes were stored in a clean and dry box, which was placed in the dark and was not hermetic. As listed in Table S3, after storage for 60 days, CA of the 2 electrodes changed from 5.93° to 7.43° and 6.37° to 7.48°, respectively. The sensitivity of the electrodes changed from 52.71 and 52.49 mV/pH to 52.74 and 50.83 mV/pH (shown in Figure 11a and Table S3). The small difference in the CA and sensitivity within 60 days indicated the good continuous wettability and pH sensing performance of the electrodes during storage.
The difference in the electrodes before and after pH measurement in the solutions was also investigated. Table S3 shows that the CA of the 2 other electrodes showed small increases of 2.43° and 0.36° after being used for 1800 s and still satisfied the super-hydrophilic surface standard. Figure 11b shows that the electrode sensitivity was almost the same before and after being dipped in solutions with different pH levels.
4. Conclusions
In this work, super-hydrophilic TiO2 pH-sensitive electrodes were fabricated using the chemical etching method. The influence of the chemical etching parameters (solution concentration and reaction time) on the structure, morphology, wettability, and pH response of the porous films was investigated. With an increased NaOH concentration and reaction time, the surface microstructures became denser and more uniform, improving the wettability, pH sensitivity, and response time of the electrodes. However, a further increase in the NaOH concentration and reaction time led to large and unevenly sized microstructures and an increased presence of titanate, resulting in poor pH wettability, pH sensitivity, and response time, and low drift and hysteresis, indicating the stabler structure of the films.
The electrode obtained using 1 M and 120 min is the optimal product due to its good wettability, with a contact angle of 5.46°, a high sensitivity of 54.13 mV/pH, a response time of 18.1 s in pH 4–12, an acceptable drift of 9.29 mV/h, a hysteresis width of 11.4 mV, and good selectivity for Na+, K+, Ca2+, Ni2+, and Fe3+. The electrode also showed good stability in wettability and pH sensing properties during storage and utilization in PBS.
Supplementary Materials
The following supporting information can be downloaded at: https://0-www-mdpi-com.brum.beds.ac.uk/article/10.3390/chemosensors10050182/s1, Figure S1: Ti 2p deconvoluted core excitations for electrode treated by using (a)1 M–240 min, (b) 4 M–120 min, (c) 4 M–240 min, and O 1s deconvoluted core excitations for electrode treated by using (d)1 M–240 min, (e) 4 M–120 min, (f) 4 M–240 min. Figure S2: SEM images of TiO2 electrodes prepared in 1 M NaOH for (a) 15 min, (b) 60 min, (c) 120 min and (d) 240 min with the size of pores and ridges. Figure S3: SEM images of TiO2 electrodes prepared in 4 M NaOH for (a) 15 min, (b) 60 min, (c) 120 min and (d) 240 min the size of pores and ridges. Figure S4: One μL water droplet contact angle measurements on the electrodes obtained with different fabrication parameters. Table S1: The atomic ratios and parameters of the deconvoluted XPS spectra for different electrodes. Table S2: Sensitivity of the electrodes treated with different fabrication parameters. Table S3. Comparation of the sensitivity and CA of the electrodes before and after utilization/storage.
Author Contributions
Conceptualization, C.C., K.X. and X.Z.; methodology, C.C., Y.Z. and H.G.; validation, C.C., Y.Z. and H.G.; investigation, C.C. and Y.Z.; resources, X.Z.; data curation, C.C.; writing—original draft preparation, C.C.; writing—review and editing, C.C. and K.X.; visualization, C.C.; supervision, X.Z.; project administration, X.Z.; funding acquisition, X.Z. All authors have read and agreed to the published version of the manuscript.
Funding
This research was funded by National Natural Science Foundation of China, grant number 32071900; Jiangsu Postgraduate Research Innovation Program of China, grant number KYCX17_1758.
Institutional Review Board Statement
Not applicable.
Informed Consent Statement
Not applicable.
Data Availability Statement
Not applicable.
Acknowledgments
The authors would like to thank the School of Mechanical Engineering at Jiangsu University for supporting this research and providing the appropriate research environment.
Conflicts of Interest
The authors declare no conflict of interest.
References
- Wang, R.; Hashimoto, K.; Fujishima, A.; Chikuni, M.; Kojima, E.; Kitamura, A.; Shimohigoshi, M.; Watanabe, T. Light-Induced Amphiphilic Surfaces. Nature 1997, 388, 431–432. [Google Scholar] [CrossRef]
- Farahani, E.; Mohammadpour, R. Fabrication of Flexible Self-Powered Humidity Sensor Based on Super-Hydrophilic Titanium Oxide Nanotube Arrays. Sci. Rep. 2020, 10, 13032. [Google Scholar] [CrossRef] [PubMed]
- Gao, K.; Wang, X.; Yang, B.; Chen, X.; Li, X.; Liu, J. A Novel Wearable Sweat Rate Sensor for Both Dominant and Recessive Sweat Rate Measurement. In Proceedings of the 2019 20th International Conference on Solid-State Sensors, Actuators and Microsystems & Eurosensors XXXIII (Transducers & Eurosensors XXXIII), Berlin, Germany, 23–27 June 2019; IEEE: Berlin/Heidelberg, Germany, 2019; pp. 817–820. [Google Scholar]
- Zamarreño, C.R.; Bravo, J.; Goicoechea, J.; Matias, I.R.; Arregui, F.J. Response Time Enhancement of PH Sensing Films by Means of Hydrophilic Nanostructured Coatings. Sens. Actuators B Chem. 2007, 128, 138–144. [Google Scholar] [CrossRef]
- Zhao, R.; Xu, M.; Wang, J.; Chen, G. A PH Sensor Based on the TiO2 Nanotube Array Modified Ti Electrode. Electrochim. Acta 2010, 55, 5647–5651. [Google Scholar] [CrossRef]
- Zhang, X.; Lu, C.; Geng, M.; Xu, K.; Zong, S. Effects of Surface Area on All-Solid-Stated PH Sensor Based on Antimony Electrode. IEEE Sens. J. 2020, 20, 680–688. [Google Scholar] [CrossRef]
- Manjakkal, L.; Szwagierczak, D.; Dahiya, R. Metal Oxides Based Electrochemical PH Sensors: Current Progress and Future Perspectives. Prog. Mater. Sci. 2020, 109, 100635. [Google Scholar] [CrossRef]
- Yao, P.C.; Lee, M.C.; Chiang, J.L. Annealing Effect of Sol-Gel TiO2 Thin Film on PH-EGFET Sensor. In Proceedings of the 2014 International Symposium on Computer, Consumer and Control, Taichung, Taiwan, 10–12 June 2014; IEEE: Taichung, Taiwan, 2014; pp. 577–580. [Google Scholar]
- Yusof, K.A.; Abdul Rahman, R.; Zulkefle, M.A.; Herman, S.H.; Abdullah, W.F.H. EGFET PH Sensor Performance Dependence on Sputtered TiO2 Sensing Membrane Deposition Temperature. J. Sens. 2016, 2016, 1–9. [Google Scholar] [CrossRef] [Green Version]
- Huang, Y.-C.; Tsai, F.-S.; Wang, S.-J. Preparation of TiO2 Nanowire Arrays through Hydrothermal Growth Method and Their PH Sensing Characteristics. Jpn. J. Appl. Phys. 2014, 53, 06JG02. [Google Scholar] [CrossRef]
- Doghmane, H.E.; Touam, T.; Chelouche, A.; Challali, F.; Bordji, B. Investigation of the Influences of Post-Thermal Annealing on Physical Properties of TiO2 Thin Films Deposited by RF Sputtering. Semiconductors 2020, 54, 268–273. [Google Scholar] [CrossRef]
- Sirghi, L.; Hatanaka, Y. Hydrophilicity of amorphous TiO2 ultra-thin films. Surf. Sci. 2003, 530, L323–L327. [Google Scholar] [CrossRef]
- Sakai, N.; Fujishima, A.; Watanabe, T.; Hashimoto, K. Quantitative Evaluation of the Photoinduced Hydrophilic Conversion Properties of TiO2 Thin Film Surfaces by the Reciprocal of Contact Angle. J. Phys. Chem. B 2003, 107, 1028–1035. [Google Scholar] [CrossRef]
- Sun, R.-D.; Nakajima, A.; Fujishima, A.; Watanabe, T.; Hashimoto, K. Photoinduced Surface Wettability Conversion of ZnO and TiO2 Thin Films. J. Phys. Chem. B 2001, 105, 1984–1990. [Google Scholar] [CrossRef]
- Karuppuchamy, S.; Jeong, J.M. Super-Hydrophilic Amorphous Titanium Dioxide Thin Film Deposited by Cathodic Electrodeposition. Mater. Chem. Phys. 2005, 93, 251–254. [Google Scholar] [CrossRef]
- Oishi, T.; Matsubara, T.; Katagirl, A. Formation of Porous TiO2 by Anodic Oxidation and Chemical Etching of Titanium. Electrochemistry 2000, 68, 106–111. [Google Scholar] [CrossRef] [Green Version]
- Tanaka, S.; Aonuma, M.; Hirose, N.; Tanaki, T. The Preparation of Porous TiO2 by Immersing Ti in NaOH Solution. J. Electrochem. Soc. 2002, 149, 167. [Google Scholar] [CrossRef]
- Tanaka, S.; Hirose, N.; Tanaki, T. Effect of the Temperature and Concentration of NaOH on the Formation of Porous TiO2. J. Electrochem. Soc. 2005, 152, 789. [Google Scholar] [CrossRef]
- Chen, J.; Liu, Z.; Zhou, H.; Zheng, Y. A Study on Preparation of TiO2 Thin Films by Alkali Treatment of Ti Foils. J. Chem. Eng. Chin. Univ. 2013, 6, 1051–1057. [Google Scholar] [CrossRef]
- Kamarozaman, N.S.; Asiah, M.N.; Aznilinda, Z.; Bakar, R.A.; Abdullah, W.F.H.; Herman, S.H.; Rusop, M. Memristive Behavior of TiO2 Nanostructures Grown at Different Substrate Positioning by Immersion Method. AMR 2013, 795, 256–259. [Google Scholar] [CrossRef]
- Manjakkal, L.; Cvejin, K.; Kulawik, J.; Zaraska, K.; Szwagierczak, D.; Socha, R.P. Fabrication of Thick Film Sensitive RuO2-TiO2 and Ag/AgCl/KCl Reference Electrodes and Their Application for PH Measurements. Sens. Actuators B Chem. 2014, 204, 57–67. [Google Scholar] [CrossRef]
- Morozumi, T.; Mizuno, T.; Kurachi, T. Hydrogen Absorption in Cathodically Polarized Zirconium. Corros. Eng. 1979, 28, 285–291. [Google Scholar] [CrossRef]
- Otitoju, T.A.; Ahmad, A.L.; Ooi, B.S. Superhydrophilic (Superwetting) Surfaces: A Review on Fabrication and Application. J. Ind. Eng. Chem. 2017, 47, 19–40. [Google Scholar] [CrossRef]
- Extrand, C.W.; Moon, S.I.; Hall, P.; Schmidt, D. Superwetting of Structured Surfaces. Langmuir 2007, 23, 8882–8890. [Google Scholar] [CrossRef] [PubMed]
- Feng, X.J.; Jiang, L. Design and Creation of Superwetting/Antiwetting Surfaces. Adv. Mater. 2006, 18, 3063–3078. [Google Scholar] [CrossRef]
- Yuan, J.; Liu, X.; Akbulut, O.; Hu, J.; Suib, S.L.; Kong, J.; Stellacci, F. Superwetting Nanowire Membranes for Selective Absorption. Nat. Nanotech 2008, 3, 332–336. [Google Scholar] [CrossRef]
- Yang, S.-Y.; Chen, C.-W.; Chou, J.-C. Investigation on the Sensitivity of TiO2:Ru PH Sensor by Taguchi Design of Experiment. Solid-State Electron. 2012, 77, 82–86. [Google Scholar] [CrossRef]
- Trasatti, S. Physical Electrochemistry of Ceramic Oxides. Electrochim. Acta 1991, 36, 225–241. [Google Scholar] [CrossRef]
- Mihell, J.A.; Atkinson, J.K. Planar Thick-Film PH Electrodes Based on Ruthenium Dioxide Hydrate. Sens. Actuators B Chem. 1998, 48, 505–511. [Google Scholar] [CrossRef]
- Yates, D.E.; Levine, S.; Healy, T.W. Site-Binding Model of the Electrical Double Layer at the Oxide/Water Interface. J. Chem. Soc. Faraday Trans. 1 1974, 70, 1807. [Google Scholar] [CrossRef]
- Al-Hilli, S.; Willander, M. The PH Response and Sensing Mechanism of N-Type ZnO/Electrolyte Interfaces. Sensors 2009, 9, 7445–7480. [Google Scholar] [CrossRef] [Green Version]
- Liao, Y.-H.; Chou, J.-C. Preparation and Characterization of the Titanium Dioxide Thin Films Used for PH Electrode and Procaine Drug Sensor by Sol–Gel Method. Mater. Chem. Phys. 2009, 114, 542–548. [Google Scholar] [CrossRef]
- Huang, W.-D.; Cao, H.; Deb, S.; Chiao, M.; Chiao, J.C. A Flexible PH Sensor Based on the Iridium Oxide Sensing Film. Sens. Actuators A Phys. 2011, 169, 1–11. [Google Scholar] [CrossRef]
- Manjakkal, L.; Zaraska, K.; Cvejin, K.; Kulawik, J.; Szwagierczak, D. Potentiometric RuO2–Ta2O5 PH Sensors Fabricated Using Thick Film and LTCC Technologies. Talanta 2016, 147, 233–240. [Google Scholar] [CrossRef] [PubMed]
- Manjakkal, L.; Cvejin, K.; Kulawik, J.; Zaraska, K.; Szwagierczak, D.; Stojanovic, G. Sensing Mechanism of RuO2–SnO2 Thick Film PH Sensors Studied by Potentiometric Method and Electrochemical Impedance Spectroscopy. J. Electroanal. Chem. 2015, 759, 82–90. [Google Scholar] [CrossRef]
- Telli, L. Study of a PH Sensor with MnO2 and Montmorillonite-Based Solid-State Internal Reference. Solid State Ion. 2000, 128, 255–259. [Google Scholar] [CrossRef]
- Zhuiykov, S.; Kats, E.; Kalantar-zadeh, K.; Breedon, M.; Miura, N. Influence of Thickness of Sub-Micron Cu2O-Doped RuO2 Electrode on Sensing Performance of Planar Electrochemical PH Sensors. Mater. Lett. 2012, 75, 165–168. [Google Scholar] [CrossRef]
- Jung-Chuan Chou; Cheng-Wei Chen Fabrication and Application of Ruthenium-Doped Titanium Dioxide Films as Electrode Material for Ion-Sensitive Extended-Gate FETs. IEEE Sens. J. 2009, 9, 277–284. [CrossRef]
- Fog, A.; Buck, R.P. Electronic Semiconducting Oxides as PH Sensors. Sens. Actuators 1984, 5, 137–146. [Google Scholar] [CrossRef]
- Xu, B.; Zhang, W.-D. Modification of Vertically Aligned Carbon Nanotubes with RuO2 for a Solid-State PH Sensor. Electrochim. Acta 2010, 55, 2859–2864. [Google Scholar] [CrossRef]
- Santos, L.; Neto, J.P.; Crespo, A.; Nunes, D.; Costa, N.; Fonseca, I.M.; Barquinha, P.; Pereira, L.; Silva, J.; Martins, R.; et al. WO3 Nanoparticle-Based Conformable PH Sensor. ACS Appl. Mater. Interfaces 2014, 6, 12226–12234. [Google Scholar] [CrossRef]
- Umezawa, Y.; Bühlmann, P.; Umezawa, K.; Tohda, K.; Amemiya, S. Potentiometric Selectivity Coefficients of Ion-Selective Electrodes. Part I. Inorganic Cations (Technical Report). Pure Appl. Chem. 2000, 72, 1851–2082. [Google Scholar] [CrossRef]
- Maleki, R.; Matin, A.A.; Jouyban, A. A Membrane Sensor for Selective Determination of Bisacodyl in Tablets. J. Chin. Chem. Soc. 2006, 53, 613–618. [Google Scholar] [CrossRef]
Figure 1.
(a) Scheme of the sensitive electrode fabrication procedure and (b) photograph of the sensitive electrode.
Figure 1.
(a) Scheme of the sensitive electrode fabrication procedure and (b) photograph of the sensitive electrode.

Figure 2.
(a) XRD and (b) XPS pattern of the sensitive electrodes obtained using four typical fabrication parameters, (c) Ti 2p, and (d) O 1s deconvoluted core excitations for the electrode obtained using 1 M–120 min.
Figure 2.
(a) XRD and (b) XPS pattern of the sensitive electrodes obtained using four typical fabrication parameters, (c) Ti 2p, and (d) O 1s deconvoluted core excitations for the electrode obtained using 1 M–120 min.

Figure 3.
SEM images of TiO2 electrodes prepared in 1 M NaOH for (a) 15, (b) 60, (c) 120, and (d) 240 min.
Figure 3.
SEM images of TiO2 electrodes prepared in 1 M NaOH for (a) 15, (b) 60, (c) 120, and (d) 240 min.

Figure 4.
SEM images of TiO2 electrodes prepared in 4 M NaOH for (a) 15, (b) 60, (c) 120, and (d) 240 min.
Figure 4.
SEM images of TiO2 electrodes prepared in 4 M NaOH for (a) 15, (b) 60, (c) 120, and (d) 240 min.

Figure 5.
The influence of the fabrication parameters on CA of the electrodes; CA < 10° is described as super-hydrophilic.
Figure 5.
The influence of the fabrication parameters on CA of the electrodes; CA < 10° is described as super-hydrophilic.

Figure 6.
The influences of the fabrication parameters on the sensitivity of the porous TiO2 electrodes.
Figure 6.
The influences of the fabrication parameters on the sensitivity of the porous TiO2 electrodes.

Figure 7.
Schematic of the detection principle and procedure of the TiO2 pH-sensitive electrode.

Figure 8.
The influences of the fabrication parameters and pH levels on the response time of the sensitive electrodes treated in (a) 0.5 M, (b) 1 M, (c) 2 M, (d) 3 M, (e) 4 M and (f) the response time of each electrode.
Figure 8.
The influences of the fabrication parameters and pH levels on the response time of the sensitive electrodes treated in (a) 0.5 M, (b) 1 M, (c) 2 M, (d) 3 M, (e) 4 M and (f) the response time of each electrode.

Figure 9.
The influences of the fabrication parameters and pH levels on the potential deviation (P.D.) of the sensitive electrodes treated in (a) 0.5 M, (b) 1 M, (c) 2 M, (d) 3 M, (e) 4 M and (f) the potential deviation of each electrode.
Figure 9.
The influences of the fabrication parameters and pH levels on the potential deviation (P.D.) of the sensitive electrodes treated in (a) 0.5 M, (b) 1 M, (c) 2 M, (d) 3 M, (e) 4 M and (f) the potential deviation of each electrode.

Figure 10.
OCP of the electrode obtained from two lots in different pH levels to demonstrate the repeatability.
Figure 10.
OCP of the electrode obtained from two lots in different pH levels to demonstrate the repeatability.

Figure 11.
Involution in the sensitivity of the electrodes (a) after storage for 60 days and (b) when utilized in PBS for 30 min.
Figure 11.
Involution in the sensitivity of the electrodes (a) after storage for 60 days and (b) when utilized in PBS for 30 min.


Table 1.
Drift of the electrodes treated using different fabrication parameters.
| Solution Concentration | Reaction Time (min) | |||
|---|---|---|---|---|
| 15 | 60 | 120 | 240 | |
| 1 M | 36.18 mV/h | 15.27 mV/h | 9.29 mV/h | 6.4 mV/h |
| 2 M | 22.53 mV/h | 9.38 mV/h | 7.11 mV/h | 5.16 mV/h |
Table 2.
Hysteresis width of the tested electrodes.
| Fabrication Parameters | Hysteresis in Loop 1 | Hysteresis in Loop 2 |
|---|---|---|
| 1 M 60 min | 17.6 mV | 19.3 mV |
| 1 M 120 min | 8.9 mV | 11.4 mV |
| 2 M 60 min | 10 mV | 10.5 mV |
| 2 M 120 min | 7.3 mV | 9.5 mV |
Table 3.
The pH sensing characteristics of the electrodes obtained from different lots.
| Sample | Sensitivity | Correlation Coefficient | Response Time |
|---|---|---|---|
| Electrode A1 | 52.63 | 0.996 | 16 s |
| Electrode A2 | 53.79 | 0.989 | 18 s |
| Electrode B1 | 53.47 | 0.998 | 20 s |
| Electrode B2 | 54.58 | 0.987 | 17 s |
Table 4.
The selectivity coefficients of the fabricated electrode for Na+, K+, Ca2+, Ni2+, and Fe3+.
Table 4.
The selectivity coefficients of the fabricated electrode for Na+, K+, Ca2+, Ni2+, and Fe3+.
| Primary Cation | Interfering Cation | Concentration of Interfering Cation | Kijpot | Log (Kijpot) |
|---|---|---|---|---|
| H+ | Na+ | 0.001 M | 9.54 × 10⁻⁴ | −3.02 |
| K+ | 3.61 × 10⁻⁴ | –3.44 | ||
| Ca2+ | 3.14 × 10⁻³ | –2.51 | ||
| Ni2+ | 2.97 × 10⁻⁴ | –3.52 | ||
| Fe3+ | 5.11 × 10⁻⁴ | –3.29 |
Publisher’s Note: MDPI stays neutral with regard to jurisdictional claims in published maps and institutional affiliations. |
© 2022 by the authors. Licensee MDPI, Basel, Switzerland. This article is an open access article distributed under the terms and conditions of the Creative Commons Attribution (CC BY) license (https://creativecommons.org/licenses/by/4.0/).
Share and Cite
MDPI and ACS Style
Chen, C.; Zhang, Y.; Gao, H.; Xu, K.; Zhang, X. Fabrication of Functional Super-Hydrophilic TiO2 Thin Film for pH Detection. Chemosensors 2022, 10, 182. https://0-doi-org.brum.beds.ac.uk/10.3390/chemosensors10050182
AMA Style
Chen C, Zhang Y, Gao H, Xu K, Zhang X. Fabrication of Functional Super-Hydrophilic TiO2 Thin Film for pH Detection. Chemosensors. 2022; 10(5):182. https://0-doi-org.brum.beds.ac.uk/10.3390/chemosensors10050182
Chicago/Turabian StyleChen, Cheng, Yalei Zhang, Han Gao, Kun Xu, and Xiliang Zhang. 2022. "Fabrication of Functional Super-Hydrophilic TiO2 Thin Film for pH Detection" Chemosensors 10, no. 5: 182. https://0-doi-org.brum.beds.ac.uk/10.3390/chemosensors10050182
Note that from the first issue of 2016, this journal uses article numbers instead of page numbers. See further details here.