Article

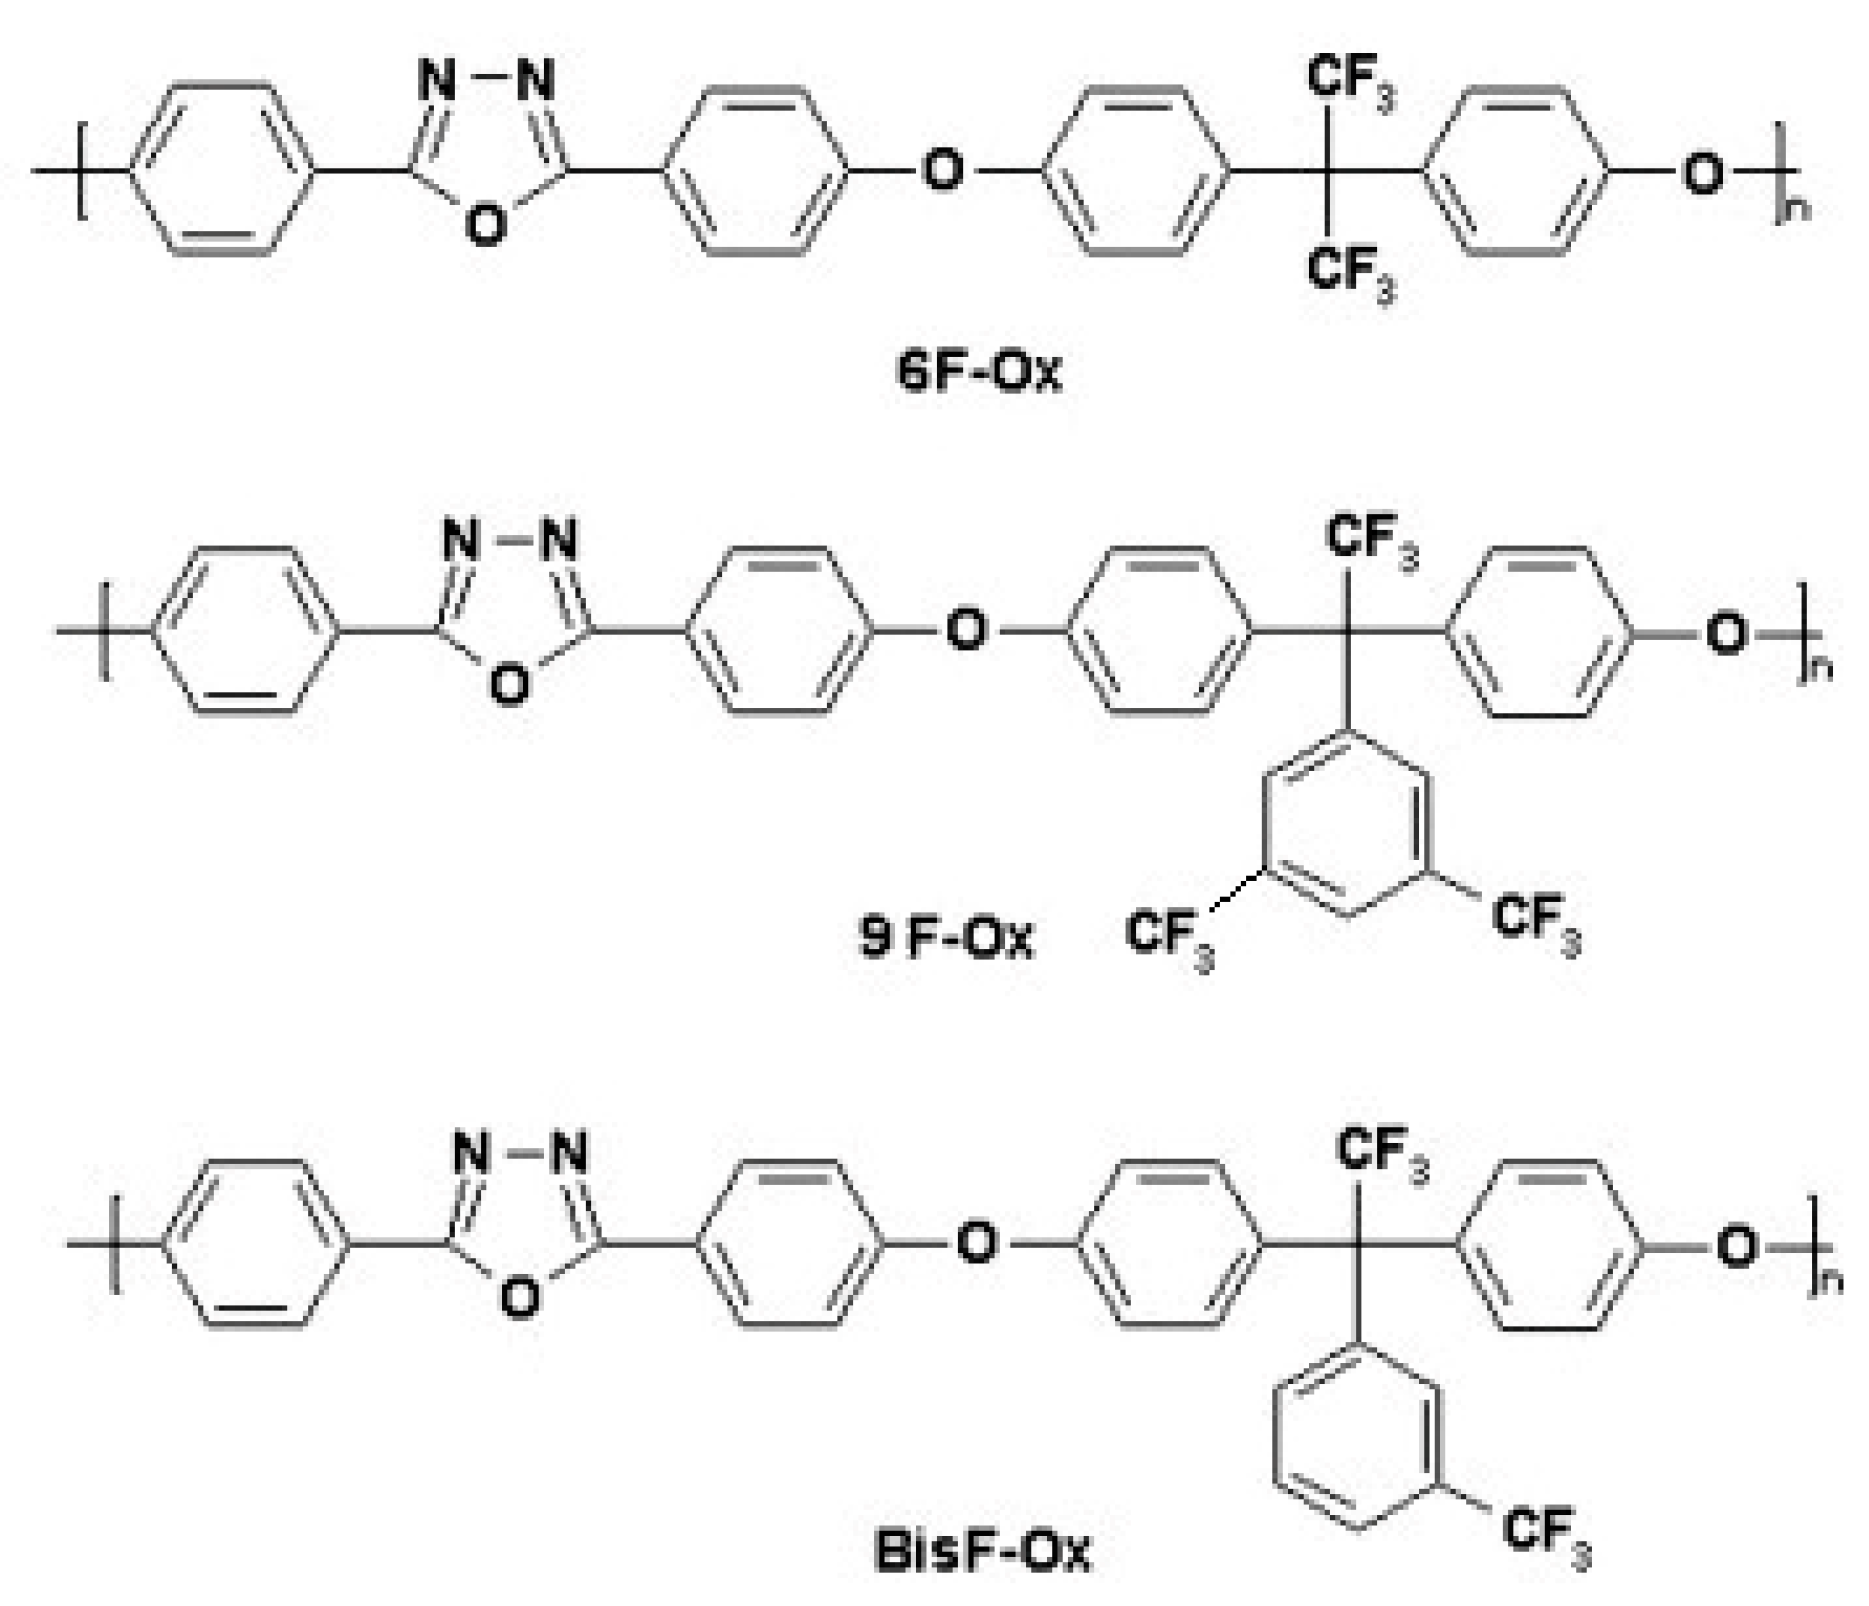
Spectroscopic Recognition of Metal Ions and Non-Linear Optical (NLO) Properties of Some Fluorinated Poly(1,3,4-Oxadiazole-Ether)s

“Petru Poni” Institute of Macromolecular Chemistry, 41A, Grigore Ghica Voda Alley, 700487 Iasi, Romania
*
Author to whom correspondence should be addressed.
Submission received: 1 April 2022 / Revised: 22 April 2022 / Accepted: 9 May 2022 / Published: 11 May 2022
(This article belongs to the Section Optical Chemical Sensors)

Abstract

:
In this paper, we examined the sensing ability of some fluorinated 1,3,4-oxadiazole-containing assemblies toward various metal ions and their nonlinear optical (NLO) properties. The changes in the spectral characteristics of these compounds in the existence of Mg2+, Mn2+, Ni2+, Cd2+, Zn2+, Co2+, Cu2+, Hg2+, Sn2+, and Ag+ metal ions were performed, and they were found to be selective and more sensitive toward the addition of Ag+, Co2+, and Cu2+ ions (new bands appeared). Instead, spectral changes in the presence of Mg2+, Mn2+, Ni2+, Cd2+, Zn2+, Hg2+, and Sn2+ were not significant, so we did not evaluate the corresponding binding parameters. Therefore, all of these compounds were found to be selective and sensitive to Ag+, Co2+, and Cu2+ ions. Furthermore, the first-order polarizability ( α CT ), the first-order hyperpolarizability ( β CT ), and the second-order hyperpolarizability (γCT) were evaluated using the solvatochromic approach, and the intramolecular charge transfer (ICT) characteristics were investigated using a generalized Mulliken–Hush (GMH) analysis.

1. Introduction

Recently, due to advancing environmental pollution, the recognition of various metal ions has become a vital requirement in various fields of biotechnology, material science, and environmental protection. Due to their excellent characteristics, including remarkable photophysical features, good chemical stability, and the option to be simply functionalized with diverse chromophore units and/or chelating groups, 1,3,4-oxadiazole assemblies are optimal materials for the development of optical sensors [1]. Detailed analysis and efforts to develop sensitive sensors that are used to detect metal ions in different environments, such as silver (Ag+), copper (Cu2+), and cobalt (Co2+) ions, are constantly changing due to their presence in the human body, the environmental media, and in biological systems [2,3,4]. Recent research suggests that silver, copper, and cobalt ions have a significant impact on human health through diseases that are induced by their excess, lack, and/or toxicity (silver ions: gastrointestinal diseases [5]; copper ion toxicity: Menkes [6] and Wilson [7] diseases; cobalt ions: Parkinson’s [8] and Alzheimer’s [9] diseases). In addition to these effects on human health, Co2+ ions are widely applied in industry and medicine, including corrosion-resistant alloys, Co60 for radiotherapy [10,11], and materials containing silver ions that are significant for various industrial fields have been extensively used as catalysts, electrodes [12], and antimicrobial agents [13]. Numerous techniques, including plasma mass spectrometry [14], flame atomic absorption spectrometry [15], potentiometric methods [16], fluorescence sensors [17,18], and electroanalytical sensors [19] have been developed and are commonly used for the detection of Co2+, Cu2+, and Ag+ metal ions in real samples. Instead, several advantages have been reported concerning the use of spectroscopic studies for various molecular assemblies to act as detection probes, including a high degree of sensitivity and selectivity in identifying different analytes, the ability to recognize multiple metal ions in aqueous solutions, a simple setup, a low response time, and a low cost [20].
So far, various sensing molecular assemblies containing 1,3,4-oxadiazole units have been studied to identify various metal ions, including Ca2+ [21], Cd2+ [22], Ag+ [23], Hg2+ [24], Fe3+ [25], and Zn2+ [26], while a limited number of references have been made for interactions between fluorinated 1,3,4-oxadiazole derivatives and various metal ions. For example, 2-(2-hydroxyphenyl)-5-(4-methoxyphenyl)-1,3,4-oxadiazole was involved in the recognition of Zn2+ in water solutions and showed a high degree of selectivity and sensitivity [27].
Fluorochemosensors having an oxadiazole (bis(N,N-bis(2-pyridylmethyl)amine) bridge have also been reported in the literature and have shown “on–off” fluorescence switch characteristics and a high selectivity for Cu2+ that is related to a range of other ions [28,29]. Zheng et al. [30] reported 2,5-bis(pyridine-2-formamidophenyl)-1,3,4-oxadiazole derivatives that exhibited good responses in the recognition of Ag+ ions.
Furthermore, molecular structures having 1,3,4-oxadiazole and showing NLO properties have attracted considerable interest due to their applications in different technical fields, including medicine [31], organic light-emitting diodes (OLED) [32], solar cells [33,34], quantum computing, and optoelectronics [35,36]. The nonlinear optical effects in organic compounds are predominantly a result of their electronic structure, resulting in a fast nonlinear response compared to inorganic NLO materials [37,38].
In this paper, we investigate the ability of some fluorinated 1,3,4-oxadiazole derivatives to recognize metal ions (i.e., Mg2+, Mn2+, Ni2+, Cd2+, Zn2+, Co2+, Cu2+, Hg2+, Sn2+, and Ag+) using absorption and fluorometric titrations, as well as nonlinear optical properties in different media. We also studied the NLO parameters αCT, βCT, and γCT, of the fluorinated 1,3,4-oxadiazole assemblies in relation to their solvatochromic behavior. The Mulliken-Hush method is employed to study the intramolecular charge transfer (ICT) characteristics of the BisFOx derivative.

2. Materials and Methods

2.1. Materials

The investigated fluorinated 1,3,4-oxadiazole assemblies, BisFOx, 9FOx, and 6Fox, were obtained via the aromatic nucleophilic substitution reaction of 2,5-bis(p-fluorophenyl)-1,3,4-oxadiazole with fluorinated bisphenols, as previously reported in the literature [39]. The nucleophilic substitution reaction between an aryl halide and a phenoxide is the most common method of synthesizing poly(aryl-ether)s. The polycondensation reactions have been performed in NMP solvent, using anhydrous potassium carbonate as the catalyst, and were performed at elevated temperatures. The 1,3,4-oxadiazole units in these compounds act as an activating group that receives a negative charge and thus causes the activation energy to decrease for the displacement of the p-substituted fluorine group by a Meisenheimer complex, similar to other activating groups, including ketone or sulfone [39].
The molecular structure and purity of the obtained compounds were confirmed via the analysis of FTIR(FTIR spectrophotometer, Bruker Optik GmbH, Ettlingen, Germany) and 1H NMR (Bruker Avance Neo instrument (Bruker BioSpin, Rheinstetten, Germany) data (given in Supplementary Material). The obtained FTIR spectra of the 1,3,4-oxadiazole derivatives were analyzed by defining the registered peaks corresponding to the groups (OH–, C–O, C–H). From the FTIR spectra for the BisFOx sample, the followed peaks (cm−1) were identified: 3047 (aromatic C–H), 1601 (aromatic C=C), 1246 (aromatic ether linkage), 1150 (trifluoromethyl group), 1013, and 961 (oxadiazole ring) [29]. The spectra for the 6FOx sample include the following peaks (in cm−1) 3052 (aromatic C–H), 1603 (aromatic C=C), 1247 (aromatic ether linkage), 1173, 1210 (hexafluoroisopropylidene group), 1020, and 968 (oxadiazole ring) [39], and for 6FOx, the following peaks: 3073 (aromatic C–H), 1602 (aromatic C=C), 1509, 1489, 1368, 1278, 1247 (aromatic ether linkage), 1160, 1013, and 961 (oxadiazole ring).
Their chemical structures are presented in Figure 1. All spectroscopy-grade solvents and all metal salts were purchased from various commercial sources and used without further purification as received.

2.2. UV–Visible Absorption and Steady-State Fluorescence Spectra Measurements

The recognition of metal ions, including Mg2+, Mn2+, Ni2+, Cd2+, Zn2+, Co2+, Cu2+, Hg2+, Sn2+, and Ag+ by fluorinated 1,3,4-oxadiazole derivatives in THF solution, was studied using absorption and fluorescence titration experiments. To prepare the metal ion stock solutions (1.05 × 10⁻³ mol L−1), the proper amounts of MgCl2 × 6H2O, MnSO4 × H2O, NiCl2 × 6H2O, CdSO4, ZnSO4 × 6H2O, CoCl2 × 6H2O, CuCl2 × 6H2O, HgCl2, SnCl2 × 2H2O, and AgNO3 were dissolved in THF solvent, and these solutions were sonicated for 10 min to homogenize. In a fixed volume of fluorinated 1,3,4-oxadiazole assemblies (2.5 mL THF solution, 1 × 10⁻⁵ mol L−1), a microliter syringe was used to gradually add different quantities of metal ion solutions (0–1500 μL), and then changes in the absorption and emission profiles were examined. Tetrahydrofuran (THF) was chosen as the solvent in this work, because it is an organic solvent in which fluorinated derivatives containing 1,3,4-oxadiazole units are soluble. Other probes used for the detection of Ag+, Co2+, and Cu2+ operating in solvents, such as THF, are presented in the literature [40,41].
For the absorption and fluorescence measurements, we employed an Analytic Jena 210+ spectrophotometer and photoluminescence spectrofluorometer LS55 (Perkin Elmer, Ltd., Waltham, MA, USA), respectively. A 20 kW xenon discharge lamp was used as the light source for the photoluminescence spectrofluorometer. Emission spectra were collected at an excitation wavelength corresponding to the maximum absorption value. All measurements were made at room temperature and recorded using a transparent quartz cuvette (with a 1 cm × 1 cm light path length). Furthermore, the experimental absorption and fluorescence spectral data of BisFOx reported in our previous work [39] were used to calculate the NLO parameters in different solvents.

2.3. Methods of the Evaluation of NLO Properties

For the determination of the first polarizability (αCT), the hyperpolarizability (βCT), and the second hyperpolarizability (γCT), the polarizability ( α CT ) for the BisFOx derivative was calculated using the solvatochromic method, using Equation (1) [42,43]:
α CT = α XX = 2 μ eg 2 E   eg = 2 μ eg 2 λ eg hc = 2 μ eg 2 hc   ν
where ν (cm−1) and μ eg are the wavenumber of the absorption maximum and transition dipole moment, respectively, which is defined by the oscillator strength f, Equation (2): x—the direction of charge transfer:
μ eg 2 = 3 e 2 h 8 π 2 mc × f ν eg = 2.13 × 10 30 × f ν eg
In Equation (2),
  • m = mass of an electron (9.109 × 10⁻²⁸ g);
  • ν e g = absorption frequency (in cm−1);
  • h = Planck’s constant (6.626 × 10⁻²⁷ erg s);
  • c = light velocity in vacuum (2.997 × 1010 cm s−1);
  • e = charge on an electron (4.80 × 10⁻¹⁰ e.s.u.);
  • f = oscillator strength for the charge transfer band (CT) determined using Equation (3).
f = 2303   m   c 2 π N A e 2 ε ( ν ) d ν = 4.39 × 10 9 ε ( ν ) d ν
In Equation (3), the constants “m”, “e”, and “c” are identical to those in Equation (2); NA is the Avogadro’s number (6.32891937 × 10²³ m⋅kg−2·s−1), and ε ( ν ) d ν is the area of the transition band considered, and is calculated using Equation (4):
ε ( ν ) d ν = 1.06 × ε × Δ ν 1 / 2
In Equation (4),
  • ε = molar absorption coefficient (L mol−1·cm−1);
  • Δν1/2 = full frequency width at half the maximum of the absorption band (cm−1).
Hence, as understood according to Equations (2)–(4), μ eg depends on the oscillator strength, f, which can be obtained from the solvatochromic information.
To estimate the values of the first hyperpolarizability (βCT) parameter, we used a theory called “two-level microscopic models” [42], which was expressed by the following relationship (5):
β C T = 3 ν eg 2 μ eg 2 Δ μ C T 2 h 2 c 2 ( ν e g 2 ν L 2 ) ( ν e g 2 4 ν L 2 )
In Equation (5), ν eg = frequency of the reference incident radiation at which the βCT value would be mentioned:
  • h and c = similar constants as in Equation (2);
  • Δ μ C T = ( μ e μ g ) 2 = the transition dipole moment (the difference between the ground and excited states). Assuming ν L = 0 (no excitation), then Equation (5) transforms into:
    β x x x = β C T = 3 μ eg 2 Δ μ C T 2 ( E max ) 2
In Equation (6), Emax = energy at the charge transfer absorption, which is calculated using the expression Emax = hc/λmax = hcν.
Second-order hyperpolarizability ( γ C T ) was calculated with the solvatochromic data using a three-level model [43,44,45,46], with the following Equation (7):
γ C T = 1 E eg 3 μ eg 2 ( Δ μ 2 Δ μ eg 2 )
Furthermore, to evaluate the dipole moment differences (Δµ = μ e μ g ) of the BisFOx sample, we assumed that its environmental sensitivity is described by the Lippert–Mataga model (Equation (8)) [47]:
ν max abs ν max e m = m f L M ( ε , n ) + c o n s tan t
f L M ( ε , n ) = ε 1 ε + 2 n 2 1 n 2 + 2
Thus, Equation (8) can be rewritten as the following:
  ν max abs ν max e m = 2 Δ f L M hc a 3 ( μ e μ g ) 2 + c o n s tan t
In Equation (10), ν max abs ν max em = solvatochromic shift (cm−1) is the difference between the fluorescence and absorption bands; ε = the relative permittivity (Table 1); n = the refractive indexes that were taken from [48] (Table 1); μ g , μ e = the dipole moments of the ground state and excited states; ( μ e μ g ) 2 = the transition dipole moment, which is proportional to the slope of the Lippert–Mataga plot (Figure 2); h and c are the same as those defined in Equation (2), and “a” is the solvent cavity (Onsager) radius (its calculation is given in Supplementary Material (Equations (S1)–(S5) and Table S1)).
Using the slope of the linear part of the ν max a b s ν max em vs. f ( ε ) f ( n 2 ) plot (Figure 2), we have calculated the dipole moment differences for the BisFOx sample and found it to be 6.54 D.

2.4. Generalized Mulliken–Hush Method (GMH) for the Study of ICT Characteristics

The intramolecular charge transfer (ICT) features of the BisFOx sample were studied using a generalized GMH analysis based on the charge transfer band values from the absorption spectra, and using Equations (11)–(13) [49]:
C b 2 = 1 2 ( 1 Δ μ g e 2 Δ μ g e 2 + 4 μ g e 2 )
H D A = μ g e Δ E g e Δ μ a b = μ g e Δ E g e Δ μ g e 2 + 4 μ g e 2
R DA = 2.06 × 10 2 Δ E ge ε max Δ ν 1 / 2 H DA
In Equations (11)–(13),
  • C b 2 = the electronic delocalization degree;
  • H D A = the electronic coupling matrix (strength of electronic coupling between the ground (S0) and the charge transfer excited states (S1));
  • R D A = the donor acceptor separation;
  • Δ E g e = the vertical excitation energy;
  • Δ μ g e 2 = the transition dipole moments;
  • εmax = the molar extinction coefficient at maximum absorption (M−1·cm−1);
  • Δ ν 1 / 2 = the width of the band at A = Amax/2 (cm−1).

3. Results and Discussion

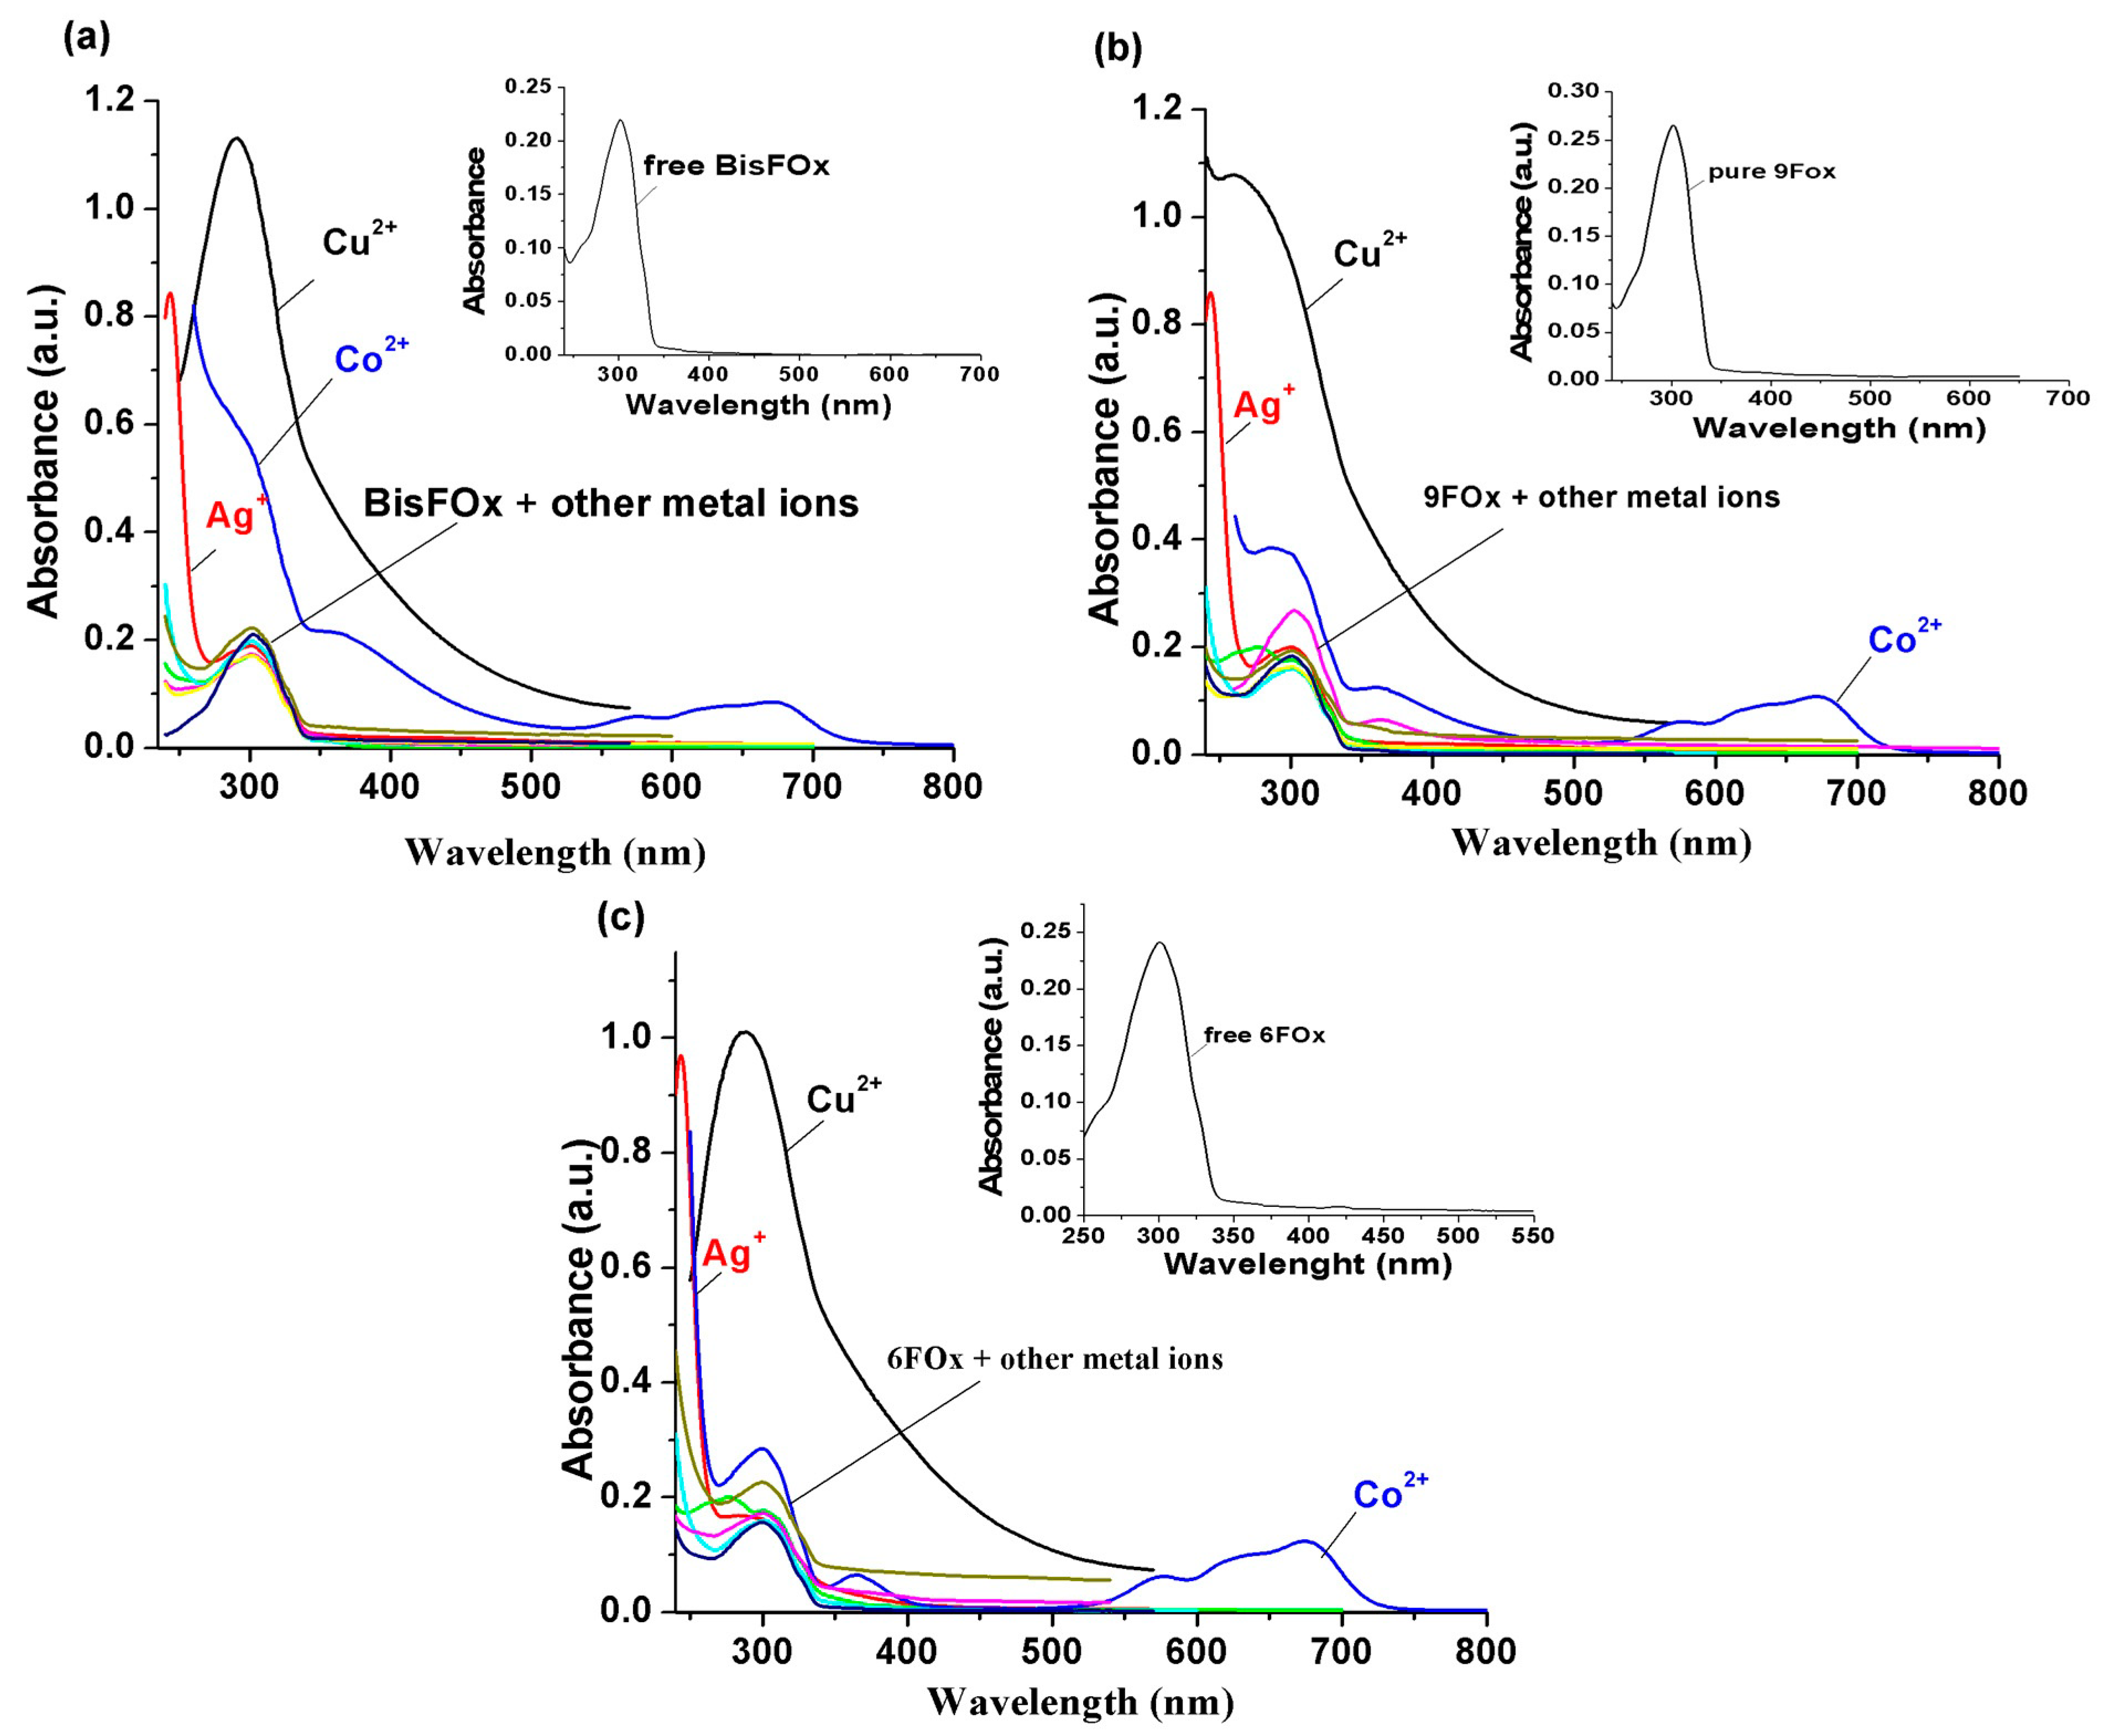
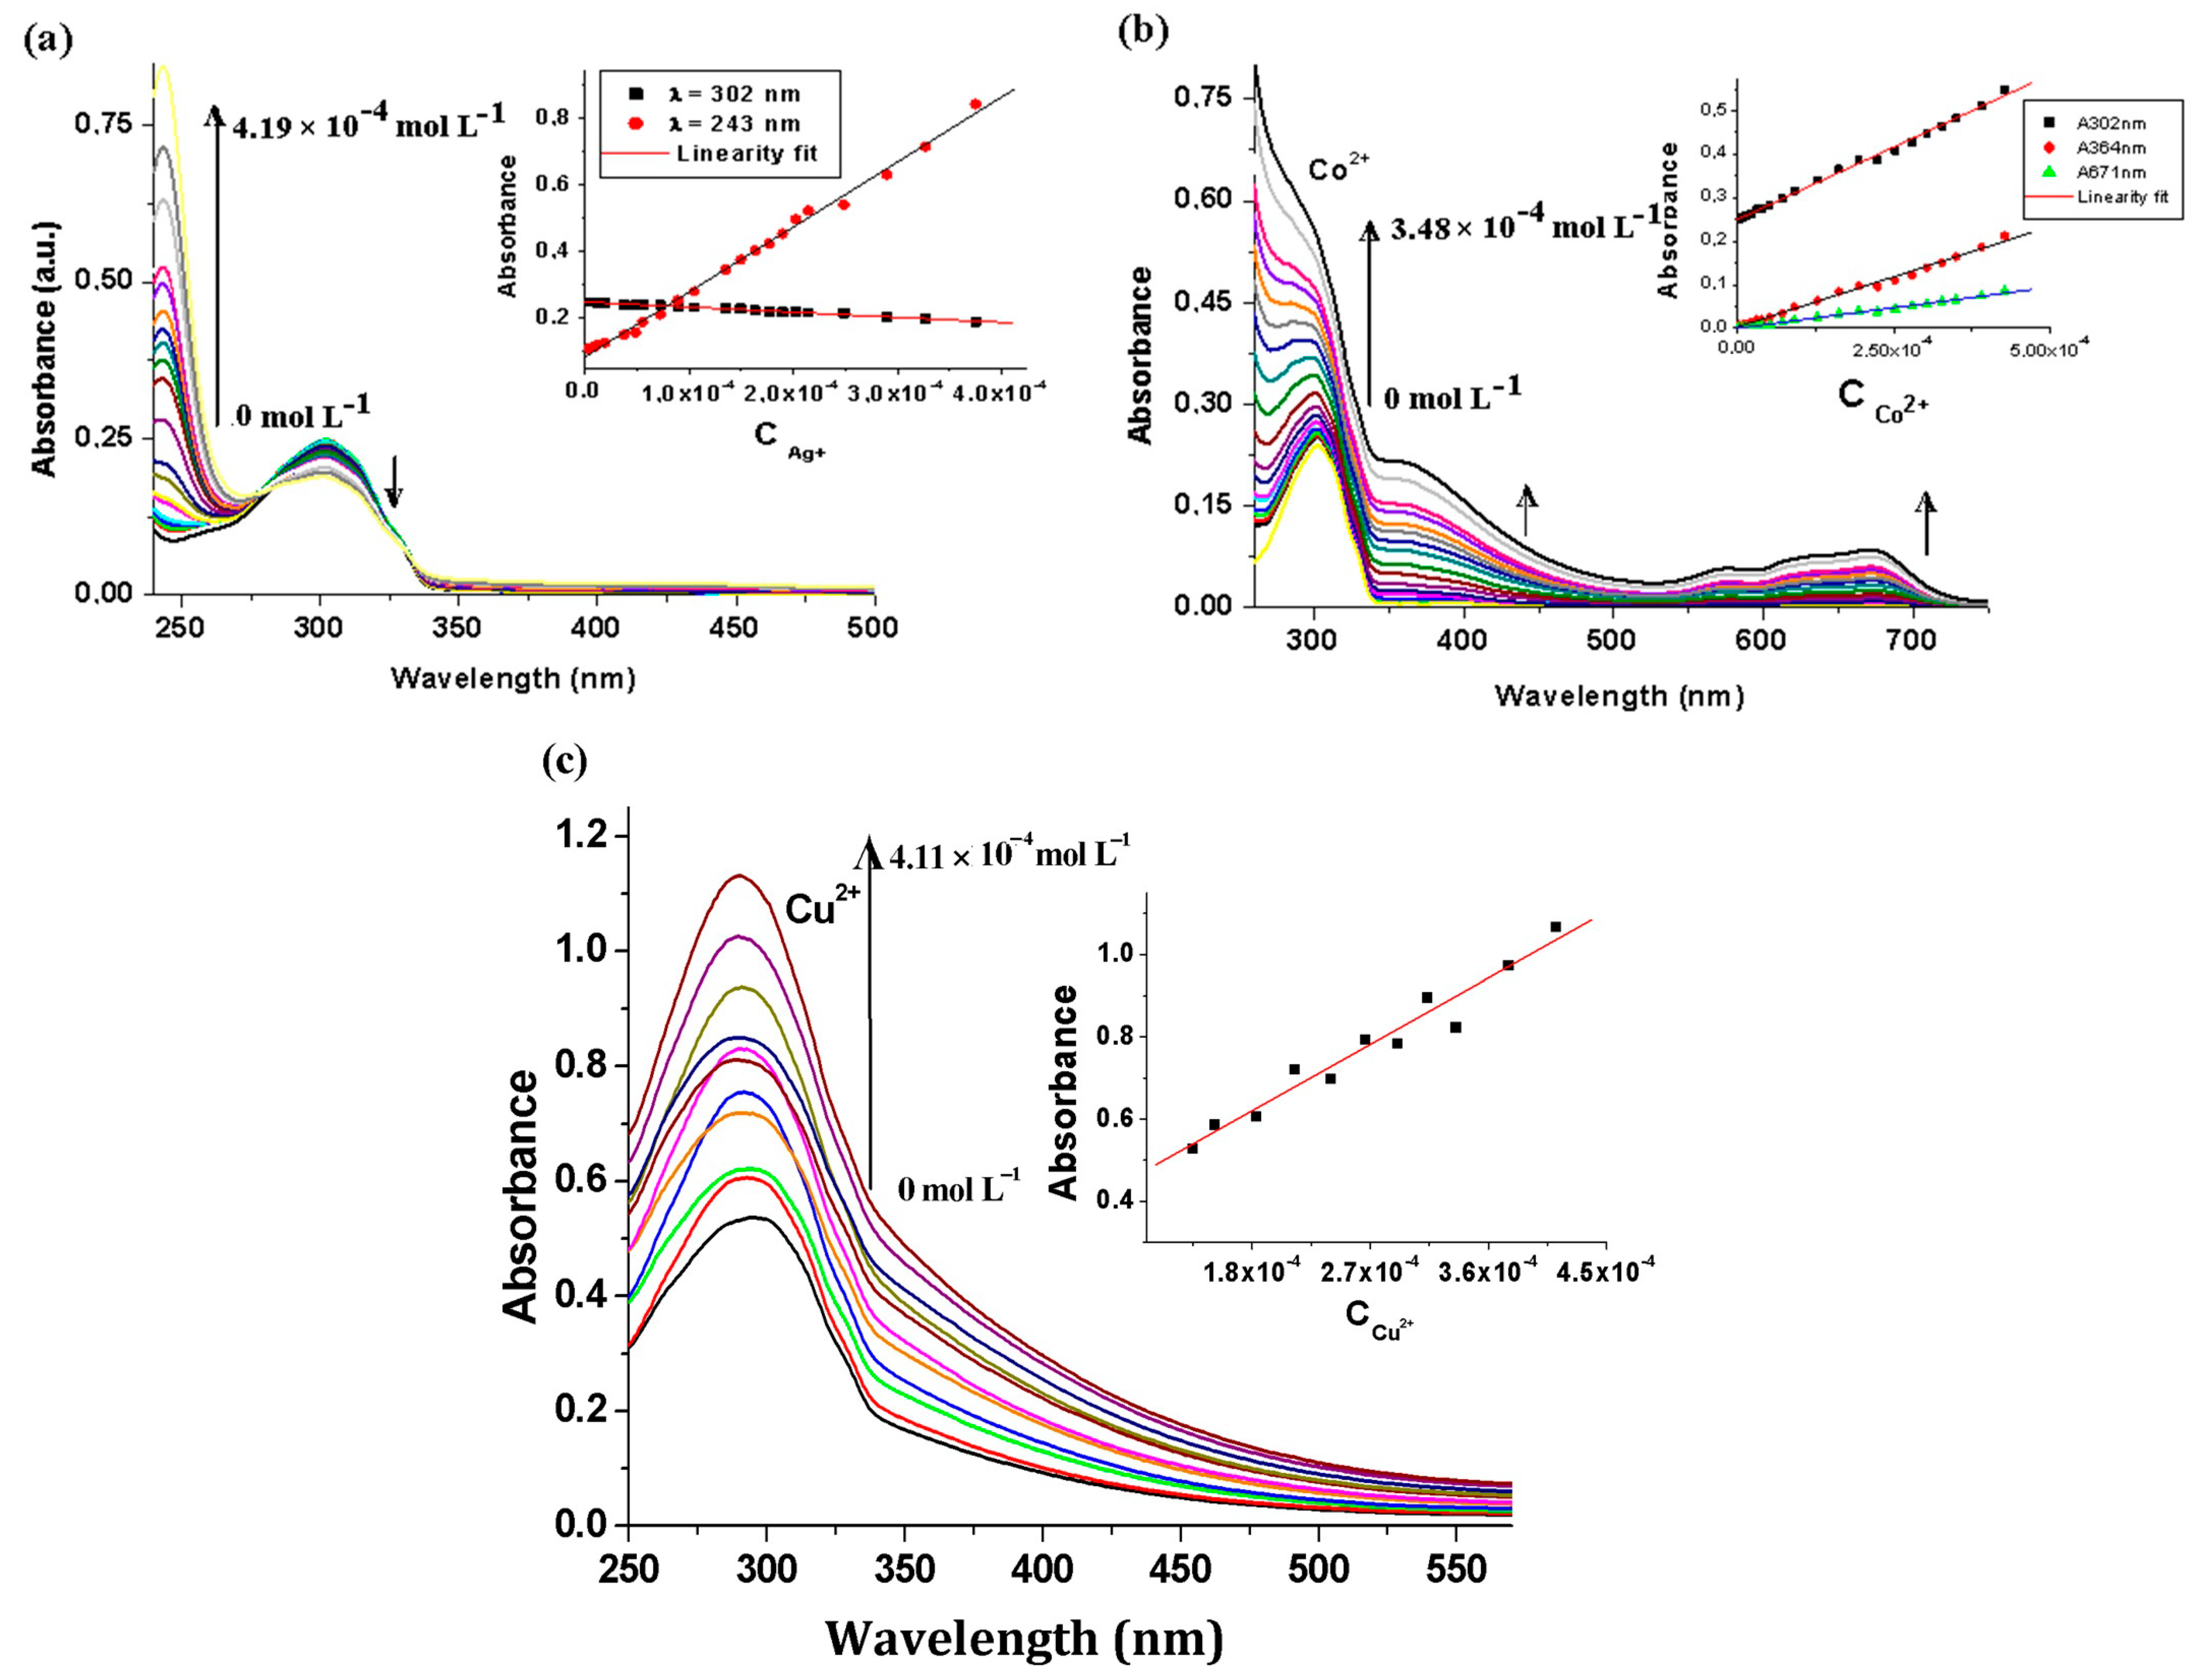
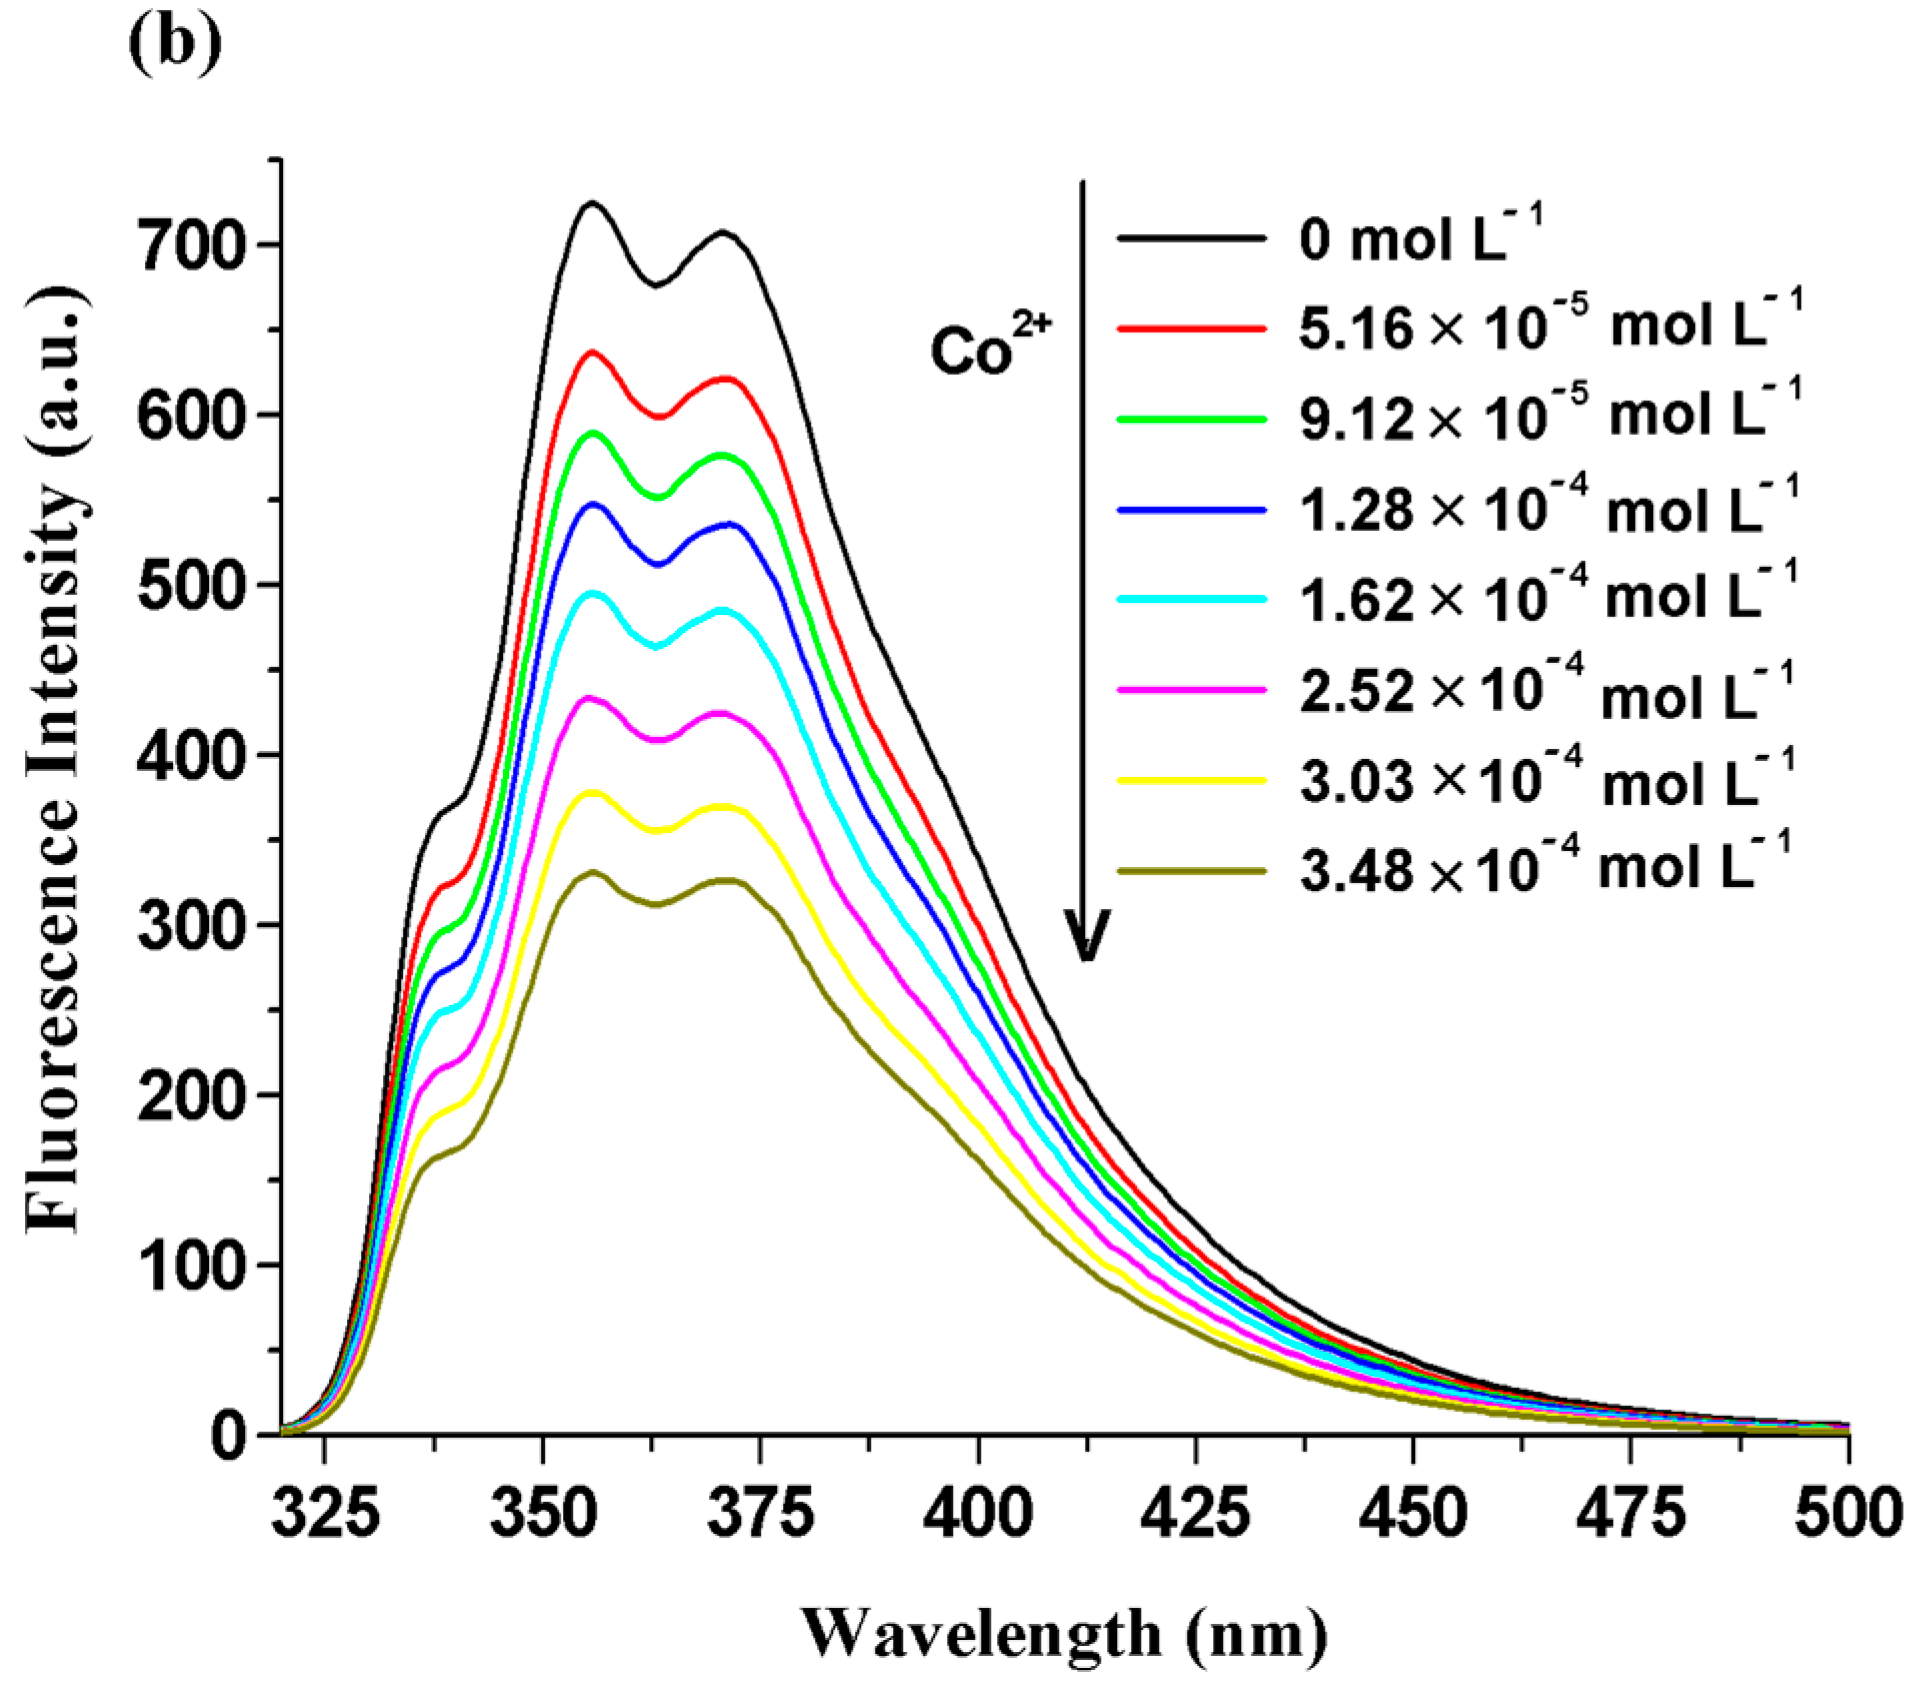
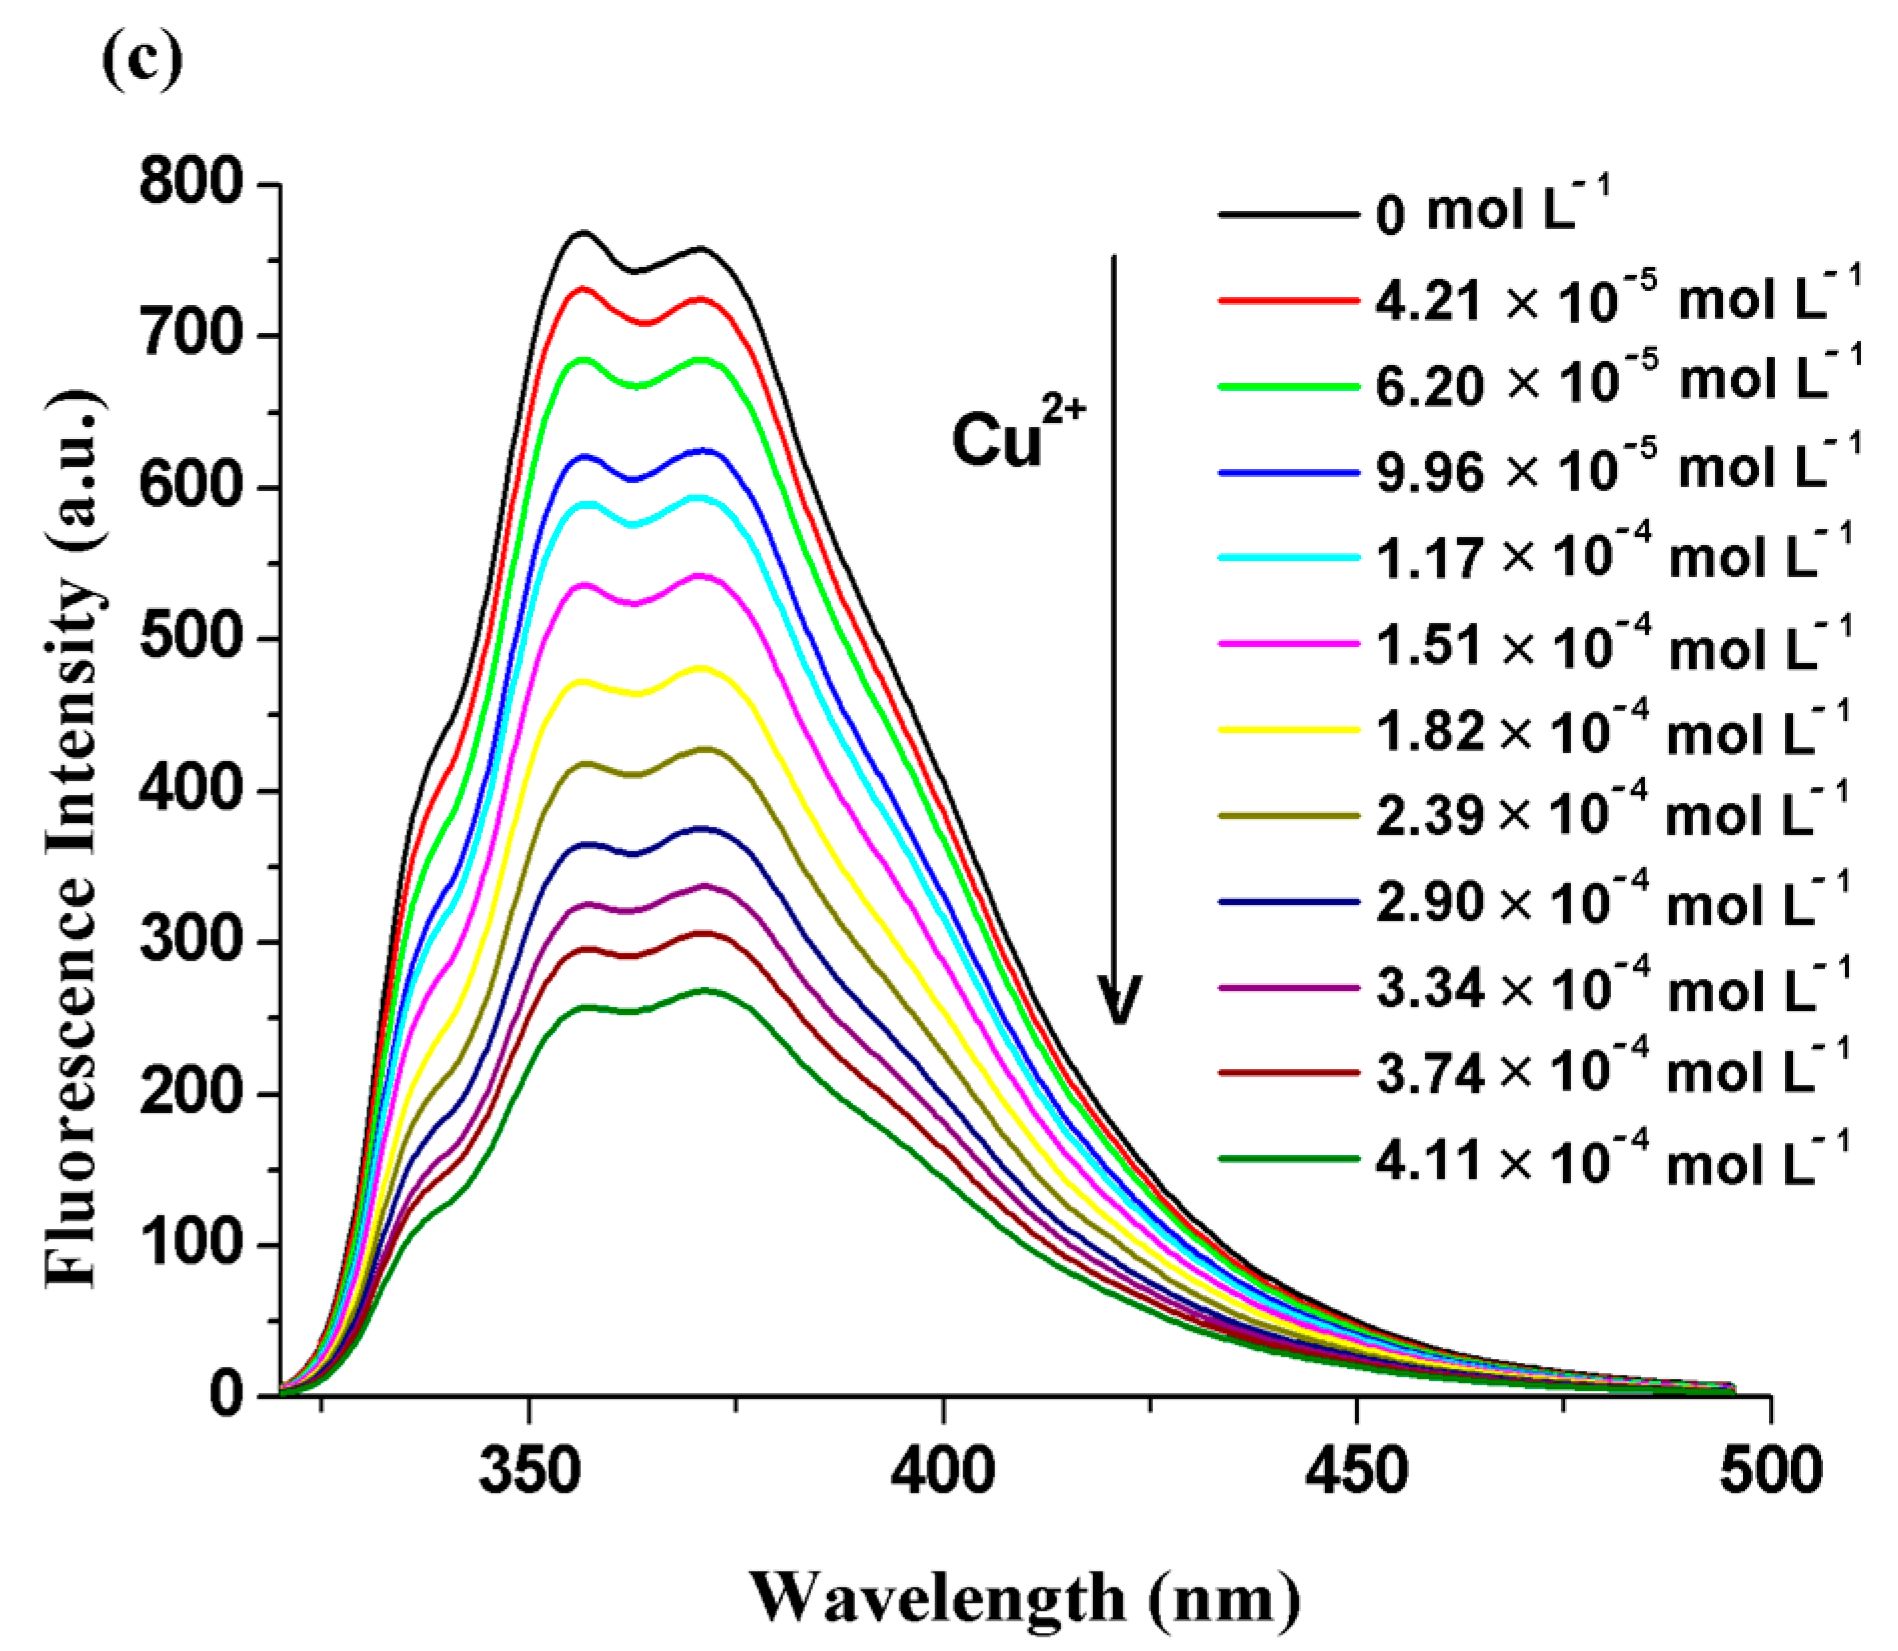
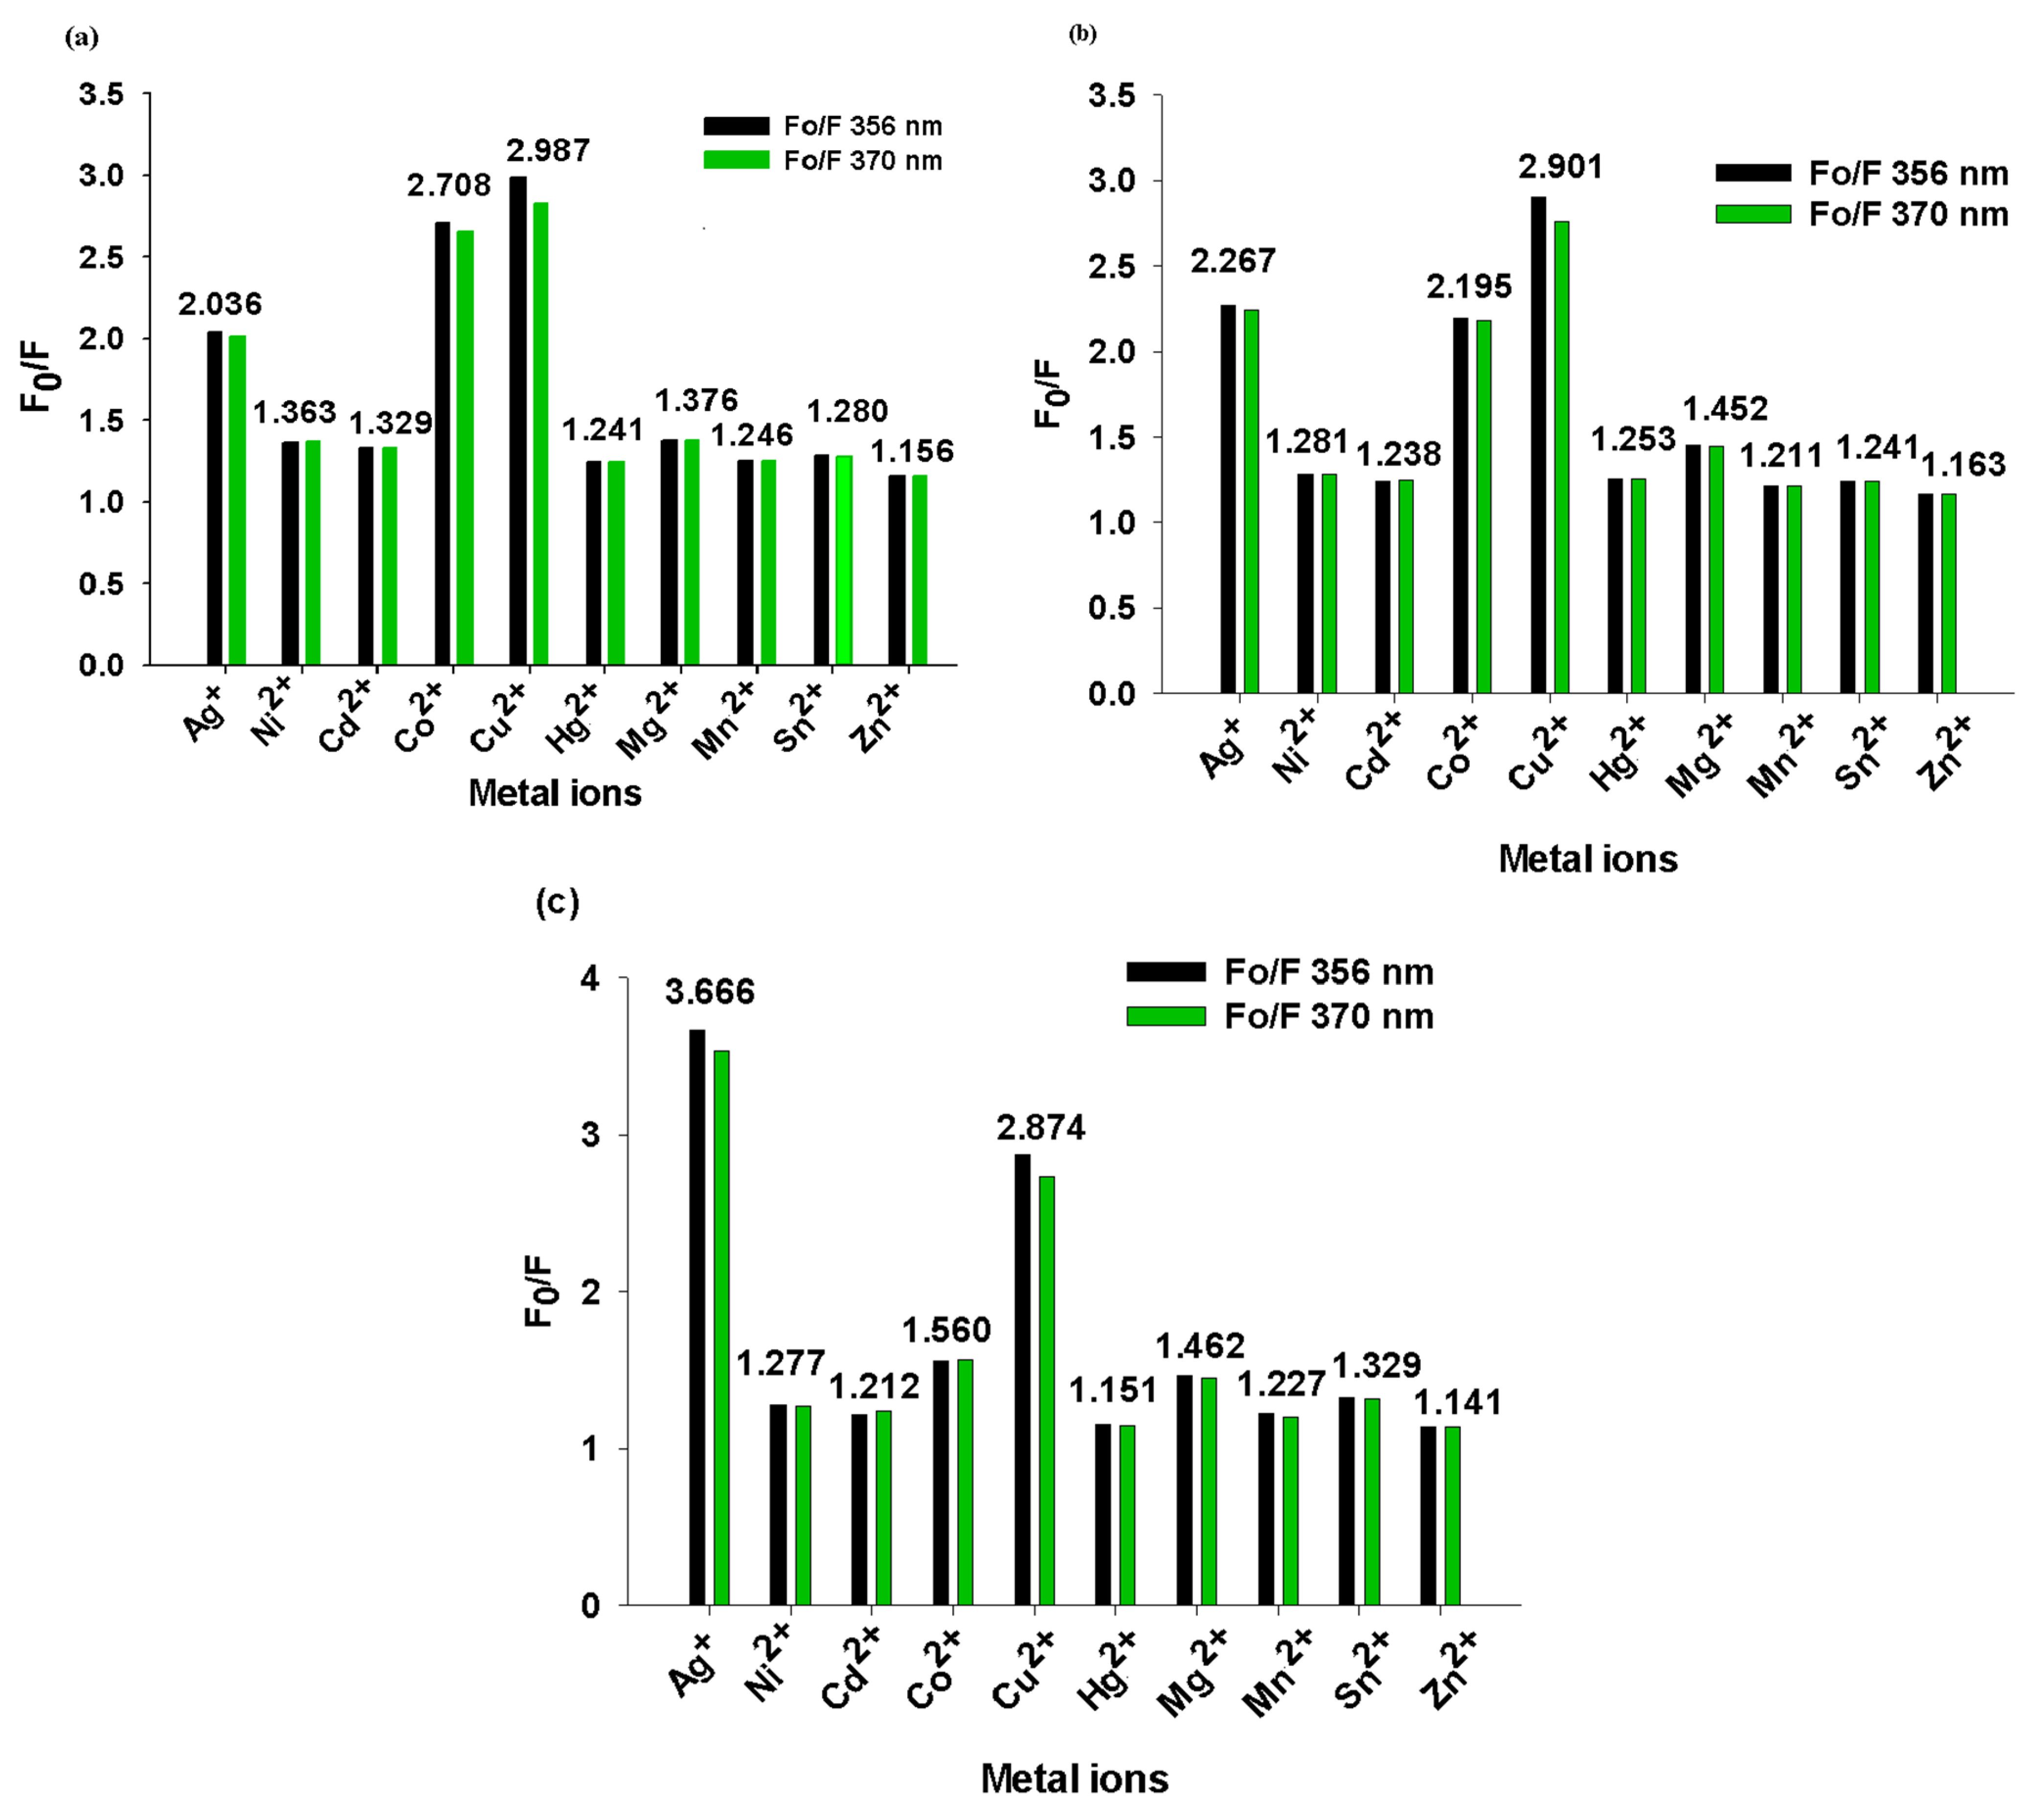
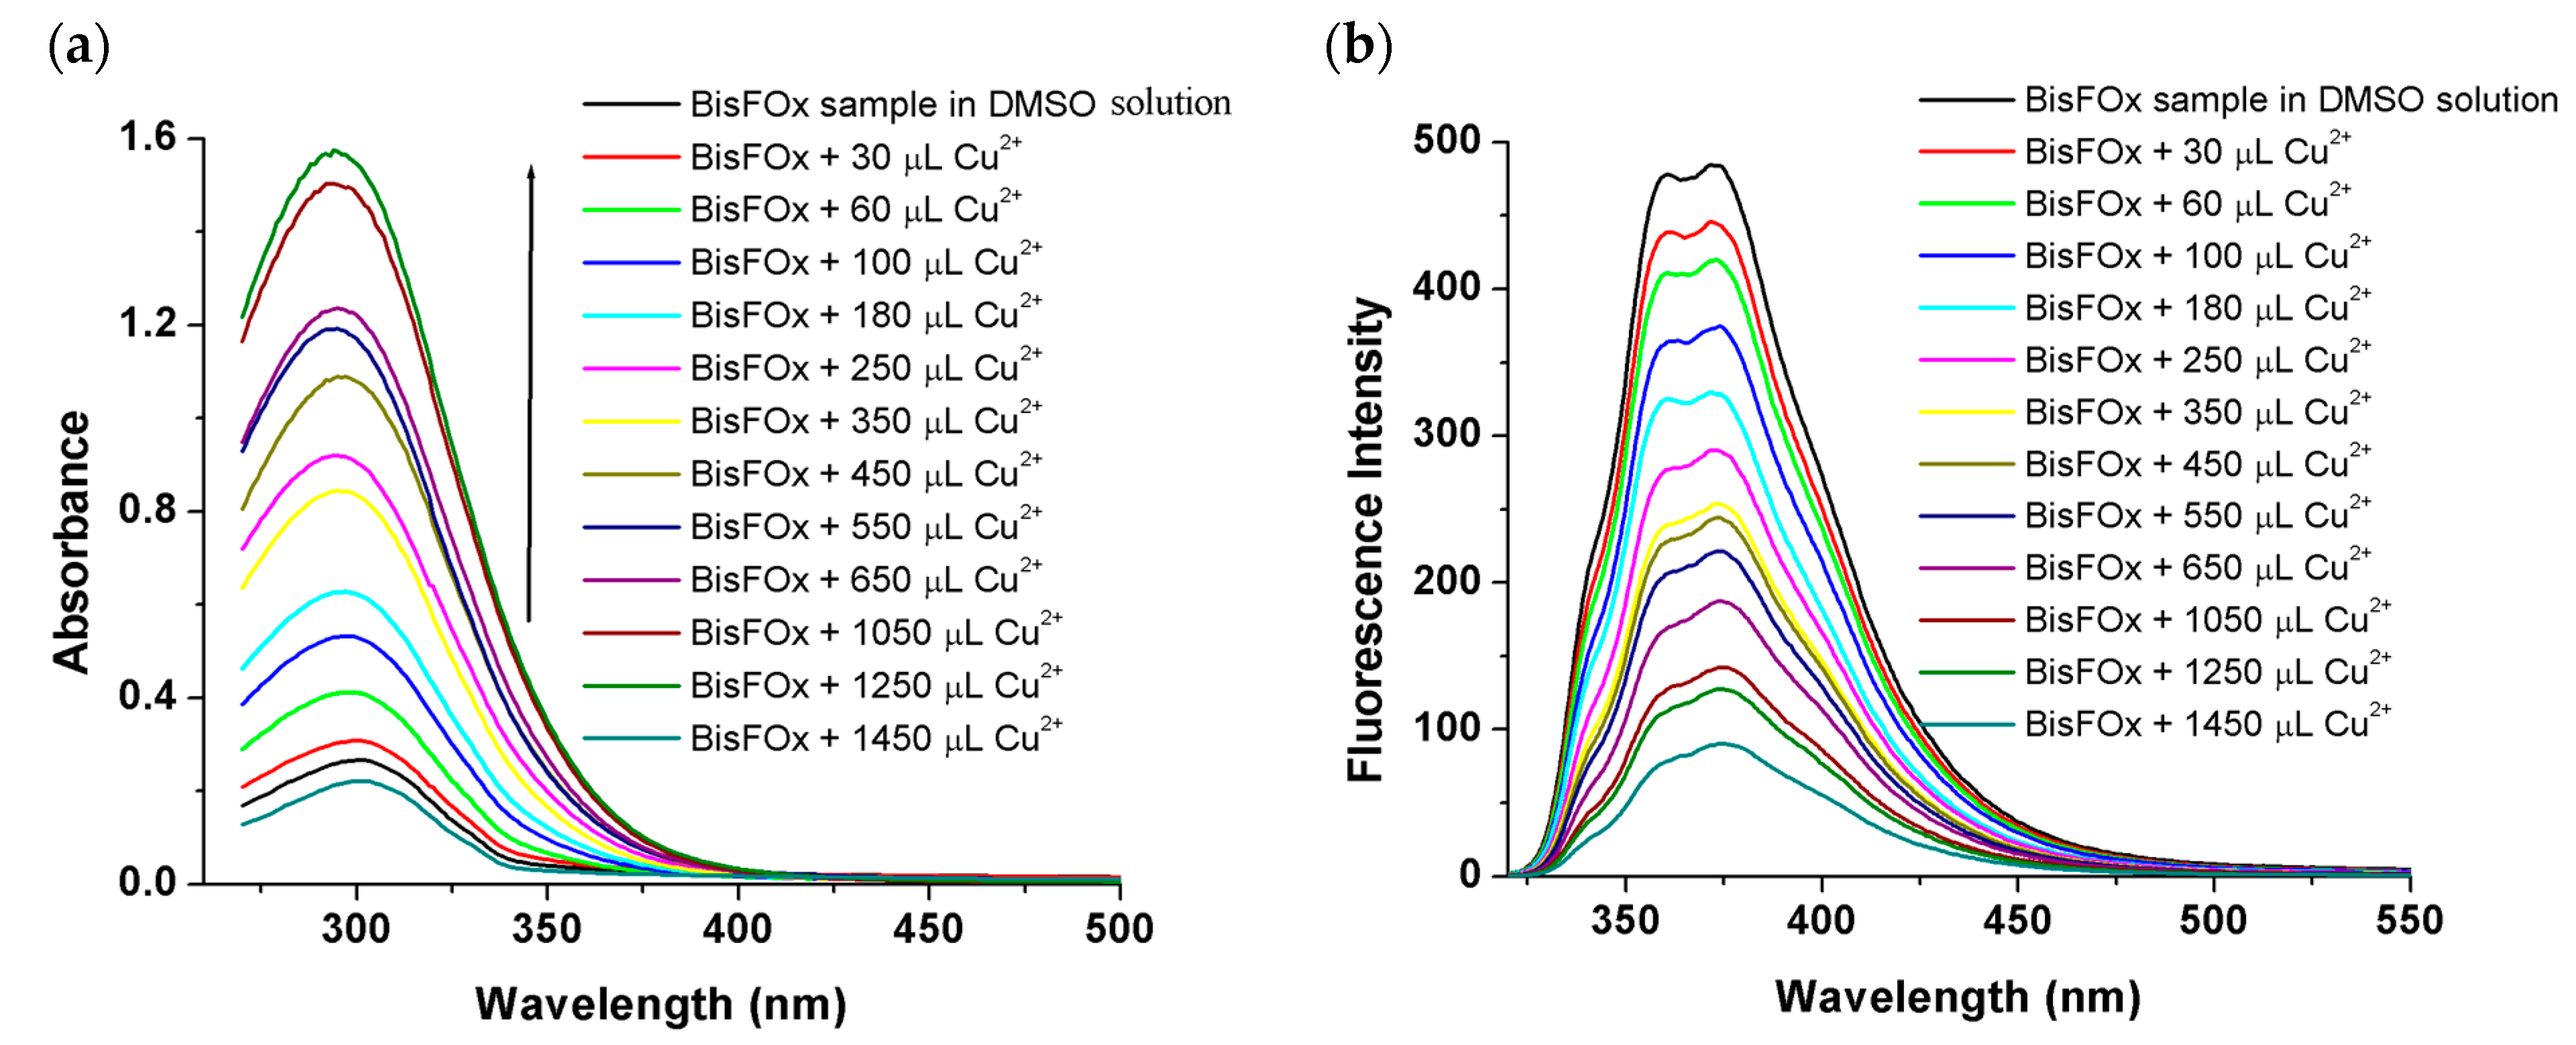
3.1. Recognition of Metal Ions by Fluorinated 1,3,4-Oxadiazole Derivatives

Interactions of the BisFOx, 9FOx, and 6FOx derivatives with various metal ions in tetrahydrofuran solutions were investigated on the basis of modifications in the optical spectra caused by increasing concentrations of these metal ions. Figure 3a shows the modifications in the absorption spectra of the BisFOx sample alone and when 1500 µL of each of the selected metal cations (Mn+ = Mg2+, Mn2+, Ni2+, Cd2+, Zn2+, Co2+, Cu2+, Hg2+, Sn2+, and Ag+) has been added. Pure BisFOx sample in the THF solvent showed a strong absorption band located between 270 and 310 nm (having λ max abs at 302 nm) that was assigned to the π-π* transitions of the 1,3,4-oxadiazole ring. From Figure 3a, it is obvious that after additions of the Ag+, Co2+, and Cu2+ ions, important variations were detected in the absorption spectra. Instead, there were no remarkable responses to the other metals tested. Similar behaviors were observed for the samples 9FOx (Figure 3b) and 6FOx (Figure 3c), with the mention that the absorption bands at 300 and 366 nm, in the case of sample 6FOx, which appeared after the addition of 1500 µL Co2+, was much better structured than those that appeared for the BisOx and 9FOx samples.
Absorption titration spectra of the sample BisFOx in THF solution (Figure 3a), upon the gradual addition of Ag+ ions, showed that the absorption band intensity (at 302 nm) was reduced linearly and a new absorption band appeared at 244 nm, whose intensity progressively increased with Ag+ concentration.
Additionally, notable modifications in the absorption spectral profile were observed when Co2+ ions (0–1500 μL) were added to the solution of the BisFOx sample; i.e., the intensity at λ max abs = 302 nm gradually increased, accompanied by the appearance of a new band (550–700 nm) with λmax at 674 nm and a weak shoulder at 570 nm (Figure 4b), the intensity of which increased with an increasing concentration of Co2+ ions. Moreover, this new absorption band was probably due to BisFOx-to-metal charge-transfer (LMCT), rather than Co-based d–d transitions [50]. Instead, as shown in Figure 4b, the absorption band intensified (even for the whole spectrum) when the BisFOx sample was titrated with Co2+ ions (the opposite trend was observed after titration with Ag+). This behavior could be the result of electronic changes as a result of the creation of coordination bonds and/or deprotonation. Table 2 summarizes the changes in the absorption and fluorescence spectra of the BisFOx and 9FOx samples after titrations with 1500 µL of different metal ions (also shown in Figure 3).
After the addition of copper ions, alongside the enhancement of absorption ( λ max a b s = 302 nm), a slight bathochromic shift of the band from 290 nm was detected (Figure 4c). A similar behavior of the 9FOx derivative occurred when incremental quantities of Ag+, Co2+, and Cu2+ ions were added. From the plots of absorbance versus concentrations of Ag+, Co2+, and Cu2+ ions (insets in Figure 4a–c), we can observe a linear relation between the absorbance and the concentrations of these ions. For all spectral changes caused by Ag+, Co2+, and Cu2+ ions in the fluorinated 1,3,4-oxadiazole derivatives BisFOx, 9FOx, and 6FOx solutions, the linear regression equations and the corresponding data are listed in Table 3.
Quantitatively, the sensitivity of each fluorinated 1,3,4-oxadiazole derivative was evaluated using the values of the detection limits (LODs). The calculated values of LODs were obtained to be in the range 10−7–10−8 M (Table 3). A better LOD, such as 8.533 × 10⁻⁶ M of Cu2+ ions, was obtained using the interactions of Cu2+ with the 9FOx derivative. Moreover, these LOD values were compared with other different values for various molecular structures containing 1,3,4-oxadiazole from the literature, and these are shown in Table 3. We observe that the LOD values of the BisFOx were quite close in value to those of the 1,3,4-oxadiazole-containing compounds reported in Ref. [51] for detecting Cu2+, as listed in Table 4. The absorption spectral patterns of 9FOx and 6FOx were almost similarly affected by titration with Ag+, Co2+, and Cu2+ cations, except for the 6FOx sample, upon titration with copper ions, when the absorption bands were better structured (Figures S1 and S2, from the Supplementary Material).
Furthermore, the sensing abilities of the BisFOx and 9FOx derivatives for Mg2+, Mn2+, Ni2+, Cd2+, Zn2+, Co2+, Cu2+, Hg2+, Sn2+, and Ag+ ions, in THF solution were evaluated using their fluorescence spectra. The intensity of the emission bands (at 356 and 370 nm) were moderately quenched (FIQ—fluorescence intensity quenching) along with an increasing concentration of Ni2+, Cd2+, Hg2+, Mn2+, Sn2+, and Zn2+, but remarkable changes were recorded after gradually adding Ag+, Co2+, and Cu2+ ions (see the values for F0/F, from Table 2 and Figure 5). The spectral variations observed in the fluorescence spectra of the BisFOx sample, upon the addition of incremental amounts of Ag+, Co2+, and Cu2+ cations, are illustrated in Figure 5a–c. Similarly, the fluorescence intensities at 356 and 370 nm were reduced to the same extent for the 9FOx and 6FOx systems, in the presence of incremental amounts of Ag+, Co2+, and Cu2+ ions, as for the sample BisFOx (see Figures S3 and S4, from the Supplementary Material).
The quenching extent (efficacy) of the systems under study was calculated using the following relation (QE% = (F0 − F)/F0 × 100%) when 1500 µL of metal ions were introduced into the investigated solutions and various values were found for the different metal ions (Table 5). The fluorescence intensity was quenched to close to half of its initial value in the presence of Ag+, Co2+, and Cu2+ ions. The effect of cobalt ions was smaller (especially for the 6FOx sample (35%)) than that of the copper and silver ions (Table 5). The 6FOx derivative displayed a strong fluorescence reduction upon the addition of Ag+ ions (72%). The observed differences in the quenching effects of the metal ions may be due to the different values of electronegativity and the ionic radii of these metal ions [54,55].
Moreover, the variations in the values of A0/A and F0/F, calculated at ~302 and 356 nm for the BisFOx and 9FOx samples, upon adding 1500 µL of the selected ions, have been listed in Table 2. The fluorescence quenching extent of the BisFOx and 9FOx derivatives is variable for these metal ions (Table 2 and Table 5, Figure 6). 9FOx responds slightly better toward selected metal ions compared to the BisFOx sample. For example, the emission intensities are more highly quenched by Co2+ and Cu2+ ions, while the quenching extent by Ag+ is slightly lower (Table 5 and Figure 6). Additionally, the fluorescence responses of the samples BisFOx and 9FOx to different metal ions are depicted at the two wavelengths (356 and 370 nm) in the bar diagrams (Figure 6). Herein, it was found that for the Co2+ and Cu2+ ions only, the array of the two wavelengths could generate a distinct pattern response; namely, the F0/F values were higher at 356 nm than at 370 nm, except for compound 9FOx in the presence of copper ions. The maximum FIQ value is found in the presence of the Cu2+ ions.
Moreover, in dimethyl sulfoxide (DMSO) solvent, which is considered to be a green solvent, we tested the sensing ability of the BisFOx sample to detect Cu2+ ions, and a similar form of behavior to that in THF was observed (Figure 7).

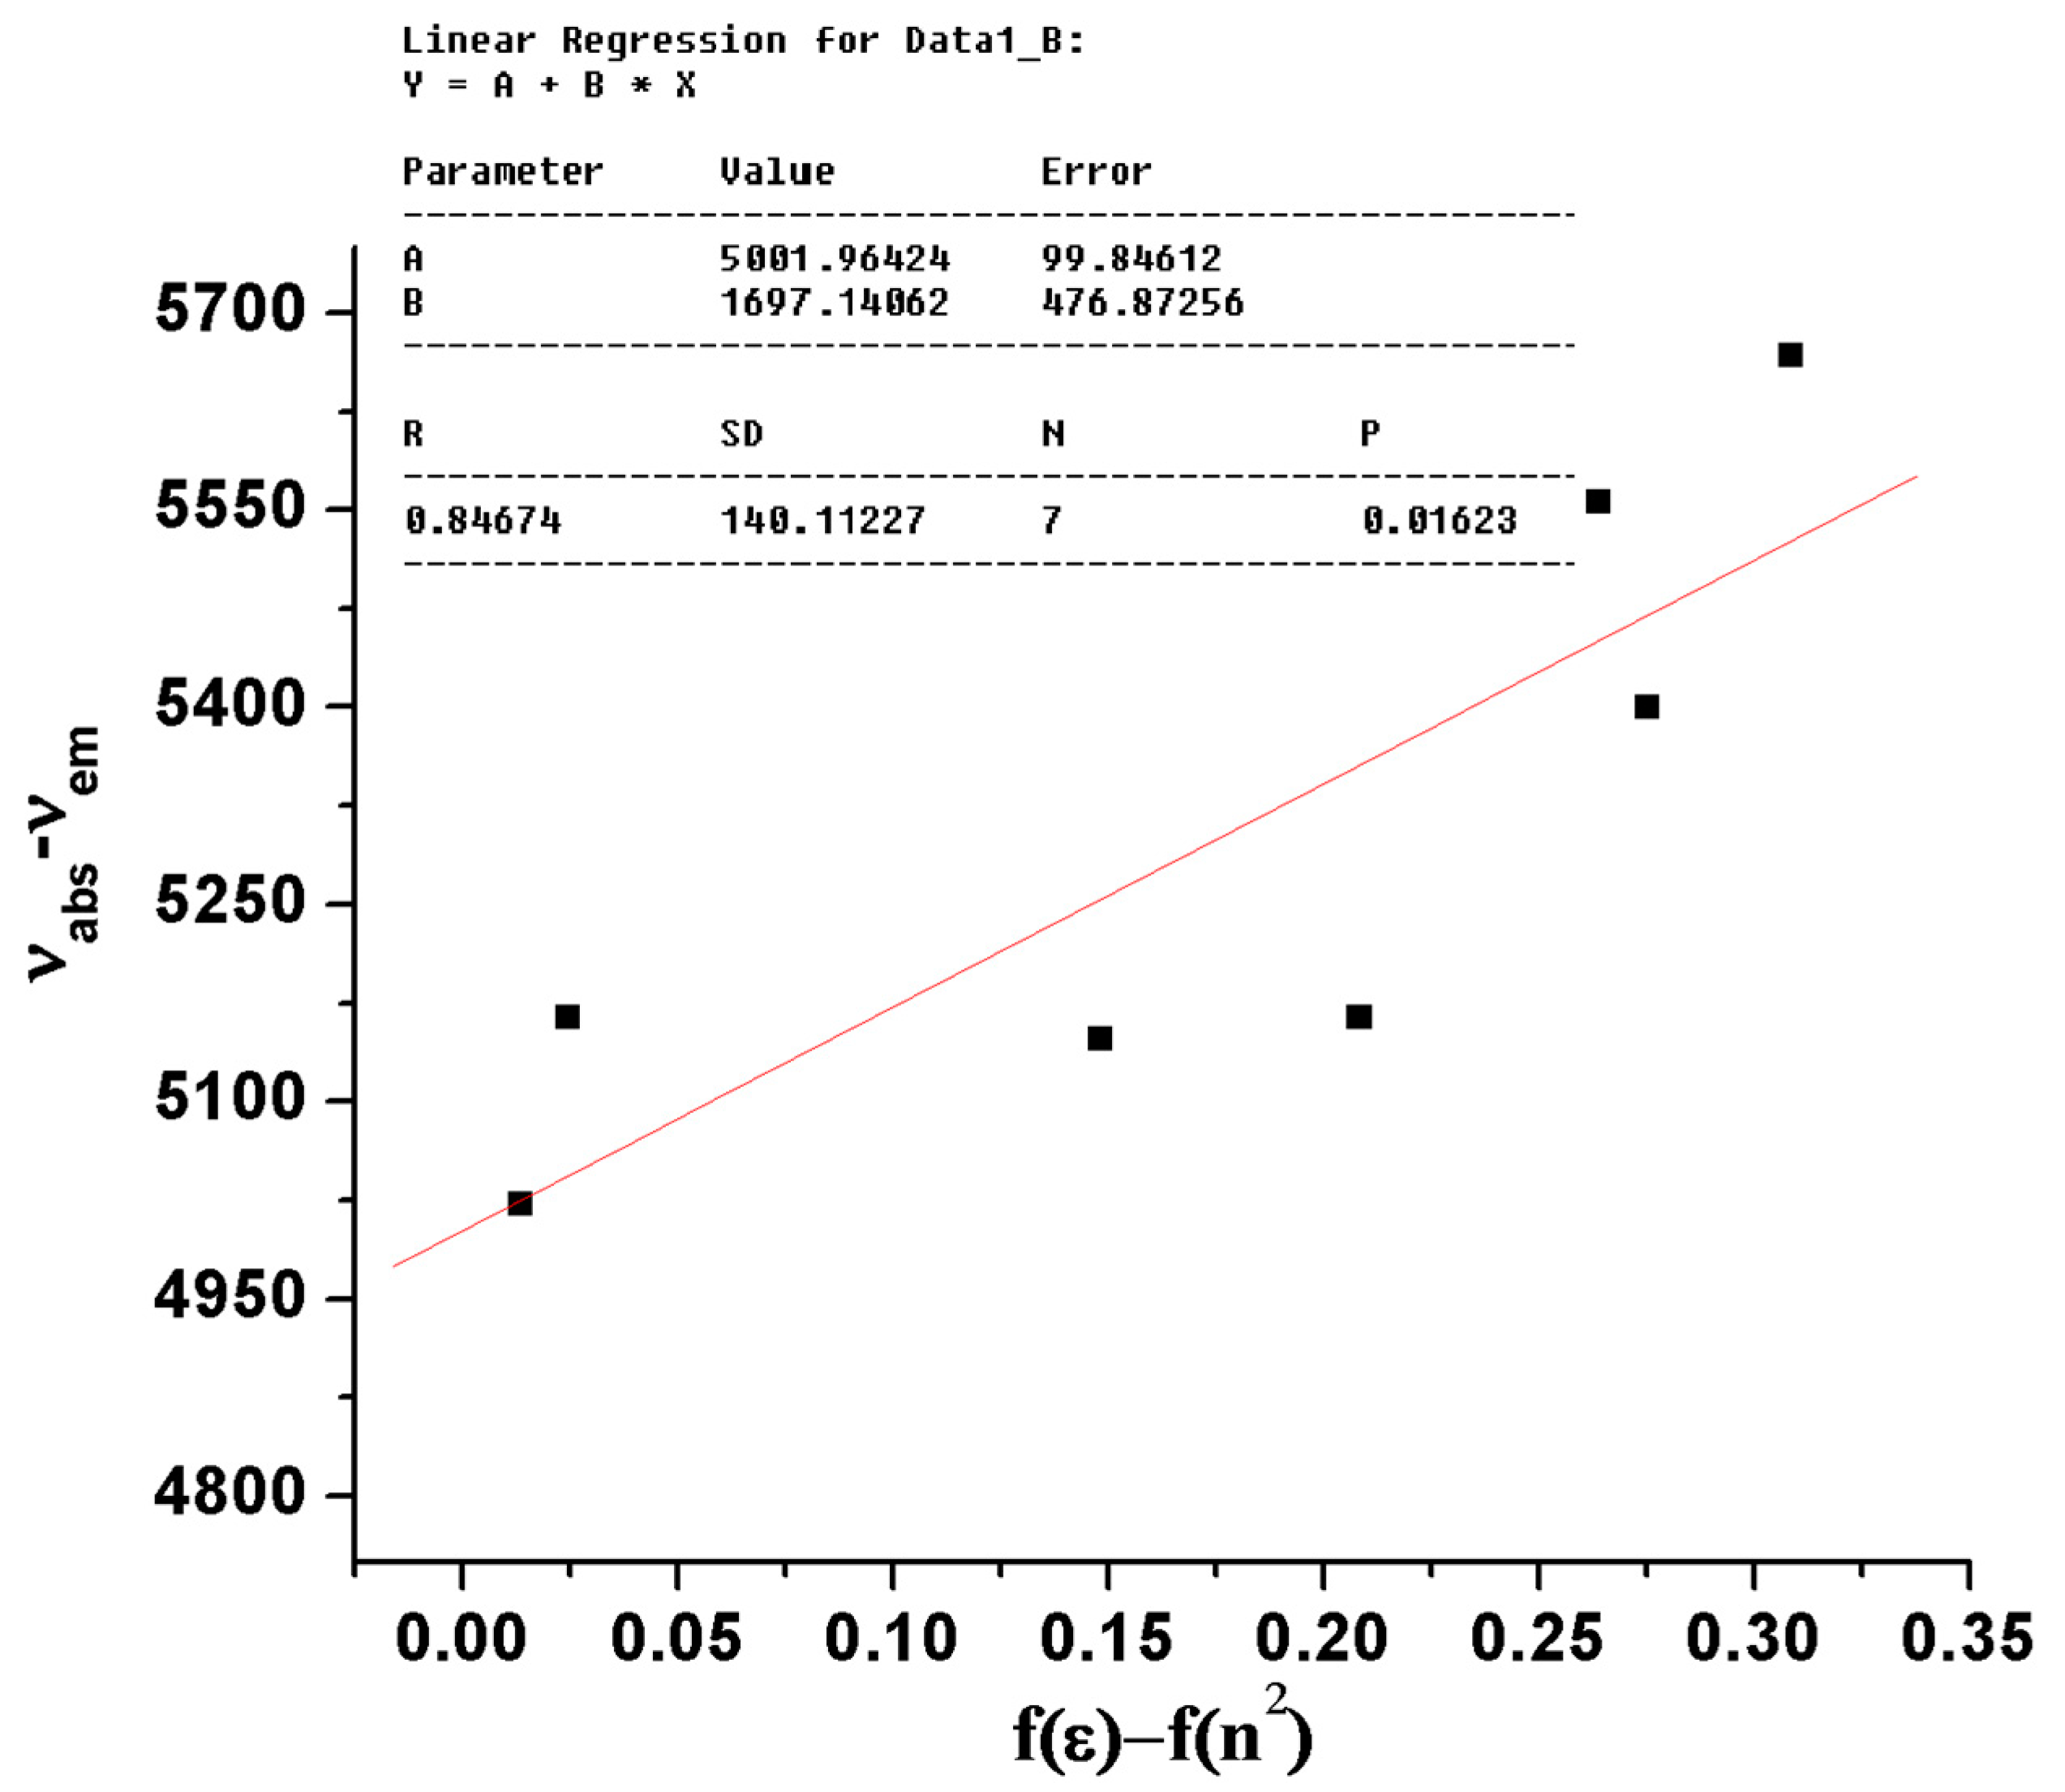
3.2. Nonlinear Optical Properties (NLO) Using the Solvatochromic-Based Approach

NLO properties of the fluorinated BisFOx derivative were investigated via the solvatochromic-based approach. In our previous studies [39,56], we reported the absorption and emission spectral data of the BisFOx derivative in solvents with various polarities. These data have been used in this paper to evaluate solvatochromic-dependent properties, including μCT, μ eg 2 , and oscillator strength (f), which are required to determine the NLO parameters (αCT, βCT, and γCT).
Detailed equations [57,58] used for calculations of Δ μ C T and a (the Onsager interaction radius of solute molecules) are given in the Materials (Section 2.1) and Methods and Supplementary Materials Sections. The obtained values for these spectroscopic physical parameters are listed in Table 6 and have been further used for the calculation of the α, β, and γ parameters (presented below).
The calculated values for the NLO parameters (αCT, βCT, and γCT) of the BisFOx compound are shown in Table 6. The highest values were found for the αCT and βCT parameters (0.128 × 10⁻²³ and 9.525 × 10⁻³² e.s.u., respectively) in dioxane (DIO) media. Additionally, a rather high value was obtained for the βCT parameter in DMF (8.46 × 10⁻³² e.s.u.) solution. Instead, the lowest βCT for BisFOx is found in the DMSO solution, which may be due to the influence of its viscosity (resistance to the twisting of molecules) and polarity on its electronic structure and its NLO properties [59]. Moreover, for the γCT-NLO parameter of the analyzed fluorinated derivative, the highest value of 0.58 × 10⁻³⁴ e.s.u. was observed in the DMSO solution, while the lowest value of 0.03 × 10⁻³⁴ e.s.u. was obtained in the CH3OH medium. Changes in NLO parameters as a function of solvent may be due to the properties of the microenvironment (the viscosity and polarity of DMSO) affecting the structural changes of the BisFOx molecules.
Table 6 lists the obtained values of the ICT-intramolecular charge transfer characteristics for BisFOx in selected solvents. Generally, when the C b 2 values are close to zero, this indicates a total delocalization of charges, and when C b 2 equals 1, this suggests a total localization of the charge in the system [60]. The electronic delocalization degree of the BisFOx derivative in all of the selected media tends strongly towards zero, indicating a maximum delocalization of the charge of this fluorinated 1,3,4-oxadiazole derivative. The electronic coupling matrix (HDA) defines the charge transfer rate of the D-π-A structures and differs contrariwise with the RDA values. For the BisFOx sample, the lowest values of the electronic coupling matrix were found in methanol, while the highest values were found in the DMSO medium (Table 6). Instead, the lowest values of the separation acceptor donor parameter were found in methanol.

4. Conclusions

In summary, the ability of some fluorinated 1,3,4-oxadiazole derivatives to recognize metal ions was investigated by monitoring changes in the absorption and fluorescence spectral patterns of these compounds. Our derivatives were found to be particularly sensitive to silver, cobalt, and copper ions. Finally, the NLO responses and intermolecular charge transfer (ICT) characteristics for the BisFOx derivative were evaluated via the solvatochromic method. The investigated fluorinated 1,3,4-oxadiazole derivatives exhibited good NLO parameters and ICT characteristics in selected solvents, and it was observed that the environment affects the properties of the studied compounds.

Supplementary Materials

The following supporting information can be downloaded at: https://0-www-mdpi-com.brum.beds.ac.uk/article/10.3390/chemosensors10050183/s1, 1H NMR data. Figure S1: Absorption spectral changes during the titration of the 9FOx sample (c = 1 × 10⁻⁵ mol L−1) with incremental amounts of Ag+ (a), Co2+ (b), and Cu2+ (c) cations; Figure S2: Absorption spectral changes during the titration of the 6FOx sample (c = 1 × 10⁻⁵ mol L−1) with incremental amounts of Ag+ (a), Co2+ (b), and Cu2+ (c) cations; Figure S3: Fluorescence spectral changes during the titration of the 9FOx sample (c = 1 × 10⁻⁵ mol L−1) with incremental amounts of Ag+ (a), Co2+ (b), and Cu2+ (c) cations; Figure S4: Fluorescence spectral changes during the titration of the 6FOx sample (c = 1 × 10⁻⁵ mol L−1) with incremental amounts of Ag+ (a), Co2+ (b), and Cu2+ (c) cations; Table S1: Values of the atomic simple connectivity indices, δ and valence connectivity indices δ v used for calculating zero- and first-order connectivity indices; Equations (S1)–(S5): used in calculating the Onsager cavity radius (a) for the BisFOx derivative.

Author Contributions

Conceptualization, M.H.; methodology, M.H. and A.A.; validation, C.H.; formal analysis, A.A.; investigation, A.M.I.; writing, M.H., A.M.I. and C.H. All authors have read and agreed to the published version of the manuscript.

Funding

This research received no external funding.

Institutional Review Board Statement

Not applicable.

Informed Consent Statement

Not applicable.

Data Availability Statement

Not applicable.

Acknowledgments

This work was supported by a grant of the Ministry of Research, Innovation and Digitization, CNCS/CCCDI-UEFISCDI, Romania, and project number PN-III-P1-1.1-TE-2019-0594, within PNCDI III.

Conflicts of Interest

The authors declare no conflict of interest.

References

  1. Salassa, G.; Terenzi, A. Metal complexes of oxadiazole ligands: An overview. Int. J. Mol. Sci. 2019, 20, 3483. [Google Scholar] [CrossRef] [Green Version]
  2. Puchkova, L.V.; Broggini, M.; Polishchuk, E.V.; Ilyechova, E.Y.; Polishchuk, R.S. Silver ions as a tool for understanding different aspects of copper metabolism. Nutrients 2019, 1, 1364. [Google Scholar] [CrossRef] [Green Version]
  3. Pandey, N.; Mehata, M.S.; Fatima, N.; Pant, S. Modulation of fluorescence properties of 5-aminoquinoline by Ag+ in aqueous media via charge transfer. J. Photochem. Photobiol. A 2020, 396, 112549. [Google Scholar] [CrossRef]
  4. Selvan, G.T.; Varadaraju, C.; Selvan, R.T.; Enoch, I.V.M.V.; Selvakumar, P.M. On/off fluorescent chemosensor for selective detection of divalent iron and copper ions molecular logic operation and protein binding. ACS Omega 2018, 3, 7985–7992. [Google Scholar] [CrossRef] [Green Version]
  5. Siczek, K.; Zatorski, H.; Fichna, J. Silver and other metals in the treatment of gastrointestinal diseases. Curr. Med. Chem. 2015, 22, 3695–3706. [Google Scholar] [CrossRef]
  6. Ojha, R.; Prasad, A.N. Menkes disease what a multidisciplinary approach can do. J. Multidiscip. Healthc. 2016, 9, 371–385. [Google Scholar] [CrossRef] [Green Version]
  7. Członkowska, A.; Litwin, T.; Dusek, P.; Ferenci, P.; Lutsenko, S.; Medici, V.; Rybakowski, J.K.; Weiss, K.H.; Schilsky, M.L. Wilson disease. Nat. Rev. Dis. Primers 2018, 4, 21. [Google Scholar] [CrossRef]
  8. Lan, A.P.; Chen, J.; Chai, Z.F.; Hu, Y. The neurotoxicity of iron, copper and cobalt in Parkinson’s disease through ROS-mediated mechanisms. BioMetals 2016, 29, 665–678. [Google Scholar] [CrossRef]
  9. Gorantla, N.V.; Landge, V.G.; Nagaraju, P.G.; Priyadarshini, P.; Balaraman, C.G.E.; Chinnathambi, S. Molecular cobalt (II) complexes for tau polymerization in alzheimer’s disease. ACS Omega 2019, 41, 6702–6714. [Google Scholar] [CrossRef] [Green Version]
  10. Kamnev, A.A.; Antonyuk, L.P.; Smirnova, V.E.; Serebrennikova, O.B.; Kulikov, L.A.; Perfiliev, Y. Trace cobalt speciation in bacteria and at enzymic active sites using emission Mössbauer spectroscopy. Anal. Bioanal. Chem. 2022, 372, 431–435. [Google Scholar] [CrossRef]
  11. Zhao, R.-X.; Liu, A.-Y.; Wen, Q.-L.; Wu, B.-C.; Wang, J.; Hu, Y.-L.; Pu, Z.F.; Ling, J.; Cao, Q. Glutathione stabilized green-emission gold nanoclusters for selective detection of cobalt ion. Spectrochim. Acta Part A Mol. Biomol. 2021, 254, 119628. [Google Scholar] [CrossRef]
  12. Wu, H.; Kong, D.; Ruan, Z.; Hsu, P.; Wang, S.; Yu, Z.; Carney, T.J.; Hu, L.; Fan, S.; Cui, Y. A transparent electrode based on a metal nanotrough network. Nat. Nanotechnol. 2013, 8, 421–425. [Google Scholar] [CrossRef]
  13. Chernousova, S.; Epple, M. Silver as antibacterial agent: Ion, nanoparticle, and metal. Angew. Chem. Int. Ed. Engl. 2013, 52, 1636–1653. [Google Scholar] [CrossRef]
  14. Yang, F.-Y.; Jiang, S.-J.; Sahayam, A.C. Combined use of HPLC-ICP-MS and microwave-assisted extraction for the determination of cobalt compounds in nutritive supplements. Food Chem. 2014, 147, 215–219. [Google Scholar] [CrossRef]
  15. Diniz, K.M.; Gorla, F.A.; Ribeiro, E.S.; do Nascimento, M.B.O.; Correa, R.J.; Teixeira Tarley, C.R.; Segatelli, M.G. Preparation of SiO2/Nb2O5/ZnO mixed oxide by sol-gel method and its application for adsorption studies and on-line preconcentration of cobalt ions from aqueous medium. Chem. Eng. J. 2014, 239, 233–241. [Google Scholar] [CrossRef]
  16. Mimendia, A.; Legin, A.; Merkoçi, A.; del Valle, M. Use of sequential injection analysis to construct a potentiometric electronic tongue: Application to the multidetermination of heavy metals. Sens. Actuators B 2010, 146, 420–426. [Google Scholar] [CrossRef]
  17. Liu, S.; Wang, Y.-M.; Han, J. Fluorescent chemosensors for copper(II) ion: Structure, mechanism and application. J. Photochem. Photobiol. C Photochem. Rev. 2017, 32, 78–103. [Google Scholar] [CrossRef]
  18. Awad, F.S.; AbouZied, K.M.; Bakry, A.M.; Abou El-Maaty, W.M.; El-Wakil, A.M.; El-Shall, M.S. Highly fluorescent hematoporphyrin modified graphene oxide for selective detection of copper ions in aqueous solutions. Anal. Chim. Acta 2020, 1140, 111–121. [Google Scholar] [CrossRef]
  19. Bagheri, N.; Mazzaracchio, V.; Cinti, S.; Colozza, N.; Di Natale, C.; Netti, P.A.; Saraji, M.; Roggero, S.; Moscone, D.; Arduini, F. Electroanalytical sensor based on gold-nanoparticle-decorated paper for sensitive detection of copper ions in sweat and serum. Anal. Chem. 2021, 93, 5225–5233. [Google Scholar] [CrossRef]
  20. Shellaiah, M.; Wu, Y.-H.; Singh, A.; Raju, M.V.R.; Lin, H.-C. Novel pyrene- and anthracene-based Schiff base derivatives as Cu2+ and Fe3+ fluorescence turn-on sensors and for aggregation induced emissions. J. Mater. Chem. A 2013, 113, 10–18. [Google Scholar] [CrossRef]
  21. Lium, Q.; Bianm, W.; Shim, H.; Fanm, L.; Shuangm, S.; Dongm, C.; Choi, M.M.F. A novel ratiometric emission probe for Ca2+ in living cells. Org. Biomol. Chem. 2013, 11, 503–508. [Google Scholar] [CrossRef]
  22. Liu, Q.; Feng, L.; Yuan, C.; Zhang, L.; Shuang, S.; Dong, C.; Hu, Q.; Choi, M.M.F. A highly selective fluorescent probe for cadmium ions in aqueous solution and living cells. Chem. Commun. 2014, 502, 498–501. [Google Scholar] [CrossRef]
  23. Homocianu, M.; Ipate, A.M.; Homocianu, D.; Airinei, A.; Hamciuc, C. Metal ions sensing properties of some phenylquinoxaline derivatives. Spectrochim. Acta A Mol. Biomol. Spectrosc. 2019, 215, 371–380. [Google Scholar] [CrossRef]
  24. Ambrosi, G.; Borgogelli, E.; Formica, M.; Fusi, V.; Giorgi, L.; Micheloni, M.; Rampazzo, E.; Sgarzi, M.; Zaccheroni, N.; Prodi, L. PluS Nanoparticles as a tool to control the metal complex stoichiometry of a new thio-aza macrocyclic chemosensor for Ag I, and Hg II, in water. Sens. Actuators B Chem. 2015, 207, 1035–1044. [Google Scholar] [CrossRef]
  25. Zhang, Y.; Wang, G.; Zhang, J. Study on a highly selective fluorescent chemosensor for Fe3+ based on 1,3,4-oxadiazole and phosphonic acid. Sens. Actuators B Chem. 2014, 200, 259–268. [Google Scholar] [CrossRef]
  26. Tang, L.; Zheng, Z.; Huang, Z.; Zhong, K.; Bian, Y.; Nandhakumar, R. Multi-analyte, ratiometric and relay recognition of a 2,5-diphenyl-1,3,4-oxadiazole-based fluorescent sensor through modulating ESIPT. RSC Adv. 2015, 510, 505–511. [Google Scholar] [CrossRef]
  27. Lin, L.; Wang, D.; Chen, S.-H.; Wang, D.-J.; Yin, G.-D. A highly sensitive fluorescent chemosensor for selective detection of zinc II, ion based on the oxadiazole derivative. Spectrochim. Acta A Mol. Biomol. Spectrosc. 2017, 174, 272–278. [Google Scholar] [CrossRef]
  28. Zhu, L.; Gu, C.; He, Y.; Wang, G. Study on a highly selective fluorescent chemosensor for Cu2+ and its direct sensing for proton based on 1,3,4-oxadiazole. J. Lumin. 2014, 153, 439–445. [Google Scholar] [CrossRef]
  29. Liu, Y.; Fei, Q.; Shan, H.; Cui, M.; Liu, Q.; Feng, G.; Huan, Y. A novel fluorescent “off-on-off” probe for relay recognition of Zn2+ and Cu2+ derived from N,N-bis(2-pyridylmethyl)amine. Analyst 2014, 139, 1868. [Google Scholar] [CrossRef]
  30. Zheng, C.; Yuan, A.; Zhang, Z.; Shen, H.; Bai, S.; Wang, H. Synthesis of pyridine-based 1,3,4-oxadiazole derivative as fluorescence turn-on sensor for high selectivity of Ag+. J. Fluoresc. 2013, 23, 785–791. [Google Scholar] [CrossRef]
  31. Al-Omary, F.A.M.; Mary, Y.S.; Panicker, C.Y.; El-Emam, A.A.; Al-Swaidan, I.A.; Al-Saadi, A.A.; Van Alsenoye, C. Spectroscopic investigations, NBO, HOMO–LUMO, NLO analysis and molecular docking of 5- adamantan-1-yl;-3-anilinomethyl-2,3-dihydro-1,3,4-oxadiazole-2-thione, a potential bioactive agent. J. Mol. Struct. 2015, 1096, 1–14. [Google Scholar] [CrossRef]
  32. Li, Q.; Cui, L.-S.; Zhong, C.; Yuan, X.-D.; Dong, S.-C.; Jiang, Z.-Q.; Liao, L.S. Synthesis of new bipolar host materials based on 1,2,4-oxadiazole for blue phosphorescent OLEDs. Dye. Pigment. 2014, 101, 142–149. [Google Scholar] [CrossRef]
  33. Lin, Y.; Li, Y.; Zhan, X. Small molecule semiconductors for high-efficiency organic photovoltaics. Chem. Soc. Rev. 2012, 41, 4245–4272. [Google Scholar] [CrossRef]
  34. Choi, M.-H.; Kim, H.Y.; Lee, E.J.; Moon, D.K. Control of molecular curvature and crystallinity of quinacridone-benzoxadiazole copolymers using different pi bridge for polymer solar cells. Polymer 2016, 91, 162–173. [Google Scholar] [CrossRef]
  35. Cristiano, R.; de Oliveira Santos, D.M.P.; Gallardo, H. Synthesis and characterization of low molecular mass luminescent liquid crystalline materials with 1,3,4-oxadiazole units. Liq. Cryst. 2005, 32, 7–14. [Google Scholar] [CrossRef]
  36. Homocianu, M.; Airinei, A. 1,3,4-Oxadiazole derivatives; Optical properties in pure and mixed solvents. J. Fluoresc. 2016, 26, 1617–1635. [Google Scholar] [CrossRef]
  37. Maidur, S.R.; Patil, P.S.; Rao, S.V.; Shkir, M.; Dharmaprakashd, S.M. Experimental and computational studies on second-and third-order nonlinear optical properties of a novel D-π-A type chalcone derivative 3-4-methoxyphenyl;-1- 4-nitrophenyl, prop-2-en-1-one. Opt. Laser Technol. 2017, 97, 219–228. [Google Scholar] [CrossRef]
  38. Anitha, P.; Pathrose, B.P.; Radhakrishnan, P.; Mujeeb, A. Nonlinear optical properties of neutral red dye: Enhancement using laser ablated gold nanoparticles. Opt. Laser Technol. 2020, 130, 106338. [Google Scholar] [CrossRef]
  39. Ipate, A.M.; Homocianu, M.; Hamciuc, C.; Airinei, A.; Bruma, M. Photophysical behavior of some aromatic poly1,3,4-oxadiazole-ethers derivatives. Spectrochim. Acta A Mol. Biomol. Spectrosc. 2014, 123, 167–175. [Google Scholar] [CrossRef]
  40. Chandrasekaran, Y.; Dutta, G.K.; Kanth, R.B.; Patil, S. Tetrahydroquinoxaline based squaraines: Synthesis and photophysical properties. Dye. Pigment. 2009, 83, 162–167. [Google Scholar] [CrossRef]
  41. Saleem, M.; Khang, C.H.; Kim, M.H.; Lee, K.H. Chromo/Fluorogenic detection of Co2+, Hg2+ and Cu2+ by the simple Schiff base sensor. J. Fluoresc. 2016, 26, 11–22. [Google Scholar] [CrossRef]
  42. Paley, M.S.; Harris, J.M.; Looser, H.; Baumert, J.C.; Bjorklund, G.C.; Jundt, D.; Twieg, R.J. A solvatochromic method for determining second-order polarizabilities of organic molecules. J. Org. Chem. 1989, 543, 774–3778. [Google Scholar] [CrossRef]
  43. Abbotto, A.; Beverina, L.; Bradamante, S.; Facchetti, A.; Klein, C.; Pagani, G.A.; Redi-Abshiro, M.; Wortmann, R. A distinctive example of the cooperative interplay of structure and environment in tuning of intramolecular charge transfer in second-order nonlinear optical chromophores. Chem. A Eur. J. 2003, 91, 991–2007. [Google Scholar] [CrossRef]
  44. Oudar, J.L.; Chemla, D.S. Hyperpolarizabilities of the nitroanilines and their relations to the excited state dipole moment. J. Chem. Phys. 1977, 66, 2664. [Google Scholar] [CrossRef]
  45. Mahajan, P.G.; Dige, N.C.; Desai, N.K.; Patil, S.R.; Kondalkar, V.V.; Hong, S.K.; Lee, K.H. Selective detection of Co2+ by fluorescent nano probe Diagnostic approach for analysis of environmental samples and biological activities. Spectrochim. Acta A Mol. Biomol. Spectrosc. 2018, 198, 136–144. [Google Scholar] [CrossRef]
  46. Şenkuytu, E.; Eçik, E.T. New hexa-bodipy functionalized dendrimeric cyclotriphosphazene conjugates as highly selective and sensitive fluorescent chemosensor for Co2+ ions. Spectrochim. Acta A Mol. Biomol. Spectrosc. 2018, 198, 232–238. [Google Scholar] [CrossRef]
  47. Lippert, E.; Luder, W.; Boos, H. Advances in Molecular Spectroscopy; Pergamon: Oxford, UK, 1962. [Google Scholar]
  48. Reichardt, C. Solvents and Solvent Effects in Organic Chemistry, 3rd ed.; Wiley-VCH: Weinheim, Germany, 2003. [Google Scholar]
  49. Zheng, J.; Kang, Y.K.; Therien, M.J.; Beratan, D.N. Generalized Mulliken−Hush analysis of electronic coupling interactions in compressed π-Stacked porphyrin−bridge−quinone systems. J. Am. Chem. Soc. 2005, 127, 11303–11310. [Google Scholar] [CrossRef]
  50. Ryu, K.Y.; Lee, S.Y.; Park, D.Y.; Kim, S.Y.; Kim, C. A novel colorimetric chemosensor for detection of Co2+ and S2− in an aqueous environment. Sens. Actuators B Chem. 2017, 242, 792–800. [Google Scholar] [CrossRef]
  51. Tang, L.; Zheng, Z.; Bian, Y. N-2-hydroxyethylpiperazine dangled 2,5-diphenyl-1,3,4-oxadiazole-based fluorescent sensor for selective relay recognition of Cu2+ and sulfide in water. Luminescence 2016, 31, 1456–1460. [Google Scholar] [CrossRef]
  52. Wang, L.; Bing, Q.; Li, J.; Wang, G. A new “ON-OFF” fluorescent and colorimetric chemosensor based on 1,3,4-oxadiazole derivative for the detection of Cu2+ ions. J. Photochem. Photobiol. A Chem. 2018, 360, 86–94. [Google Scholar] [CrossRef]
  53. Cao, S.; Pei, Z.; Xu, Y.; Zhang, R.; Pei, Y. Polytriazole bridged with 2,5-diphenyl-1,3,4-oxadiazole moieties a highly sensitive and selective fluorescence chemosensor for Ag+. RSC Adv. 2015, 545, 888–45896. [Google Scholar] [CrossRef]
  54. Tekuri, V.; Sahoo, S.K.; Trivedi, D.R. Hg2+ induced hydrolysis of thiazole amine based Schiff base Colorimetric and fluorogenic chemodosimeter for Hg2+ ions in an aqueous medium. Spectrochim. Acta Part A Mol. Biomol. 2019, 218, 19–26. [Google Scholar] [CrossRef]
  55. Duan, J.; Ma, B.; Liu, F.; Zhang, S.; Wang, S.; Kong, Y.; Du, M.; Han, L.; Wang, J.; Sang, Y.; et al. Coordination ability determined transition metal ions substitution of Tb in Tb-Asp fluorescent nanocrystals and a facile ions-detection approach. Nanoscale 2018, 10, 7526–7535. [Google Scholar] [CrossRef]
  56. Ipate, A.; Hamciuc, C.; Homocianu, M.; Musteata, V.E.; Nicolescu, A.; Bruma, M.; Belomoina, N. Highly fluorinated poly 1,3,4-oxadiazole-ethers structural, optical and dielectric characteristics. J. Polym. Res. 2015, 22, 95. [Google Scholar] [CrossRef]
  57. Suppan, P. Excited-state dipole moments from absorption/fluorescence solvatochromic ratios. Chem. Phys. Lett. 1983, 94, 272–275. [Google Scholar] [CrossRef]
  58. Bicerano, J. Prediction of Polymer Properties; Marcel Dekker: New York, NY, USA, 2000. [Google Scholar]
  59. Lou, A.J.-T.; Marks, T.J. A twist on nonlinear optics understanding the unique response of π-twisted chromophores. Acc. Chem. Res. 2019, 52, 1428–1438. [Google Scholar] [CrossRef]
  60. Erande, Y.; Kothavale, S.; Sreenath, M.C.; Chitrambalam, S.; Joe, I.H.; Sekar, N. Triphenylamine derived coumarin chalcones and their red emitting OBO difluoride complexes synthesis, photophysical and NLO property study. Dye. Pigment. 2018, 148, 474–491. [Google Scholar] [CrossRef]
Figure 1. Structures of the poly(1,3,4-oxadiazole-ether) derivatives investigated in this study.
Chemosensors 10 00183 g001
Figure 2. Plot and fit line of ν max abs ν max em against the Lippert–Mataga solvent polarity function (f(ε) – f(n2)) for the BisFOx compound (in a series of solvents).
Chemosensors 10 00183 g002
Figure 3. Absorption changes of (a) BisFOx, (b) 9FOx, and (c) 6FOx samples, when adding 1500 µL of various interfering ions (Mg2+, Mn2+, Ni2+, Cd2+, Zn2+, Co2+, Cu2+, Hg2+, Sn2+, and Ag+). The inset shows the absorption spectra of the free BisFOx, 9FOx, and 6FOx, in THF solution.
Chemosensors 10 00183 g003
Figure 4. Plots depicting the effects of increasing amounts of (a) Ag+, (b) Co2+, and (c) Cu2+ metal ions on the absorption spectra for the BisFOx sample (c = 1 × 10⁻⁵ mol L−1), in THF solution. Insets: The plot depicting the linear proportional relationship between the absorbance and the concentration of the Ag+, Co2+, and Cu2+ ions.
Chemosensors 10 00183 g004
Figure 5. Emission spectra of the BisFOx compound (c = 1 × 10⁻⁵ mol L−1), in THF solution, after titration with incremental amounts of Ag+ (a), Co2+ (b), and Cu2+ (c) cations.
Chemosensors 10 00183 g005aChemosensors 10 00183 g005bChemosensors 10 00183 g005c
Figure 6. The degree of change in the emission intensity at two wavelengths (356 and 370 nm) after metal ion titration of the BisFOx (a) 9FOx (b) and 6FOx (c) samples in THF solution. Numerical values are for F0/F corresponding to λem = 356 nm.
Chemosensors 10 00183 g006
Figure 7. Absorption (a) and emission spectra (b) of the BisFOx compound (c = 1 × 10⁻⁵ mol L−1), in DMSO solution, after titration with incremental amounts of Cu2+ ions.
Chemosensors 10 00183 g007
Table 1. Photophysical characteristics, Lippert-Mataga polarity function, and spectral data for BisFOx molecules, in different solvents.
Media aε bn c f LM ( ε , n )   d ν max abs ,
cm−1 e
ν max em ,
cm−1 f
Δν,
cm−1 g
DIO2.251.42240.024533,33328,1695164
TOL2.381.49610.013533,11228,0895022
CHCl34.811.44590.148333,00327,8555148
THF7.471.40700.208433,33328,1695164
CH3OH33.001.32880.308635,08827,7785667
DMF38.251.43050.275233,33327,9335400
DMSO47.241.47700.264033,33327,7785555
a Solvents: dioxane (DIO), toluene (TOL), chloroform (CHCl3), tetrahydrofuran (THF), methanol (CH3OH), dimethylformamide (DMF), dimethyl sulfoxide (DMSO); b ε and c n—dielectric constants and refractive indexes that were taken from [48]; d the Lippert–Mataga polarity function ( f ( ε ) f ( n 2 ) ); e and f wavelength values for the absorption and emission maxima; g Δν = ν max abs ν max em is the solvatochromic shift (in cm−1).
Table 2. Spectral data and optical responses of the BisFOx and 9FOx samples in the presence of different metal ions, in the THF solution.
CompoundsAbsorptionFluorescence
λ max abs ,   nm A0/A λ max em ,   nm F0/F
BisFOx302-356.5-
BisFOx/Mg2+3021.3073551.37
BisFOx/Mn2+3021.279356.51.24
BisFOx/Ni2+302-356.51.36
BisFOx/Cd2+3021.297356.51.32
BisFOx/Zn2+3031.1503571.15
BisFOx/Co2+302 (sh)/570 (sh)/6740.437355.52.70
BisFOx/Cu2+2910.495357.52.98
BisFOx/Hg2+3021.3813561.24
BisFOx/Sn2+3011.156356.51.28
BisFOx/Ag+244/3010.189356.52.03
9FOx300-356-
9FOx/Mg2+302/364 (weak)0.91823561.38
9FOx/Mn2+3011.1756356.51.21
9FOx/Ni2+265 (sh)/304 (sh)1.34923561.28
9FOx/Cd2+276/301 (sh)0.7374357.01.23
9FOx/Zn2+3011.2989357.01.16
9FOx/Co2+302/375 (sh)/570 (sh)/6740.6346--
9FOx/Cu2+273 (sh)0.3364 a356.52.90
9FOx/Hg2+3011.40253571.25
9FOx/Sn2+3011.2176356.51.24
9FOx/Ag+243 (sh)/3001.33033562.26
λ max abs and λ max em —the wavelength of the absorption and emission bands, respectively; A0 and A—the intensity of the absorption band in the absence (A0) and presence (A) of ~1500 µL solution of different metal ions; F0 and F—emission intensities of the maximum of the emission band in the absence (F0) and presence (F) of ~1500 µL of different metal ions, respectively; a—the values of F were read at a maximum of the emission band in the presence of 850 µL Ag+ ions; sh—shoulder.
Table 3. Linear regression equation (LRE) and calculated parameters (LOD, LOQ) from plots between the absorption intensity and the concentrations of Ag+, Co2+, and Cu2+ ions, for BisFOx, 9FOx, and the 6FOx samples.
ParametersBisFOx9FOx6FOx
Ag+
LREA = 0.083 − 1953.388CAg+
(R2 = 0.997, SD = 0.0148)
A = 0.101 + 1989.96CAg+
(R2 = 0.999, SD = 0.0065)
A = 0.156 + 2096.73CAg+
(R2 = 0.998, SD = 0.0137)
a LOD (μg L−1)2.287 × 10−59.784 × 10−61.973 × 10⁻⁵
b LOQ (μg L−1)7.63 × 10−53.261 × 10−56.577 × 10⁻⁵
Co2+
LREA = 0.249 + 667.87CCo2+
(R2 = 0.997, SD = 0.0063)
A = 0.210 + 369.20CCo2+
(R2 = 0.999, SD = 0.0018)
A = 0.0007 + 318.74CCo2+
(R2 = 0.999, SD = 0.0016)
a LOD (μg L−1)2.834 × 10−51.463 × 10−51.544 × 10⁻⁴
b LOQ (μg L−1)9.448 × 10−54.875 × 10−55.145 × 10⁻⁴
Cu2+
LREA = 0.296 + 1794.53CCu2+
(R2 = 0.976, SD = 0.0379)
A = 0.184 + 2179.85CCu2+
(R2 = 0.999, SD = 0.0062)
A = 0.237 + 1994.80CCu2+
(R2 = 0.994, SD = 0.02373)
a LOD (μg L−1)6.341 × 10−58.533 × 10−63.569 × 10⁻⁵
b LOQ (μg L−1)2.114 × 1042.844 × 10−51.19 × 10⁻⁴
a LOD—is the detection limit, estimated on the basis of the 3 Sb/m relation; b LOQ—is the limit of quantification, estimated on the basis of 10 Sb/m [50] (Sb = the standard deviation of the blank; m = the slope of calibration curve, respectively).
Table 4. Comparison of the LOD values of the prepared BisFOx, 9FOx, and 6FOx with some recently published chemosensors containing 1,2,4-oxadiazole rings [29,51,52,53] used for the determination of Ag+, Co2+, and Cu2+ ions.
MaterialsMetal IonsLODsRefs.
2,5-diphenyl-1,3,4-oxadiazoleCu2+4.8 × 10−7 M[51]
pyrazole-containing oxadiazole derivativeCu2+2.14 μM[29]
asymmetrical oxadiazole derivativeCo2+3.92 × 10⁻⁶ mol/L[52]
polytriazoles derivativeAg+4.22 × 10⁻⁷ M[53]
BisFOxCu2+1.013 × 10⁻⁷ MThis study
BisFOxCo2+4.52 × 10⁻⁸ MThis study
BisFOxAg+4.52 × 10⁻⁸ MThis study
9FOxCu2+1.45 × 10⁻⁸ MThis study
9FOxCo2+1.45 × 10⁻⁸ MThis study
9FOxAg+1.66 × 10⁻⁸ MThis study
6FOxCu2+6.426 × 10⁻⁸ MThis study
6FOxCo2+2.78 × 10⁻⁷ MThis study
6FOxAg+3.55 × 10⁻⁸ MThis study
Table 5. The efficiency of fluorescence quenching (%).
CodesAg+Co2+Cu2+
BisFOx50.9254.3366.62
9FOx55.8854.1165.67
6FOx72.7335.8365.24
Table 6. Calculated NLO and ICT parameters of the BisFOx sample in various solvents.
Mediaf a
e.s.u.
μ eg   b
10−35
e.s.u.
Δ μ CT   c
10−17
e.s.u.
αCT d
10−23
e.s.u.
βCT e
10−32
e.s.u.
γCT f
10−34
e.s.u.
C b 2   g H DA   h
cm−1
R DA   i
Å
DIO0.66714.266.540.1289.5250.560.19613,2203.50
TOL0.43392.796.540.0846.3200.390.12010,7453.46
CHCl30.55273.566.540.1088.1300.490.16212,1523.45
THF0.61733.946.540.1198.8140.530.18012,8243.47
CH3OH0.04950.306.540.0866.050.030.00116028.08
DMF0.59293.786.540.1148.4650.500.17312,6153.46
DMSO0.69834.466.540.1340.0100.580.20413,4403.52
a–i—parameters defined by Equations (1)–(13). Solvent abbreviations: DIO (dioxane, ε = 2.25); TOL (toluene, ε = 2.38); CHCl3 (chloroform, ε = 4.81); THF (tetrahydrofuran, ε = 7.47); CH3OH (methanol, ε = 33.00); DMF (N,N-dimethylformamide, ε = 38.25); DMSO (dimethyl sulfoxide, ε = 47.24).
Publisher’s Note: MDPI stays neutral with regard to jurisdictional claims in published maps and institutional affiliations.

