Article

Measurement of Pulsating Flow Using a Self-Attachable Flexible Strain Sensor Based on Adhesive PDMS and CNT

1
Department of Robotics and Mechatronics Engineering, Daegu Gyeongbuk Institute of Science & Technology (DGIST), Daegu 42988, Korea
2
Robotics and Mechatronics Research Center, Daegu Gyeongbuk Institute of Science & Technology (DGIST), Daegu 42988, Korea
*
Author to whom correspondence should be addressed.
Submission received: 12 April 2022 / Revised: 4 May 2022 / Accepted: 13 May 2022 / Published: 16 May 2022
(This article belongs to the Special Issue Nanomaterials Based on Bio/Chemical Sensors)

Abstract

:
Accurate monitoring is needed for pulsating flow in many healthcare and bio applications. Specifically, real-time monitoring of pulsating blood flow provides rich information regarding a patient’s health conditions. This paper proposes a flexible strain sensor capable of detecting the pulsating fluid flow by directly measuring the circumferential strain induced by a rapid change in the flow rate. The thin and flexible strain sensor consists of a polydimethylsiloxane (PDMS) with a Triton-X treatment to enhance the adhesive property and multi-walled carbon nanotubes (MWCNT) as the piezoresistive sensing layer. MWCNT integration implements a simple spray-coating method. The adhesive PDMS/CNT strain sensor exhibits a highly adhesive nature and can be attached to a silicone tube’s curved surface. By analyzing the theoretical modeling based on fluid energy equation and solid mechanics, strains induced on the soft tube by the change in flow rate, viscosity, and fluid density can be predicted. We performed the flow rate measurement at varying fluid-flow rates and liquid viscosities, and the results match our prediction. The sensitivity and limit of detection of the presented strain sensor are about 0.55 %min/L and 0.4 L/min, respectively. Both the calculation and experiment confirm that the sensor resistance is most sensitive to the fluid-flow rate, thus, enabling the accurate tracking of pulsating fluids’ flow rate, regardless of the viscosity or density.

1. Introduction

The bio and healthcare industry requires a technique that can accurately monitor pulsatile flows. Specifically, blood pulse measurements provide useful clinical information, such as portal hypertension, adnexal torsion, pulmonary hypertension, and Alzheimer’s disease [1,2,3,4,5]. Various methods to measure and understand the effect of pulsatile flow properties in the blood vessels in artery diseases have been reported. Fluid–structure interaction modeling of the stenosed artery was conducted using the finite-element method to analyze the stress on the blood vessel [6,7]. The one-dimensional model based on flow dynamics estimated the pressure propagation in the flexible tube and was compared to experimental results, with various viscoelastic tubes [8]. The volumetric strain in the human brain induced by arterial pulsation was measured using phase-contrast magnetic resonance imaging (PC-MRI) and magnetic resonance elastography (MRE) to diagnose cerebrovascular diseases [9]. There is a great need to monitor the flow rate of pulsatile flows going through medical tubes for drug delivery, hemodialysis, and vascular graft [10]. As the demand for more compact and simple flow-monitoring systems keeps increasing, there is great need to develop a novel platform to replace traditional pulsatile-flow-rate monitoring methods.
Recent advancements in microfabrication and micro-electromechanical systems (MEMS) have realized compact flow-monitoring systems with outstanding sensitivity and resolution. One of the promising methods is using the heat-transfer-type MEMS flow sensor that measures the flow of ambient fluid using a microheater and thermocouples [11,12]. The aforementioned thermal methods can detect various fluid flows, such as air, oil, and water [13,14,15,16,17,18,19]. However, such a thermal method is more suited to detect steady or slowly changing flow rates and lacks accuracy when detecting pulsatile flows [12]. MEMS cantilevers or membranes embedded with piezoresistive flow sensors have shown great promise, since they can detect rapid changes in flow rates, along with outstanding measurement sensitivities [20]. Among several piezoresistive sensing mechanisms, the strain gauge decorated on the surface of sensors can detect the strain induced by both air and liquid flows [21,22,23,24,25,26]. Although such MEMS flow sensors have shown great promise with commercial success, the mechanical rigidity of such sensors and rather complex operating systems has limited their use in medical fields [20]. Piezoelectric materials-based flow sensors, mainly composed of lead zirconate titanate (PZT) or polyvinylidene fluoride (PVDF), have shown great promise, as they do not require an external power source [27,28,29,30,31]. However, their poor mechanical stability and high internal electrical resistance are not suited to building a compact and economic flow-sensing platform capable of monitoring pulsatile flows [11]. Thanks to the robustness and immunity of electromagnetic interference, Fiber Bragg Grating (FBG)-based sensors are widely used in various industries [32,33]. FBG fluid flow sensors can detect the flow rate, pipeline pressure, and circumferential strain [34,35,36,37,38]. However, FBG fluid flow sensors need an external heat source.
The advancement of MEMS-based flow rate sensors has enabled highly accurate and rapid tracking of flow rates in various medical and clinical applications, such as ventilators, nebulizers, and liquid drug delivery and injection systems [11,39,40]. Specifically, ultrasonic sensors, digital subtraction angiography (DSA), and extracorporeal membrane oxygenation (ECMO) systems are widely used to detect pulsatile blood flow [41,42,43]. However, such systems are rather bulky and expensive, while optimized to quantify the blood flow rate measured over an extended period. Hence, it is desired to develop a simple sensing system that can accurately track the dynamic nature of pulsatile or time-dependently varying flow rates. The recent emergence of stretchable sensors and e-skins has enabled the direct measurement of the change in pressure on flexible substrates, making them suited for biological or medical uses. A heat-transfer-based MEMS flow-sensing device could be implantable and measure the arterial blood flow [23]. The optical MEMS blood flow sensor measures the blood flow based on the Doppler shift of the laser [44,45,46]. In addition, a Doppler ultrasound flow sensor, fabricated using a piezoelectric polymer, can detect the aorta blood flow of adult white rabbits [47].
An implantable blood-pressure monitoring system based on a piezoresistive measurement scheme can track the pressure inside the elastic tube by measuring the diameter change [48]. Such a device is wound around the blood vessel and consists of an elastic cuff, insulating fluid, and piezoresistive pressure sensor. In addition, the flexible capacitive micromachined ultrasonic transducer (CMUT) array can detect the fluid flow velocity and flow direction [49]. A couple of CMUT devices emit ultrasound to blood vessels and receive the reflective signal. Based on Doppler effects, the device is capable of detecting the blood flow rate by measuring the real-time change in blood vessel diameter. Moreover, a wearable-wristband-type capacitive pressure sensor, based on the wrinkled Au nanostructure, has been developed to measure the blood pressure of the radial arterial and the blood pulse [50]. A highly sensitive pressure sensor decorated with the sandwiched two-wrinkled CNT layer detects radial artery pulsatile blood flow while mounted on the wrist [51]. As the pressure is applied to the sensor, the resistance between two wrinkled CNT/PDMS films changes due to the change in the electrical contact points. Disposable or biodegradable materials have also been reported to track arterial pulse sensors [51,52]. The above-mentioned studies focused on the blood flow measurement based on various working principles, such as piezoresistive and capacitive, while implementing non-invasive [49,50], implantable [48,52], or minimally invasive methods [53].
As mentioned above, previous studies on pulsatile flow sensing focus on wearable or on-organ-type sensors. Although such wearable systems are suited for medical and clinical purposes, there is a lack of study on measuring the pulsatile flow through flexible or expandable tubes. In this work, we develop a theoretical analysis that can apply to many different tube materials. In addition, we introduce a flexible piezoresistive strain sensor based on adhesive PDMS/CNT that conformally attaches to the curved surface of a silicone tube. The CNTs deposited on the sensor surface entangle each other and, thus, form a stable electrical pathway. When the pulsatile flow passes through the flexible tube, the sudden change in flow rates induces a shift in tube radius due to the sudden shift in static pressure exerted by the fluid flow, and it can be accurately tracked by the developed sensor. This work presents a detailed study on sensor performance at different flow rates, while using fluids with varying viscosity and density. Our sensor can detect a wide range of pulsatile flow rates without being much affected by the liquid viscosity or density, showing that it is suited for high-accuracy pulsatile-flow-rate monitoring applications.

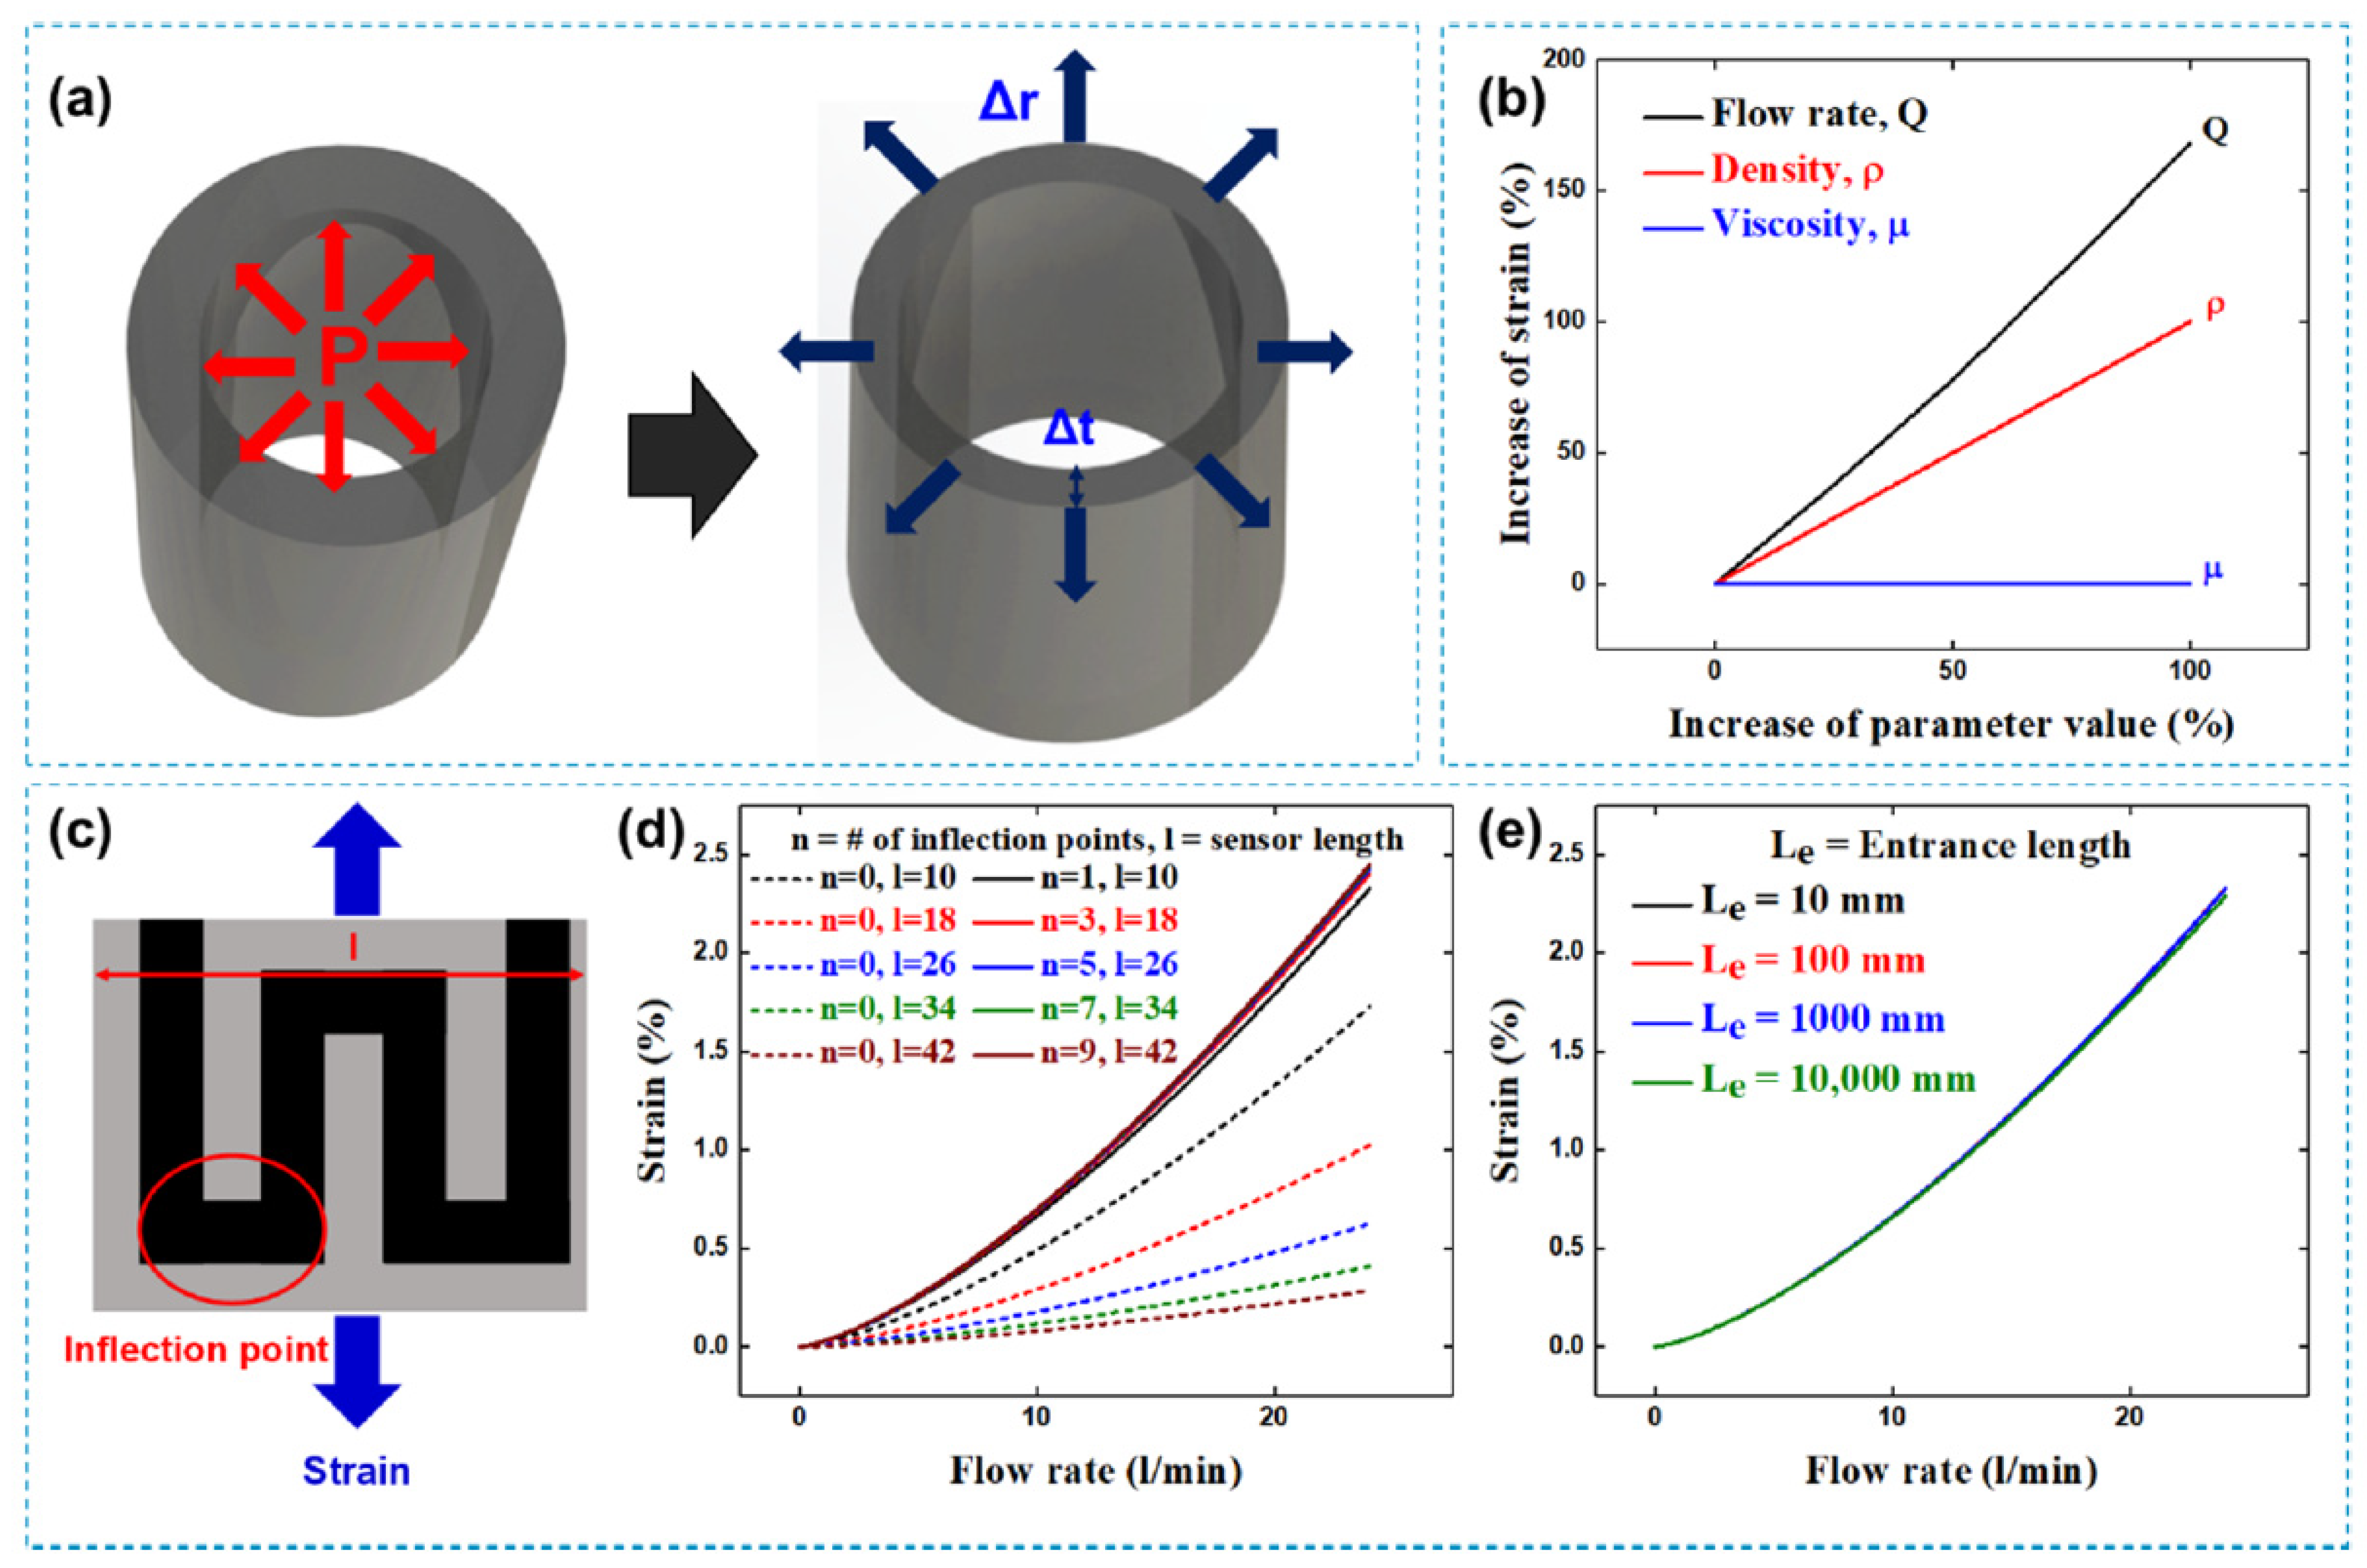
2. Analytical Modeling

The presented sensor operates under the principle that the change in pulse rates induces a tube strain. To predict such strain as a function of the change in flow rates, we use the energy equilibrium equation based on the Bernoulli equation and Hooke’s law. The tube deforms when a fluid flows in the tube with a static pressure P. Such static pressure applies circumferentially and results in the tube radius deformation. The deformed tube thickness and radius change the inner volume of the tube and the flow kinetic energy, since the fluid flow converts to the elastic potential energy of the deformed tube. The change in the tube’s inner volume shifts the velocity and static pressure of the flow, following the continuity equation.
In the initial state, or before the deformation of the tube, the total energy in the system organized by the tube and a flowing fluid consists of the static pressure, dynamic pressure, and potential energy in the fluid. When the tube deforms, there is a generation of elastic potential energy and loss by friction between the tube’s fluid and surface. Such a change in energy terms can be organized as below:
P 1 ρ g + v 1 2 2 g = P 2 ρ g + v 2 2 2 g + E p + L f
where ρ, g, P, v, Ep, and Lf stand for the fluid density, acceleration of gravity, the static pressure, the velocity of the fluid, elastic potential energy, and friction loss, respectively. The subscript 1 and 2 mean the status before and after the tube deformation, respectively. When a fluid flows in the tube, a static pressure induces the hoop stress, which is defined as Equation (2). Elastic potential energy induced by the deformation of the tube can be expressed as Equation (3).
σ H = ( r o 2 + r i 2 ) ( r o 2 r i 2 ) r i 2 r 2 P
E p = 1 2 ( F r Δ r + F t Δ t )
The hoop stress (σH) of the tube-given radius r is defined by static pressure (P) of the fluid, inner radius of tube (ri), and outer radius (ro). The elastic potential energy of the tube (Ep) can be divided by the radius deformation term (FrΔr) and thickness deformation term (FtΔt). The radius deformation term force (Fr) and thickness deformation term force (Ft) acting on the tube surface, induced by hoop stress, deform the tube radius and tube thickness. The deformations in the tube radius and thickness can be explained using the continuity equation and Hooke’s law by combining the above relations. The friction loss is a function of tube radius, length from outlet to the sensor, flow rate, and friction coefficient. Here, various fluid properties and the tube material properties, such as the fluid-flow rate, fluid density, fluid viscosity, roughness of the tube surface, and tube radius, define the friction coefficient. Moody’s diagram provides information on the friction coefficient as the functions of the roughness of the plate and the Reynolds number of the fluid. The change in static pressure at a given flow rate can be predicted from the fluid energy equilibrium equation based on the Bernoulli equation and Hooke’s law, as shown in Equation (4). In Equation (4), the friction loss term accounts for about 6.2% in the calculated result compared to the other terms, due to the small friction coefficient from 0.02 to 0.04.
P 1 ρ g + v 1 2 2 g = P 2 ρ g + ( Q π ( r i + Δ r i ) 2 ) 2 2 g + 1 2 ( F r Δ r i + F t Δ t ) + C l ( Q π ( r i + Δ r i ) 2 ) 2 4 r i g
From the hoop stress calculation and Hooke’s law, the strain of the tube, depending on the change in fluid static pressure, can be derived. The hoop stress results in tube strain depend on the tube elastic modulus according to Hooke’s law. By calculating tube strain in both the longitudinal and radial direction, static pressure term and elastic potential term, which are the right-side second term and third term in Equation (4), respectively, can be calculated. C is the friction coefficient as a function of the fluid-flow rate, fluid viscosity, fluid density, and roughness of the tube. The friction coefficient is defined from Moody’s diagram by using the Reynolds number of the fluid and the relative roughness of the tube. l is the length between the motor pump outlet and the strain sensor. We calculated the strain induced by flow-rate change from the outer radius change in Equation (4). Due to the complicated form of Equation (4), we calculated the equation as a function of flow rate, fluid viscosity, and density, using MATLAB. In Equation (4), Q is the flow rate as an independent variable, and P2 is the static pressure of the fluid after tube deformation as a dependent variable. We solved the equation by sweeping the Q from 0 L/min to 12 L/min as the flow rate capacity of the motor pump. Solving the equation, we derived P2 and calculated Δri and Δt as the inner-radius change and thickness change, respectively. The induced strain on the tube surface is calculated from the outer radius change derived from the initial outer radius, inner-radius change, and thickness change. Finally, we derived the relationship between the fluid-flow rate and induced surface strain.
The back pressure affects the fluid flow in the tube. The tube back pressure is defined by the following two types. First, the friction force between the tube surface and fluid impedes the fluid flow. Although the friction loss term in the theoretical modeling demonstrates the friction force effect on the fluid flow, the value is very small compared to other terms. Second, reflected fluid flow in the tube impedes the fluid flow. The flow is reflected from the tube surface during the tube deformation. Depending on the elastic modulus of the tube, the ratio of fluid kinetic energy transduced to the elastic potential energy of tube deformation is variable. Thus, the elastic modulus of the tube affects the tube deformation and radius change. In the extended Bernoulli equation used in this study, the tube back pressure due to the tube elastic modulus is considered at the fluid kinetic energy term, tube elastic potential energy term, and friction loss term. The main parameters for radius change are material properties, such as elastic modulus and Poisson’s ratio. In this study, the measured elastic modulus (PDMS: 425 kPa and silicone tube: 3.72 MPa) and 0.5 for Poisson’s ratio are used. Using such analysis, we can predict the amount of strain induced on the PDMS film attached to a silicone tube, as a function of the flow-rate change, fluid density, and fluid viscosity.

3. Materials and Methods

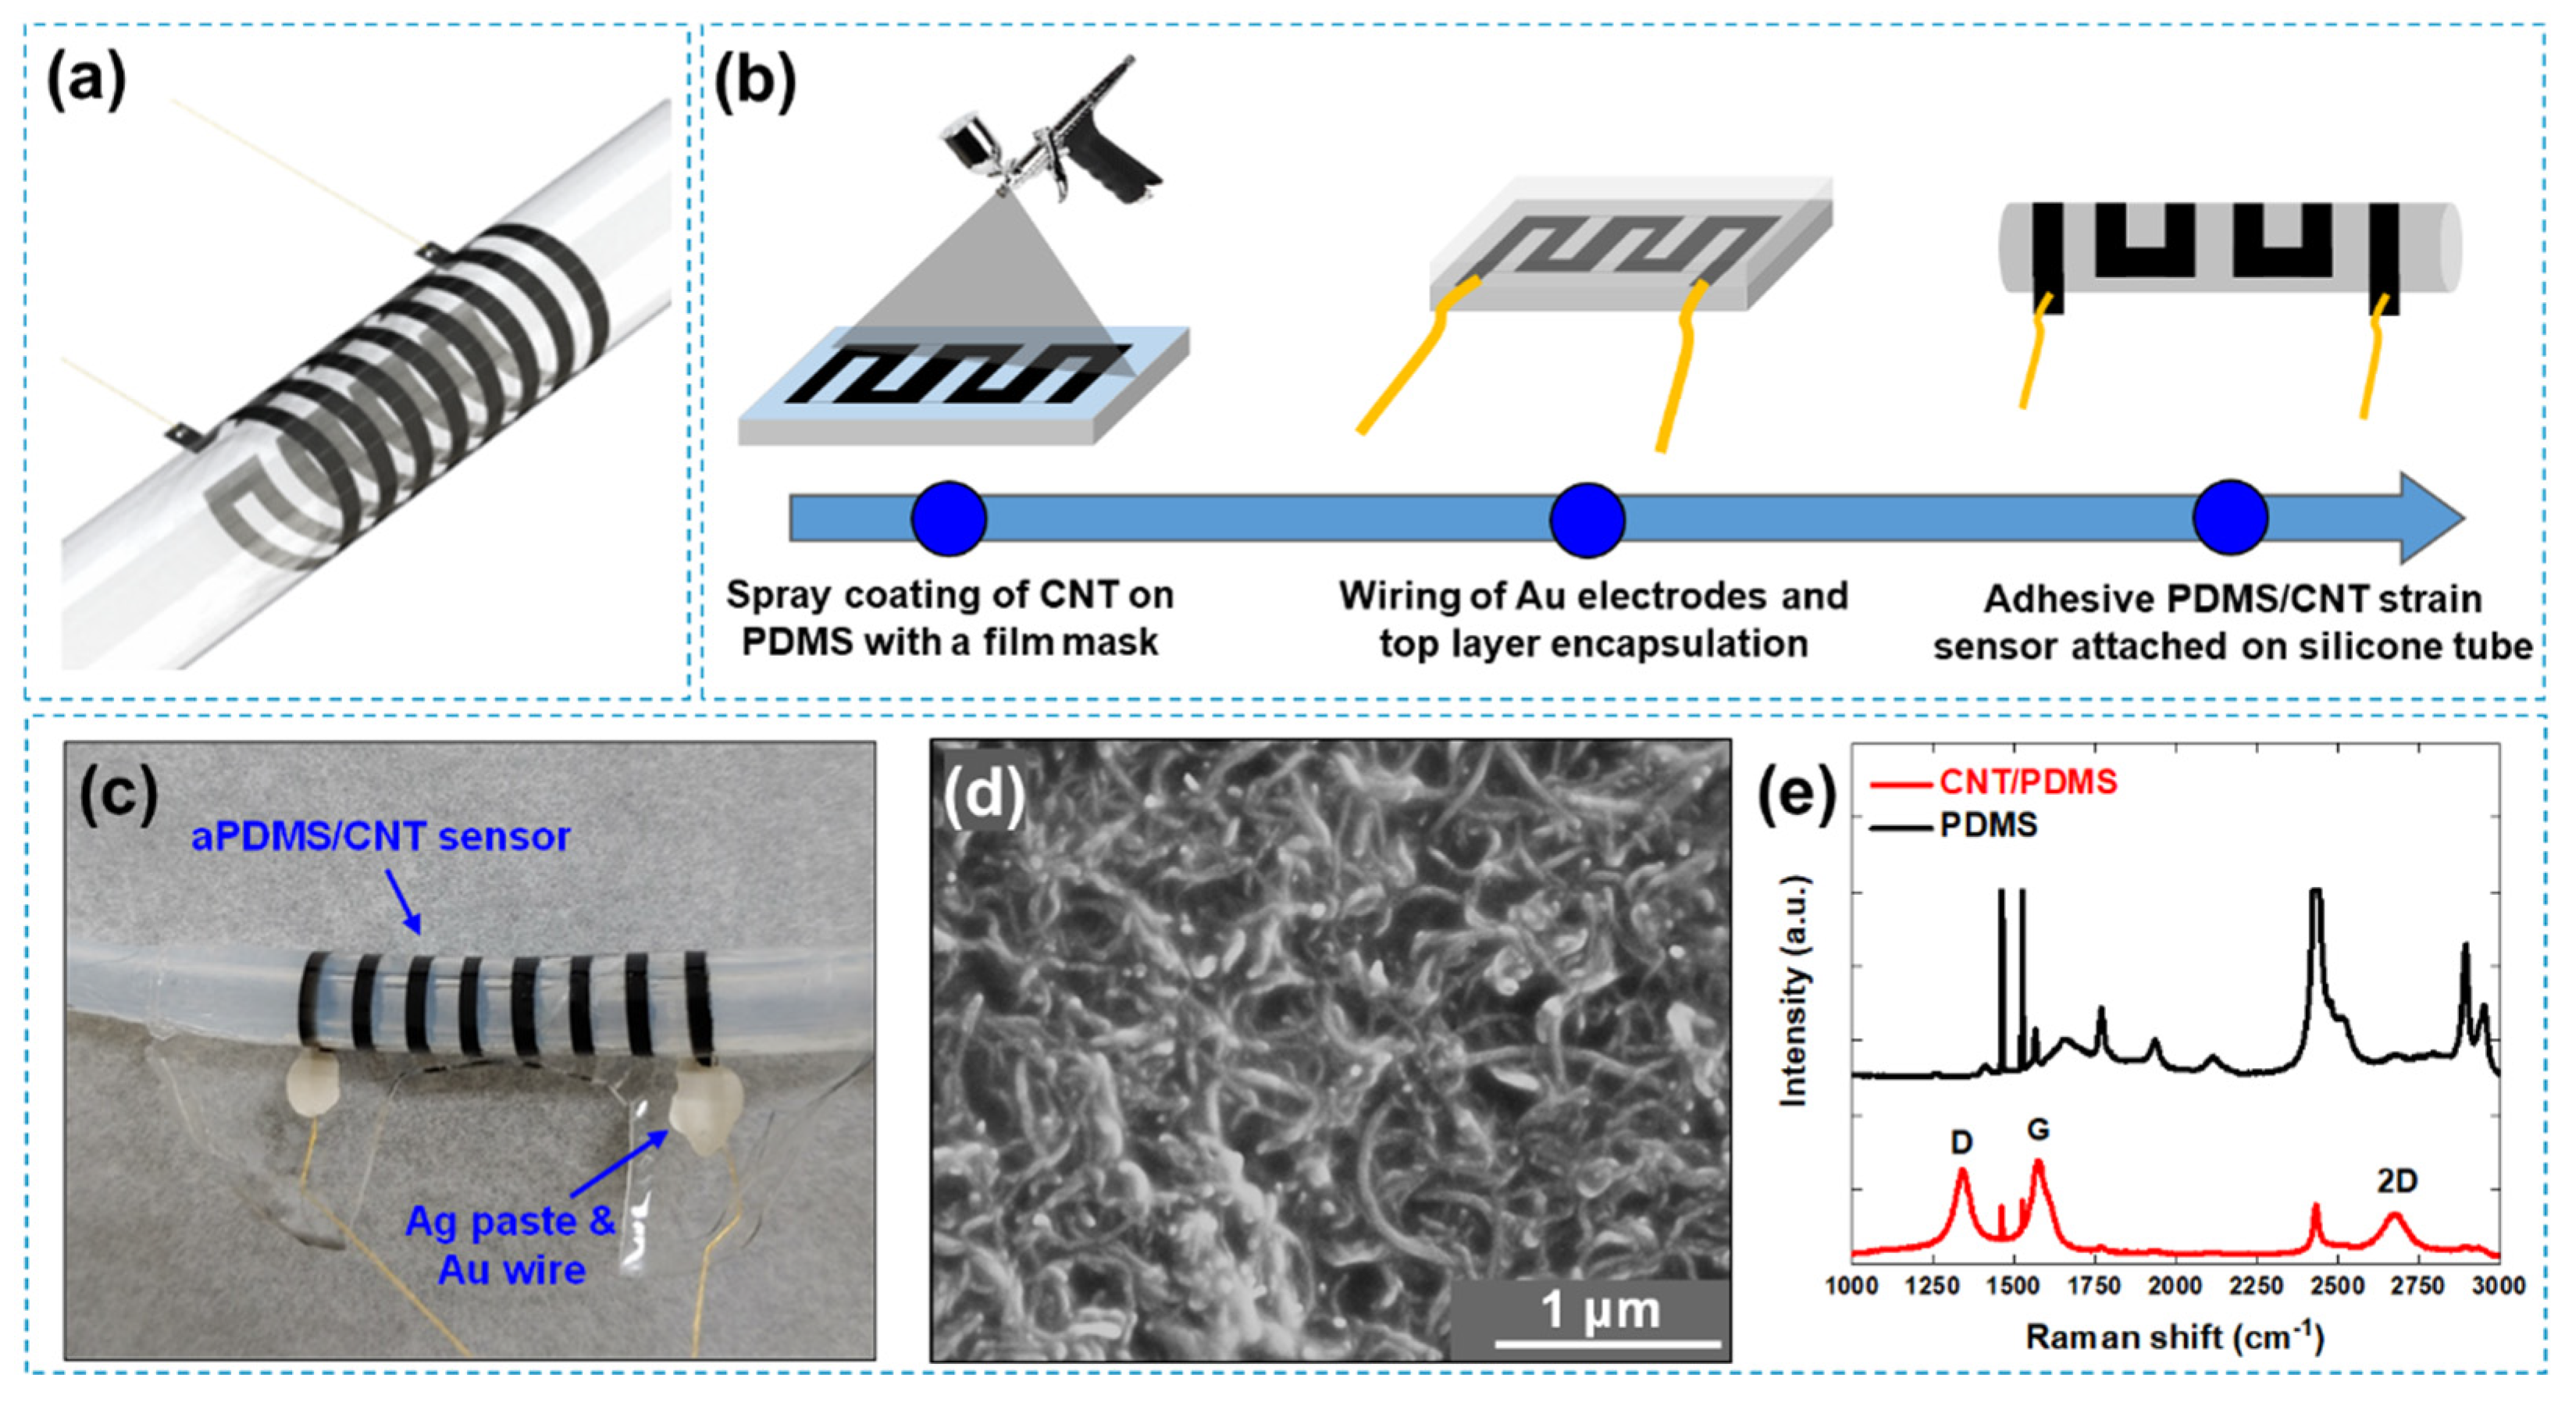
3.1. Preparation of Adhesive PDMS and MWCNT Solution

To delaminate the PDMS film from the Si substrate, forming a sacrificial layer takes place before spin coating PDMS. A layer of spin-coated polyvinyl alcohol (PVA), a water-soluble polymer on a Si substrate, acts as a sacrificial layer. By mixing the PDMS base polymer (Sylgard 184) with the curing agent (Sylgard 184) and Triton-X with a weight ratio of 10:1:0.3, we produced a highly adhesive PDMS film. Vacuum treatment of the mixed PDMS prepolymer for 1 h ensures the removal of air bubbles. The PDMS prepolymer forms an adhesive PDMS film of 130 μm thickness on a Si substrate spin coated at 350 RPM. After curing as-coated adhesive PDMS prepolymer on Si substrate in a convection oven at 35 °C temperature for 20 h, immersing the substrate in the deionized (DI) water releases the adhesive PDMS layer from the wafer by dissolving a PVA layer. Ultrasonication treatment of the 0.5 wt.% MWCNT (outer diameter: 5~15 nm, length: 50 μm) solution diluted by isopropyl alcohol (IPA) uniformly disperses the MWCNT in the solution.

3.2. The Fabrication Process of Flexible a-PDMS/CNT Strain Sensor

The spray coating of 0.5 wt.% MWCNT solution was conducted at 2.3 bar pressure using a 5 mm diameter nozzle for 20 s. A thermoplastic polyurethane (TPU) mask printed by a 3D printer blocks the adhesive PDMS surface from the MWCNT solution spraying, forming the serpentine-shaped MWCNT layer. After each MWCNT solution-spraying step on the adhesive PDMS film on a hot plate at 35 °C temperature, the MWCNT solution-sprayed adhesive PDMS film rests for 30 s to evaporate the solvent. Au wires are attached to the two ends of the MWCNT pattern by using a conductive epoxy (CW-2400) containing Ag. After forming the electrical connections, another adhesive PDMS film is bonded on top for the encapsulation.

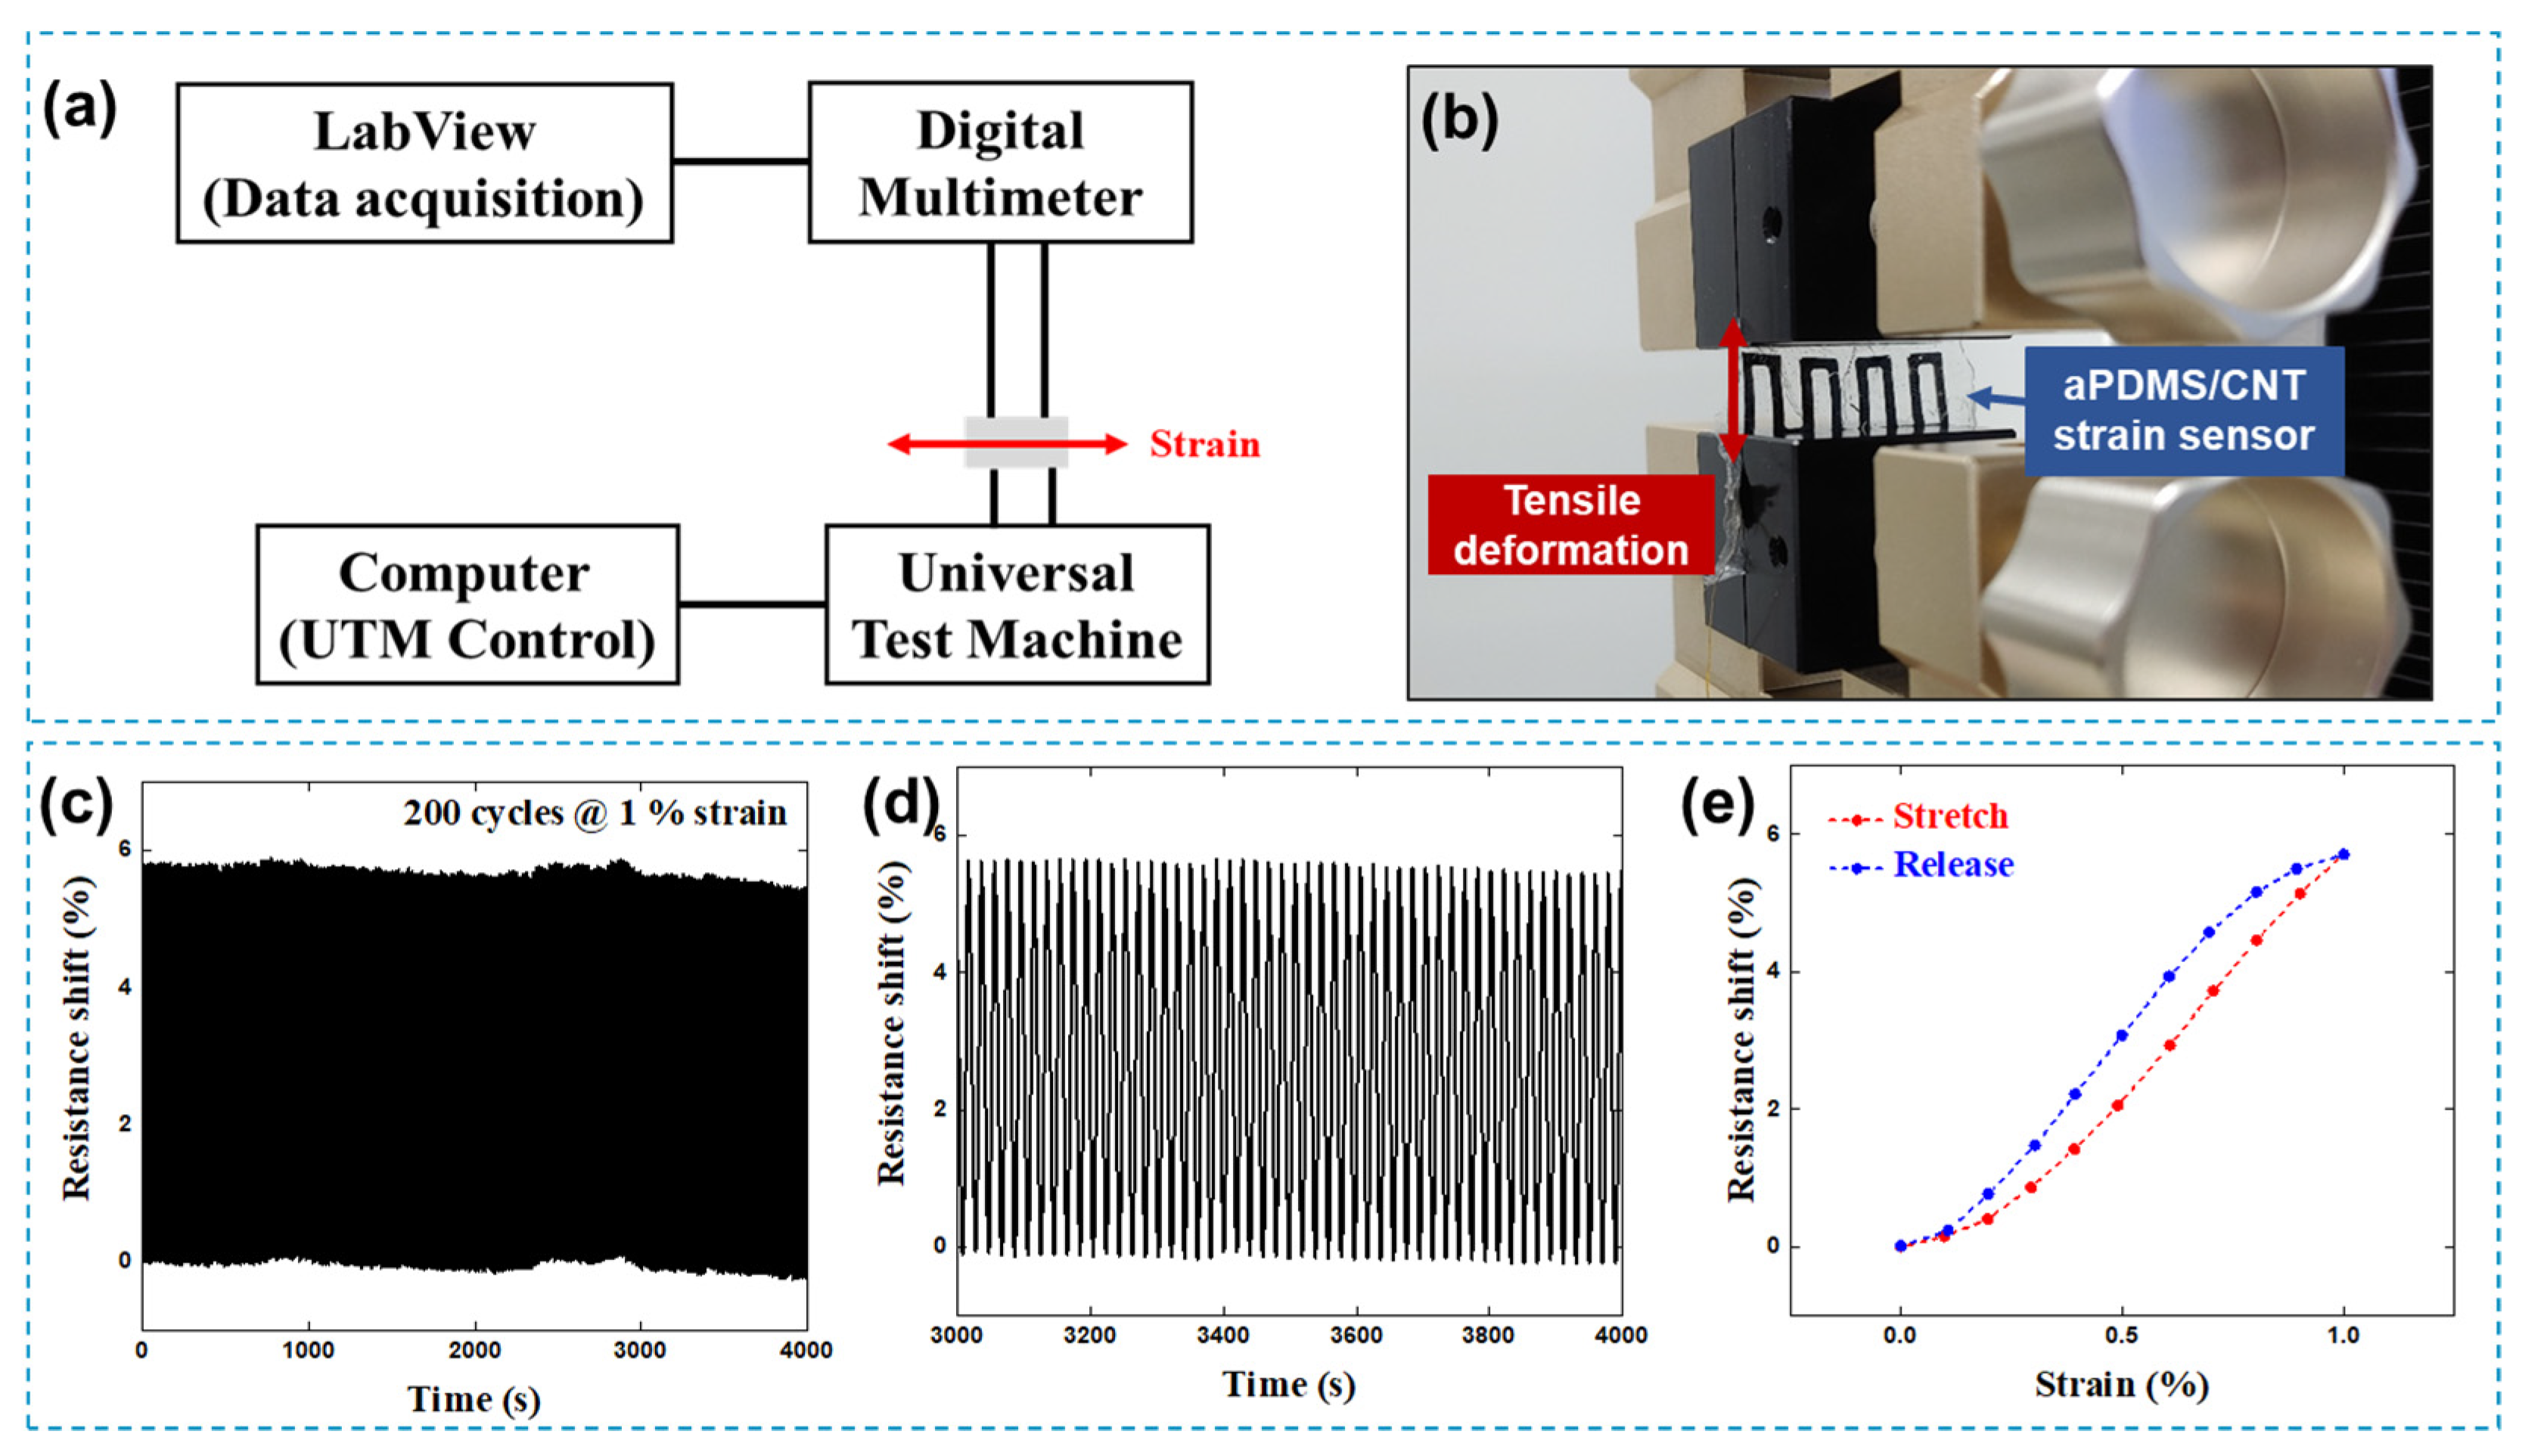
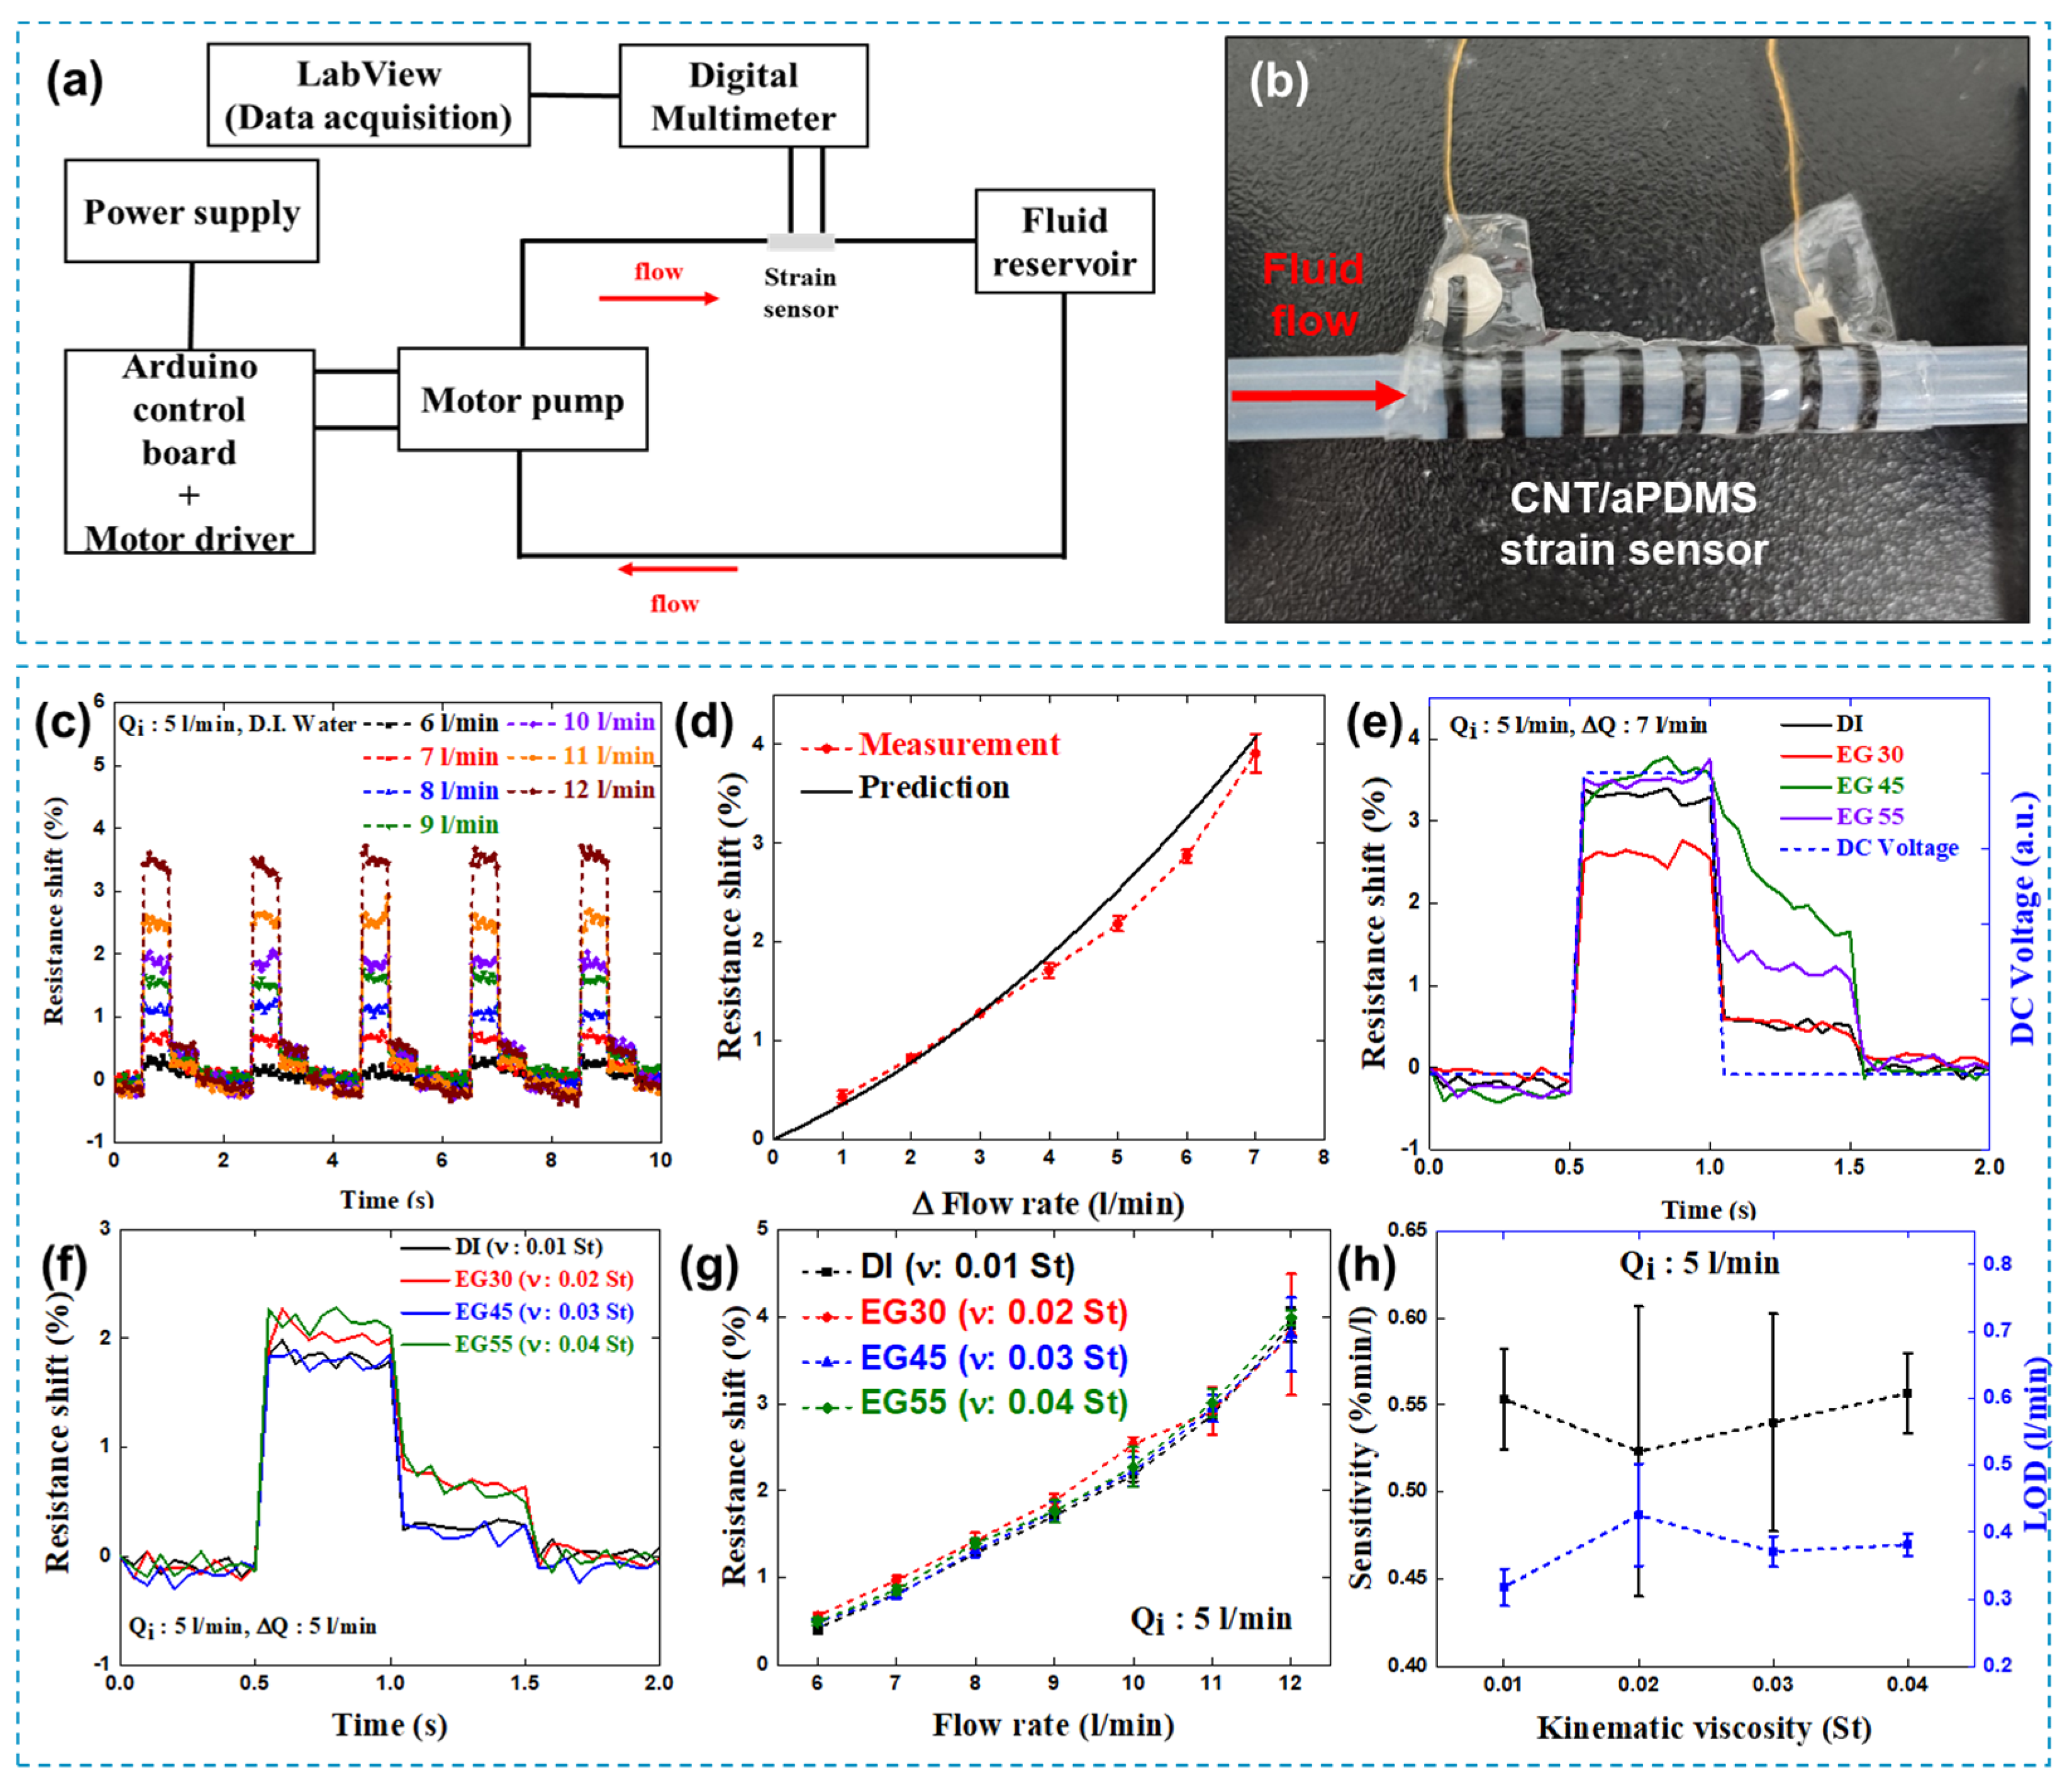
3.3. Sensor Characterization and Measurements

Using the tensile test system consisting of a universal test machine (UTM), we measured the electrical resistance of the sensor depending on the applied strain. The tensile test consists of a UTM to apply tensile strain to the sensor, a computer to control the UTM, a digital multimeter to measure the sensor resistance, and LabVIEW to acquire the data. To characterize the relationship between the flow-rate change and the resistance change, we constructed the flow generator and resistance measurement system consisting of a DC motor pump and a multimeter and measured the resistance change in the sensor depending on the flow-rate change using the measurement system. The experiment setup consists of a flow generation section, including a motor pump, motor driver, power supply, a resistance measurement section including a digital multimeter and LabVIEW, and a circulation section, including a reservoir and tube. The DC motor pump can generate the flow of DI water with a flow rate from 3 L/min to 12 L/min by adjusting the RPM of the motor.
The resistance shift in the PDMS/CNT strain sensor is measured with various fluids and flow rate changes. The base fluid flow in the silicone tube is at 5 L/min, and the flow rate change is from 1 L/min to 7 L/min. For different fluid properties such as density and viscosity, ethylene glycol and DI water mixtures with various weight concentrations are used in this study. The fluids used in this study are described in Table 1. All measurements are taken at ambient conditions of atmospheric pressure and room temperature of 25 °C.

4. Results and Discussion

Figure 1a shows the proposed CNT-PDMS composite strain sensor attached to the silicone tube with a liquid flow. The sensor fabrication adapts a spray-coating method to integrate about 100 nm thick CNT layers, which are patterned using a film mask, patterned via laser cutter, as depicted in Figure 1b. To enhance the CNT-PDMS adhesion, a subsequent annealing process is applied right after the CNT coating. Au wire is connected to ac as electrodes, and the overall sensor resistance is measured to be about 2 kΩ. Figure 1c shows the digital image of the sensor attached to a silicone tube. The sensor implements a serpentine-shaped CNT layer with an odd number of inflection points. Upon strain, the electrical resistance in the sensor shifts, thus, enabling the accurate piezoresistive sensing of the tube’s expansion and contraction under a pulsatile flow. Figure 1d shows a scanning electron microscope (SEM) micrograph of the deposited CNT on an adhesive PDMS film. The CNT bundle forms the electrical networks, thus, forming robust and flexible electrical connections. Figure 1e shows the Raman spectra of a PDMS and the deposited CNT. As shown in the Raman spectrum, deposited CNT shows typical CNT Raman peaks (D peak, G peak, and 2D peaks), showing the used spray-coating method does not degrade the material quality.
Our analytical model can predict the strain induced on the CNT-PDMS strain sensor as a function of the liquid flow rate. Figure 2a shows the schematic of change in a tube’s radius and thickness under the static pressure due to pulsating flow. Using the developed analytical model, the induced strains at varying flow rates (Q), densities (ρ), and dynamic viscosities (μ) are calculated, as shown in Figure 2b. The strain induced by the flow rate change is much larger than the strain induced by the changes in density and viscosity. In most liquids, the variance in density is very small (i.e., less than 5% shift from 0 to 100 °C), so the developed model can be applied to many different types of liquids. The relation between the increase in strain and increase in flow rates is defined by linear fitting with 0.998 of R-square, as below, in Equation (5):
Δ ε = 1.68 Δ Q
In contrast, the change in flow rate can be much more significant and is the dominant parameter that causes a shift in strains of the tube and attached sensor. Optimizing the design of a strain sensor is essential to improve the measurement sensitivity. Figure 2c shows the schematic of the serpentine sensor and the applied strain by pulsating flow. The main design parameters are the total length of the sensor (l) and the number of inflection points (n). For the analysis, the width of the CNT pattern is fixed at 2 mm. The induced strains at different flow rates are predicted using the model for various combinations of the sensor length and the number of inflection points, as shown in Figure 2d. For sensors without a serpentine shape, the amount of strain for a specific flow rate largely depends on the sensor length. The sensitivity, which is proportional to the strain over the flow rate, decreases as the sensor becomes longer, showing that shorter sensors are more suited for pulsatile-flow-rate measurements, as the direction of the strain is perpendicular to the flow direction or the tube length. When the sensor implements the serpentine structure, the sensitivity increases, as most of the sensor is along the induced strain path. For a 10 mm long sensor, the increase in strain is about 66% when we integrate one inflection point. As we increase the number of inflection points, the sensitivity keeps increasing, but its effect is relatively small. Figure 2e shows the calculated induced strains on the CNT layer on the PDMS/CNT flexible sensor, dependent on the location of the sensor from the flow inlet (Le). With the increase in the entrance length, the induced strain dependent on flow-rate change decreases. However, the difference between the strains is minimal. Even at a maximum flow rate of 24 L/min, the change in strain shift is less than 1% from 10 mm to 10,000 mm from the flow inlet. For the final design, we chose seven inflection points for high measurement sensitivity, Le was set at 100 mm, and the total tube length was set at 200 mm.
The change in sensor resistance under strain using the universal testing machine (UTM) is analyzed for the sensor characterization. Figure 3a,b show a schematic of the tensile test system and a digital image of the PDMS/CNT strain sensor mounted on the tensile tester zig. For the tensile test, we applied up to 1% strain, which is the predicted strain of the sensor under a flow rate of about 15 L/m. To verify the stability of the sensor, we performed cyclic testing under 1% strain for 200 cycles, as shown in Figure 3c. For the repetitive tensile strain of 1%, the PDMS/CNT strain sensor’s resistance shift remains stable, showing that our sensor is capable of performing lengthy measurements of pulsatile flows. Figure 3e shows the stretch–release tensile test. Although the shift in electrical resistance does not perfectly overlap during stretching and releasing, the initial and final resistance values remain steady. The hysteresis in resistance response is caused by the recovery process of the CNT network during the release due to the friction force between the CNT and polymer matrix. The time delay leading to the hysteresis is mainly associated with the polymer recovery property [54,55]. The relationship between the resistance change in a sensor and applied strain is defined in Equations (6) and (7), where R is the sensor resistance, ΔR is the change in sensor resistance, and ε is the applied strain. As the sensor response is hyper linear to the applied strain, we divided the result into two linear regions of strain, under 0.25% and over 0.25%, respectively.
Δ R R = 2.04 ε 0.04   ( ε < 0.25 % )
Δ R R = 7.08 ε 1.30   ( 0.25 % < ε < 1 % )
Figure 4a shows the schematic of the measurement system to monitor the sensor response at different fluid-flow rates. The system consists of a motor pump to flow the fluid, a digital multimeter to measure the resistance, a fluid reservoir, and a tube. The pulse width modulation (PWM) using an Arduino control board adjusts the motor pump RPM, i.e., the flow rate of the fluid. With the maximum PWM value (255), the flow rate generated by the motor pump reaches 12 L/min. The pulsatile flow rates, ranging from 5 to 12 L/min, can be controlled by adjusting the PWM value. The time resolution of the motor pump is 100 ms, allowing the analyses of rapidly pulsating flows. Figure 4b shows a digital image of the PDMS/CNT strain sensor attached to the silicone tube under a fluid flow. Figure 4c shows the resistance shifts in the PDMS/CNT strain sensor, depending on the different flow rates for a 0.5 sec pulse at an elevated flow rate. During the experiment, the base flow rate is fixed at 5 L/m. The resistance increases when the flow rate increases due to the applied strain on the tube surface. With the rise in the flow-rate change, the change in resistance increases. As observed in Figure 2b, the increase in fluid flow causes the tensile strain on the tube surface, and with more change in the fluid-flow rate, the induced tensile strain is larger. The change in sensor resistance depends on the shift in the flow rate and matches well with the developed model, with an error of less than 7%, as shown in Figure 4d. The predicted values are calculated from the flow-rate-dependent strain, derived by the analytical modeling, and the strain-dependent resistance, using the experimentally derived Equations (6) and (7). Each datum is the averaged value of 10 measurements, along with an error bar showing the standard deviation.
Figure 4e shows the resistance shift of the sensor and driven DC voltage measured by using various fluids, such as the ethylene glycol solutions composed of deionized water and different weight concentrations of ethylene glycol. Ethylene glycol is chosen as it gives a wide range of viscosities, depending on its concentration. The fluid properties of the used liquid are summarized in Table 1. The measurements are taken at 5 L/m base flow, with a flow rate shift of 7 L/m. Regardless of the difference in fluid viscosities, the PDMS/CNT strain sensor immediately reacts to the rise in flow rate change, exhibiting an excellent response time of 0.05 s, as shown in Figure 4e. This validates that the proposed sensor can be applied to dynamic fluid environments, in various biological and medical applications. For recovery time, there is some delay in the sensor response for some types of liquids, which may be due to the reflected fluid flow from the reservoir. Figure 4f shows the resistance shift in the aPDMS/CNT strain sensor for the fluids with different kinematic viscosities, at a flow rate shift of 5 L/min. Figure 4g shows the sensor response as a function of flow rates for different types of liquids. The sensor response follows a similar trend, regardless of the liquid viscosity. The results indicate the effect of differences in liquid viscosities is small to the strain on the tube. Thus, our sensor can be used for various liquid types while allowing an accurate measurement of the change in flow rates. As our analytical model predicted, the flow rate change is the dominant parameter influencing the sensor’s resistance change. Figure 4h shows the variation in sensitivity and limit of detection (LOD) in the PDMS/CNT strain sensor, depending on fluid kinematic viscosity. LOD is calculated by dividing the sensitivity by the base noise during the measurement. The PDMS/CNT strain sensor sensitivity is about 0.55 %min/L, and LOD is about 0.4 L/min, in the case of DI water. The results show that the proposed sensor can detect changes in flow rates with good sensitivity and LOD.
The proposed sensor platform is suited for monitoring the rapid change in liquid flow rates and can be used to analyze pulsatile flows. We believe the sensor can be applied for steady flows as well, but the sensor response will decay over time as the increase in static pressure will decrease if the flow rate is maintained at a new value for long durations. The sensor is highly adhesive and can even be applied to monitor the strain or vibration on a rigid platform. CNT possesses both metallic and semiconducting nature, and the change in ambient temperature can affect the sensor output. However, the time scale for the resistance change due to thermal effects would be much longer than the resistance change from the flow rate shift. In addition, the presented sensor was analyzed for tube dimensions, with an inner diameter of 3 mm and thickness of 1 mm, considering the actual size of a human artery. The resulted pulsatile-flow-induced strain is within the range of 0–1%. Although the proposed sensor may not be suited for tubes of different sizes, the developed analytical model can be applied to various tube dimensions, enabling the use of this work for the accurate sensing of pulsatile flows in various circumstances.

5. Conclusions

We presented a flexible strain sensor consisting of two aPDMS layers and an MWCNT layer to detect pulsating fluid flow. To analyze the response of our sensor to flow properties, such as fluid-flow rate and fluid property, we developed an analytical model based on fluid energy equations and solid mechanics. The model can accurately predict the strain in a silicone tube, as well as the sensor attached to it, in various flow conditions. The presented fabrication approach allows high-adhesion behavior in the sensor, and the spray-coating method was used to pattern high-quality CNT layers as an active material. We measured the dynamic response of the adhesive PDMS/MWCNT strain sensor using fluids with kinematic viscosity, ranging from 0.01 St to 0.04 St. The sensor measures the resistance shift from disconnection and reconnection of MWCNT junctions, caused by the tube deformation induced by flow rates changing from 5 L/min to 12 L/min. Thus, the sensor is capable of detecting the resistance shift in a sensor induced by a sudden change in flow rate. In addition, the developed sensor can accurately monitor the shift in flow rates, regardless of the liquid kinematic viscosity, which is due to the small effect of kinematic viscosity on the static pressure acting inside the tube at altering flow rates. The sensitivity and LOD of the strain sensor are about 0.55 %min/L and 0.4 L/min, respectively. We believe that the PDMS/CNT strain sensor can be integrated into many bio and medical applications, such as an artificial blood vessel or pulse-rate monitoring system and drug injection monitoring system.

Author Contributions

C.R.: Conceptualization, methodology, formal analysis, writing—original draft preparation; J.P.: data curation, investigation; I.R.J.: experiment, investigation; S.I.J.; data curation, formal analysis, H.J.K.: writing—review and editing, supervision, funding acquisition. All authors have read and agreed to the published version of the manuscript.

Funding

This work was supported by the Basic Science Research Program through the National Research Foundation of Korea (NRF), funded by the Ministry of Science and ICT of Korea (2021R1C1C1011588).

Institutional Review Board Statement

Not applicable.

Informed Consent Statement

Not applicable.

Data Availability Statement

Not applicable.

Conflicts of Interest

The authors declare no conflict of interest.

References

  1. Zhang, D.-Y.; Zuo, W.-M.; Zhang, D.; Zhang, H.-Z.; Li, N.-M. Wrist blood flow signal-based computerized pulse diagnosis using spatial and spectrum features. J. Biomed. Sci. Eng. 2010, 3, 361–366. [Google Scholar] [CrossRef] [Green Version]
  2. Zironi, G.; Gaiani, S.; Fenyves, D.; Rigamonti, A.; Bolondi, L.; Barbara, L. Value of measurement of mean portal flow velocity by Doppler flowmetry in the diagnosis of portal hypertension. J. Hepatol. 1992, 16, 298–303. [Google Scholar] [CrossRef]
  3. Nizar, K.; Deutsch, M.; Filmer, S.; Weizman, B.; Beloosesky, R.; Weiner, Z. Doppler studies of the ovarian venous blood flow in the diagnosis of adnexal torsion. J. Clin. Ultrasound 2009, 37, 436–439. [Google Scholar] [CrossRef] [PubMed]
  4. Reiter, G.; Reiter, U.; Kovacs, G.; Olschewski, H.; Fuchsjäger, M. Blood flow vortices along the main pulmonary artery measured with MR imaging for diagnosis of pulmonary hypertension. Radiology 2015, 275, 71–79. [Google Scholar] [CrossRef] [Green Version]
  5. El Sankari, S.; Gondry-Jouet, C.; Fichten, A.; Godefroy, O.; Serot, J.M.; Deramond, H.; Meyer, M.E.; Balédent, O. Cerebrospinal fluid and blood flow in mild cognitive impairment and Alzheimer’s disease: A differential diagnosis from idiopathic normal pressure hydrocephalus. Fluids Barriers CNS 2011, 8, 12. [Google Scholar] [CrossRef] [Green Version]
  6. Tang, D.; Yang, C.; Huang, Y.; Ku, D.N. Wall stress and strain analysis using a three-dimensional thick-wall model with fluid-structure interactions for blood flow in carotid arteries with stenoses. Comput. Struct. 1999, 72, 341–356. [Google Scholar] [CrossRef]
  7. Lee, K.W.; Xu, X.Y. Modelling of flow and wall behaviour in a mildly stenosed tube. Med. Eng. Phys. 2002, 24, 575–586. [Google Scholar] [CrossRef]
  8. Saito, M.; Ikenaga, Y.; Matsukawa, M.; Watanabe, Y.; Asada, T.; Lagrée, P.Y. One-dimensional model for propagation of a pressure wave in a model of the human arterial network: Comparison of theoretical and experimental results. J. Biomech. Eng. 2011, 133, 1–9. [Google Scholar] [CrossRef] [Green Version]
  9. Hirsch, S.; Klatt, D.; Freimann, F.; Scheel, M.; Braun, J.; Sack, I. In vivo measurement of volumetric strain in the human brain induced by arterial pulsation and harmonic waves. Magn. Reson. Med. 2013, 70, 671–683. [Google Scholar] [CrossRef]
  10. Vilkomerson, D.; Chilipka, T. Implantable doppler system for self-monitoring vascular grafts. In Proceedings of the IEEE Ultrasonics Symposium, Montreal, QC, Canada, 23–27 August 2004; Volume 1, pp. 461–465. [Google Scholar]
  11. Ejeian, F.; Azadi, S.; Razmjou, A.; Orooji, Y.; Kottapalli, A.; Warkiani, M.E.; Asadnia, M. Design and applications of MEMS flow sensors: A review. Sens. Actuators A Phys. 2019, 295, 483–502. [Google Scholar] [CrossRef]
  12. Kuo, J.T.W.; Yu, L.; Meng, E. Micromachined thermal flow sensors-A review. Micromachines 2012, 3, 550–573. [Google Scholar] [CrossRef] [Green Version]
  13. Balakrishnan, V.; Dinh, T.; Phan, H.P.; Dao, D.V.; Nguyen, N.T. Highly sensitive 3C-SiC on glass based thermal flow sensor realized using MEMS technology. Sens. Actuators A Phys. 2018, 279, 293–305. [Google Scholar] [CrossRef]
  14. Idjeri, B.; Laghrouche, M.; Boussey, J. Wind Measurement Based on MEMS Micro-Anemometer with High Accuracy Using ANN Technique. IEEE Sens. J. 2017, 17, 4181–4188. [Google Scholar] [CrossRef]
  15. Shikida, M.; Yoshikawa, K.; Iwai, S.; Sato, K. Flexible flow sensor for large-scale air-conditioning network systems. Sens. Actuators A Phys. 2012, 188, 2–8. [Google Scholar] [CrossRef]
  16. Ghouila-Houri, C.; Gallas, Q.; Garnier, E.; Merlen, A.; Viard, R.; Talbi, A.; Pernod, P. High temperature gradient calorimetric wall shear stress micro-sensor for flow separation detection. Sens. Actuators A Phys. 2017, 266, 232–241. [Google Scholar] [CrossRef] [Green Version]
  17. Hasegawa, Y.; Kawaoka, H.; Yamada, T.; Matsushima, M.; Kawabe, T.; Shikida, M. Respiration and heartbeat signal detection from airflow at airway in rat by catheter flow sensor with temperature compensation function. J. Micromech. Microeng. 2017, 27, 125016. [Google Scholar] [CrossRef]
  18. Sazhin, O. Liquid flow meter based on a thermal anemometer microsensor. J. Appl. Fluid Mech. 2016, 9, 1991–1996. [Google Scholar] [CrossRef]
  19. Kersjes, R.; Eichholz, J.; Langerbein, A.; Manoli, Y.; Mokwa, W. An integrated sensor for invasive blood-velocity measurement. Sens. Actuators A Phys. 1993, 37, 674–678. [Google Scholar] [CrossRef]
  20. Fiorillo, A.S.; Critello, C.D.; Pullano, A.S. Theory, technology and applications of piezoresistive sensors: A review. Sens. Actuators A Phys. 2018, 281, 156–175. [Google Scholar] [CrossRef]
  21. Takahashi, H.; Nakai, A.; Shimoyama, I. Waterproof airflow sensor for seabird bio-logging using a highly sensitive differential pressure sensor and nano-hole array. Sens. Actuators A Phys. 2018, 281, 243–249. [Google Scholar] [CrossRef]
  22. Kottapalli, A.G.P.; Tan, C.W.; Olfatnia, M.; Miao, J.M.; Barbastathis, G.; Triantafyllou, M. A liquid crystal polymer membrane MEMS sensor for flow rate and flow direction sensing applications. J. Micromech. Microeng. 2011, 21, 085006. [Google Scholar] [CrossRef]
  23. Mistry, K.K.; Mahapatra, A. Design and simulation of a thermo transfer type MEMS based micro flow sensor for arterial blood flow measurement. Microsyst. Technol. 2012, 18, 683–692. [Google Scholar] [CrossRef]
  24. Zhang, Q.; Ruan, W.; Wang, H.; Zhou, Y.; Wang, Z.; Liu, L. A self-bended piezoresistive microcantilever flow sensor for low flow rate measurement. Sens. Actuators A Phys. 2010, 158, 273–279. [Google Scholar] [CrossRef]
  25. Sharma, P.; Motte, J.F.; Fournel, F.; Cross, B.; Charlaix, E.; Picard, C. A Direct Sensor to Measure Minute Liquid Flow Rates. Nano Lett. 2018, 18, 5726–5730. [Google Scholar] [CrossRef]
  26. Kottapalli, A.G.P.; Bora, M.; Kanhere, E.; Asadnia, M.; Miao, J.; Triantafyllou, M.S. Cupula-inspired hyaluronic acid-based hydrogel encapsulation to form biomimetic MEMS flow sensors. Sensors 2017, 17, 1728. [Google Scholar] [CrossRef] [Green Version]
  27. Sengupta, D.; Kottapalli, A.G.P.; Chen, S.H.; Miao, J.M.; Kwok, C.Y.; Triantafyllou, M.S.; Warkiani, M.E.; Asadnia, M. Characterization of single polyvinylidene fluoride (PVDF) nanofiber for flow sensing applications. AIP Adv. 2017, 7, 105205. [Google Scholar] [CrossRef]
  28. Liang, Z.; Guo, X.; Yang, B.; Zhang, T. Design and characterization of a novel biaxial bionic hair flow sensor based on resonant sensing. Sensors 2020, 20, 4483. [Google Scholar] [CrossRef] [PubMed]
  29. Kottapalli, A.G.P.; Asadnia, M.; Karavitaki, K.D.; Warkiani, M.E.; Miao, J.; Corey, D.P.; Triantafyllou, M. Engineering biomimetic hair bundle sensors for underwater sensing applications. AIP Conf. Proc. 2018, 1965, 160003. [Google Scholar]
  30. Kottapalli, A.G.P.; Asadnia, M.; Hans, H.; Miao, J.M.; Triantafyllou, M.S. Harbor seal inspired MEMS artificial micro-whisker sensor. In Proceedings of the 2014 IEEE 27th International Conference on Micro Electro Mechanical Systems (MEMS), San Francisco, CA, USA, 26–30 January 2014; Volume 3, pp. 741–744. [Google Scholar]
  31. Kuoni, A.; Holzherr, R.; Boillat, M.; de Rooij, N.F. Polyimide membrane with ZnO piezoelectric thin film pressure transducers as a differential pressure liquid flow sensor. J. Micromech. Microeng. 2003, 13, S103. [Google Scholar] [CrossRef]
  32. Riza, M.A.; Go, Y.I.; Harun, S.W.; Maier, R.R.J. FBG Sensors for Environmental and Biochemical Applications—A Review. IEEE Sens. J. 2020, 20, 7614–7627. [Google Scholar] [CrossRef]
  33. Zhengyong, Z.L.; Liu, H.-Y.T. Hwa-Yaw Tam Industrial and medical applications of fiber Bragg gratings (Invited Paper). Chin. Opt. Lett. 2016, 14, 120007–120011. [Google Scholar] [CrossRef]
  34. Liu, Z.; Zhang, A.P.; Tam, H.-Y. Microfluidic device integrated with FBG in Co2+ -doped fiber to measure flow rate with nL/s sensitivity. In Proceedings of the 23rd International Conference on Optical Fiber Sensors, Santander, Spain, 2–6 June 2014; Volume 9157, p. 91573I. [Google Scholar]
  35. Gao, S.; Zhang, A.P.; Tam, H.-Y.; Cho, L.H.; Lu, C. All-optical fiber anemometer based on laser heated fiber Bragg gratings. Opt. Express 2011, 19, 10124. [Google Scholar] [CrossRef] [PubMed] [Green Version]
  36. Yang, Y.; Hong, C.; Abro, Z.A.; Wang, L.; Yifan, Z. A new Fiber Bragg Grating sensor based circumferential strain sensor fabricated using 3D printing method. Sens. Actuators A Phys. 2019, 295, 663–670. [Google Scholar] [CrossRef]
  37. Cheng, L.K.; Schiferli, W.; Nieuwland, R.A.; Franzen, A.; den Boer, J.J.; Jansen, T.H. Development of a FBG vortex flow sensor for high-temperature applications. In Proceedings of the 21st International Conference on Optical Fiber Sensors, Ottawa, ON, Canada, 15–19 May 2011; Volume 7753, p. 77536V. [Google Scholar]
  38. Liu, Z.; Htein, L.; Cheng, L.-K.; Martina, Q.; Jansen, R.; Tam, H.-Y. Miniature FBG-based fluidic flowmeter to measure hot oil and water. In Proceedings of the 25th Optical Fiber Sensors Conference, Jeju, Korea, 24–28 April 2017; Volume 10323, p. 1032336. [Google Scholar]
  39. Watanabe, S.; Hasegawa, Y.; Matsushima, M.; Kawabe, T.; Shikida, M. Micromachined Tube Type Thermal Flow Sensor for Adult-Sized Tracheal Intubation Tube. Proceedings 2017, 1, 357. [Google Scholar]
  40. Yoshida, H.; Hasegawa, Y.; Matsushima, M.; Sugiyama, T.; Kawabe, T.; Shikida, M. Miniaturization of respiratory measurement system in artificial ventilator for small animal experiments to reduce dead space and its application to lung elasticity evaluation. Sensors 2021, 21, 5123. [Google Scholar] [CrossRef]
  41. Case, M.; Micheli, M.; Arroyo, D.; Hillard, J.; Kocanda, M. Ultrasonic blood flow sensing using doppler velocimetry. Int. J. Smart Sens. Intell. Syst. 2013, 6, 1298–1316. [Google Scholar] [CrossRef] [Green Version]
  42. Lin, M.; Marshall, C.T.; Qi, Y.; Johnston, S.M.; Badea, C.T.; Piantadosi, C.A.; Johnson, G.A. Quantitative blood flow measurements in the small animal cardiopulmonary system using digital subtraction angiography. Med. Phys. 2009, 36, 5347–5358. [Google Scholar] [CrossRef] [Green Version]
  43. Badheka, A.; Stucker, S.E.; Turek, J.W.; Raghavan, M.L. Efficacy of Flow Monitoring during ECMO. ASAIO J. 2017, 63, 496–500. [Google Scholar] [CrossRef]
  44. Seto, R.; Matsuoka, F.; Soh, T.; Itoh, T.; Okada, H.; Masuda, T.; Umeda, T.; Maeda, I.; Tsukamoto, K.; Suzuki, K.; et al. A micro optical blood flow sensor and its application to detection of avian influenza. In Proceedings of the TRANSDUCERS 2009-2009 International Conference on Solid-State Sensors, Actuators and Microsystems, Denver, CO, USA, 21–25 June 2009; pp. 2326–2329. [Google Scholar]
  45. Iwasaki, W.; Nogami, H.; Takeuchi, S.; Furue, M.; Higurashi, E.; Sawada, R. Detection of site-specific blood flow variation in humans during running by a wearable laser Doppler flowmeter. Sensors 2015, 15, 25507–25519. [Google Scholar] [CrossRef] [Green Version]
  46. Nogami, H.; Iwasaki, W.; Matsuoka, F.; Akase, K.; Kimura, Y.; Onoe, A.; Higurashi, E.; Takeuchi, S.; Kido, M.; Furue, M. Micro integrated laser Doppler blood flow sensor and its application to dehydration prevention. In Proceedings of the 2009 IEEE 3rd International Conference on Nano/Molecular Medicine and Engineering, Tainan, Taiwan, 18–21 October 2009; pp. 215–220. [Google Scholar]
  47. Cannata, J.M.; Chilipka, T.; Yang, H.; Han, S.; Ham, S.W.; Rowe, V.L.; Weaver, F.A.; Shung, K.K.; Vilkomerson, D. Development of a flexible implantable sensor for postoperative monitoring of blood flow. J. Ultrasound Med. 2012, 31, 1795–1802. [Google Scholar] [CrossRef] [Green Version]
  48. Cong, P.; Young, D.J.; Ko, W.H. Novel long-term implantable blood pressure monitoring system. Proc. IEEE Sensors 2004, 3, 1359–1362. [Google Scholar]
  49. Wang, M.; Chen, J. Volumetric flow measurement using an implantable CMUT array. IEEE Trans. Biomed. Circuits Syst. 2011, 5, 214–222. [Google Scholar] [CrossRef] [PubMed]
  50. Kim, J.; Chou, E.F.; Le, J.; Wong, S.; Chu, M.; Khine, M. Soft Wearable Pressure Sensors for Beat-to-Beat Blood Pressure Monitoring. Adv. Healthc. Mater. 2019, 8, 1–9. [Google Scholar] [CrossRef] [PubMed]
  51. Park, S.J.; Kim, J.; Chu, M.; Khine, M. Flexible Piezoresistive Pressure Sensor Using Wrinkled Carbon Nanotube Thin Films for Human Physiological Signals. Adv. Mater. Technol. 2018, 3, 1–7. [Google Scholar] [CrossRef]
  52. Boutry, C.M.; Beker, L.; Kaizawa, Y.; Vassos, C.; Tran, H.; Hinckley, A.C.; Pfattner, R.; Niu, S.; Li, J.; Claverie, J.; et al. Biodegradable and flexible arterial-pulse sensor for the wireless monitoring of blood flow. Nat. Biomed. Eng. 2019, 3, 47–57. [Google Scholar] [CrossRef]
  53. Kartmann, S.; Koch, F.; Koltay, P.; Zengerle, R.; Ernst, A. Single-use capacitive pressure sensor employing radial expansion of a silicone tube. Sens. Actuators A Phys. 2016, 247, 656–662. [Google Scholar] [CrossRef]
  54. Fan, Q.; Qin, Z.; Gao, S.; Wu, Y.; Pionteck, J.; Mäder, E.; Zhu, M. The use of a carbon nanotube layer on a polyurethane multifilament substrate for monitoring strains as large as 400%. Carbon 2012, 50, 4085–4092. [Google Scholar] [CrossRef]
  55. Amjadi, M.; Yoon, Y.J.; Park, I. Ultra-stretchable and skin-mountable strain sensors using carbon nanotubes-Ecoflex nanocomposites. Nanotechnology 2015, 26, 375501. [Google Scholar] [CrossRef]
Figure 1. (a) A schematic of adhesive PDMS (a−PDMS)/CNT strain sensor; (b) fabrication process of the sensor implementing the CNT spray deposition; (c) image of the a-PDMS/CNT sensor; (d) an SEM micrograph of the deposited CNT; (e) Raman analysis of a-PDMS and the deposited CNT.
Chemosensors 10 00187 g001
Figure 2. (a) Changes in radius and thickness of a tube under the static pressure due to the pulsating flow; (b) increase in tube strain for vayring flow rate (Q), density (ρ), and dynamic viscosity (μ) calculated from theoretical modeling; (c) schematic of PDMS/CNT flexible strain sensor with applied strain; (d) the induced strain on the CNT layer on the PDMS/CNT flexible sensor w/various sensor designs under the various flow rate; (e) the induced strains on the CNT layer on the PDMS/CNT flexible sensor dependent on flow-rate change for different entrance lengths.
Chemosensors 10 00187 g002
Figure 3. (a) Schematic and (b) a digital image of the tensile tester system consisting of a universal testing machine (UTM) and a digital multimeter; (c,d) shift in electrical resistance of an a-PDMS/CNT strain sensor under a repetitive 1% strain test; (e) shift in electrical resistance of the sensor under one cycle of stretch and release.
Chemosensors 10 00187 g003
Figure 4. (a) Schematic of the fluid−flow measurement system consisting of a motor pump to flow the fluid, digital multimeter to measure the resistance, fluid reservoir, and tube; (b) photograph of aPDMS/CNT strain sensor rolled on the silicone tube with a fluid flow; (c) resistance shift depending on the different flow rate for five cycles of flow-rate change with DI water; (d) the comparison between the measured average change in resistance as a function of the change in fluid-flow rate (each point is an averaged value of 10 measurements) and the predicted change in resistance from analytical modeling; (e) resistance shifts and driven DC voltage depending on flow rate changes with various fluids such as deionized water, the ethylene glycol solutions with different weight concentrations; (f,g) resistance shift depending on fluids with different kinematic viscosities; (h) variations in sensitivity and LOD depending on fluid kinematic viscosity.
Chemosensors 10 00187 g004
Table 1. Properties of fluids used in the presented study.
FluidDensity
[kg/m3]
Viscosity
[cP]
Kinematic Viscosity
[St]
DI10001.000.01
EG3010402.160.02
EG4510603.220.03
EG5510724.300.04
Publisher’s Note: MDPI stays neutral with regard to jurisdictional claims in published maps and institutional affiliations.

