Article

A New Benzoxazole-Based Fluorescent Macrocyclic Chemosensor for Optical Detection of Zn2+ and Cd2+

1
Department of Pure and Applied Sciences, University of Urbino, via della Stazione 4, 61029 Urbino, Italy
2
Department of Chemistry and Biology, University of Salerno, via Giovanni Paolo II 132, 84084 Fisciano, SA, Italy
*
Authors to whom correspondence should be addressed.
These authors contributed equally to this work.
Submission received: 20 April 2022 / Revised: 12 May 2022 / Accepted: 15 May 2022 / Published: 17 May 2022

Abstract

:
Background: Benzoxazole-containing ligands find many applications both in medicinal chemistry, catalysis and fluorescence chemosensing. Benzoxazole-containing macrocycles could be therefore a good strategy to achieve stable and selective fluorescent complexes with suitable metal ions. In this work, the synthesis, binding, and photochemical properties of a new fluorescent ligand (L) are reported. L is a cyclophane macrocycle containing the 1,3-bis(benzo[d]oxazol-2-yl)phenyl (BBzB) fluorophore and an aliphatic tetra-amine chain to form the macrocyclic skeleton. Methods: Spectrophotometric and spectrofluorimetric measurements, 1H NMR analysis, and DFT calculations were performed. Results: L behaves as a PET-mediated chemosensor, being emissive at 390 nm at acidic pH and non-emissive at basic pH. The chemosensor is able to detect Zn2+ and Cd2+ in an aqueous medium (acetonitrile–water, 4:1 v/v) at neutral pH through a CHEF effect upon metal ion coordination. Paramagnetic metal ions (Cu2+) and heavy atoms (Pb2+, Hg2+) resulted in a quenching of fluorescence or very low emission. Conclusions: The new cyclophane macrocycle L was revealed to be a selective PET-regulated chemosensor for Zn2+ and Cd2+ in an aqueous medium, being able to bind up to two and one metal cations, respectively. The molecule showed a shifted emission towards the visible region compared to similar systems, suggesting a co-planar conformation of the aromatic fragment upon metal coordination. All these data are supported by both experimental measurements and theoretical calculations.

Graphical Abstract

1. Introduction

Benzoxazoles (BZs) represent a common and versatile class of heterocycles. Numerous natural products showing biological activities contain BZ moieties (e.g., the fungal-derived antibiotic Caboxamycin and anticancer agent Nocarbenzoxazole G, the marine-derived anticancer agent Nakijinol B and antitubercular agent Pseudopteroxazole) [1]; indeed, many BZ fragments are often used as building blocks in medicinal chemistry for the synthesis of compounds with pharmacological activities (antimicrobial, antitumor, anti-inflammatory, antihistaminic, anti-helmintic, anti-tubercular, anticonvulsant, hypoglycaemic, HIV-1 reverse transcriptase inhibitor, just to name a few) [2,3]. More applications are derived from the excellent metal ion chelating properties of BZs. Transition metal complexes of BZ derivatives have been employed in the synthesis of metal catalysts [4], while other complexes have shown luminescence properties in the solid state [5,6].
Transition metal ions, such as Zn2+ and Cd2+ in particular, and optical methodologies devoted to their detection and quantification have long attracted attention from researchers [7,8,9,10,11,12,13,14,15,16,17,18,19,20,21,22,23,24,25,26]. Both metal ions feature a closed-shell d10 configuration and, as a consequence, show similar chemical properties. Nevertheless, whilst Zn2+ is essential to life (playing crucial roles in many biological processes, such as regulation of apoptosis, signal transmission, gene expression, and enzyme function) [27,28], Cd2+ is toxic for animals and human beings and is classified as a human carcinogen [29,30,31,32,33]. Notably, Zn2+ could also become an issue for humans, since its deficiency results in an unbalanced metabolism, which could give rise to several neurological dysfunctions [34,35], while excessive amounts can cause cytotoxicity, arousing disorders such as skin disease, diabetes, prostatic adenocarcinoma, and pancreatic islets dysfunction [36].
In light of the desirable development of effective methods for monitoring Cd2+ and Zn2+ levels in biological and environmental matrices, and following our interest in fluorescent chemosensors for metal cations [16,17,37,38], we exploited the luminescence and coordination properties of BZs to develop a new BZ-based polyamine macrocycle able to bind and signal the presence of Cd2+ and Zn2+ in solution for possible analytical applications. A macrocycle topology has been exploited due to the greater selectivity they offer compared to open-chain ligands and the higher stability of their metal complexes [39,40,41]. Ligand L (Hexacyclo [28.3.1.12,5.126,29.09,4.022,27]-35,36-dioxa-3,11,14,17,20,28-hexaaza-2,4,6,8,22,24,26,28,30,32,134-tetratricontaendecaene, Figure 1) has been synthesized by incorporating the 1,3-bis(benzo[d]oxazol-2-yl)phenyl (BBzB) fluorophore [42,43,44,45,46], containing two BZ units attached at positions 1 and 3 of a benzene ring, into a polyamine cyclophane macrocycle. The molecule contains two distinct compartments: 1,4,7,10-tetraazadecane polyamine as the binding unit, able to coordinate metal ions, and conjugated BBzB as the signaling unit, which could also participate in the coordination of guest species.
Herein, the synthesis and sensing properties in solution towards transition metal ions of the ligand L are reported. 1H NMR, UV-Vis and fluorescence spectroscopies, and DFT calculations were performed to assess the binding ability of the system towards Cd2+ and Zn2+.

2. Materials and Methods

2.1. General Methods

All chemicals were purchased in the highest quality commercially available (Merck, Milan, Italy). The solvents were RP grade, unless otherwise indicated, and used without further purification. All reactions involving moisture-sensitive reagents were carried out under a nitrogen atmosphere using standard vacuum line techniques and glassware that was flame-dried before use. Elemental analyses were performed with a Thermo Finnigan Flash 1112 EA CHN analyzer (Milan, Italy. Mass spectra were performed with an Agilent 1200 Series HPLC system equipped with a binary pump and a C18 column (Phenomenex Synergi™ 4 µm Fusion-RP 80 Å, LC Column 50 × 2 mm2, Ea, Agilent Technologies, Milan, Italy), coupled to a SCIEX mod. API 4000 QqQ triple quadrupole mass spectrometer with ESI source (SCIEX, Milan, Italy). The High-Resolution Mass Spectrum of L was performed with an Orbitrap Exploris 240 Mass Spectrometer (Thermo Fisher Scientific, Milan, Italy) by direct infusion at 5 microliters per minute and resolution set to 180K FWHM. AGC target was set to standard mode and Max Injection time was set to 100 ms.

2.2. Synthesis

2.2.1. 1,3-bis(4-Methyl-2-benzoxazolyl)phenyl (3)

2-Amino-m-cresol (2, 18.4 g, 150 mmol) and commercially available isophthalic acid (1, 12.4 g, 75 mmol) were suspended in polyphosphoric acid (PPA, 120.0 g) and heated overnight at 200 °C. The reaction mixture was allowed to cool down to room temperature (RT) and was poured into 3 dm3 of water at 0 °C. After neutralization with Na2CO3, the mixture was filtered, and the residue was washed with methanol and dried under reduced pressure, obtaining product 3 as a white solid (18.6 g, yield 73%). 1H NMR (400 MHz, CDCl3, 25 °C) δ = 2.73 (s, 6H), 7.20 (d, J = 7.3 Hz, 2H), 7.30 (t, J = 7.8 Hz, 2H), 7.47 (d, J = 8.1 Hz, 2H), 7.70 (t, J = 7.8 Hz, 1H), 8.46 (dd, J1 = 7.8 Hz, J2 = 1.8 Hz, 2H), 9.14 (t, J = 1.5 Hz, 1H) ppm.

2.2.2. 1,3-bis(4-Bromomethyl-2-benzoxazolyl)phenyl (4)

A solution of 3 (2.0 g, 6.0 mmol), N-bromosuccynimide (NBS, 7.0 mmol), and 2,2′-azobis(2-methylpropionitrile) (AIBN, 1.20 mmol) in 50 mL of CCl4 was refluxed for 24 h under a nitrogen atmosphere, and then the reaction mixture was allowed to cool down to RT. The obtained white precipitate was filtered off and the filtrate was concentrated under vacuum. The crude residue was crystallized from methanol, giving pure 4 as a pink solid (1.5 g, yield 50%). 1H NMR (400 MHz, CDCl3, 25 °C) δ = 5.00 (s, 4H), 7.74–7.41 (m, 7H), 8.50 (dd, J = 7.8, 1.8 Hz, 2H), 9.16 (t, J = 1.8Hz, 1H) ppm (Figure S1). 13C NMR (100 MHz, CDCl3, 25 °C) δ = 27.6, 110.8, 124.7, 125.6, 126.9, 127.0, 128.0, 129.6, 130.7, 140.8, 150.9, 162.2 ppm (Figure S2). MS-ESI (m/z): calculated 498.95 (100%), 496.95 (51.4%), 500.95 (48.6%); found 497.3, 499.1, 501.3 for [M + H]+ (Figure S3).

2.2.3. Hexacyclo[28.3.1.12,5.126,29.09,4.022,27]-35,36-dioxa-3,11,14,17,20,28-hexaaza-2,4,6,8,22,24,26,28,30,32,134-tetratricontaendecaene tetrahydrobromide (L·4HBr)

A solution of 1,4,7,10-tetrakis(4-toluensulphonyl)-1,4,7,9-tetraazadecane [47] (5, 3.0 mmol) in 200 cm3 of anhydrous dimethylformamide (DMF) was added to an excess of K2CO3 (4 g, 30 mmol) and refluxed under a nitrogen atmosphere. To this mixture, a suspension of the brominated fluorophore 4 (1.5 g, 3 mmol) in 100 cm3 of anhydrous DMF was added over a period of 8 h. After the addition, the mixture was refluxed for a further 12 h. Then, the reaction mixture was allowed to cool down to RT and the solid residue was filtered off. The filtrate was concentrated and put into cold water, obtaining a yellow precipitate that was collected by filtration and dried. The crude product was then used in the next step without further purification.
The yellow solid was suspended under a nitrogen atmosphere in 15 mL of 48% HBr/CH3COOH; next, phenol was added (2.5 g, 27.0 mmol), and then the mixture was heated at 90 °C for 24 h. The reaction was then allowed to cool down to RT. The obtained brown precipitate was collected by filtration and then washed with 2 mL mixture of ethanol and water (99:1), obtaining pure product L·4HBr as a white solid. Finally, the ligand was purified by re-crystallization from hot ethanol (1.48 g, yield 61%). 1H NMR (400 MHz, D2O, 25 °C) δ 3.27 (s, 4H), 3.40 (t, J = 7.0 Hz, 4H), 3.49 (t, J = 6.5 Hz, 4H), 4.63 (s, 4H), 7.34–7.44 (m, 4H), 7.63–7.74 (m, 3H), 8.23 (dd, J = 7.8, 1.9 Hz, 2H), 8.89 (s, 1H), ppm. 13C NMR (100 MHz, D2O, 25 °C) δ = 43.2, 43.4, 43.9, 46.6, 112.9, 120.9, 126.4, 126.5, 126.8, 127.1, 130.4, 131.0, 140.3, 150.5, 163.1 ppm (Figure S4). HRMS: (positive mode, m/z) calculated 483.2508, found 483.2503 for [M + H]+ (Figure S5). Anal. for C28H34Br4N6O2 (806.23): calculated C 41.71, H 4.25, N 10.42; found C 41.5, H 4.4, N 10.3.

2.3. UV-Vis and Fluorescence Measurements

Spectrophotometric measurements were carried out at 298.1 K using a Varian Cary 100 spectrophotometer equipped with a temperature control unit. Uncorrected emission spectra were obtained with a Varian Cary Eclipse fluorescence spectrophotometer. Luminescence quantum yields were determined using 2,2′-biphenol in acetonitrile (Φ = 0.29) [48].
UV-Vis and fluorescence emission screenings of L were performed in variable acetonitrile–aqueous HEPES (0.001 mol dm−3, pH 7.4) solvent mixtures (% aqueous HEPES: from 100 to 20% with respect to ACN) at 25 °C, with a ligand concentration of 3.2 × 10⁻⁶ mol dm−3 and by exciting at λex = 305 nm.
UV-Vis and fluorescence emission titrations of L were performed in acetonitrile–aqueous medium 80:20 v/v at 25 °C, with a ligand concentration of 3.2 × 10⁻⁶ mol dm−3 and exciting at λex = 305 nm. pH titrations of L were performed in acetonitrile/water in the 2–12 pH range; the pH was adjusted by using 0.01 mol dm−3 HCl and NaOH solutions. Titrations with Zn(ClO4)2 and Cd(ClO4)2 were performed by adding to a solution of the ligand (10 cm3) in acetonitrile–aqueous HEPES (0.001 mol dm−3, pH 7.4) increasing volumes of aqueous solutions of the metal ions (0.1 equivalents at a time up to 5 equivalents).
Limit of detection (LOD) and limit of quantitation (LOQ) were calculated by linear regression of normalized emission intensity as a function of concentration of Zn2+ and Cd2+ [49] (for more details, see Supplementary Material).

2.4. NMR Studies

1H and 13C NMR spectra were recorded on a Bruker Avance 400 instrument (Bruker Italia, Milan, Italy), operating at 400.13 and 100.61 MHz, respectively, and equipped with a variable temperature controller. The temperature of the NMR probe was calibrated using 1,2-ethanediol as a calibration sample. Chemical shifts (δ scale) are presented in ppm and referenced by residual solvent peak. Coupling constants (J values) are given in hertz (Hz). 1H-1H and 1H-13C correlation experiments were performed to assign the signals. All measurements were performed at 298.1 K, in mixed acetonitrile–d3/D2O 60:40 v/v solution (to prevent solubility issues) for the pH titration, and in D2O for titrations with Zn(ClO4)2 and Cd(ClO4)2, at a ligand concentration of 5 × 10⁻³ mol dm3. The pH titration was performed in the pH range of 2–12, starting from pH 2 and raising the pH by using a KOD solution. Titrations with Zn(ClO4)2 and Cd(ClO4)2 were performed at pH 7.4 by adding the metal ions dissolved in D2O 0.1 equivalents at a time directly in the NMR tube.

2.5. Computational Analysis

The structures of L and of its complexes with Zn2+ and Cd2+ were optimized with Gaussian 09 software [50] and calculated for an isolated molecule using Density Functional Theory (DFT) [51,52,53,54,55] at the BP86/6-31G(d,p) and B3LYP/TZVP level of theory for the ligand and BP86/LanL2DZ and B3LYP/LanL2DZ [56] for the complexes. For more details, see the Supplementary Material.

3. Results and Discussion

3.1. Synthesis

The synthetic route to obtain ligand L is depicted in Scheme 1. The BBzB fluorophore 3 was obtained by adapting a known procedure [42], via a double condensation of two equivalents of isophthalic acid (1) with one equivalent of 2-amino-m-cresol (2) in the presence of polyphosphoric acid. Compound 4, obtained by benzylic bromination of 3, was reacted with 1,4,7,10-tetrakis(4-toluensulphonyl)-1,4,7,9-tetraazadecane (5) [47] via Richmann–Atkins anellation [57,58]. In brief, this is a double nucleophilic substitution performed in high-dilution conditions to avoid polymer formation and favor the cyclization reaction. After the removal of the four protecting sulphonyl groups on the amine functions by treatment with HBr in acetic acid in the presence of phenol as a scavenger, the ligand was obtained as tetrahydrobromide salt (L·4HBr).

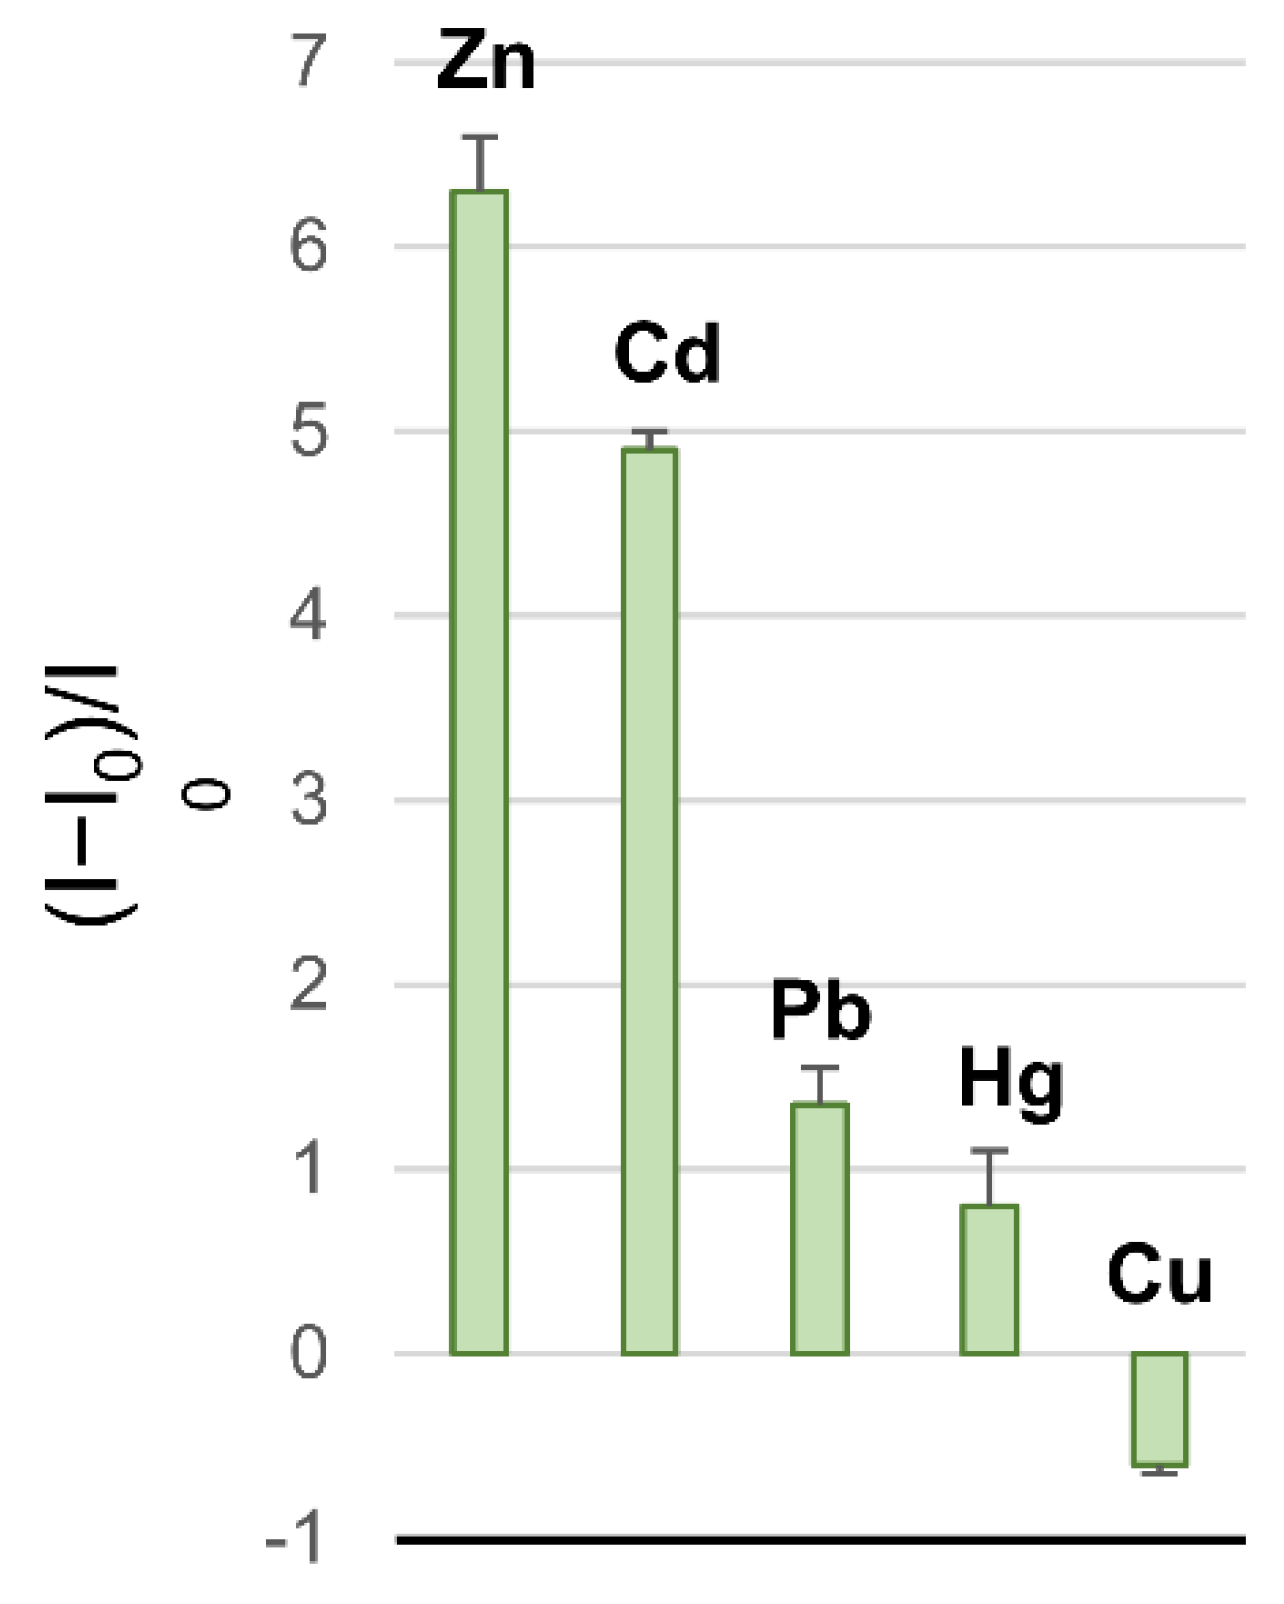
3.2. Preliminary Screening

To assess the better experimental conditions to investigate the photochemical properties of the ligand, solutions of L in different ratios of water (HEPES buffer, pH 7.4) and acetonitrile (ACN) were analyzed (Figure 2). The emission of the ligand increased along with the percentage of the aqueous solution: in a photoinduced intramolecular electron transfer (PET)-mediated sensor, this would suggest a higher protonation degree of the ligand, translating to a more efficient prevention of the PET effect and a higher fluorescence emission (vide infra).
A preliminary screening towards the Cd2+ ion was performed in the same mixed aqueous solutions (from 20 to 100% aqueous HEPES buffer with respect to ACN), revealing that working in ACN—aqueous HEPES buffer (pH 7.4) in a 4:1 v/v ratio returned the best performance of the system, with the emission increase upon the addition of the metal ion being the highest within the series (3.4-fold at 20% aqueous HEPES vs. 2.4-, 1.2-, 0.5-, and 0.1-fold at 40, 60, 80, and 100% aqueous HEPES, respectively; Figure 3).

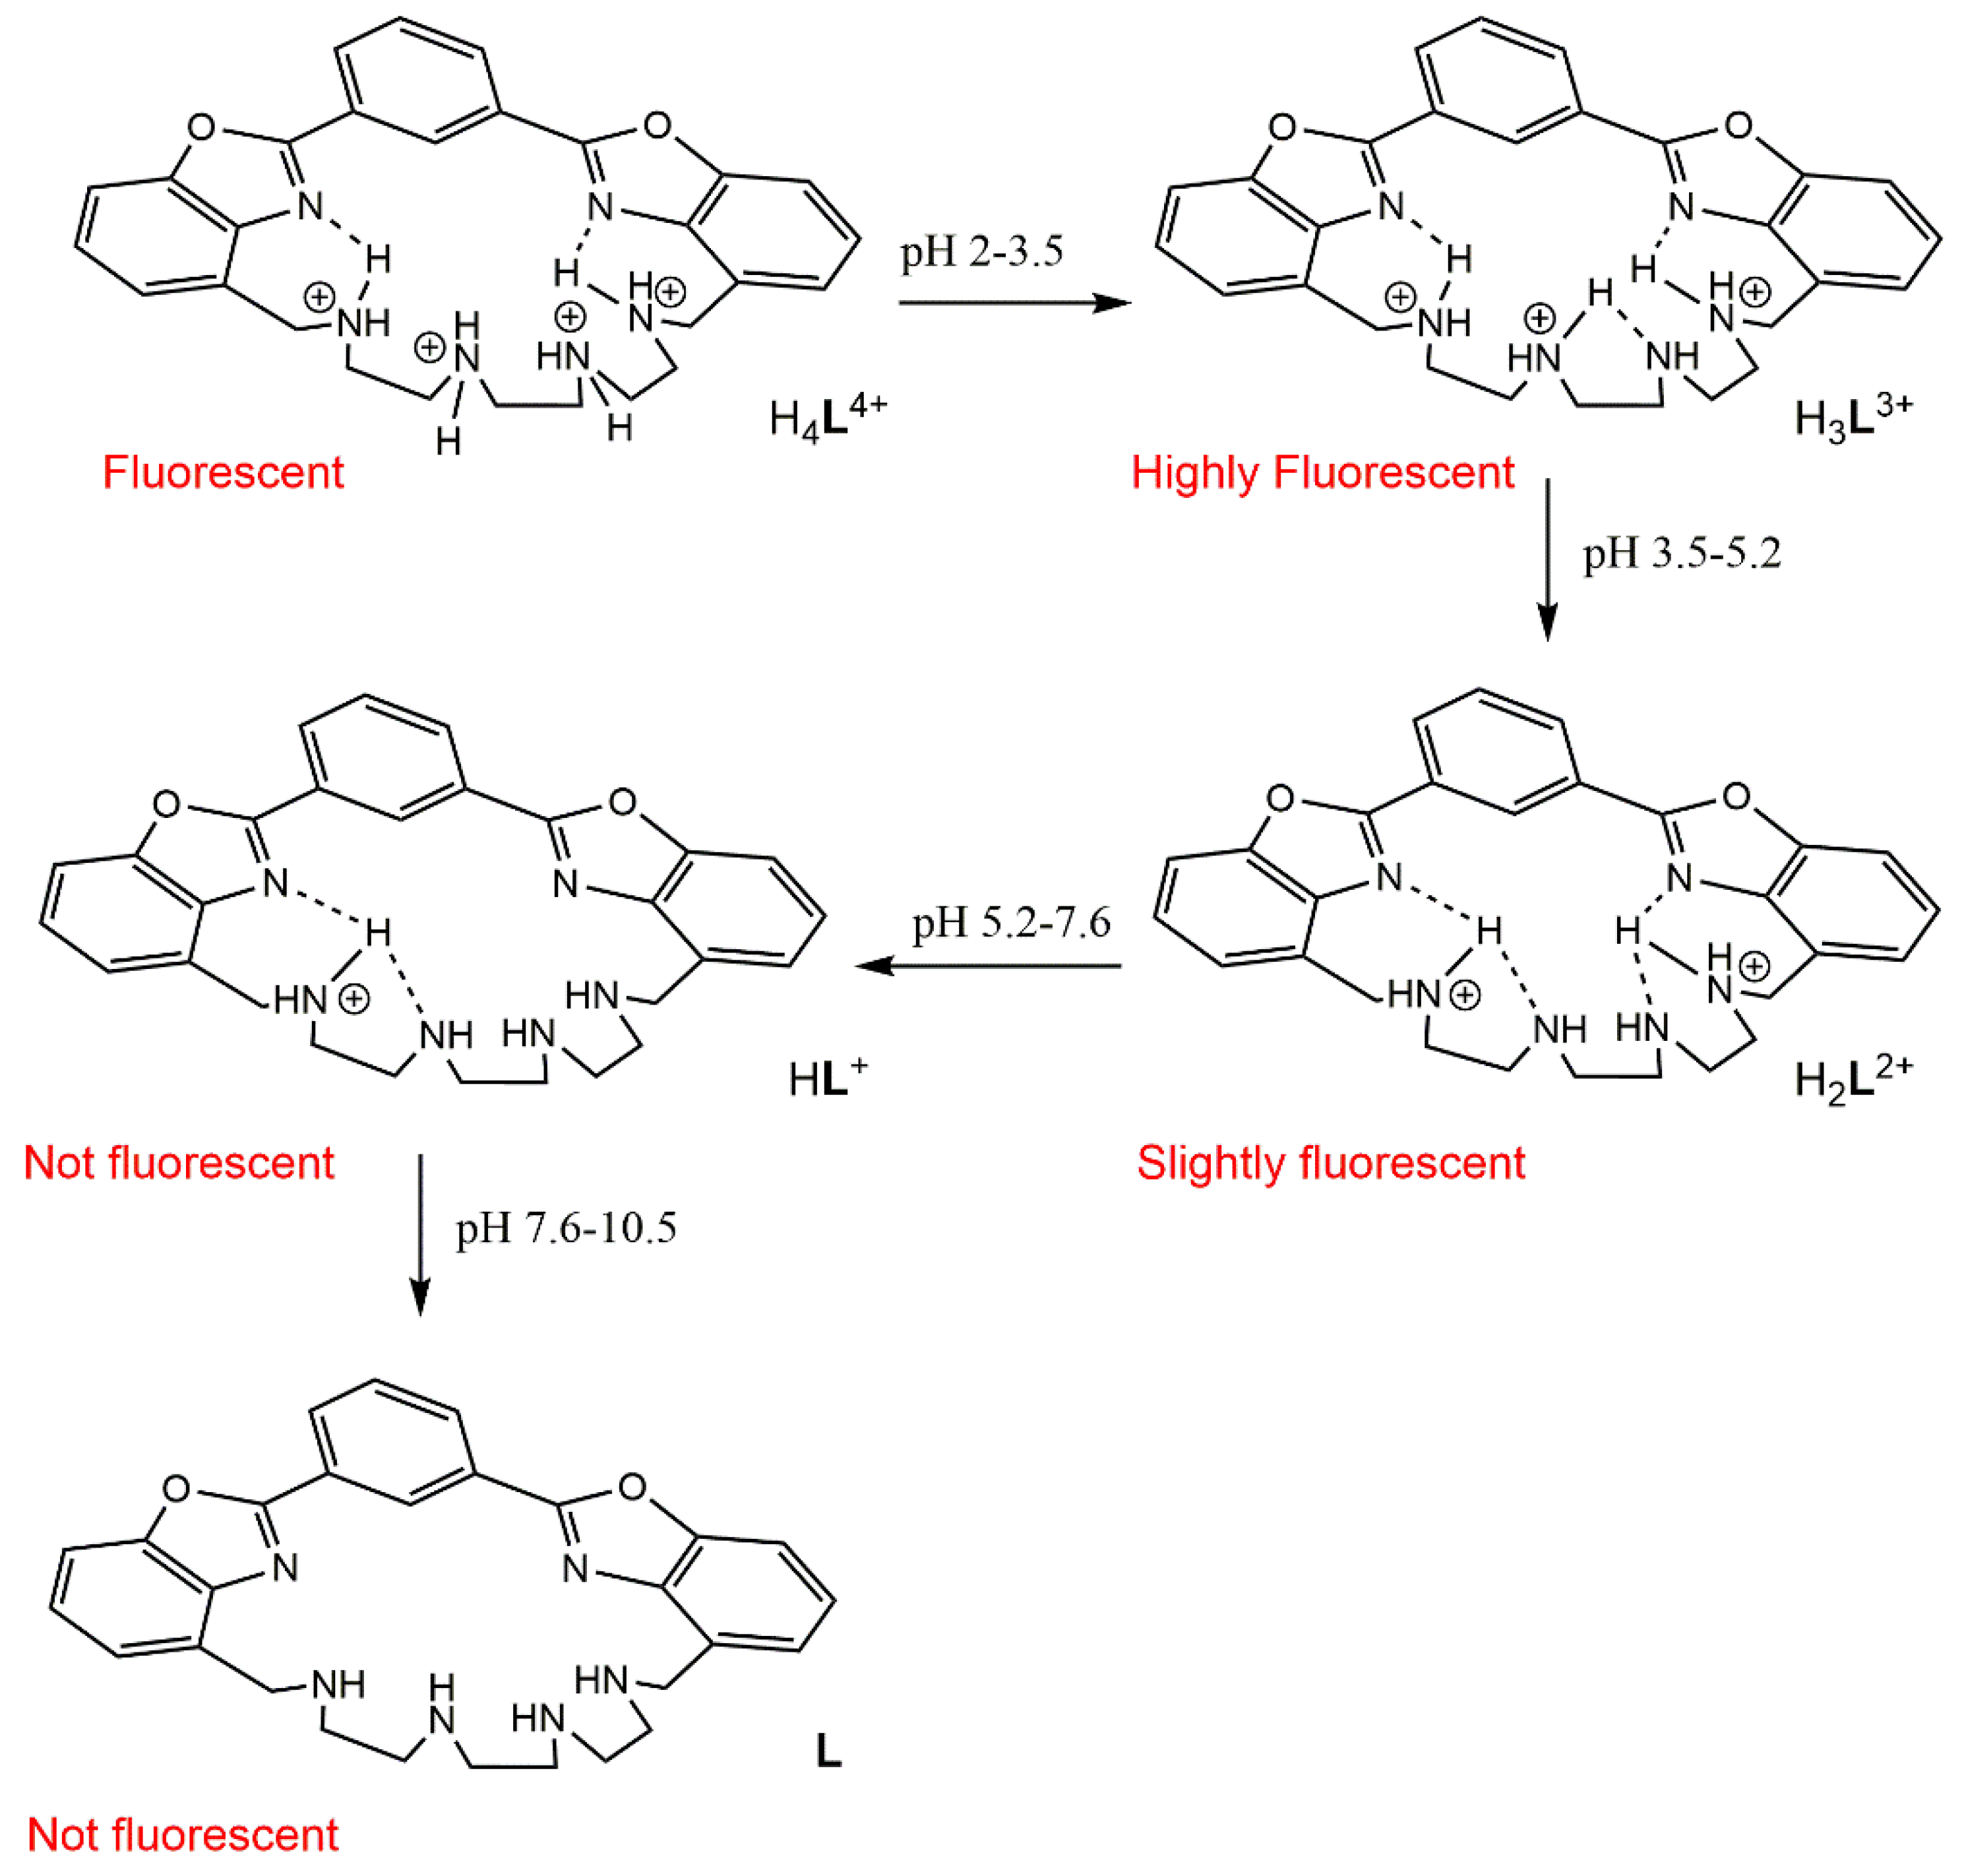
3.3. Acid–Base Behavior

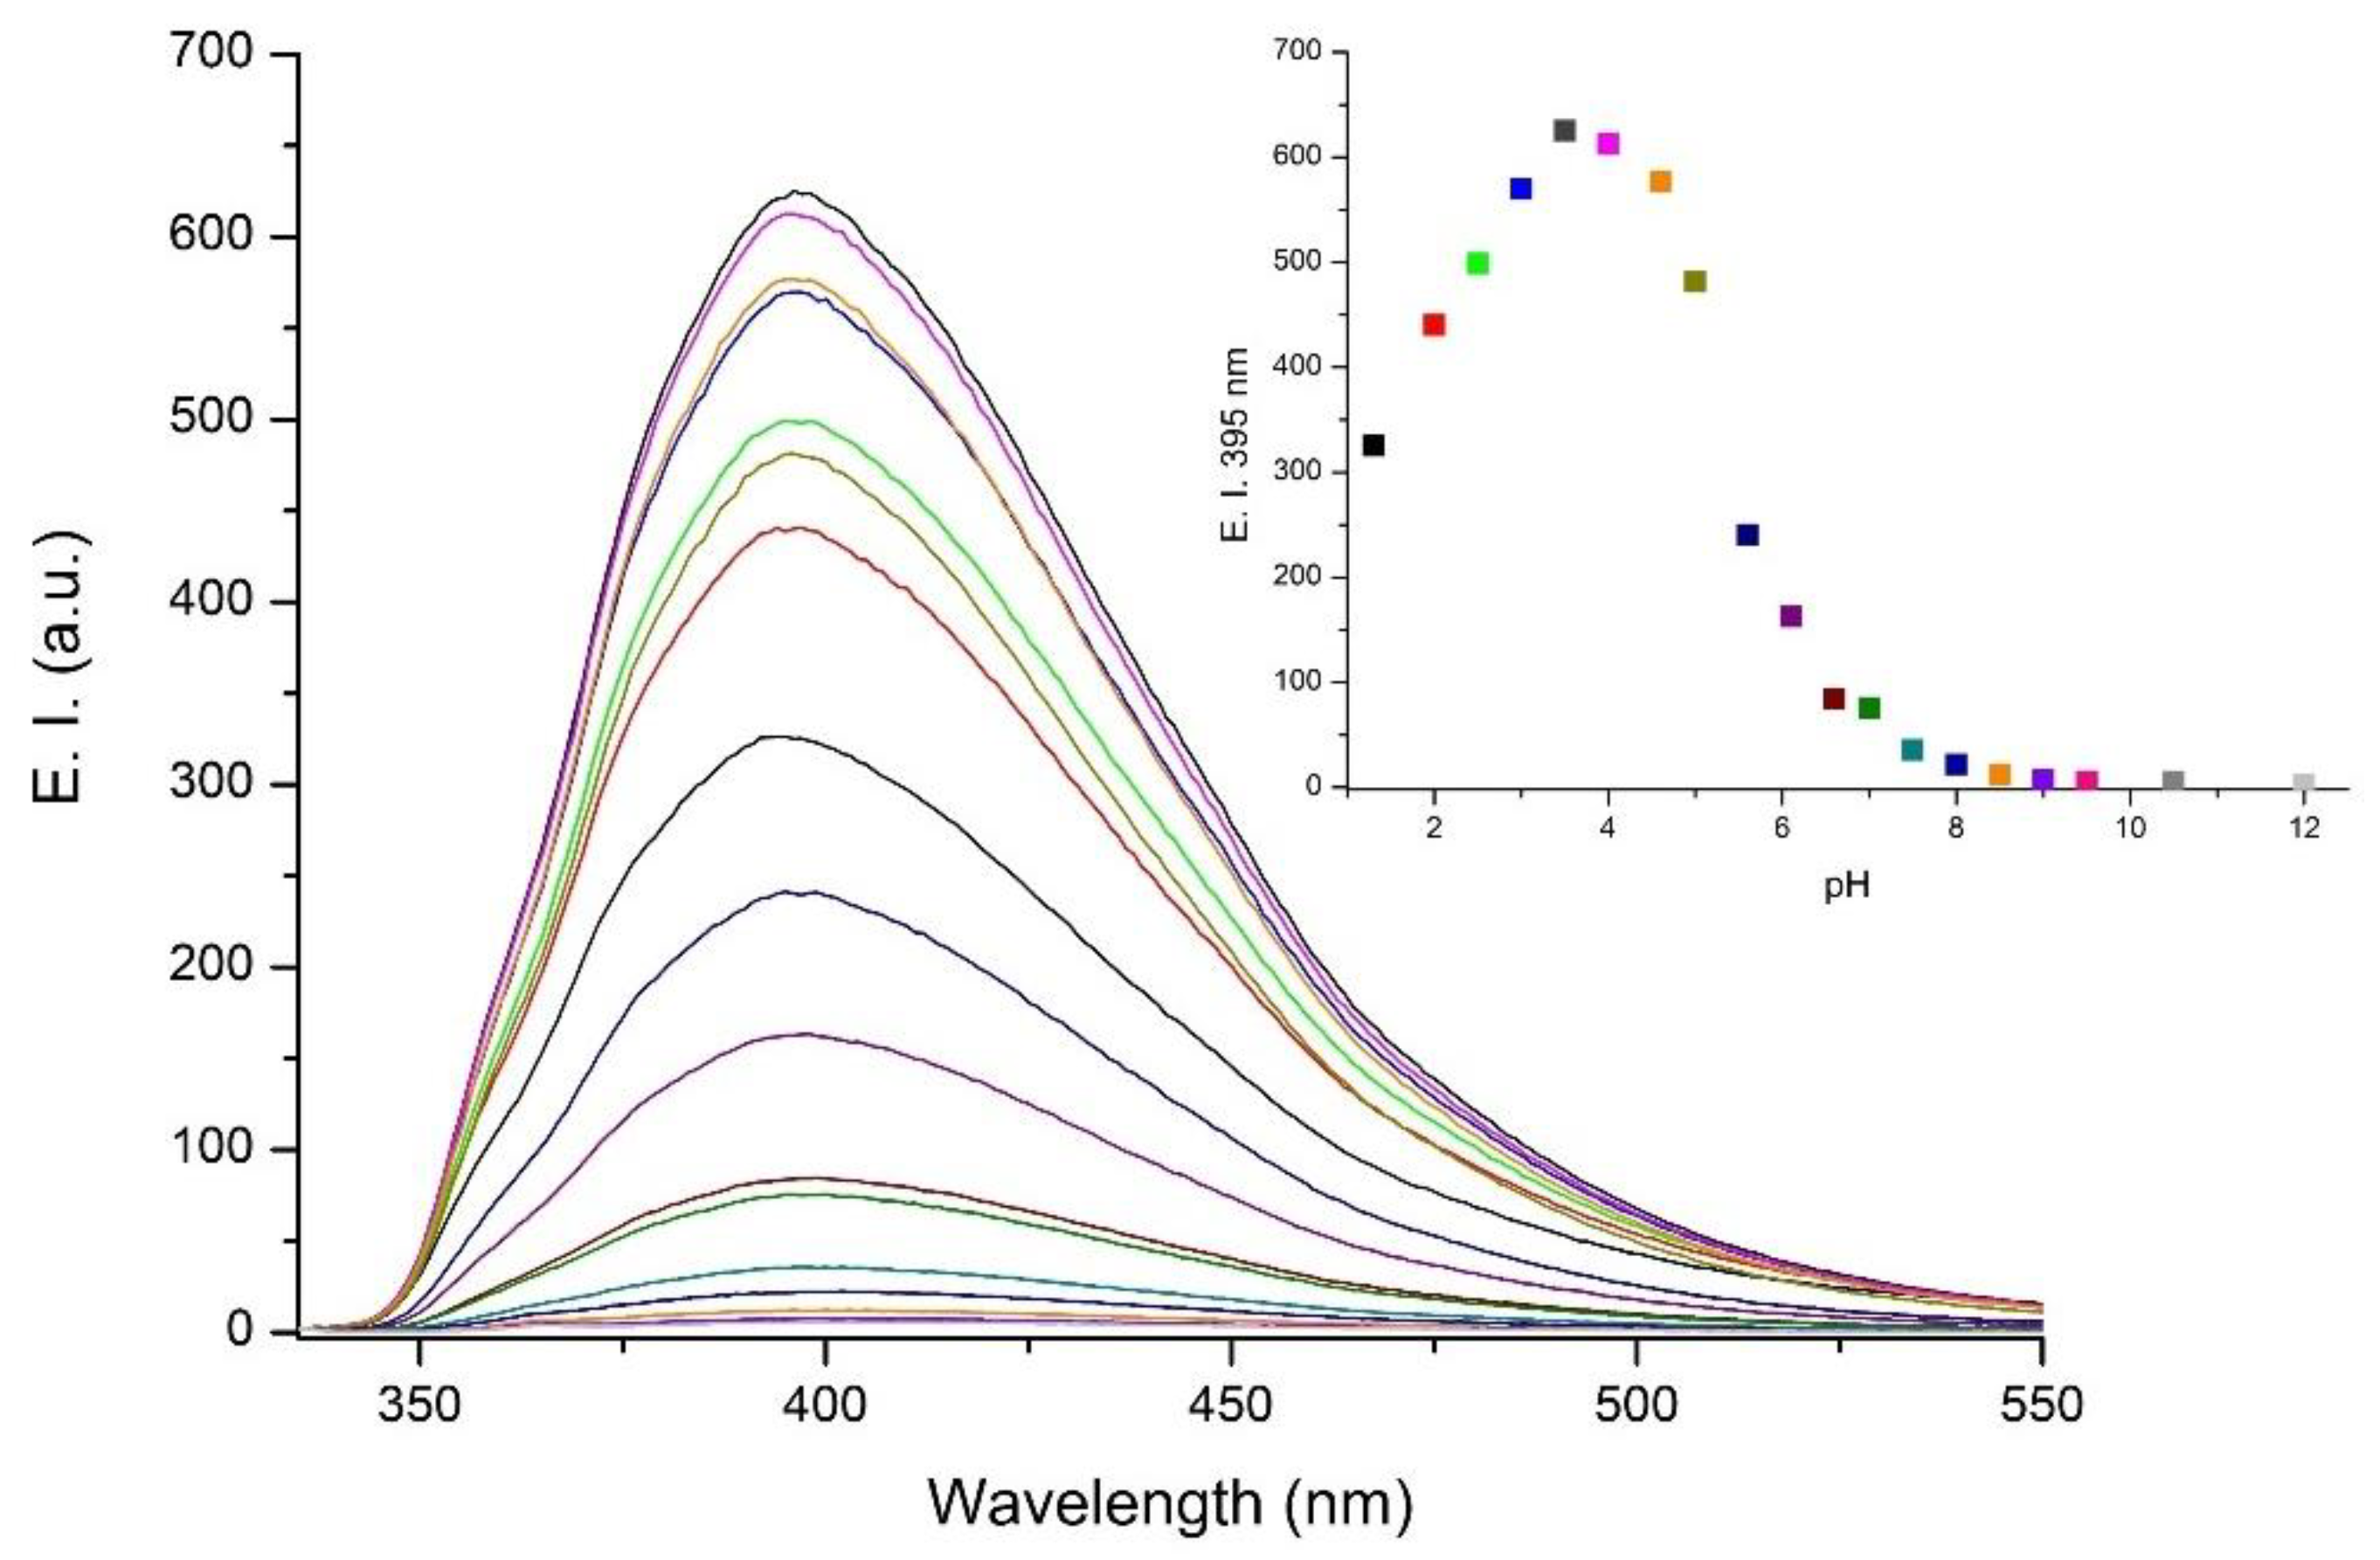
3.3.1. UV-Vis Studies

After ascertaining the better performance of the system in ACN—water in a 4:1 v/v ratio, the acid–base behavior of the ligand was investigated under the same experimental conditions by spectrophotometric and spectrofluorimetric analysis. Spectra at different pH values were recorded to understand the role of the BBzB fluorophore in the acid–base behavior of the system.
Under the present experimental conditions, the free ligand shows two absorption bands at 234 nm (ε = 18,440 cm−1mol−1dm3) and 305 nm (ε = 36,250 cm−1mol−1dm3). While UV-Vis absorption measurements did not show any significant variation, the fluorescence emission is strongly pH dependent (Figure 4). By exciting at 305 nm at acidic pH (2), the ligand featured a strong emission with a maximum at λem = 402 nm; when increasing the pH, the emission also increased, doubling its value and reaching the maximum at pH 3.5. Then, the emission dropped down, with the system becoming totally quenched above pH 9.5. This behavior can be rationalized in terms of quenching of the excited state due to the PET effect from the HOMO of the polyamine nitrogen atoms to the excited fluorophore moiety [59]. In similar systems, it has been observed that the PET-mediated quenching of the fluorescence, which occurs when at least one amine function sufficiently close to the fluorophore is neither protonated nor involved in any hydrogen bond, is mainly due to the benzyl nitrogen atoms [60,61,62,63,64,65].
Considering these spectroscopic data, the pKa and the proton distribution in similar systems [62,63,65], and the key role of the benzylic nitrogen lone pairs in the quenching mechanism [61,62], it can be suggested that at pH 2, the fully protonated and fluorescent H4L4+ species probably prevails in solution; the increase in the emission intensity between pH 2 and 3.5 suggests that a deprotonation process occurs in this pH range, forming the H3L3+ species, and, more likely, a central amine function of the tetraamine chain, rather than an amine function in the benzylic position, is involved in the deprotonation step. In addition, the emission increase with the pH could be explained by a decrease of the molecular stiffness on moving from H4L4+ to H3L3+ species, as commonly observed in polyaza-macrocycles [62]. As a consequence, the conformation adopted by the BBzB system in the two species could be affected differently, resulting in H4L4+ being less emissive than H3L3+. This behavior goes along with the hypothesis that in the H4L4+ and H3L3+ emissive species, both benzyl nitrogen atoms are supposed to be protonated and the PET effect is prevented.
Above pH 3.5, the emission trend indicates further deprotonation processes at least up to pH 9.5, where the emission became totally quenched. In the 3.5–9.5 pH range, two deprotonation steps could be hypothesized to give the H2L2+ and HL+ species. The observed emission drop suggests that the deprotonation involves the benzylic nitrogen atoms, partially restoring the PET effect at a high pH. The PET effect, however partial, is enough to make the emission drop by 87% upon moving from pH 3.5 to 7, with total quenching above pH 9.5. This reminds us that in similar systems, where the emission is PET regulated, a free lone pair on an amine function in benzylic position is enough to quench the emission; thus, it is presumable that above pH 9.5, at least one of the two nitrogen atoms of L in the benzylic position resulted in nonprotonation.

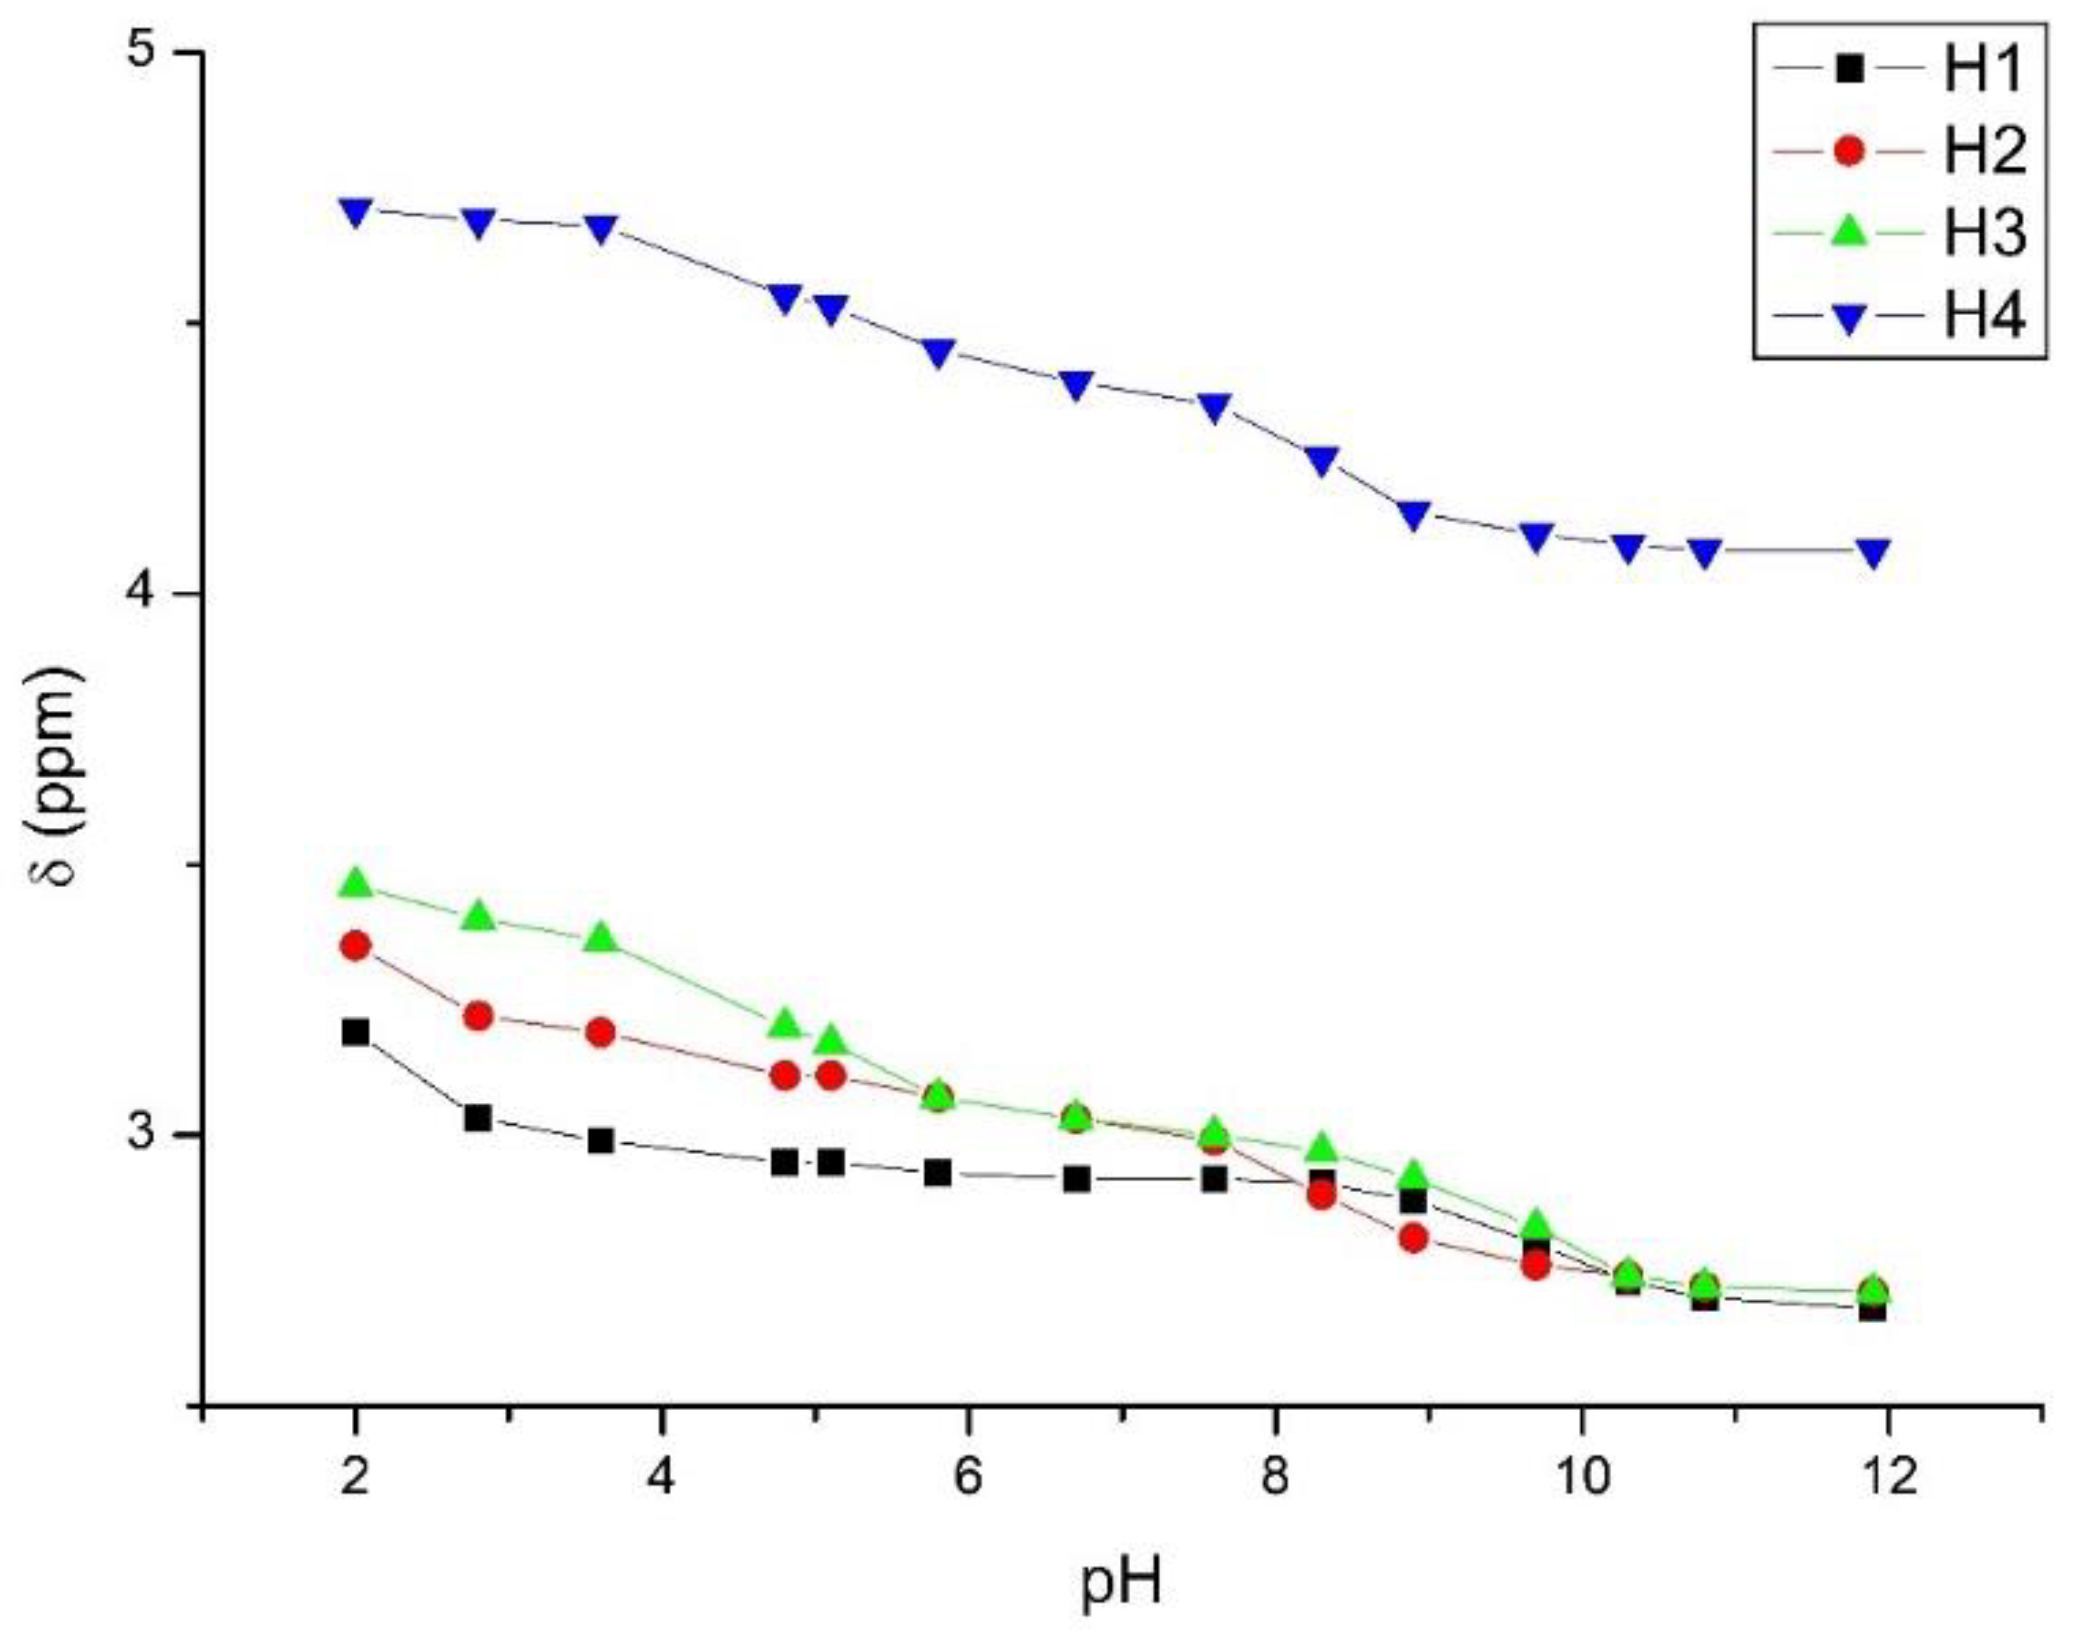
3.3.2. 1H NMR Analysis

To better understand the proton distribution in the possible species of the ligand, fluorescence data were combined with 1H NMR measurements. 1H NMR spectra at various pH values were registered in acetonitrile–d3/D2O 60:40 over the same 2–12 pH range (Figure 5 and Figure S1): the initial pH of the ligand (L·4HBr, pH = 2) was raised directly in the NMR tube through the addition of KOD. 2D standard correlation experiments were performed to assign all the signals. A mixed aqueous medium was used to prevent solubility issues in D2O at a high pH.
At pH = 12, the 1H NMR spectrum of L shows three aliphatic and four aromatic resonances (δ = 2.70 ppm (H1, 4H), 2.72 ppm (H2 + H3, 8H), 4.08 ppm (H4, 4H), 7.32 ppm (H5, 2H), 7.40 ppm (H6, 2H), 7.59 ppm (H7, 2H), 7.77 ppm (H9, 1H), 8.29 ppm (H8, 2H), 9.16 ppm (H10, 1H)) (see Figure S6 for the spectrum and Figure 1 for the assignments). The 13C spectrum exhibits a total of 15 signals (see experimental section): 4 for the aromatic and 11 for the aliphatic resonances. Along with the 1H spectrum, this indicates a C2v symmetry of L mediated on the NMR timescale.
Starting from pH = 12, where the presence of the neutral L species can be hypothesized in solution, and moving towards acidic pH values, no significant changes were detected up to pH 10.5, indicating the presence in solution in this pH range of the neutral L species (Figure 5).
In the pH range of 10.5–7.6, all the aliphatic resonances (mainly those belonging to H2, H3 and H4 protons) shifted downfield, suggesting that the first protonation step mainly involves an amine function in the benzylic position of BBzB to give the HL+ species. By lowering the pH to 5.2, another protonation process occurred (mainly involving H3 and H4 resonances), suggesting that this step is dependent again on a benzyl amine function to give the H2L2+ species. However, these protons, although mainly located at those positions, are probably shared and stabilized via H-bonding with the closer amine functions, as suggested by both the downfield shift of all aliphatic resonances and the only slight switching ON of the fluorescence, due to partial prevention of the PET effect (vide supra), as already observed in similar systems containing the same aliphatic polyamine chain [62].
At lower pH values, the downfield shift of the aliphatic resonances suggests two further protonation steps, fixing the acidic protons on the aliphatic amine functions of the polyamine chain, mainly on the central ones; the greatest shifts refer to the H3 and H4 signals, in the pH range of 5.2–3.5, to give the H3L3+ species, and to the H1 and H2 resonances, moving from pH 3.5 to 2, to give the fully protonated H4L4+ species.
In general, all resonances move downfield when lowering the pH, with the aromatic resonances exhibiting smaller shifts than the aliphatic ones. This suggests that the aromatic fluorophore is not directly involved in any protonation step. The most evident shifts associated with the aromatic resonances occurred in the 3.5–5.2 and 7.6–10.5 pH ranges. H7 also showed a variation in the 5.2–7.6 pH range (Figure S7). These shifts are probably due to the presence or absence of hydrogen bonds involving the benzylic nitrogen atoms, which can affect the electron density on the aromatic rings and the conformation of the whole system. Regarding the aliphatic resonances, notwithstanding the shifts described above, it must be noted that they show a continuous perturbation throughout the whole pH range, suggesting, besides the protonation steps, the involvement of the amine functions in hydrogen bonding.
Taking into account both NMR and spectrofluorimetric data, the proton distribution scheme depicted in Figure 6 could be proposed.

3.4. Metal Ion Complexation

3.4.1. UV-Vis Studies

Spectrophotometric and spectrofluorimetric measurements were performed to investigate the photochemistry of the BBzB fluorophore and the coordination behavior towards metal ions.
Since the ligand exhibits PET-mediated emission properties (vide supra), the coordination of a suitable metal ion within the macrocycle cavity should prevent the PET effect, enabling the emission of the complex.
A preliminary screening was performed to evaluate the response of the system to selected transition metal ions (Zn2+, Cd2+, Pb2+, Cu2+, Hg2+), chosen among heavy metals, paramagnetic metals, and generally responsive d10 metals. The screening was performed in the same experimental conditions found above (ACN—aqueous HEPES (pH 7.4) 4:1 v/v), by adding two equivalents of metal ion to the solution of L (Figure 7).
The addition of a solution of Cd2+ as perchlorate salt did not greatly affect the absorption spectrum, while the addition of Zn2+ as perchlorate salt provoked the variation of the band at a higher energy, suggesting a certain degree of involvement of the BBzB moiety in the coordination of the cation, especially regarding the second equivalent of Zn2+. The addition of Pb2+, Hg2+, and Cu2+ as perchlorate salts showed the growing of new bands at 251 nm, 261 nm, and 296 nm, respectively, which can be attributed either to the involvement of the BBzB moiety in the coordination or to a metal-induced distortion of the aromatic system (Figure S8).
Among the tested cations, only Zn2+ and Cd2+ showed a pronounced increase of the emission intensity of the ligand under the chosen experimental conditions, while Pb2+ and Hg2+ only slightly affected the emission of the system, probably due to the heavy metal effect. As expected, the emission is quenched in the presence of Cu2+, due to the paramagnetic effect and the resulting favored ISC from the S1 to the T1 state (Figure 7).
More metal ions were investigated (Fe2+, Fe3+, Co2+, Cr3+, Ni2+, Ag+, Mn2+, Na+, K+, Mg2+, Ca2+), with none of them inducing a fluorescence response (Figure S9).
Following these preliminary results, spectrofluorimetric titrations of the ligand in ACN—aqueous HEPES pH 7.4, 4:1 v/v with Zn2+ and Cd2+ were performed to assess the behavior of the chemosensor in the presence of such cations. The measurements revealed great fluorescence emission enhancement upon the coordination of both Zn2+ and Cd2+ (chelation enhancement of fluorescence (CHEF) effect). Figure 8 and Figure 9 report the emission spectra obtained by the titration of a buffered (pH 7.4) solution of L (ACN—aqueous HEPES 4:1 v/v solvent mixture) with Zn2+ and Cd2+ perchlorate, upon excitation at 305 nm. The free ligand exhibits an emission band with a maximum at 402 nm (emission quantum yield, Φem = 0.006; Stokes shift = 7910 cm−1); a blue shift was observed upon addition of the metal ion, reaching 385 and 390 nm in the presence of two equivalents of Zn2+ and Cd2+, respectively, with PET-mediated enhancement of the fluorescence compared to free L.
The two titrations seemed to suggest a different stoichiometry for the two complexes. The addition of the Zn2+ ion induced a fluorescence emission increase up to two equivalents, suggesting the formation of the dinuclear complex [M2L]4+, while the addition of the Cd2+ ion seemed to suggest the formation of the mononuclear complex [ML]2+. The emission quantum yields of L in the presence of 2 equivalents of Zn2+ or 1 equivalent of Cd2+ are Φem = 0.036 and Φem = 0.015, respectively, under these experimental conditions.
Statistical analysis of the trend furnished a limit of detection (LOD) of 0.02 and 0.03 ppm (3.1 × 10⁻⁷ and 2.9 × 10⁻⁷ mol dm−3) and a limit of quantitation (LOQ) of 0.06 and 0.09 ppm (9.6 × 10⁻⁷ and 8.9 × 10⁻⁷ mol dm−3) in Zn2+ and Cd2+, respectively (R > 0.99), associated with this method (Figures S10 and S11) [49].
The emission wavelength of the newly synthesized BBzB fluorophore (402 nm) is redshifted by 40–50 nm with respect to the previously reported POXAPy (358 nm) [12] and PPD/PPyD (350 nm) [14,61,62,64] systems, featuring oxadiazole (ODA) rings and a total of five and three conjugated aromatic rings, respectively (Figure S12). The BBzB emission is therefore more shifted towards the visible region. The absorption wavelength of the fluorophore (305 nm) is the same as of that of POXAPy (306 nm) and is longer compared to those of PPD/PPyD (280 nm), with a greater Stokes shift compared to POXAPy (7910 vs. 4750 cm−1) (Table S1). This could be the consequence of the presence of five aromatic rings, four of which are fused in the two benzoxazole systems, allowing the whole system to be coplanar (vide infra), resulting in a π-system extension that redshifts the emission of the fluorophore. This was not the case for the POXAPy system: even if containing more aromatic rings compared to the PPD unit, it featured a non-coplanarity between the five aromatic rings, which prevented the π-system extension and the redshift [12].

3.4.2. NMR Studies

To gain more insight on the coordination behavior of L towards Zn2+ and Cd2+, NMR experiments were performed. 1H NMR titrations were carried out by adding the metal ion to a 5 × 10⁻³ mol dm−3 solution of the ligand in D2O at pH 7.4.
The spectra obtained during the titrations with 6 × 10⁻² mol dm−3 solutions of Zn2+ and Cd2+ as perchlorate salts to L are reported in Figures S13 and S14. The addition of the two metal ions induced similar perturbations in the spectrum of L, with all resonances, both aromatic and aliphatic, showing an upfield shift. This behavior suggests the coordination of the metal ion by the ligand, probably due to the aliphatic nitrogen atoms, accompanied by the involvement of the benzoxazole nitrogen atoms and/or a distortion of the BBzB aromatic fragment.
The main difference between the titrations with the two metal ions is due to the invariance of the spectrum observed after the addition of one equivalent of Cd2+, while further resonance shifts are induced by Zn2+ up to the addition of two equivalents of metal ion. This behavior suggests a different stoichiometry of the two complexes; in particular, a mononuclear [ML]2+ species is formed in the presence of Cd2+, while a dinuclear [M2L]4+ species is achieved in the presence of Zn2+. These data are in agreement with those derived from fluorescence titrations, confirming the stoichiometry of the complexes with Zn2+ and Cd2+. Moreover, in both cases, the same C2v symmetry mediated on the NMR timescale was preserved during the whole titration experiments, suggesting the symmetric involvement of the ligand in the coordination of the metal ion (Figures S13 and S14).
Finally, whereas the addition of Cd2+ to the preformed [Zn2L]4+ species did not cause a significant variation of the 1H NMR spectrum of the complex, the addition of Zn2+ to the preformed [CdL]2+ species provoked an upfield shift of almost all resonances (Figures S15 and S16). This suggests a higher affinity of the ligand towards Zn2+ and a greater stability of the Zn2+ complex compared to the Cd2+ one.

3.4.3. Computational Studies

DFT calculations were used to study the relative stability of the Zn2+ and Cd2+ complexes with the ligand L. Results are presented in Figure 10 and Figure S17 and Table 1.
In detail, following the experimental solution studies (vide supra), the structures of both the mononuclear and dinuclear Zn2+ and Cd2+ complexes, i.e., [ZnL]2+, [Zn2L]4+, [CdL]2+, and [Cd2L]4+, have been evaluated. The overall shapes of the two mononuclear and the two dinuclear metal complexes are almost identical (see Figure 10 and Figure S17), as well as the coordination geometry around the metal cations, with the first cation coordinated by the four aliphatic nitrogen atoms of the polyamine chain, and the second one by the two nitrogen atoms of the benzoxazole rings and by the carbon atom of the central phenyl ring.
In the most stable mononuclear [ZnL]2+ and [CdL]2+ geometries (Figure 10 and Figure S17), the metal ion interacts with the ligand L through the four nitrogen atoms of the polyamine chain without involving the BBzB fragment. In contrast, BBzB is involved in the coordination of the second metal ion in the dinuclear complexes [Zn2L]4+ and [Cd2L]4+ (Figure 10 and Figure S17), through two nitrogen atoms of the benzoxazole rings and the central phenyl ring. This latter MCH interaction could be described as an agostic interaction (i.e., 3-center–2-electron M–H–C bonds), where the coordinatively unsaturated zinc and cadmium ions can interact with the closer aryl C-H bond, with the transition metal cation drawing the ligand towards itself and forming an additional σ-bond [66,67].
Both free ligand and mononuclear complexes feature an overall “chair” conformation, while the dinuclear complexes adopt a more extended conformation (Figure 10 and Figure S17).
The aromatic BBzB fragment, notwithstanding the slight distortion induced by the coordination of the metal ions, maintained a coplanar structure, which explains the redshifted emission due to the π-system extension observed for L (vide supra).
The Gibbs free energies for the formation of the complexes (i.e., the difference between the energy of the complex and the sum of the energy of the ligand and the metal ion placed at an infinite distance; Equations (1) and (2)) were calculated and compared (as shown in Table 1).
M2+ + L → [ML]2+
2M2+ + L → [M2L]4+
Based on these results, the Zn2+ complexes are more stable than the Cd2+ ones, and the dinuclear [Zn2L]4+ is the most stable among all the studied species, in agreement with the experimental results. This is probably due to the different dimensions of the two metal cations (ionic radius of 0.6 vs. 0.78 Å for Zn2+ and Cd2+, respectively): the larger the ionic radius of the metal cation, the less stable the complex. Interestingly, while in the case of the Zn2+ complexes, the dinuclear species is more stable than the mononuclear one, in the case of Cd2+ complexes, the situation reverses, with the mononuclear [CdL]2+ species being the most stable. Again, these results are probably connected to the dimension of the metal ions: in the case of the smaller Zn2+, two ions can be lodged in the macrocycle cavity of L via the interaction with the nitrogen atoms of the BBzB and the polyamine chain fragments, without significant distortions of the macrocycle, gaining stability by moving from one to two Zn2+ ions being coordinated. Conversely, in the case of the bigger Cd2+, the coordination of the second metal ion determines an energetically expensive distortion of the phenyl ring that is not adequately balanced by the favorable energetic contribution provided by the coordination of a second metal ion. As a consequence, in agreement with the experimental results, the [Cd2L]4+ complex is the least stable complex within the series (Table 1). Indeed, the Zn2+ ions are located closer to both mean planes containing the four nitrogen atoms of the aliphatic polyamine chain (plane 1) and the two nitrogen atoms and the aryl CH of the BBzB moiety (plane 2) than the Cd2+ ions (DIST1, Table 1). Analogous energetic considerations can be drawn out for both BP86 and B3LYP functionals.
Finally, the sum of the coordination bond distances could give an insight of the macrocyclic hole size: the presence of different metal cations revealed the ability of the ligand to adapt to their size. Indeed, the bond sum is always lower for the Zn2+ complexes than for the Cd2+ complexes (DIST2, Table 1).

4. Conclusions

The cyclophane macrocycle L containing the new 1,3-bis(benzo[d]oxazol-2-yl)phenyl (BBzB) fluorophore as sensing unit and an aliphatic polyamine chain was synthesized. L behaves as a PET-mediated chemosensor, being fluorescent only at acidic pH, with a maximum at 402 nm. L is able to signal the presence of Zn2+ and Cd2+ metal ions via a fluorescent response, in a mixed acetonitrile–aqueous medium at physiological pH 7.4, via a CHEF effect. Both experimental and theoretical studies suggested the formation of both mononuclear and dinuclear complexes in the case of Zn2+, while only the mononuclear complex was detected in the case of Cd2+. The redshifted emission wavelength together with the theoretical studies suggested that the whole aromatic system remained coplanar upon metal coordination.
Future developments may involve the variation of the central phenyl ring of the fluorophore moiety or of the polyamine chain, to switch the selectivity towards bigger or smaller metal cations or to use the complexes as metal receptors for anions of neutral species.

Supplementary Materials

The following supporting information can be downloaded at https://0-www-mdpi-com.brum.beds.ac.uk/article/10.3390/chemosensors10050188/s1. Figure S1: 1H NMR spectrum of 4 in CDCl3, Figure S2: 13C NMR spectrum of compound 4 in CDCl3, Figure S3: MS-ESI spectrum of compound 4, Figure S4: 13C NMR spectrum of ligand L in D2O. [L] = 7.7 × 10⁻³ mol dm−3, Figure S5: HRMS spectrum of L, Figure S6: 1H NMR spectrum of L at pH 12 in D2O. [L] = 5 × 10⁻³ mol dm−3. See Figure 1 in the main text for proton assignment, Figure S7: Trend of selected 1H NMR signals of aromatic L protons in an acetonitrile–d3/D2O 60:40 solution as a function of the pH. [L] = 5 × 10⁻³ mol dm−3, Figure S8: UV-Vis absorption spectra of L registered upon addition of 2 equivalents of different metal cations (Zn(II), Cd(II), Pb(II), Hg(II), Cu(II)). [L] = 3.2 × 10⁻⁶ mol dm−3 (ACN–aqueous HEPES pH 7.4, 4:1 v/v solvent mixture), Figure S9: Bar-plot showing the emission of L upon addition of 2 equivalents of different metal cations (Fe2+, Fe3+, Co2+, Cr3+, Ni2+, Ag+, Mn2+, Mg2+, Ca2+, Na+, K+). The response to Zn2+ and Cd2+ has been reported as a reference. I and I0 are the emission intensities of the ligand in the presence and absence of the metal ions, respectively. [L] = 3.2 × 10⁻⁶ mol dm−3 (ACN–aqueous HEPES (pH 7.4) 4:1 v/v solvent mixture). λex = 305 nm. λem = 385 nm (Zn2+), 390 nm (Cd2+), 402 nm for all other tested metal ions, Figure S10: Trend of the emission intensity at 385 nm (λex = 305 nm) upon increasing amounts of Zn2+, as described in the main text. Inset: linear regression from 0 to 0.4 ppm, Figure S11: Trend of the emission intensity at 390 nm (λex = 305 nm) upon increasing amounts of Cd2+, as described in the main text. Inset: linear regression from 0 to 0.45 ppm, Figure S12: Molecular structures of L (a) and the similar systems cited in the main text (bd), Figure S13: 1H NMR spectra of L recorded in D2O at pH 7.4 upon addition of Zn(ClO4)2 up to 3 equivalents. [L] = 5 × 10⁻³ mol dm−3, Figure S14: 1H NMR spectra of L recorded in D2O at pH 7.4 upon addition of Cd(ClO4)2 up to 2 equivalents. [L] = 5 × 10⁻³ mol dm−3, Figure S15: 1H NMR spectra of L (bottom), L + 2 equivalents of Zn2+ (middle), and L + 2 equivalents of Zn2+ + 2 equivalents of Cd2+ (top) recorded in D2O at pH 7.4. [L] = 5 × 10⁻³ mol dm−3, Figure S16: 1H NMR spectra of L (bottom), L + 1 equivalents of Cd2+ (middle), and L + 1 equivalents of Cd2+ + 1 equivalents of Zn2+ (top) recorded in D2O at pH 7.4. [L] = 5·10−3 mol dm−3, Figure S17: Front view (top) and side view (bottom) of the computed structures of (from left to right) [CdL]2+ and [Cd2L]4+, Table S1: Experimental parameters of L and similar systems and their complexes with Zn2+ and Cd2+, where applicable. Supplementary Materials Refs. [12,14,49,50,51,52,53,54,55,56,61,62].

Author Contributions

Conceptualization, L.G.; investigation, D.P., E.M., M.F. and M.V.; writing—original draft preparation, E.M.; writing—review and editing, E.M., V.F., L.G., M.F. and L.C.; supervision, V.F.; funding acquisition, V.F. All authors have read and agreed to the published version of the manuscript.

Funding

This research was funded by MIUR, project 2017EKCS35; DISPEA ASSEGNAZIONE SICUREZZA ALIMENTARE; and DISPEA Macedi Prog21.

Institutional Review Board Statement

Not Applicable.

Informed Consent Statement

Not Applicable.

Data Availability Statement

The data presented in this study are available on request from the corresponding author.

Acknowledgments

Anna Rita Pierleoni is acknowledged for her help with NMR measurements. Federica Biancucci is acknowledged for her help with HRMS analysis.

Conflicts of Interest

The authors declare no conflict of interest.

References

  1. Wong, X.K.; Yeong, K.Y. A Patent Review on the Current Developments of Benzoxazoles in Drug Discovery. ChemMedChem 2021, 16, 3237–3262. [Google Scholar] [CrossRef] [PubMed]
  2. Arulmurugan, S.; Kavitha, H.P.; Vennila, J.P. Review on the Synthetic Methods of Biologically Potent Benzoxazole Derivatives. Mini. Rev. Org. Chem. 2020, 18, 769–785. [Google Scholar] [CrossRef]
  3. Temiz-Arpaci, O.; Zeyrek, C.T.; Arisoy, M.; Erol, M.; Celik, I.; Kaynak-Onurdag, F. Synthesis, Quantum Mechanical Calculations, Antimicrobial Activities and Molecular Docking Studies of Five Novel 2,5-Disubstituted Benzoxazole Derivatives. J. Mol. Struct. 2021, 1245, 131084. [Google Scholar] [CrossRef]
  4. Liu, H.; Xu, S.; Shi, X. Half-Sandwich Chromium(III) Complexes Containing Salicylbenzoxazole and Salicylbenzothiazole Ligands for Ethylene Polymerization. Inorg. Chem. Commun. 2021, 133, 108885. [Google Scholar] [CrossRef]
  5. Mao, S.; Han, X.; Li, C.; Huang, G.; Shen, K.; Shi, X.; Wu, H. Synthesis, Crystal Structure, Fluorescence and Electrochemical Properties of Two Ag(I) Complexes Based on 2-(4′-Pyridyl)-Benzoxazole/SPPh3 Ligands. J. Coord. Chem. 2018, 71, 3330–3341. [Google Scholar] [CrossRef]
  6. Chai, W.; Hong, M.; Song, L.; Jia, G.; Shi, H.; Guo, J.; Shu, K.; Guo, B.; Zhang, Y.; You, W.; et al. Three Reversible Polymorphic Copper(I) Complexes Triggered by Ligand Conformation: Insights into Polymorphic Crystal Habit and Luminescent Properties. Inorg. Chem. 2015, 54, 4200–4207. [Google Scholar] [CrossRef]
  7. Carter, K.P.; Young, A.M.; Palmer, A.E. Fluorescent Sensors for Measuring Metal Ions in Living Systems. Chem. Rev. 2014, 114, 4564–4601. [Google Scholar] [CrossRef]
  8. Gusev, A.N.; Shul’Gin, V.F.; Meshkova, S.B.; Smola, S.S.; Linert, W. A Novel Triazole-Based Fluorescent Chemosensor for Zinc Ions. J. Lumin. 2014, 155, 311–316. [Google Scholar] [CrossRef]
  9. Kumari, C.; Sain, D.; Kumar, A.; Debnath, S.; Saha, P.; Dey, S. Intracellular Detection of Hazardous Cd2+ through a Fluorescence Imaging Technique by Using a Nontoxic Coumarin Based Sensor. Dalt. Trans. 2017, 46, 2524–2531. [Google Scholar] [CrossRef]
  10. Zhang, Y.; Guo, X.; Zheng, M.; Yang, R.; Yang, H.; Jia, L.; Yang, M. Organic & Biomolecular Chemistry A 4,5-Quinolimide-Based Fluorescent Sensor for the Turn-on Detection of Cd2+ with Live-Cell Imaging. Org. Biomol. Chem. 2017, 15, 2211. [Google Scholar] [CrossRef]
  11. Kim, H.N.; Ren, W.X.; Kim, J.S.; Yoon, J. Chemical Society Reviews CRITICAL REVIEW Fluorescent and Colorimetric Sensors for Detection of Lead, Cadmium, and Mercury Ions Fluorescent and Colorimetric Sensors for Detection of Lead, Cadmium, and Mercury Ions. Chem. Soc. Rev 2012, 41, 3210–3244. [Google Scholar] [CrossRef] [PubMed]
  12. Ambrosi, G.; Fanelli, M.; Paoli, P.; Formica, M.; Paderni, D.; Rossi, P.; Micheloni, M.; Giorgi, L.; Fusi, V. Zn(II) Detection and Biological Activity of a Macrocycle Containing a Bis(Oxadiazole)Pyridine Derivative as Fluorophore. Dalt. Trans. 2020, 49, 7496–7506. [Google Scholar] [CrossRef] [PubMed]
  13. Ambrosi, G.; Paz Clares, M.; Pont, I.; Formica, M.; Fusi, V.; Ricci, A.; Paoli, P.; Rossi, P.; García-España, E.; Inclán, M. Zn2+ and Cu2+ Complexes of a Fluorescent Scorpiand-Type Oxadiazole Azamacrocyclic Ligand: Crystal Structures, Solution Studies and Optical Properties. Dalt. Trans. 2020, 49, 1897–1906. [Google Scholar] [CrossRef] [PubMed]
  14. Formica, M.; Ambrosi, G.; Fusi, V.; Giorgi, L.; Arca, M.; Garau, A.; Pintus, A.; Lippolis, V. CdII/ZnII Discrimination Using 2,5-Diphenyl[1,3,4]Oxadiazole Based Fluorescent Chemosensors. New J. Chem. 2018, 42, 7869–7883. [Google Scholar] [CrossRef]
  15. Formica, M.; Favi, G.; Fusi, V.; Giorgi, L.; Mantellini, F.; Micheloni, M. Synthesis and Study of Three Hydroxypyrazole-Based Ligands: A Ratiometric Fluorescent Sensor for Zn(II). J. Lumin. 2018, 195, 193–200. [Google Scholar] [CrossRef]
  16. Ambrosi, G.; Formica, M.; Fusi, V.; Giorgi, L.; Macedi, E.; Micheloni, M.; Paoli, P.; Rossi, P. A Biphenol-Based Chemosensor for ZnII and CdII Metal Ions: Synthesis, Potentiometric Studies, and Crystal Structures. Inorg. Chem. 2016, 55, 7676–7687. [Google Scholar] [CrossRef]
  17. Garau, A.; Lvova, L.; Macedi, E.; Ambrosi, G.; Aragoni, M.C.; Arca, M.; Caltagirone, C.; Coles, S.J.; Formica, M.; Fusi, V.; et al. N2S2 pyridinophane-Based Fluorescent Chemosensors for Selective Optical Detection of Cd2+ in Soils. New J. Chem. 2020, 44, 20834–20852. [Google Scholar] [CrossRef]
  18. Lvova, L.; Caroleo, F.; Garau, A.; Lippolis, V.; Giorgi, L.; Fusi, V.; Zaccheroni, N.; Lombardo, M.; Prodi, L.; Natale, C.D.; et al. A Fluorescent Sensor Array Based on Heteroatomic Macrocyclic Fluorophores for the Detection of Polluting Species in Natural Water Samples. Front. Chem. 2018, 6, 258. [Google Scholar] [CrossRef]
  19. Pathak, R.K.; Hinge, V.K.; Rai, A.; Panda, D.; Rao, C.P. Imino–Phenolic–Pyridyl Conjugates of Calix[4]Arene (L1 and L2) as Primary Fluorescence Switch-on Sensors for Zn2+ in Solution and in HeLa Cells and the Recognition of Pyrophosphate and ATP by [ZnL2]. Inorg. Chem. 2012, 51, 4994–5005. [Google Scholar] [CrossRef]
  20. Hagimori, M.; Uto, T.; Mizuyama, N.; Temma, T.; Yamaguchi, Y.; Tominaga, Y.; Saji, H. Fluorescence ON/OFF Switching Zn2+ Sensor Based on Pyridine–Pyridone Scaffold. Sens. Actuators B. Chem. 2013, 181, 823–828. [Google Scholar] [CrossRef]
  21. Mikata, Y.; Takekoshi, A.; Kaneda, M.; Konno, H.; Yasuda, K.; Aoyama, M.; Tamotsu, S. Replacement of Quinolines with Isoquinolines Affords Target Metal Ion Switching from Zn2+ to Cd2+ in the Fluorescent Sensor TQLN (N,N,N′,N′-Tetrakis(2-Quinolylmethyl)-2,6-Bis(Aminomethyl)Pyridine). Dalt. Trans. 2017, 46, 632–637. [Google Scholar] [CrossRef] [PubMed]
  22. Suh, B.; Gil, D.; Yoon, S.; Kim, K.T.; Kim, C. A Practical Hydrazine-Carbothioamide-Based Fluorescent Probe for the Detection of Zn2+: Applications to Paper Strip, Zebrafish and Water Samples. Chemosensors 2022, 10, 32. [Google Scholar] [CrossRef]
  23. Ellairaja, S.; Manikandan, R.; Vijayan, M.T.; Rajagopal, S.; Vasantha, V.S. A Simple Highly Sensitive and Selective TURN-ON Fluorescent Chemosensor for the Detection of Cadmium Ions in Physiological Conditions. RSC Adv. 2015, 5, 63287–63295. [Google Scholar] [CrossRef]
  24. Goswami, S.; Aich, K.; Das, S.; Das Mukhopadhyay, C.; Sarkar, D.; Mondal, T.K. A New Visible-Light-Excitable ICT-CHEF-Mediated Fluorescence ‘Turn-on’ Probe for the Selective Detection of Cd2+ in a Mixed Aqueous System with Live-Cell Imaging. Dalt. Trans. 2015, 44, 5763–5770. [Google Scholar] [CrossRef]
  25. Kar, C.; Samanta, S.; Goswami, S.; Ramesh, A.; Das, G. A Single Probe to Sense Al(III) Colorimetrically and Cd(II) by Turn-on Fluorescence in Physiological Conditions and Live Cells, Corroborated by X-Ray Crystallographic and Theoretical Studies. Dalt. Trans. 2015, 44, 4123–4132. [Google Scholar] [CrossRef]
  26. Aich, K.; Goswami, S.; Das, S.; Das Mukhopadhyay, C.; Quah, C.K.; Fun, H.K. Cd2+ Triggered the FRET “ON”: A New Molecular Switch for the Ratiometric Detection of Cd2+ with Live-Cell Imaging and Bound X-Ray Structure. Inorg. Chem. 2015, 54, 7309–7315. [Google Scholar] [CrossRef]
  27. Vallee, B.L.; Falchuk, K.H. The Biochemical Basis of Zinc Physiology. Physiol. Rev. 1993, 73, 79–118. [Google Scholar] [CrossRef]
  28. Andreini, C.; Bertini, I.; Cavallaro, G. Minimal Functional Sites Allow a Classification of Zinc Sites in Proteins. PLoS ONE 2011, 6, e26325. [Google Scholar] [CrossRef] [Green Version]
  29. Nawrot, T.; Plusquin, M.; Hogervorst, J.; Roels, H.A.; Celis, H.; Thijs, L.; Vangronsveld, J.; Van Hecke, E.; Staessen, J.A. Environmental Exposure to Cadmium and Risk of Cancer: A Prospective Population-Based Study. Lancet Oncol. 2006, 7, 119–126. [Google Scholar] [CrossRef] [Green Version]
  30. Viau, M.; Collin-Faure, V.; Richaud, P.; Ravanat, J.L.; Candéias, S.M. Cadmium and T Cell Differentiation: Limited Impact in Vivo but Significant Toxicity in Fetal Thymus Organ Culture. Toxicol. Appl. Pharmacol. 2007, 223, 257–266. [Google Scholar] [CrossRef]
  31. Zalups, R.K.; Ahmad, S. Molecular Handling of Cadmium in Transporting Epithelia. Toxicol. Appl. Pharmacol. 2003, 186, 163–188. [Google Scholar] [CrossRef]
  32. Waisberg, M.; Joseph, P.; Hale, B.; Beyersmann, D. Molecular and Cellular Mechanisms of Cadmium Carcinogenesis. Toxicology 2003, 192, 95–117. [Google Scholar] [CrossRef]
  33. Satarug, S.; Baker, J.R.; Urbenjapol, S.; Haswell-Elkins, M.; Reilly, P.E.B.; Williams, D.J.; Moore, M.R. A Global Perspective on Cadmium Pollution and Toxicity in Non-Occupationally Exposed Population. Toxicol. Lett. 2003, 137, 65–83. [Google Scholar] [CrossRef]
  34. Bush, A.I. The Metallobiology of Alzheimer’s Disease. Trends Neurosci. 2003, 26, 207–214. [Google Scholar] [CrossRef]
  35. Frederickson, C.J.; Koh, J.Y.; Bush, A.I. The Neurobiology of Zinc in Health and Disease. Nat. Rev. Neurosci. 2005, 6, 449–462. [Google Scholar] [CrossRef] [PubMed]
  36. Maret, W. Zinc in Pancreatic Islet Biology, Insulin Sensitivity, and Diabetes. Prev. Nutr. Food Sci. 2017, 22, 1–8. [Google Scholar] [CrossRef]
  37. Ambrosi, G.; Battelli, C.; Formica, M.; Fusi, V.; Giorgi, L.; Macedi, E.; Micheloni, M.; Pontellini, R.; Prodi, L. Two Polyaminophenolic Fluorescent Chemosensors for H+ and Zn(II). Spectroscopic Behaviour of Free Ligands and of Their Dinuclear Zn(II) Complexes. New J. Chem. 2009, 33, 171–180. [Google Scholar] [CrossRef]
  38. Paderni, D.; Giorgi, L.; Macedi, E.; Formica, M.; Paoli, P.; Rossi, P.; Fusi, V. A Selective Fluorescent Probe for GadoliniumIII in Water Based on a PdII-Preorganized Chromone-Receptor. Dalt. Trans. 2021, 50, 15433. [Google Scholar] [CrossRef]
  39. Bradshaw, J.S.; Krakowiak, K.E.; Izatt, R.M. Aza-Crown Macrocycles; John Wiley & Sons Ltd.: New York, NY, USA, 1993. [Google Scholar]
  40. Weber, E. Crown Ethers and Analogs; Patai, S., Rappoport, Z., Eds.; John Wiley & Sons Ltd.: Chichester, NY, USA, 1989; ISBN 0471917079. [Google Scholar]
  41. Lindoy, L.F. The Chemistry of Macrocyclic Ligand Complexes; Cambridge University Press: Cambridge, MA, USA, 1989; ISBN 9780521252614. [Google Scholar]
  42. Chan, A.K.W.; Lam, E.S.H.; Tam, A.Y.Y.; Tsang, D.P.K.; Lam, W.H.; Chan, M.Y.; Wong, W.T.; Yam, V.W.W. Synthesis and Characterization of Luminescent Cyclometalated Platinum(II) Complexes of 1,3-Bis-Hetero-Azolylbenzenes with Tunable Color for Applications in Organic Light-Emitting Devices through Extension of π Conjugation by Variation of the Heteroatom. Chem. A Eur. J. 2013, 19, 13910–13924. [Google Scholar] [CrossRef]
  43. Ebara, K.; Shibasaki, Y.; Ueda, M. Photosensitive Poly(Benzoxazole) Based on Precursor from Diphenyl Isophthalate and Bis(o-Aminophenol). Polymer 2003, 44, 333–339. [Google Scholar] [CrossRef]
  44. Dang, T.T.; Soulé, J.F.; Doucet, H.; Benmensour, M.A.; Boucekkine, A.; Colombo, A.; Dragonetti, C.; Righetto, S.; Jacquemin, D.; Boixel, J.; et al. Asymmetrical 1,3-Bis(Heteroazolyl)Benzene Platinum Complexes with Tunable Second-Order Non-Linear Optical Properties. Eur. J. Inorg. Chem. 2016, 2016, 4774–4782. [Google Scholar] [CrossRef]
  45. Kuwabara, J.; Namekawa, T.; Sakabe, E.; Haga, M.a.; Kanbara, T. Luminescent Ir(III) Complexes Bearing Benzothiazole or Benzoxazole-Based Pincer Ligand. J. Organomet. Chem. 2017, 845, 189–195. [Google Scholar] [CrossRef] [Green Version]
  46. Shi, W.M.; Li, X.H.; Liang, C.; Mo, D.L. Base-Free Selective O-Arylation and Sequential [3,3]-Rearrangement of Amidoximes with Diaryliodonium Salts: Synthesis of 2-Substituted Benzoxazoles. Adv. Synth. Catal. 2017, 359, 4129–4135. [Google Scholar] [CrossRef]
  47. Bencini, A.; Bianchi, A.; Garcia-Espana, E.; Giusti, M.; Micheloni, M.; Paoletti, P. Solution Chemistry of Macrocycles. 5. Synthesis and Ligational Behavior toward Hydrogen and Copper(II) Ions of the Large Polyazacycloalkane 1,4,7,10,13,16,19,22,25-Nonaazacycloheptacosane ([27]AneN9). Inorg. Chem. 2002, 26, 681–684. [Google Scholar] [CrossRef]
  48. Mohanty, J.; Pal, H.; Sapre, A.V. Photophysical Properties of 2,2′- and 4,4′-Biphenyldiols. Bull. Chem. Soc. Jpn. 1999, 72, 2193–2202. [Google Scholar] [CrossRef]
  49. Shrivastava, A.; Gupta, V.B. Methods for the Determination of Limit of Detection and Limit of Quantitation of the Analytical Methods. Chron. Young Sci. 2011, 2, 21–25. [Google Scholar] [CrossRef]
  50. Frisch, M.J.; Trucks, G.W.; Schlegel, H.B.; Scuseria, G.E.; Robb, M.A.; Cheeseman, J.R.; Scalmani, G.; Barone, V.; Mennucci, B.; Petersson, G.A. Gaussian 09; Gaussian, Inc.: Wallingford, CT, USA, 2009. [Google Scholar]
  51. Becke, A.D. Density-Functional Exchange-Energy Approximation with Correct Asymptotic Behavior. Phys. Rev. A 1988, 38, 3098. [Google Scholar] [CrossRef] [PubMed]
  52. Perdew, J.P. Density-Functional Approximation for the Correlation Energy of the Inhomogeneous Electron Gas. Phys. Rev. B 1986, 33, 8822, Erratum in Phys. Rev. B 1986, 34, 7406. [Google Scholar] [CrossRef]
  53. Kim, K.; Jordan, K.D. Comparison of Density Functional and MP2 Calculations on the Water Monomer and Dimer. J. Phys. Chem. 2002, 98, 10089–10094. [Google Scholar] [CrossRef]
  54. Stephens, P.J.; Devlin, F.J.; Chabalowski, C.F.; Frisch, M.J. Ab Initio Calculation of Vibrational Absorption and Circular Dichroism Spectra Using Density Functional Force Fields. J. Phys. Chem. 2002, 98, 11623–11627. [Google Scholar] [CrossRef]
  55. Cramer, C.J. Essentials of Computational Chemistry: Theories and Models, 2nd ed.; Wiley: Chichester, NH, USA, 2004; ISBN 978-0-470-09182-1. [Google Scholar]
  56. Schäfer, A.; Huber, C.; Ahlrichs, R. Fully Optimized Contracted Gaussian Basis Sets of Triple Zeta Valence Quality for Atoms Li to Kr. J. Chem. Phys. 1998, 100, 5829. [Google Scholar] [CrossRef]
  57. Atkins, T.J.; Richman, J.E.; Oettle, W.F. Macrocyclic Polyamines: 1,4,7,10,13,16- Hesaazacyclooctadecane. Org. Synth. 1978, 58, 86. [Google Scholar] [CrossRef]
  58. Richman, J.E.; Atkins, T.J. Nitrogen Analogs of Crown Ethers. J. Am. Chem. Soc. 1974, 96, 2268–2270. [Google Scholar] [CrossRef]
  59. Czarnik, A.W. Fluorescent Chemosensors for Ion and Molecule Recognition; American Chemical Society: Washington, DC, USA, 1993. [Google Scholar]
  60. Amatori, S.; Ambrosi, G.; Errico Provenzano, A.; Fanelli, M.; Formica, M.; Fusi, V.; Giorgi, L.; Macedi, E.; Micheloni, M.; Paoli, P.; et al. PdII and PtII Complexes with a Thio-Aza Macrocycle Ligand Containing an Intercalating Fragment: Structural and Antitumor Activity Studies. J. Inorg. Biochem. 2016, 162, 154–161. [Google Scholar] [CrossRef]
  61. Ambrosi, G.; Formica, M.; Fusi, V.; Giorgi, L.; MacEdi, E.; Micheloni, M.; Paoli, P.; Pontellini, R.; Rossi, P. Efficient Fluorescent Sensors Based on 2,5-Diphenyl[1,3,4]Oxadiazole: A Case of Specific Response to Zn(II) at Physiological PH. Inorg. Chem. 2010, 49, 9940–9948. [Google Scholar] [CrossRef] [PubMed]
  62. Ambrosi, G.; Formica, M.; Fusi, V.; Giorgi, L.; Macedi, E.; Micheloni, M.; Piersanti, G.; Pontellini, R. New Family of Polyamine Macrocycles Containing 2,5-Diphenyl[1,3,4] Oxadiazole as a Signaling Unit. Synthesis, Acid-Base and Spectrophotometric Properties. Org. Biomol. Chem. 2010, 8, 1471–1478. [Google Scholar] [CrossRef]
  63. Ambrosi, G.; Formica, M.; Fusi, V.; Giorgi, L.; Macedi, E.; Micheloni, M.; Pontellini, R. A Family of Polyamino Phenolic Macrocyclic Ligands. Acid-Base and Coordination Properties towards Co(II), Ni(II), Cu(II), Zn(II), Cd(II) and Pb(II) Ions. Inorg. Chim. Acta 2009, 362, 3709–3714. [Google Scholar] [CrossRef]
  64. Paoli, P.; Rossi, P.; Ambrosi, G.; Formica, M.; Fusi, V.; Giorgi, L.; Micheloni, M.; Macedi, E. Structural Insights into a Versatile Macrocyclic Family Based on 2,5-Diphenyl[1,3,4]Oxadiazole: A Combined X-Ray Diffraction and Computational Study. Supramol. Chem. 2017, 29, 896–911. [Google Scholar] [CrossRef]
  65. Ambrosi, G.; Formica, M.; Fusi, V.; Giorgi, L.; Macedi, E.; Micheloni, M.; Paoli, P.; Rossi, P. Polynuclear Complexes: Two Amino-Phenol Macrocycles Spaced by Several Linear Polyamines; Synthesis, Binding Properties, and Crystal Structure. Inorg. Chem. 2009, 48, 10424–10434. [Google Scholar] [CrossRef] [Green Version]
  66. Brookhart, M.; Green, M.L.H.; Parkin, G. Agostic Interactions in Transition Metal Compounds. Proc. Natl. Acad. Sci. USA 2007, 104, 6908–6914. [Google Scholar] [CrossRef] [Green Version]
  67. Bonner, E.S.; Engle, J.T.; Sripothongak, S.; Ziegler, C.J. Zinc Complexes of the Carbahemiporphyrazines. Dalt. Trans. 2010, 39, 1932–1934. [Google Scholar] [CrossRef] [PubMed]
Figure 1. Structure of ligand L together with 1H NMR labelling scheme.
Chemosensors 10 00188 g001
Scheme 1. Synthetic pathway of ligand L.
Chemosensors 10 00188 sch001
Figure 2. Fluorescence emission of L in different aqueous HEPES/ACN mixtures. [L] = 3.2 × 10⁻⁶ mol dm−3; [HEPES] = 1.0 × 10⁻³ mol dm−3; pH 7.4; λex = 305 nm.
Chemosensors 10 00188 g002
Figure 3. Fluorescence emission increase upon addition of 1 equivalent of Cd2+ to a solution of L in different ACN—aqueous HEPES buffer v/v solvent mixtures. [L] = 3.2 × 10⁻⁶ mol dm−3; [HEPES] = 1.0 × 10⁻³ mol dm−3; pH 7.4; λex = 305 nm. λem = 390 nm (100% aqueous HEPES), 394 nm (80% aqueous HEPES), 397 nm (60% aqueous HEPES), 398 nm (40% aqueous HEPES), and 398 nm (20% aqueous HEPES).
Chemosensors 10 00188 g003
Figure 4. Fluorescence emission spectra of L registered in an ACN–water 4:1 v/v solvent mixture in the pH range of 2−12. Inset: trend of emission intensity at 395 nm at different pH values. [L] = 3.2 × 10⁻⁶ mol dm−3, λex = 305 nm. pH adjusted by adding HCl and NaOH aqueous solutions.
Chemosensors 10 00188 g004
Figure 5. Trend of selected 1H NMR signals of aliphatic L protons in an acetonitrile–d3/D2O 60:40 solution as a function of the pH. [L] = 5 × 10⁻³ mol dm−3. See Figure 1 for the assignments.
Chemosensors 10 00188 g005
Figure 6. Proposed disposition of H+ in the protonated forms of the ligand.
Chemosensors 10 00188 g006
Figure 7. Bar-plot showing the emission of L upon addition of 2 equivalents of different metal cations (Zn2+, Cd2+, Pb2+, Cu2+, Hg2+). I and I0 are the emission intensities of the ligand in the presence and absence of the metal ions, respectively. [L] = 3.2 × 10⁻⁶ mol dm−3 (ACN–aqueous HEPES (pH 7.4) 4:1 v/v solvent mixture). λex = 305 nm. λem = 385 nm (Zn2+), 390 nm (Cd2+), 395 nm (Pb2+), 397 nm (Hg2+), and 410 nm (Cu2+).
Chemosensors 10 00188 g007
Figure 8. Variation of the fluorescence emission spectra of L by adding Zn(ClO4)2 registered in an ACN–aqueous HEPES pH 7.4, 4:1 v/v solvent mixture. Inset: trend of emission intensity of L at 385 nm. [L] = 3.2 × 10⁻⁶ mol dm−3. λex = 305 nm. Emission intensities are relative to the free ligand.
Chemosensors 10 00188 g008
Figure 9. Variation of the fluorescence emission spectra of L by adding Cd(ClO4)2 registered in an ACN–aqueous HEPES pH 7.4, 4:1 v/v solvent mixture. Inset: trend of emission intensity of L at 390 nm. [L] = 3.2 × 10⁻⁶ mol dm−3. λex = 305 nm. Emission intensities are relative to the free ligand.
Chemosensors 10 00188 g009
Figure 10. Front view (top) and side view (bottom) of the computed structures of (from left to right) L, [ZnL]2+ and [Zn2L]4+. Hydrogen atoms are omitted for the sake of clarity.
Chemosensors 10 00188 g010
Table 1. Results of reactions 1 and 2 obtained by DFT calculations for Zn2+ and Cd2+ complexes of L.
Compound∆G (kcal/mol) 1∆G (kcal/mol) 2DIST1 (Å)DIST2 (Å)
[ZnL]2+−331.8−331.30.36 38.79 5
[Zn2L]4+−367.5−366.40.33 38.84 5
0.072 46.20 6
[CdL]2+−289.8−288.10.47 39.53 5
[Cd2L]4+−277.1−275.20.49 39.57 5
0.23 46.79 6
1 Energies calculated by BP86 functional. 2 Energies calculated by B3LYP functional. 3 Distance of the metal ion from the mean plane containing the aliphatic nitrogen atoms (plane 1). 4 Distance of the metal ion from the mean plane containing the aromatic nitrogen and carbon atoms (plane 2). 5 Sum of M-Naliphatic distances. 6 Sum of M-Naromatic and M-Cphenyl distances.
Publisher’s Note: MDPI stays neutral with regard to jurisdictional claims in published maps and institutional affiliations.

