Article

Acoustic Vibration Modes of Gold–Silver Core–Shell Nanoparticles

1
LuMIn, CNRS, ENS Paris-Saclay, CentraleSupélec, Université Paris-Saclay, 91190 Gif-sur-Yvette, France
2
Institut des Molécules et Matériaux du Mans, UMR 6283 CNRS, Le Mans Université, 72085 Le Mans, France
3
EuroFEL Support Laboratory (EFSL), Istituto di Struttura della Materia-CNR (ISM-CNR), 00100 Rome, Italy
4
LPS, CNRS, Université Paris-Saclay, 91405 Orsay, France
*
Author to whom correspondence should be addressed.
Submission received: 11 April 2022 / Revised: 11 May 2022 / Accepted: 16 May 2022 / Published: 20 May 2022

Abstract

:
Bimetallic Au/Ag core–shell cuboid nanoparticles (NPs) exhibit a complex plasmonic response dominated by a dipolar longitudinal mode and higher-order transverse modes in the near-UV, which may be exploited for a range of applications. In this paper, we take advantage of the strong signature of these modes in the NP ultrafast transient optical response, measured by pump-probe transient absorption (TA) spectroscopy, to explore the NP vibrational landscape. The fast Fourier transform analysis of the TA dynamics reveals specific vibration modes in the frequency range 15–150 GHz, further studied by numerical simulations based on the finite element method. While bare Au nanorods exhibit extensional and breathing modes, the bimetallic NPs undergo more complex motions, involving the displacement of facets, edges and corners. The amplitude and frequency of these modes are shown to depend on the Ag shell thickness, as the silver load modifies the NP aspect ratio and mass. Moreover, the contributions of the vibrational modes to the experimental TA spectra are shown to vary with the probe laser wavelength at which the signal is monitored. Using the combined simulations of the NP elastic and optical properties, we elucidate this influence by analyzing the effect of the mechanisms involved in the acousto-plasmonic coupling.

Graphical Abstract

1. Introduction

The last two decades have witnessed unprecedented development in the synthesis of noble metal nanoparticles (NPs), in their applications, and in the techniques used to characterize them. While continuous-wave spectroscopy probes the stationary optical properties of the NPs, ultrashort and intense pulses of laser light can excite a series of energy exchange processes, each of them being characterized by a specific timescale [1]. The light energy is initially absorbed by the electron gas, which is driven out of thermodynamical equilibrium. The energy is then redistributed within the electron gas and transferred to the lattice, through electron–electron and electron–phonon collisions, respectively, and the nanoparticle heats up. All these processes last for less than a few picoseconds. The thermal energy is further released into the surrounding medium through the interface. The steep initial warming up of the nanoparticle, which is homogeneous as the thermal energy is spread rapidly in the metal by electron transport, results in the sudden lattice expansion which launches a set of coherent acoustic vibration modes [2]. As the optical response of the NPs is very sensitive to their size, shape and crystal parameters, any lattice expansion or contraction modulates this response, especially in the spectral region of the plasmon modes. The time-resolved pump-probe experimental method is therefore well suited to study the vibration modes of nanoparticles: the vibrations are initiated by the pump laser pulse, whereas the probe light pulse is used to monitor their temporal evolution by altering its delay time with respect to the pump [3,4].
Among all NPs, single-metal spheres are the easiest to synthesize and model in terms of mechanical properties and, as a result, were studied early on [5,6,7,8]. Since then, other shapes have been investigated, such as ellipsoids [9], rods [10,11,12], bipyramids [13,14], rings [15], disks [16] and polyhedra [17]. Other studies [13,18,19,20] reviewed the origins of damping (internal or due to a liquid medium or to a substrate). When a shell consisting of a different material is grown over a core NP, the vibration modes change, not only in frequency but also in structure and number, with the appearance of new resonances involving the inner interface and the precise morphology of the core and shells [10,21]. Owing to very similar lattice parameters, epitaxial deposition of silver on gold results in Au/Ag core–shell NPs, with a morphology that depends on the crystalline structure of the gold core and on the growth conditions [22,23].
Due to their anisotropy, the mechanical behavior of rod-like NPs [12] is richer than that of their spherical counterparts [8]. As for single metal NPs, rod-like core–shell NPs exhibit specific vibrational modes characterized by a periodic displacement of matter in some directions: the fundamental extensional mode corresponds to a simultaneous axial expansion and radial contraction motion (thus with a zero or small change in total volume) whereas the breathing mode corresponds to a radial NP expansion (thus with volume change) [2]. In a pioneering study [24], Au/Ag core–shell NPs were synthesized with varying aspect ratio and shell thickness, and the frequency of the extensional mode was measured and discussed in terms of an analytical model wherein the object was considered to be homogeneous, with a single Young’s modulus and with an effective density depending on the Ag/Au ratio. The authors observed the breathing mode only for the thickest shell. Cardinal and co-workers [25] followed the behavior of the extensional and breathing modes of a Au/Pd system with increasing shell thickness and obtained good agreement with a realistic numerical model that accounted explicitly for the layered structure and for the tip geometry. Changes in the mode frequencies could be detected for Pd/Au ratios as low as 5%. The previous references used ensembles of NPs in solution, where the measurements are affected by the inherent size and shape polydispersity. To eliminate this problem, Yu et al. [26] deposited individual gold nanorods (AuNRs) on a glass substrate and gradually grew silver shells on them, whereas monitoring both the white light scattering spectrum (to determine the shell thickness) and the pump-probe signal, which yields the acoustic vibration spectrum. The breathing frequency decreases with the addition of silver, whereas the extensional mode is almost unchanged. Related systems based on gold bipyramids [27] or nanosphere dimers [28] have also been prepared and studied.
In this paper, we investigate the acoustic vibration modes of bimetallic AuNR@Ag core–shell NPs depending on the amount of silver deposited onto the gold nanorod core. For this, the results of time-resolved pump-probe transient absorption (TA) spectroscopy experiments are analyzed by the fast Fourier transform (FFT) method, which allows us to identify the vibration modes. In addition, we perform numerical calculations of the NP optical and elastic properties, revealing the nature of each of the modes identified. The experimental vibration spectra depend on the wavelength of the probe at which the TA signal is monitored. This is elucidated by analyzing the effects of the different mechanisms contributing to the acousto-plasmonic coupling.

2. Materials and Methods

2.1. Nanoparticle Synthesis

The synthesis of the AuNR@Ag NPs was carried out in two steps. First, AuNRs were synthesized by seed-mediated growth, which involves a prereduction step with salicylic acid [29]. Then, a silver shell was epitaxially grown onto the gold nanorods and its thickness was controlled by adjusting the amount of silver precursor and ascorbic acid as a reducing agent in the reaction mixture [30,31,32]. The silver-to-gold ratio, denoted by “eq”, was varied (i.e., eq = 0, 0.8, 2, 4, 8), leading to important changes in the optical properties of the nanoparticles.

2.2. Characterization

The sample characterization was already published elsewhere [32]. Size and shape distribution are assessed by transmission electron microscopy (TEM) performed at IMAGIF (I2BC CNRS, Gif s/Yvette, France) using a JEOL JEM-1400 microscope operating at 120 kV with a filament current of about 55 μA. Optical extinction spectra are determined by conventional UV-Vis-NIR spectroscopy using a Cary 5000 (Agilent) spectrophotometer. All experiments were carried out at room temperature, using disposable polystyrene cuvettes with optical path of 1 cm. Gold concentration was estimated from the absorbance at 400 nm [33,34].

2.3. Pump-Probe Transient Absorption Spectroscopy

We performed TA spectroscopy measurements by using a pump-probe scheme. The laser system is an 800 nm, 1 kHz chirped-pulse amplifier seeded by a Ti:Sapphire mode-locked oscillator. An optical parametric amplifier (OPA) is used to produce a tunable pump beam with a diameter of about 400 µm and a pulse length of about 50 fs. The probe is a white light supercontinuum (350–800 nm) generated in a commercial TA spectrometer (FemtoFrame II, IB Photonics) by focusing 3 µJ of 800 nm radiation into a rotating CaF2 crystal. The spot diameter of the probe pulse is approximately 150 µm, and its time delay with respect to the pump pulse is scanned in time by varying the length of its optical path. TA spectra with different temporal step sizes were acquired in order to detect oscillations on the time scale of both few and tens of picoseconds with a good signal to noise ratio. The instrument response function (IRF) was measured to be approximately 50 fs. All measurements were performed in air at room temperature. More details on the setup can be found in previous studies [35,36]. The AuNR and AuNR@Ag bimetallic solution samples were placed in 1 mm thick quartz cuvettes. The measurements reported were performed using a pump laser wavelength of 380 nm and a fluence of 446 µJ cm−2.

2.4. Fast Fourier Transform Analysis

As stated above, due to the excitation of the NP coherent vibrations a spectral modulation of the TA features associated with the plasmon modes can be observed over time. The frequency of the vibrations causing these transient modifications can then be obtained by following the oscillation of their signal intensity (at a fixed wavelength) in the TA map. The wavelength corresponding to the maximum intensity of the signal (either negative or positive) is generally not highly sensitive to variations induced by the oscillations, thus we chose to follow the intensity at wavelengths on the edges of the plasmonic bands, where the intensity is close to zero. We used a spline function to remove the dependence of the signal oscillation on the slow decay component stemming from the NP cooling down by heat transfer to the host medium (see Supplementary Materials Section S4). The resulting data are then analyzed by FFT to estimate the frequencies of the oscillations.

2.5. Numerical Simulations

The AuNR is modeled as a hemisphere-capped cylinder and the silver shell, for the core–shell (AuNR@Ag) NP, is designed to take a cuboidal shape following the TEM image of the synthesized nanostructures. Both the mechanical and optical responses of the NPs are simulated using a Finite Element Method (FEM) in COMSOL Multiphysics®.
The vibrational properties are determined by solving an elastodynamic equation, namely the Navier’s equation, assuming that the vibrations are triggered by the femtosecond laser-induced impulsive thermal strains in the NPs [9]. Details can be found in Appendix A. From the results, we extract the frequency-dependent norm of the vibration displacement, | u | . The mechanical coupling at the Au/Ag interface of the bimetallic NPs can be disregarded as it has no influence on their vibrational modes [26]. Indeed, it has been reported that bimetallic core–shell NPs that are synthesized by epitaxial growth undergo a full object oscillation (only the fundamental vibrational modes are observed) similar to monometallic NPs [3] due to the homogenous heating of the NPs as a result of the perfect mechanical interface between the core and shell metals [25].
The optical properties are computed by solving the frequency-dependent electromagnetic wave equation in the frequency domain (see Appendix B for details). We obtain the absorption, σ a b s , scattering, σ s c a , and extinction, σ e x t , cross-sections of the NPs.

3. Results

3.1. Sample Characteristics

Five samples are synthesized, from eq = 0 (bare AuNRs) to eq = 8 (AuNRs coated with a thick Ag shell). As shown by TEM [32], Ag grows preferentially along the transverse dimension of the NPs; therefore, the overall aspect ratio (AR) decreases, and the initial rod-like NPs become cuboidal. In addition, the edges and corners become sharper with increasing Ag shell thickness. TEM images of four of our samples are displayed in the Supplementary Materials, Figure S1. The bare AuNRs and the gold core in AuNR@Ag NPs are single crystals, featuring eight {520} lateral facets and a combination of {110} and {111} faces on the tips [37]. In the presence of hexadecyltrimethylammonium chloride (CTAC), Ag grows by forming {100} facets, which changes the outer octagonal cross section to a squarer shape while preserving the gold core morphology [38]. The average total length and Ag thickness at the tips range from 47.6 to 60.0 nm and from 0.0 to 12.4 nm, respectively, whereas the average total width and lateral Ag thickness range from 15.8 to 34.0 nm and from 0.0 to 18.2 nm, respectively, with increasing the Ag:Au molar ratio from eq = 0 to eq = 8.
The steady state optical extinction spectra (reported in the Supplementary Materials) present multiple plasmonic resonance modes, which are sensitive to both the presence of Ag and its amount around the AuNR core. As already analyzed in Ref. [32], they originate either from dipolar modes characterized by in-phase induced charges at the inner and outer NP interfaces (longitudinal L0 et transverse T0 dipolar modes), or multipolar transverse modes stemming from mirror charges at the inner and outer interfaces (transverse Ti modes, i > 0). The larger i, the higher the energy of the mode.

3.2. Time-Dependent TA Spectra

The TA maps present plasmonic bleaching features which can be associated with the respective resonance modes identified in the stationary regime [32]. In particular, the TA map of the bare AuNR sample excited at 380 nm (see Supplementary Materials Section S3) shows two typical plasmonic bleaching signals which can be attributed to the transient modification of the transverse surface plasmon resonance (TrSPR) and the longitudinal one (LgSPR): The LgSPR is excited by an electric field polarization along the AuNR longitudinal axis, whereas the TrSPR corresponds to an electric field polarization perpendicular to the longitudinal axis. Figure 1 reports the temporal profile of the TA signal probed at the edge of the LgSPR band in the stationary regime (699 nm). The spectra show the intensities of the transient signal (represented as a variation of optical density, in mOD) as a function of the temporal delay between the pump and the probe beams. The dynamics in the first few picoseconds is strongly affected by energy exchanges between the photoexcited electrons with the rest of the electron gas by electron–electron (e–e) scattering and with the lattice through electron–phonon (e–ph) collisions. On the hundreds of picoseconds time scale, the energy within the nanorod dissipates to the environment through phonon–phonon (ph–ph) scattering [1]. Superimposed on this long decay signal, two oscillatory behaviors are clearly visible in Figure 1, the main one with a period of ca. 60 ps and the other with a period of less than 10 ps. The latter is better shown in the inset, which shows the temporal profile between 10 and 60 ps, acquired with a shorter temporal step size. These oscillations are due to the interaction of the vibrational modes of the nanorods with the LgSPR.
The TA maps of the bimetallic AuNR@Ag samples present additional features in the near-UV spectral range (see Supplementary Materials, Figure S3), which gain intensity for the larger Ag shell thickness NPs. As in the case of AuNRs, the transient profiles of these signals decay according to typical NP relaxation dynamics, i.e., e–e, e–ph, and ph–ph scattering. To reiterate, intensity oscillations are observed superimposed on this general trend: as an example, Figure 1b reports the temporal profile of the TA signal of AuNR@Ag 8eq, probed at the edge of the LgSPR band in the stationary regime (526 nm).

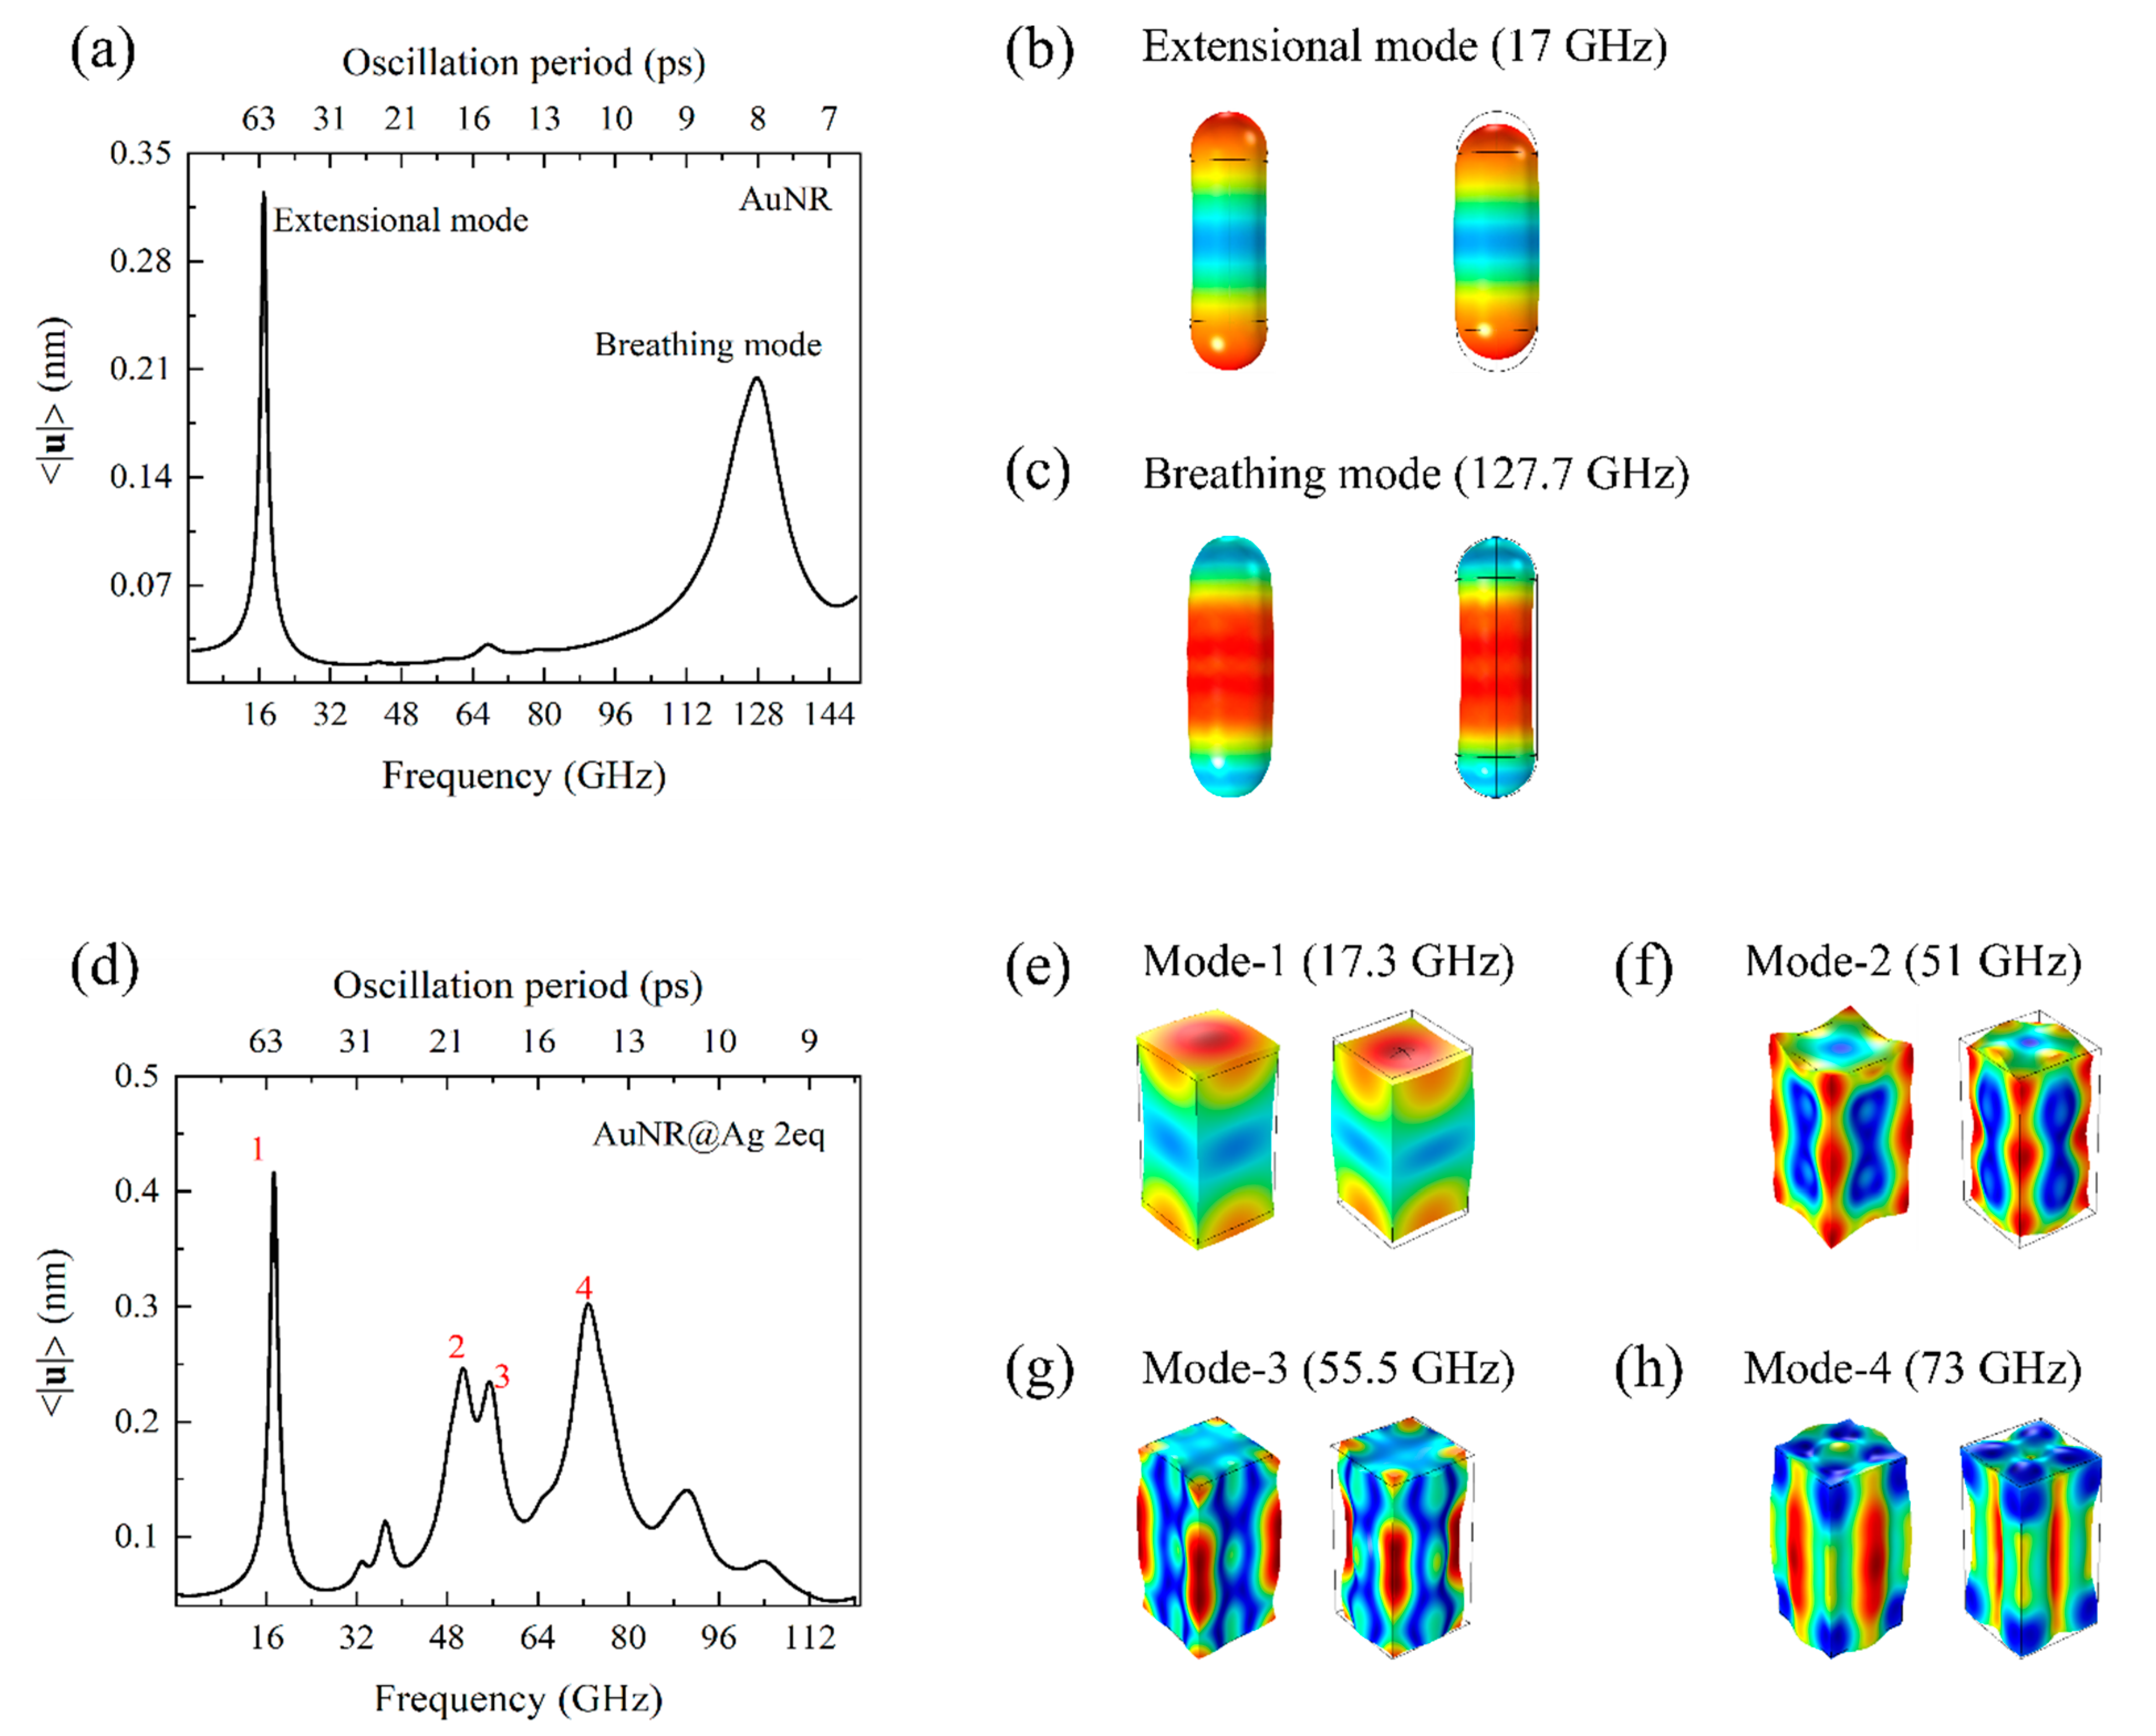
3.3. Vibration Mode Identification

Figure 2a reports the FFT spectrum obtained from the temporal TA profile of AuNRs at 699 nm shown in Figure 1. The FFT spectrum in the inset refers to the TA spectrum acquired with a shorter temporal step size (inset of Figure 1). The FFT analysis points to mainly two vibrational modes around 17 GHz (ca. 60 ps period) and 130 GHz (ca. 8 ps period).
Figure 2b shows the FFT spectra obtained from the temporal TA profiles of the AuNR@Ag 8eq sample, at 526 nm (longitudinal L0 mode domain), 424 nm (transverse T1 mode domain) and 356 nm (transverse T3 mode domain) probe wavelengths. It can be seen that the breathing mode appears more clearly when optically probing close to the T1 transverse plasmon mode, while being largely absent when probing at the L0 longitudinal mode. On the contrary, the extensional mode is much sharper in the second case. More generally, the vibration spectrum extracted from the TA dynamics strongly depends on the probe wavelength at which the FFT analysis is performed. This can be also directly observed on the TA spectral charts (see Figure S3 in the Supplementary Materials). Some optical spectral zones are more sensitive to specific vibration modes. This will be discussed in Section 4.3.

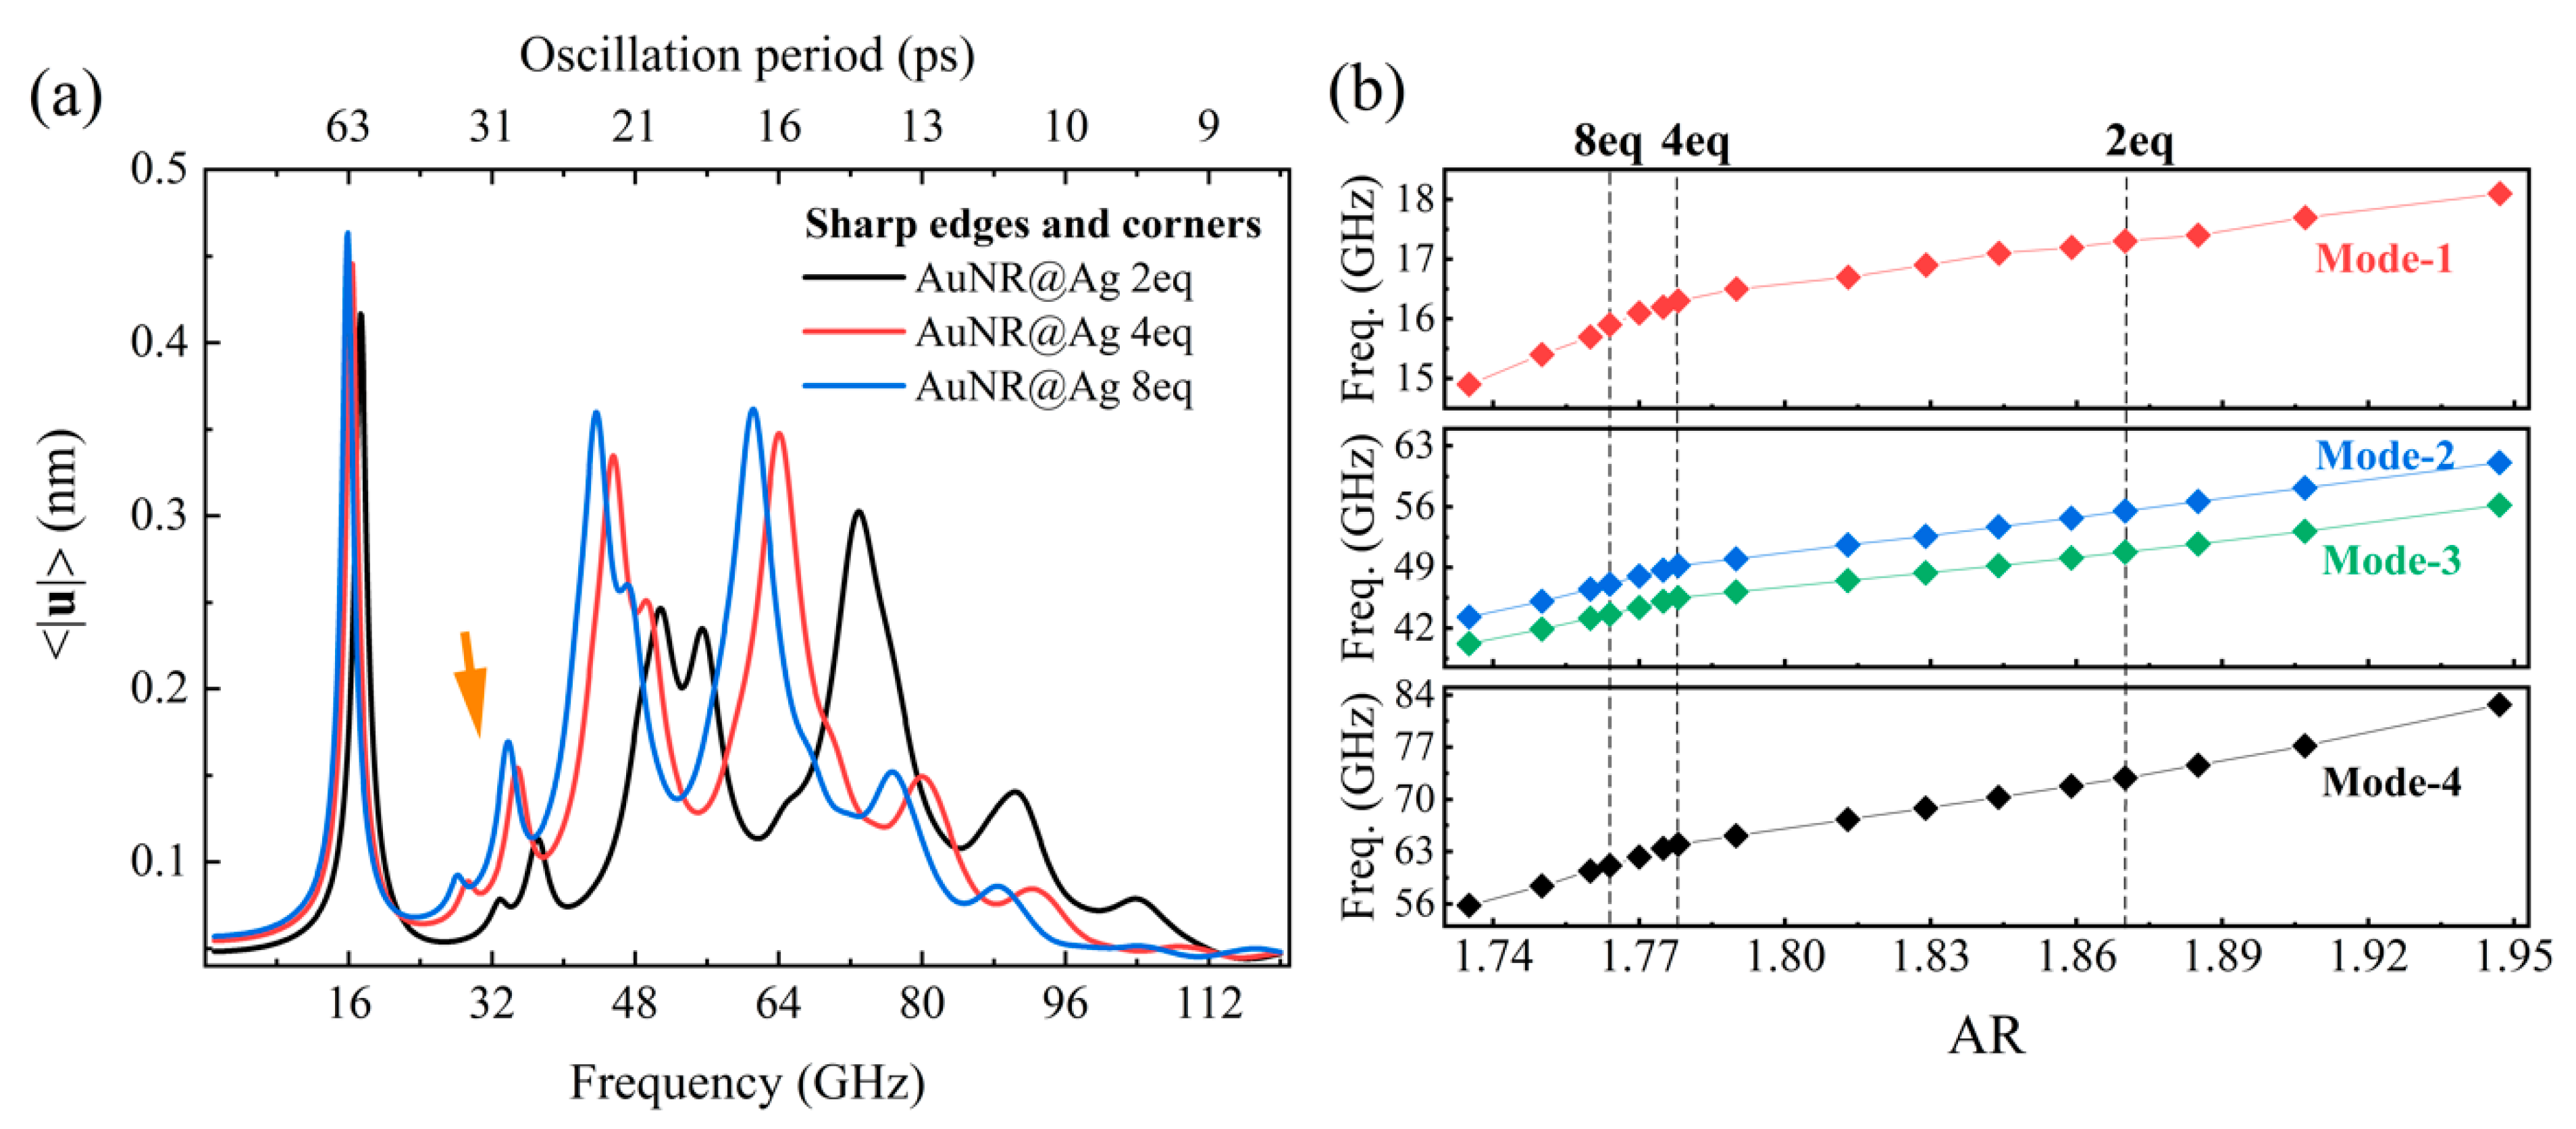
3.4. Ag-Shell Thickness Dependence of the Mode Frequency

Figure 3 reports the FFT spectra obtained from the temporal TA profiles of the AuNR and AuNR@Ag NP samples probed in the vicinity of each of the LgSPR (L0) plasmon modes of the corresponding stationary absorption spectra. All the spectra show an intense extensional mode around 17 GHz and a number of minor features not well spectrally resolved. While the frequency of the extensional mode does not change significantly for the different samples, the other modes appear to shift as highlighted by the shadow arrow in the figure: the frequency (temporal period) of the modes decreases (increases) when increasing the silver amount. In particular, the frequency range of the less intense modes appears to be around 110–150 GHz for AuNR, 70–140 GHz for AuNR@Ag 0.8eq, 40–120 GHz for AuNR@Ag 2eq, 30–90 GHz for AuNR@Ag 4eq, 30–80 GHz for AuNR@Ag 8eq. This will be discussed in Section 4.2.

4. Discussion

4.1. Identification of the Modes

The dimensions that are obtained from the TEM analysis are used to calculate the mechanical properties of the NPs. The frequency-dependent norm of the vibration displacement, | u | , averaged over the whole NP volume, is extracted from the simulation in order to unveil all the modes that would possibly exist within the given frequency range of interest. Figure 4a,d display these modes for AuNR and AuNR@Ag 2eq NPs, respectively.
On the one hand, two vibration modes are excited in the AuNR (Figure 4a), with frequencies of 17.0 and 127.7 GHz. From the 3D color plot in Figure 4b it can be seen that at the 17 GHz frequency the NP undergoes a motion of combined anti-phase axial expansion/contraction and radial contraction/expansion, which corresponds to the extensional mode. In contrast, at 127.7 GHz the NP experiences a pure radial expansion/contraction motion (Figure 4c); this corresponds to the breathing mode. On the other hand, multiple modes are excited in the bimetallic NPs, as revealed by the FEM simulation that detects all the NP vibration modes. This is consistent with our experimental result where the FFT analysis picks up multiple modes for these samples, Section 3.3. The four most dominant modes amongst the numerically detected vibration modes of the AuNR@Ag 2eq NP are labeled from 1 to 4 with increasing frequency in Figure 4d. These modes consist of a lower- and higher-frequency modes, labeled 1 and 4, and a mode with twin peaks (labeled 2 and 3) that appears between the two. This contrasts with the literature where only two modes, extensional and breathing, were reported for bimetallic core–shell NPs with a AuNR core and a thinner Ag [19,24] or Pd [25] shell. First, NPs with a thin shell coating have a rod-like shape, whereas the AuNR@Ag samples considered here (with a thicker Ag coating) have cuboid (orthogonal parallelepiped) shapes (see Section 2.1) whose vertices and edges also contribute to the appearance of additional vibration modes [17,39,40]. This can be seen from the mode shapes, in Figure 4e–h, of the AuNR@Ag 2eq sample having sharp edges and corners. Second, the analysis in Ref. [24], where some of the samples exhibit a cuboidal NP shape, relies on the a priori assumption of only two vibration modes. In Ref. [25], the authors examine the effect of the Pd-shell thickness dependence of the mode frequencies of square-section bimetallic AuNR@Pd NPs by a FEM-based analysis (see the Supplementary Materials file of this reference). However, they do not show the total vibration landscape and focus rather on the only breathing and extensional modes. Let us mention that a vibration mode involving the motion of corners has been recently identified in silver nanocubes [41].
Figure 4f,g display the NP deformation of the twin modes 2 and 3. For mode 2, corners and the central regions of both the top and lateral edges are involved in the oscillation, as reported in Figure 4f. The top edges contribute very little, whereas the lateral edges and the corners contribute significantly and almost equally to this vibration. In Figure 4g, we observe that the shape of mode 3 takes over a larger portion, along its length, of the lateral edge with little involvement of the corners. The low-frequency mode (Figure 4e) is an extensional mode, whereas the high-frequency one (Figure 4h) is a breathing mode. The extensional mode exhibits mainly opposite motions of the top and bottom square bases of the cuboid NP along its axial direction, whereas the breathing mode corresponds to the radial motion of the rectangular lateral faces.

4.2. Ag-Shell Thickness Dependence of the Spectra

In the previous sub-section, we have identified and discussed the vibrational modes that are present in AuNR@Ag 2eq NPs. Similar spectral features are determined for the NPs of thicker Ag coating. However, the redshift mode and its amplitudes increase for the AuNR@Ag 4eq and 8eq NPs compared with those of the AuNR@Ag 2eq NP, as revealed by Figure 5a. The modeshifting will be discussed later in this section but let us first focus on the qualitative changes in resonance amplitude with varying Ag deposition. In Figure 5a, the increase in the amplitude of mode 3 of the AuNR@Ag 4eq and 8eq is not as intense as that of mode 2 and of the others. As we have discussed in the previous sub-section, mode 3 is dominated by a lateral edge oscillation and, therefore, the decrease in its length relative to the NP width, due to the disproportionate material deposition, influences its amplitude. On the contrary, we observe a pronounced enhancement in the modes that are dominated by the vertex oscillations, namely, mode 2 and the minor modes that appear between modes 1 and 2 (see the arrow in Figure 5a and Figure S5 in the Supplementary Materials). This could be taken as an indicator for a progressive transformation of the cuboid NPs into cubic NPs, in which the vertex oscillation contribution plays a large part, if the Ag overgrowth is continued further [17,40].
Let us now discuss about the vibration mode shift. Overall, the vibration frequency of each mode is lowered when the AR is decreased, that is, when the Ag shell thickness increases. This can be seen in the computed AR-dependent evolution of the mode frequencies in Figure 5b. For these simulations, the lateral and longitudinal Ag shell thicknesses that were obtained from the TEM analysis of the AuNR@Ag 2eq, 4eq, and 8eq samples were interpolated independently to determine the dimensions of the new NPs. The new Ag shell thickness obtained together with the longitudinal and lateral dimensions of the core AuNR make up the total dimensions of these new NPs. We chose a few of them along with the AuNR@Ag 2eq, 4eq, and 8eq NPs for the AR-dependent simulation data shown in Figure 5b. The computed AR dependence agrees with the previous reports in the literature [25,26], in which all the mode frequencies decrease with the increasing Ag coating (leading to a decrease in the AR, as stated above). This is due to the fact that, globally, adding matter onto the nanoparticle (here, in the form of Ag coating) leads to the decrease in its vibration frequencies. Indeed, the increase in NP dimension in the NP area involved in a vibration motion lowers the vibration frequency of the corresponding mode. This was shown analytically by previous authors, such as, for instance, in Ref. [25], which demonstrates that the addition of Pd on Au rods at their side (resp. tips) results in the increase in the oscillation period of the breathing (resp. extensional) mode. This can be related to the proportionality of the breathing and extensional modes of a bare nanorod to its length and width, respectively, as shown in Ref. [2]. The extensional mode shift (upper panel in Figure 5b) is small compared with the other mode-frequency shifts. Of course, the Ag deposition occurs preferentially along the lateral dimension and hence smaller mass is added to the NP tips (cf. Section 3.1), which translates into the AR-dependence.
Furthermore, TEM images reveal that the bimetallic nanoparticles have different degrees of roundness depending on the Ag layer thickness. They progress from a rounded rod-like shape with thin shell to cuboids with a thick shell, having sharper corners and edges [32,42]. We have computed the mechanical oscillations of the AuNR@Ag 2eq NP for different degrees of rounding (see Figure S7 in the Supplementary Materials). More rounding of the NP leads to a decrease in the amplitude of the modes which are dominated by corner vibrations, modes I and II (see Figure S5 in the Supplementary Materials) and mode 2 (see Figure 4f). As the rounding radius increases, the displacement field localized at the pointy corners spreads to the neighboring faces and edges of the NP, resulting in the mode amplitude reduction for the vertex-dominated oscillations. Modes 2 and 3 seem to compete amongst themselves to form the third dominant oscillation mode at the middle of the extensional and breathing modes of the bimetallic NPs. Mode 2 dominates when the AR is reduced, whereas mode 3 takes over in the higher AR NPs as well as the rounded ones (see Figures S6 and S7 in the Supplementary Materials).
Let us stress that the direct comparison of the mode frequencies obtained experimentally and by simulation is not straightforward. Indeed, on the one hand, the precise mode frequencies extracted by FFT from the experimental time-varying TA signal depend on the wavelength at which this signal is monitored (see Figure 2b), as will be discussed below. On the other hand, the mode frequencies depend on many parameters which are difficult to account for accurately in the simulation: rounding of edges and corners, NP shape and AR distributions in the actual samples (as large ensembles of NPs are probed while the simulations are carried out for single NPs). These experimental distributions also result in the broadening of the peaks in the FFT-derived vibration spectrum as well as in a larger damping of the time-dependent TA oscillations than with a theoretical monodisperse sample. Nonetheless, the overall features highlighted by the above theoretical analysis are confirmed by the comparison of Figure 3 with Figure 5a: on increasing the Ag layer thickness, we observe small changes in the frequency of the extensional mode, the appearance of additional modes between the extensional and breathing ones, and a redshift in the breathing and intermediate modes.

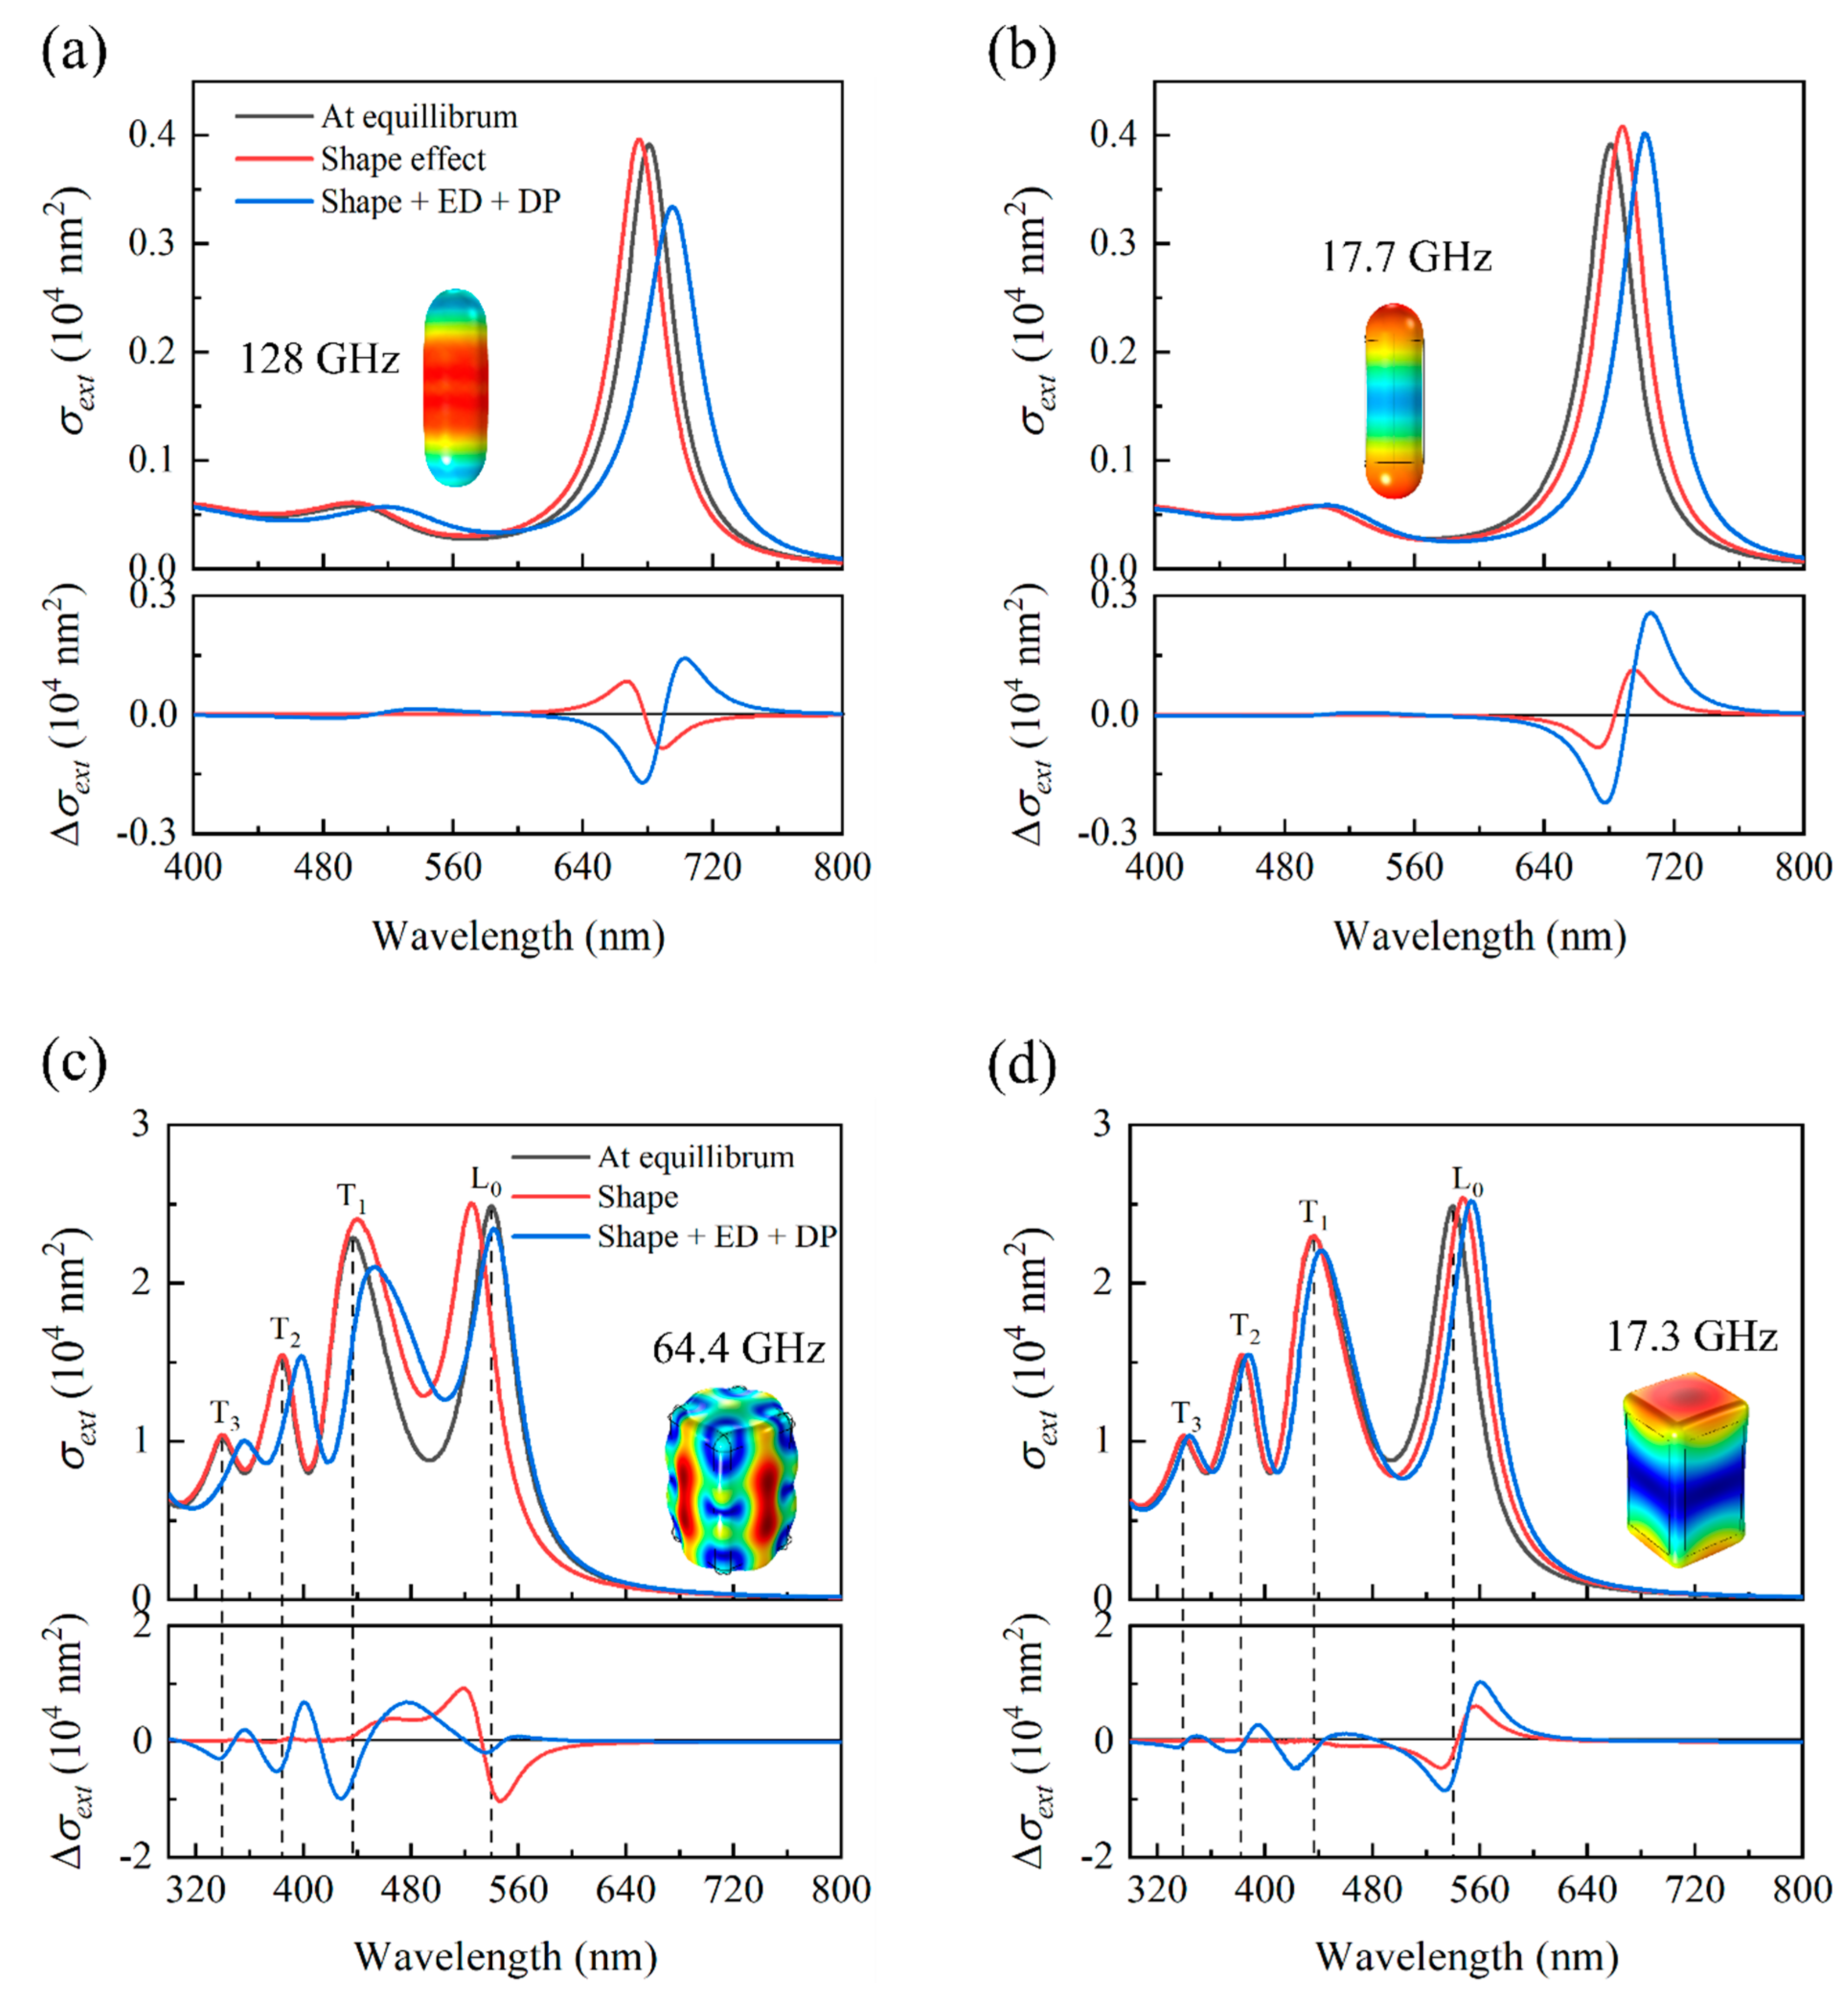
4.3. Acousto-Plasmonic Coupling

In the former subsections, we have discussed the vibrational modes of the NPs and, especially for the bimetallic ones, their dependence on the NP AR and roundness. Furthermore, it is worth noting that the FFT-derived vibrational spectra have been demonstrated to depend on the probe wavelength at which the TA dynamics are monitored, as revealed by Figure 2b for the 8eq sample. Let us now analyze this probe wavelength dependence of the experimental vibrational spectrum in light of the acousto-plasmonic coupling mechanisms. First, the calculated stationary optical extinction spectra are fitted to the experimental ones so that they share the same SPR mode peak locations. In order to obtain a satisfying fit, especially for the bimetallic NPs, both the dimensional and rounding parameters need to be adjusted [32,42]. Following the framework given in the Appendix B, we compute the optical properties of the AuNR and AuNR@Ag 4eq NPs, which agree quite well with their experimental counterparts (see Figure S9 in the Supplementary Materials). The model AuNR has a length of 49.0 nm and diameter of 15.8 nm, whereas the AuNR@Ag 4eq is given the additional longitudinal Ag thickness of 8 nm and lateral Ag thickness of 19 nm with rounding radius R = 4 nm. These parameters are then used for the study of the acousto-plasmonic coupling.
The two main mechanisms that contribute to the acousto-plasmonic coupling are the opto-mechanical and photo-elastic couplings. The former is related to the NP shape change whereas the latter is due to its volume change [40,43]. For modeling the opto-mechanical coupling effect, first, the mechanical vibrations of the NP were calculated as described in the Appendix A. Then, the obtained 3D surface plots of the displacement amplitude, u , are used to determine the NP maximum deformed shapes on the basis of which the distorted NP optical properties are computed following the method detailed in the Appendix B. Using the same numerical tool for both the mechanical and optical property calculations is advantageous, as it allows the same meshing and other simulation conditions to be employed for both the equilibrium and deformed NPs [43].
The acoustic vibration-induced periodic change in NP volume, while keeping the total number of free electrons constant, modulates the free electron density. This induces a change in the bulk plasma frequency, as well as in other electronic parameters such as the Fermi energy. The free electron contribution to the metal dielectric function (Drude contribution) is then periodically modulated (see Ref. [40] for instance). Consequently, the change in the bulk plasma frequency can be estimated from the modified free electron density (ED), N : ω p = N e 2 / ε 0 m e ( ε 0 is the permittivity of vacuum, e is the electron charge and m e is its effective mass). Additionally, the strain that is exerted on the metal lattice while the NP undergoes the expansion/compression dynamics leads to changes in its electronic band structure and, consequently, in the interband transition frequencies, ω 0 , m (see Appendix B). This change can be evaluated using the deformation potential (DP) [40]. Both the ED and DP effects are related to the acoustic vibration induced relative volume change, Δ V / V , of the NPs. Therefore, we extract Δ V / V from the mechanical simulations, for each NP, and use it to model the contributions of ED and DP in the change of the dielectric function, ε r , through the new ω p and ω 0 , m (see Equation (A6) of Appendix B and Section S5 of the Supplementary Materials for details).
Figure 6 reports the acousto-plasmonic coupling effect on the extinction spectra of AuNR and AuNR@Ag 4eq samples computed at the two extreme vibration mode frequencies, extensional and breathing (modes 1 and 4 for the bimetallic NP). Considering only the shape effect, the LgSPR of the AuNR blueshifts during the breathing mode expansion (red curve in Figure 6a), whereas it redshifts during the extensional mode expansion (red curve in Figure 6b). This was expected since the shape change results in the modification of the AuNR AR: the AR is reduced during the breathing mode expansion and becomes enlarged when it undergoes a longitudinal expansion at the extensional mode. The shape effect is not observable for the TrSPR since this mode is not very sensitive to changes in the AR compared with the LgSPR.
However, both the TrSPR and LgSPR are affected when the ED and DP (photo-elastic) effects are accounted for through the dielectric function change (blue curves in Figure 5a,b). Unlike the opto-mechanical case, the TrSPR preferentially couples to the breathing mode by means of the photo-elastic mechanism since this phonon mode affects the AuNR volume the most (see Figure S10 in the Supplementary Materials). An overall redshift in both SPR modes is observed during both the breathing and the extensional mode expansion. The photo-elastic effects efficiently counter the blueshift in the LgSPR induced by the shape modification of the breathing mode (blue curve in Figure 6a), whereas they appear to reinforce its redshift in the extensional mode (blue curve in Figure 6b). In addition, the LgSPR peak is damped along the expansion at the breathing mode, whereas its width is almost not affected by the extensional mode. Indeed, the effective photo-elastic mechanism results in an increase in both the real and imaginary parts of the dielectric function of gold where the former is responsible for the redshift in the SPR, whereas the latter induces its damping [43]. The magnitude of these modulations of the dielectric function components induced by the NP deformation are different depending on the vibrational mode excited, which results in the different trends observed. The respective influences of the opto-mechanical and photo-elastic effects on the SPR modes of the AuNR are in line with previous studies [40,43].
We now proceed to the discussion of the acousto-plasmonic coupling in bimetallic NPs. It can be observed from Figure 6c,d that the opto-mechanical mechanism preferentially influences the SPR modes that are at the lower photon energy during both the breathing (mode 4) and extensional (mode 1) mode expansion. On the one hand, the breathing mode expansion induces a blueshift in the SPR mode at the lowest photon energy (that is, the dipolar LgSPR mode, L0) and a slight redshift in the SPR mode just next to it (TrSPR mode T1), whereas the remaining modes at higher energies (T2 and T3) are unaffected (red curve in Figure 6c). On the other hand, the plasmon mode of lowest energy (L0) is the only one that is significantly affected by the extensional mode expansion; it undergoes a redshift (red curve in Figure 6d) since the global AR increases.
The shape and dielectric function effects roughly cancel each other during the breathing mode expansion, which results in almost no shift in the L0 mode, whereas the remaining modes at higher photon energies are redshifted (blue curve in Figure 6c). However, this total effect as a result of the extensional mode expansion induces a larger redshift in the L0 SPR mode than for those at higher photon energies (blue curve in Figure 6d). Therefore, the addition of the photo-elastic mechanism (volume change effect) to the opto-mechanical one (shape change effect) induces a net redshift in the plasmon modes of the bimetallic NP since it undergoes a full object vibration [3]. This means that the real part of the dielectric function of both the AuNR core and the Ag shell are increased simultaneously at the oscillation frequencies being discussed here. This can be confirmed by the independently extracted strain traces (relative volume change) of the core and shell (see Figure S6b in the Supplementary Materials) where they undergo identical volume change throughout the oscillation frequency sweep.
Finally, these results explain why the vibration spectrum extracted by FFT from the TA dynamics data strongly depends on the laser probe wavelength used for these experiments, as exemplified by the results shown in Figure 2b. Hence, it can be seen in Figure 6c,d that probing the time-dependent optical signal in the spectral domain of the high-energy TrSPR modes (T2 and T3, in the 320–420 nm range) favors the detection of the breathing mode (mode 4) at the expense of the extensional one (mode 1). In contrast, the latter is given a much larger amplitude by the FFT analysis of the TA signal probed in the vicinity of the LgSPR mode (L0, in the 500–600 nm range).

5. Conclusions

The FFT analysis of the transient absorption dynamics of bimetallic core–shell nanoparticles, acquired by pump-probe spectroscopy, has revealed specific vibration modes in the range from 15 to 150 GHz. Simulations based on the FEM have allowed us to address the vibrational landscape for these complex nano-objects. While bare Au nanorods exhibit extensional and breathing modes, the bimetallic NPs undergo more complex motions, involving the displacement of facets, edges and corners. Let us notice that these complex modes, also predicted by our simulations, were never detected before in similar studies. The amplitude and frequency of the modes have been shown to depend on the Ag-shell thickness, as the silver load modifies the aspect ratio and the total mass of the NPs. In addition, the vibration mode characteristics are sensitive to the roundness of edges and corners. Furthermore, the experimental vibration spectra are shown to depend on the wavelength of the probe laser at which the transient signal is monitored. Using the combined simulations of the elastic and optical properties of the NPs, we have deciphered this influence by analyzing the effect of different mechanisms involved in the acousto-plasmonic coupling. Note that the acousto-plasmonic coupling has been recently shown to have a strong signature in the TA signal of planar arrays of silver nanocubes, especially in the spectral domain of the hybrid surface lattice resonance modes [41]. In addition, the metal NP acoustic vibrations have sometimes been proposed to perform nano-weighing of matter deposited or grafted onto the NPs [4,25,27]. Our results show that probing the vibration landscape in the spectral domains of different plasmon modes could quantitatively assess the relative deposition at the NP tips and sides.

Supplementary Materials

The following are available online at https://0-www-mdpi-com.brum.beds.ac.uk/article/10.3390/chemosensors10050193/s1, Figure S1: TEM images of bare AuNR and AuNR@Ag samples, Figure S2: Experimental stationary optical response of the AuNR and AuNR@Ag samples, Figure S3: Time and spectral dependence of the TA of the bare AuNR and AuNR@Ag 8eq samples, Figure S4: TA signal for the bare AuNR and AuNR@Ag 8eq samples, monitored at 699 and 526 nm probe wavelengths, Figure S5: Calculated vibrational spectrum of the AuNR@Ag 2eq NP, Figure S6: Acoustic vibration spectrum of unrounded AuNR@Ag NPs for different aspect ratios, Figure S7: Acoustic vibration spectrum of AuNR@Ag 2eq NP for different rounding radii, Figure S8: Full 3D geometry used for modeling the optical properties in FEM, Figure S9: Simulated and experimental stationary SPR of the AuNR and AuNR@Ag 4eq NPs, Figure S10: Vibration modes and the vibration-induced relative change of volume of AuNR and AuNR@Ag 4eq NPs, Table S1: Gold and silver material properties used in FEM calculations of the vibrational properties, Table S2: Parameters used to model the dielectric functions of Au and Ag with the Drude-Lorentz model. References [32,40] are cited in the Supplementary Materials.

Author Contributions

Conceptualization, T.O.O., C.H., D.C. (Doru Constantin), A.P. and B.P.; methodology, T.O.O. and B.P.; software, T.O.O. and F.T.; validation, T.O.O. and A.P.; formal analysis, T.O.O., C.H., D.C. (Doru Constantin), F.T. and A.P.; investigation, T.O.O., L.D.M., C.H., K.-V.D., P.O., D.C. (Daniele Catone) and A.P.; resources, C.H., V.J., P.R., P.O., D.C. (Daniele Catone), A.P. and B.P.; data curation, T.O.O.; writing—original draft preparation, T.O.O., D.C. (Doru Constantin) and A.P.; writing—review and editing, P.O., D.C. (Daniele Catone) and B.P.; visualization, T.O.O. and A.P.; supervision, V.J. and B.P.; project administration, T.O.O. and B.P.; funding acquisition, P.R. and B.P. All authors have read and agreed to the published version of the manuscript.

Funding

This research was funded by Région Pays de la Loire, grant name NanoPlasMag (2017 09376). T.O.O. thanks the “Groupement de Recherche Or-Nano” (GDR CNRS n° 2002) for the award of a research internship grant.

Data Availability Statement

The data presented in this study are available on request from authors. The data are not publicly available due to storage issues.

Acknowledgments

The authors would like to thank Valentina Utrio Lanfaloni for her contribution to the experimental work.

Conflicts of Interest

The authors declare no conflict of interest.

Appendix A. Calculation of the NP Vibrational Properties

The structural mechanics module of COMSOL is used to calculate the NP mechanical vibrations. The Navier equation can be solved using the finite element method (FEM) [25,27,40,43,44,45,46] by considering the NPs as isotropic elastic solids with density ρ , Young’s modulus Y , and Poisson’s ratio ν having a vibration displacement vector, u . The equation can be written as,
Y 2 ( 1 + ν ) [ 1 ( 1 2 ν ) ( · u ) + 2 u ] + F = ρ 2 u t 2
where F = 3 ( 3 λ + 2 μ ) α T is the force generated by the thermal stress in the NP having thermal expansion coefficient α . λ = and μ = Y / 2 ( 1 + ν ) are the Lamé’s first and second parameters. The bulk material properties of Au and Ag (See Table S1 in the Supplementary Materials) are used except for Y whose {100} directional values give vibrational frequencies that reasonably agree with the experimental ones [26]. The initial NP temperature increase is evaluated by using the calculated absorption cross section and the experimental pump pulse energy. It reaches about 220–230 K. The mechanical coupling at the Au/Ag interface is disregarded (“no slip” condition: both displacement and stress are continuous across the interface). The average displacement obtained is worth about | u | = 0.45 to 0.55 nm, depending on the NP morphology.
The environment surrounding the NPs may influence vibrations of the NPs by damping their oscillations and shifting their resonance frequencies [19,47]. So, the resonance damping is imitated through the introduction of a small isotropic internal loss factor [40,45] in the noble metal NPs. The small resonance shift [48] that the environment might induce is neglected in this work as the interest is to identify and study the vibrational modes that have been observed in the experimental results. This helps with the reduction in the computational time.

Appendix B. Calculation of the NP Optical Properties

The wave optics module of COMSOL is used to compute the NP optical properties. This is performed in three dimensions which involves a NP, its host environment (water, refractive index n = 1.33) and a spherical Perfectly Matching Layer (PML) which encapsulates the two (see Section S9 of the Supplementary Materials for details). All the simulation domains that are considered in the geometry are centered at the NP. The calculation is based on solving the frequency dependent electromagnetic wave equation (Equation (A2)) for a scattered electric field E s c a in the frequency domain. For a metallic NP of dielectric function ε r , the field scattered by the NP can be expressed as:
× μ r 1 ( × E s c a ) k 0 2 ( ε r j σ ω ε 0 ) E s c a = 0
where μ r , σ and ω are the relative permeability, electric conductivity and angular frequency, respectively. ε 0 and k 0 are the relative permittivity and wavenumber of the free space. Once E s c a is obtained, the scattered magnetic field, H s c a can also be obtained from it using the Faraday’s law. However, as our interest is to model the plasmonic effects, the magnetic field contribution is disregarded in this simulation ( μ r = 1 ).
The scattering cross-section, σ s c a (Equation (A3)) of the NP is calculated by taking the integral of the scattered time-averaged Pointing vector, S s c a = Re { E s c a × H s c a * } / 2 over a spherical surface, s which is centered at the NP and having a normal unit vector n. For a given incident electric field E, displacement current D, irradiance I 0 and magnetic field H, the energy loss rate is defined as Q l o s s = Re { J t o t · E * + j ω B · H * } / 2 where J t o t = σ E + j ω D is the total current. The absorption cross-section can then be expressed by the integral of the energy loss over the NP volume V (Equation (A4)). Finally, the total extinction cross-section σ e x t of the NP can be obtained from σ s c a and σ a b s .
σ s c a = 1 I 0 S s c a · n d s
σ a b s = 1 I 0   Q l o s s d V
σ e x t = σ s c a + σ a b s
The Drude-Lorentz model is used to represent the dielectric function of the noble metal NPs:
ε r ( ω ) = ε r ( ) + ω p 2 m = 0 M f m ω 0 , m 2 ω 2 j ω Γ m
where ε r ( ) is the infinite frequency dielectric constant, f m is the m th Lorentzian oscillator strength among M total oscillators, ω 0 , m is the interband transition frequency for the m th Lorenzian and Γ m is the m th Lorenzian oscillator damping value. ω p = N e 2 / ε 0 m e is the bulk plasma frequency, where N is the bulk free electron density, ε 0 is the permittivity of vacuum, e is the electron charge and m e is its effective mass. The Drude part of the dielectric function can be obtained for m = 0 by setting ω 0 , 0 = 0 in Equation (A6). The fit parameters listed in the work of A. Ahmed et al. [40] (see Table S2 in the Supplementary Materials) have been used for modeling the experimental dielectric functions of gold [49] and silver [50].

References

  1. Hartland, G.V. Optical studies of dynamics in noble metal nanostructures. Chem. Rev. 2011, 111, 3858–3887. [Google Scholar] [CrossRef] [PubMed]
  2. Hu, M.; Wang, X.; Hartland, G.V.; Mulvaney, P.; Juste, J.P.; Sader, J.E. Vibrational response of nanorods to ultrafast laser induced heating: Theoretical and experimental analysis. J. Am. Chem. Soc. 2003, 125, 14925–14933. [Google Scholar] [CrossRef] [PubMed]
  3. Crut, A.; Maioli, P.; Del Fatti, N.; Vallée, F. Acoustic vibrations of metal nano-objects: Time-domain investigations. Phys. Rep. 2015, 549, 1–43. [Google Scholar] [CrossRef]
  4. Beane, G.; Devkota, T.; Brown, B.S.; Hartland, G.V. Ultrafast measurements of the dynamics of single nanostructures: A review. Rep. Prog. Phys. 2019, 82, 16401. [Google Scholar] [CrossRef]
  5. Hodak, J.H.; Martini, I.; Hartland, G.V. Spectroscopy and dynamics of nanometer-sized noble metal particles. J. Phys. Chem. B 1998, 102, 6958–6967. [Google Scholar] [CrossRef]
  6. Del Fatti, N.; Voisin, C.; Chevy, F.; Vallée, F.; Flytzanis, C. Coherent acoustic mode oscillation and damping in silver nanoparticles. J. Chem. Phys. 1999, 110, 11484–11487. [Google Scholar] [CrossRef]
  7. Voisin, C.; Del Fatti, N.; Christofilos, D.; Vallee, F. Ultrafast electron dynamics and optical nonlinearities in metal nanoparticles. J. Phys. Chem. B 2001, 105, 2264–2280. [Google Scholar] [CrossRef]
  8. Van Dijk, M.A.; Lippitz, M.; Orrit, M. Detection of acoustic oscillations of single gold nanospheres by time-resolved interferometry. Phys. Rev. Lett. 2005, 95, 267406. [Google Scholar] [CrossRef] [Green Version]
  9. Perner, M.; Gresillon, S.; März, J.; von Plessen, G.; Feldmann, J.; Porstendorfer, J.; Berg, K.-J.; Berg, G. Observation of hot-electron pressure in the vibration dynamics of metal nanoparticles. Phys. Rev. Lett. 2000, 85, 792–795. [Google Scholar] [CrossRef]
  10. Hartland, G.V.; Hu, M.; Wilson, O.; Mulvaney, P.; Sader, J.E. Coherent excitation of vibrational modes in gold nanorods. J. Phys. Chem. B 2002, 106, 743–747. [Google Scholar] [CrossRef]
  11. Hu, M.; Hillyard, P.; Hartland, G.V.; Kosel, T.; Perez-Juste, J.; Mulvaney, P. Determination of the elastic constants of gold nanorods produced by seed mediated growth. Nano Lett. 2004, 4, 2493–2497. [Google Scholar] [CrossRef]
  12. Zijlstra, P.; Tchebotareva, A.L.; Chon, J.W.M.; Gu, M.; Orrit, M. Acoustic oscillations and elastic moduli of single gold nanorods. Nano Lett. 2008, 8, 3493–3497. [Google Scholar] [CrossRef]
  13. Pelton, M.; Sader, J.E.; Burgin, J.; Liu, M.; Guyot-Sionnest, P.; Gosztola, D. Damping of acoustic vibrations in gold nanoparticles. Nat. Nanotechnol. 2009, 4, 492–495. [Google Scholar] [CrossRef] [PubMed]
  14. Kirschner, M.S.; Lethiec, C.M.; Lin, X.-M.; Schatz, G.C.; Chen, L.X.; Schaller, R.D. Size-dependent coherent-phonon plasmon modulation and deformation characterization in gold bipyramids and nanojavelins. ACS Photonics 2016, 3, 758–763. [Google Scholar] [CrossRef]
  15. Marty, R.; Arbouet, A.; Girard, C.; Mlayah, A.; Paillard, V.; Lin, V.K.; Teo, S.L.; Tripathy, S. Damping of the acoustic vibrations of individual gold nanoparticles. Nano Lett. 2011, 11, 3301–3306. [Google Scholar] [CrossRef] [PubMed]
  16. Su, M.-N.; Dongare, P.D.; Chakraborty, D.; Zhang, Y.; Yi, C.; Wen, F.; Chang, W.-S.; Nordlander, P.; Sader, J.E.; Halas, N.J.; et al. Optomechanics of single aluminum nanodisks. Nano Lett. 2017, 17, 2575–2583. [Google Scholar] [CrossRef] [PubMed]
  17. Wang, L.; Takeda, S.; Sato, R.; Sakamoto, M.; Teranishi, T.; Tamai, N. Morphology-dependent coherent acoustic phonon vibrations and phonon beat of Au nanopolyhedrons. ACS Omega 2021, 6, 5485–5489. [Google Scholar] [CrossRef]
  18. Ruijgrok, P.V.; Zijlstra, P.; Tchebotareva, A.L.; Orrit, M. Damping of acoustic vibrations of single gold nanoparticles optically trapped in water. Nano Lett. 2012, 12, 1063–1069. [Google Scholar] [CrossRef]
  19. Yu, K.; Zijlstra, P.; Sader, J.E.; Xu, Q.H.; Orrit, M. Damping of acoustic vibrations of immobilized single gold nanorods in different environments. Nano Lett. 2013, 13, 2710–2716. [Google Scholar] [CrossRef] [Green Version]
  20. Uthe, B.; Collis, J.F.; Madadi, M.; Sader, J.E.; Pelton, M. Highly spherical nanoparticles probe gigahertz viscoelastic flows of simple liquids without the no-slip condition. J. Phys. Chem. Lett. 2021, 12, 4440–4446. [Google Scholar] [CrossRef]
  21. Kirakosyan, A.S.; Shahbazyan, T.V. Vibrational modes of metal nanoshells and bimetallic core-shell nanoparticles. J. Chem. Phys. 2008, 129, 34708. [Google Scholar] [CrossRef] [PubMed] [Green Version]
  22. Hodak, J.H.; Henglein, A.; Hartland, G.V. Coherent excitation of acoustic breathing modes in bimetallic core-shell nanoparticles. J. Phys. Chem. B 2000, 104, 5053–5055. [Google Scholar] [CrossRef]
  23. Crut, A.; Juvé, V.; Mongin, D.; Maioli, P.; Del Fatti, N.; Vallée, F. Vibrations of spherical core-shell nanoparticles. Phys. Rev. B 2011, 83, 205430. [Google Scholar] [CrossRef]
  24. Wang, L.; Kiya, A.; Okuno, Y.; Niidome, Y.; Tamai, N. Ultrafast spectroscopy and coherent acoustic phonons of Au/Ag core/shell nanorods. J. Chem. Phys. 2011, 134, 54501. [Google Scholar] [CrossRef] [PubMed]
  25. Cardinal, M.F.; Mongin, D.; Crut, A.; Maioli, P.; Rodríguez-González, B.; Pérez-Juste, J.; Liz-Marzán, L.M.; Del Fatti, N.; Vallée, F. Acoustic vibrations in bimetallic Au@Pd core-shell nanorods. J. Phys. Chem. Lett. 2012, 3, 613–619. [Google Scholar] [CrossRef]
  26. Yu, K.; Sader, J.E.; Zijlstra, P.; Hong, M.; Xu, Q.H.; Orrit, M. Probing silver deposition on single gold nanorods by their acoustic vibrations. Nano Lett. 2014, 14, 915–922. [Google Scholar] [CrossRef] [Green Version]
  27. Dacosta Fernandes, B.; Spuch-Calvar, M.; Baida, H.; Tréguer-Delapierre, M.; Oberlé, J.; Langot, P.; Burgin, J. Acoustic vibrations of Au nano-bipyramids and their modification under Ag deposition: A perspective for the development of nanobalances. ACS Nano 2013, 7, 7630–7639. [Google Scholar] [CrossRef] [Green Version]
  28. Zhao, X.; Nie, Z.; Feng, Y.; Zhao, W.; Zhang, J.; Zhang, W.; Maioli, P.; Loh, Z.-H. Ultrafast acoustic vibrations of Au/Ag nanoparticles with varying elongated structures. Phys. Chem. 2020, 22, 22728–22735. [Google Scholar] [CrossRef]
  29. Scarabelli, L.; Grzelczak, M.; Liz-Marzán, L.M. Tuning gold nanorod synthesis through prereduction with salicylic acid. Chem. Mater. 2013, 25, 4232–4238. [Google Scholar] [CrossRef] [Green Version]
  30. Tebbe, M.; Kuttner, C.; Mayer, M.; Maennel, M.; Pazos-Perez, N.; König, T.A.F.; Fery, A. Silver-overgrowth-induced changes in intrinsic optical properties of gold nanorods: From noninvasive monitoring of growth kinetics to tailoring internal mirror charges. J. Phys. Chem. C 2015, 119, 9513–9523. [Google Scholar] [CrossRef]
  31. Park, K.; Drummy, L.F.; Vaia, R.A. Ag shell morphology on Au nanorod core: Role of Ag precursor complex. J. Mater. Chem. 2011, 21, 15608–15618. [Google Scholar] [CrossRef]
  32. Otomalo, T.O.; Di Mario, L.; Hamon, C.; Constantin, D.; Do, K.; O’Keeffe, P.; Catone, D.; Paladini, A.; Palpant, B. Sharp spectral variations of the ultrafast transient light extinction by bimetallic nanoparticles in the near-UV. Adv. Opt. Mater. 2021, 9, 2001778. [Google Scholar] [CrossRef]
  33. Hendel, T.; Wuithschick, M.; Kettemann, F.; Birnbaum, A.; Rademann, K.; Polte, J. In Situ Determination of Colloidal Gold Concentrations with UV–Vis Spectroscopy: Limitations and Perspectives. Anal. Chem. 2014, 86, 11115–11124. [Google Scholar] [CrossRef] [PubMed]
  34. Scarabelli, L.; Sánchez-Iglesias, A.; Pérez-Juste, J.; Liz-Marzán, L.M. A “Tips and Tricks” Practical Guide to the Synthesis of Gold Nanorods. J. Phys. Chem. Lett. 2015, 6, 4270–4279. [Google Scholar] [CrossRef] [PubMed] [Green Version]
  35. Di Mario, L.; Otomalo, T.O.; Catone, D.; O’Keeffe, P.; Tian, L.; Turchini, S.; Palpant, B.; Martelli, F. Time-dependent optical response of three-dimensional Au nanoparticle arrays formed on silica nanowires. Phys. Rev. B 2018, 97, 1–9. [Google Scholar] [CrossRef]
  36. Catone, D.; Di Mario, L.; Martelli, F.; O’Keeffe, P.; Paladini, A.; Cresi, J.S.P.; Sivan, A.K.; Tian, L.; Toschi, F.; Turchini, S. Ultrafast optical spectroscopy of semiconducting and plasmonic nanostructures and their hybrids. Nanotechnology 2021, 32, 025703. [Google Scholar] [CrossRef]
  37. Goris, B.; Bals, S.; Van Den Broek, W.; Carbó-Argibay, E.; Gómez-Graña, S.; Liz-Marzán, L.M.; Van Tendeloo, G. Atomic-scale determination of surface facets in gold nanorods. Nat. Mater. 2012, 11, 930–935. [Google Scholar] [CrossRef] [Green Version]
  38. Gómez-Graña, S.; Goris, B.; Altantzis, T.; Fernández-López, C.; Carbó-Argibay, E.; Guerrero-Martínez, A.; Almora-Barrios, N.; López, N.; Pastoriza-Santos, I.; Pérez-Juste, J.; et al. Au@Ag nanoparticles: Halides stabilize {100} facets. J. Phys. Chem. Lett. 2013, 4, 2209–2216. [Google Scholar] [CrossRef]
  39. Petrova, H.; Lin, C.H.; De Liejer, S.; Hu, M.; McLellan, J.M.; Siekkinen, A.R.; Wiley, B.J.; Marquez, M.; Xia, Y.; Sader, J.E.; et al. Time-resolved spectroscopy of silver nanocubes: Observation and assignment of coherently excited vibrational modes. J. Chem. Phys. 2007, 126, 094709. [Google Scholar] [CrossRef]
  40. Ahmed, A.; Pelton, M.; Guest, J.R. Understanding how acoustic vibrations modulate the optical response of plasmonic metal nanoparticles. ACS Nano 2017, 11, 9360–9369. [Google Scholar] [CrossRef]
  41. Juodėnas, M.; Peckus, D.; Tamulevičius, T.; Yamauchi, Y.; Tamulevičius, S.; Henzie, J. Effect of Ag nanocube optomechanical modes on plasmonic surface lattice resonances. ACS Photonics 2020, 7, 3130–3140. [Google Scholar] [CrossRef]
  42. Hamon, C.; Goldmann, C.; Constantin, D. Controlling the symmetry of supercrystals formed by plasmonic core-shell nanorods with tunable cross-section. Nanoscale 2018, 10, 18362–18369. [Google Scholar] [CrossRef] [PubMed] [Green Version]
  43. Saison-Francioso, O.; Lévêque, G.; Akjouj, A. Numerical modeling of acousto-plasmonic coupling in metallic nanoparticles. J. Phys. Chem. C 2020, 124, 12120–12133. [Google Scholar] [CrossRef]
  44. Della Picca, F.; Berte, R.; Rahmani, M.; Albella, P.; Bujjamer, J.M.; Poblet, M.; Cortés, E.; Maier, S.A.; Bragas, A.V. Tailored Hypersound Generation in Single Plasmonic Nanoantennas. Nano Lett. 2016, 16, 1428–1434. [Google Scholar] [CrossRef] [Green Version]
  45. O’Brien, K.; Lanzillotti-Kimura, N.D.; Rho, J.; Suchowski, H.; Yin, X.; Zhang, X. Ultrafast acousto-plasmonic control and sensing in complex nanostructures. Nat. Commun. 2014, 5, 4042. [Google Scholar] [CrossRef]
  46. Mahmoud, M.A.; O’Neil, D.; El-Sayed, M.A. Shape- and symmetry-dependent mechanical properties of metallic gold and silver on the nanoscale. Nano Lett. 2014, 14, 743–748. [Google Scholar] [CrossRef]
  47. Saviot, L.; Netting, C.H.; Murray, D.B. Damping by bulk and shear viscosity of confined acoustic phonons for nanostructures in aqueous solution. J. Phys. Chem. B 2007, 111, 7457–7461. [Google Scholar] [CrossRef]
  48. Voisin, C.; Christofilos, D.; Del Fatti, N.; Vallée, F. Environment effect on the acoustic vibration of metal nanoparticles. Proc. Phys. B Condens. Matter 2002, 316–317, 89–94. [Google Scholar] [CrossRef]
  49. Olmon, R.L.; Slovick, B.; Johnson, T.W.; Shelton, D.; Oh, S.H.; Boreman, G.D.; Raschke, M.B. Optical dielectric function of gold. Phys. Rev. B-Condens. Matter Mater. Phys. 2012, 86, 235147. [Google Scholar] [CrossRef] [Green Version]
  50. Yang, H.U.; D’Archangel, J.; Sundheimer, M.L.; Tucker, E.; Boreman, G.D.; Raschke, M.B. Optical dielectric function of silver. Phys. Rev. B-Condens. Matter Mater. Phys. 2015, 91, 235137. [Google Scholar] [CrossRef] [Green Version]
Figure 1. Transient signals of (a) AuNRs and (b) AuNR@Ag 8eq probed at the LgSPR domain (699 nm and 526 nm, respectively) upon photoexcitation at 380 nm. The inset of panel (a) reports the first 60 ps of the same profile acquired with shorter temporal step size.
Chemosensors 10 00193 g001
Figure 2. FFT spectra of the TA signal of: (a) bare AuNRs probed at 699 nm wavelength (LgSPR domain), (b) AuNR@Ag 8eq probed at 526 nm (L0 mode domain), 424 nm (T1 mode domain) and 356 nm (T3 mode domain) wavelengths. The spectra show the intensity of the oscillations in arbitrary units vs. both the frequency in GHz (bottom axis) and the period in picoseconds (top axis) of the oscillations. The FFT spectrum in the inset of (a) was obtained from the TA spectrum acquired with a shorter temporal step size (inset of Figure 1).
Chemosensors 10 00193 g002
Figure 3. FFT spectra of the TA signals of bare AuNRs and AuNR@Ag NPs probed in their respective LgSPR (L0) mode domains. The spectra show the intensity of the oscillations in arbitrary units as a function of both their frequency (bottom axis) and period (top axis). The curves have been vertically shifted from each other for sake of clarity. The shadow arrow highlights the frequency shift in the high-frequency vibration modes with increasing the silver amount.
Chemosensors 10 00193 g003
Figure 4. Calculated vibrational spectra of (a) AuNR and (d) AuNR@Ag 2eq NPs represented as the volume-averaged norm of the displacement vector, <   > , as a function of frequency. Mode shapes that correspond to the dominant resonances identified in the spectrum are also shown via the 3D color plot of the norm of the vibrational displacement field. (b,c) depict the vibrational mode shapes of the extensional and breathing modes of the AuNR, respectively, whereas the modes dominating the AuNR@Ag 2eq vibration spectrum [labeled from 1 to 4 in (d)] are also shown consecutively from (eh). The two mode shapes at each mode frequency in (b,c,eh) correspond to the maximum expansion (left) and compression (right) of the NPs. The wire frames in the 3D color plots represent the NP shape at equilibrium and the red and blue colors represent the maximum and minimum deformations, respectively. For clarity, the deformations are magnified by a factor of 5 in all of the 3D color plots.
Chemosensors 10 00193 g004
Figure 5. (a) Ag thickness dependent vibrational mode spectra for the AuNR@Ag 2eq, 4eq and 8eq samples calculated using their morphological parameters obtained from the TEM analysis. (b) The calculated mode frequency as a function of aspect ratio (AR), top panel for mode 1, middle panel for modes 2 and 3, and bottom panel for mode 4. The vertical dashed lines in (b) indicate the mode frequencies calculated for the AuNR@Ag 2eq, 4eq and 8eq samples using their morphological parameters obtained from the TEM analysis. The orange arrow points to a minor intermediate mode.
Chemosensors 10 00193 g005
Figure 6. Simulated acoustic vibration induced modifications of the optical properties of a AuNR (a,b) and a rounded (R = 4 nm) AuNR@Ag 4eq NP (c,d) due to the effects of the only opto-mechanical (red curves) and the total (opto-mechanical and photo-elastic, blue curves) couplings. The black curves correspond to the spectra of the NP at equilibrium. The upper panels in (ad) depict the calculated extinction cross-section spectra of the AuNR at the maximum of the expansion phase of its breathing (a) and extensional (b) modes, and of the AuNR@Ag 4eq NP at its mode 1 (d) and mode 4 (c). The 3D shape that corresponds to the vibration mode under consideration is also shown as an inset in each upper panel. The lower panels from (ad) correspond to the deviation of the NP extinction cross-sections from their value at equilibrium, induced by the acousto-plasmonic coupling.
Chemosensors 10 00193 g006
Publisher’s Note: MDPI stays neutral with regard to jurisdictional claims in published maps and institutional affiliations.

