Article

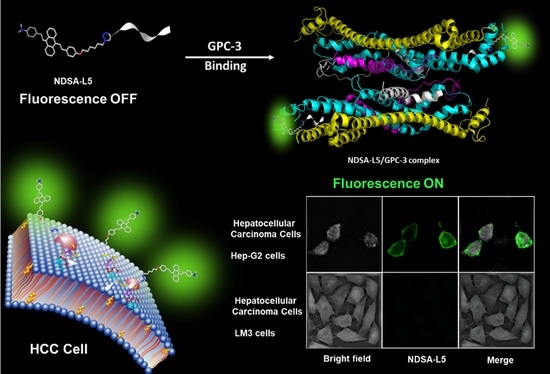
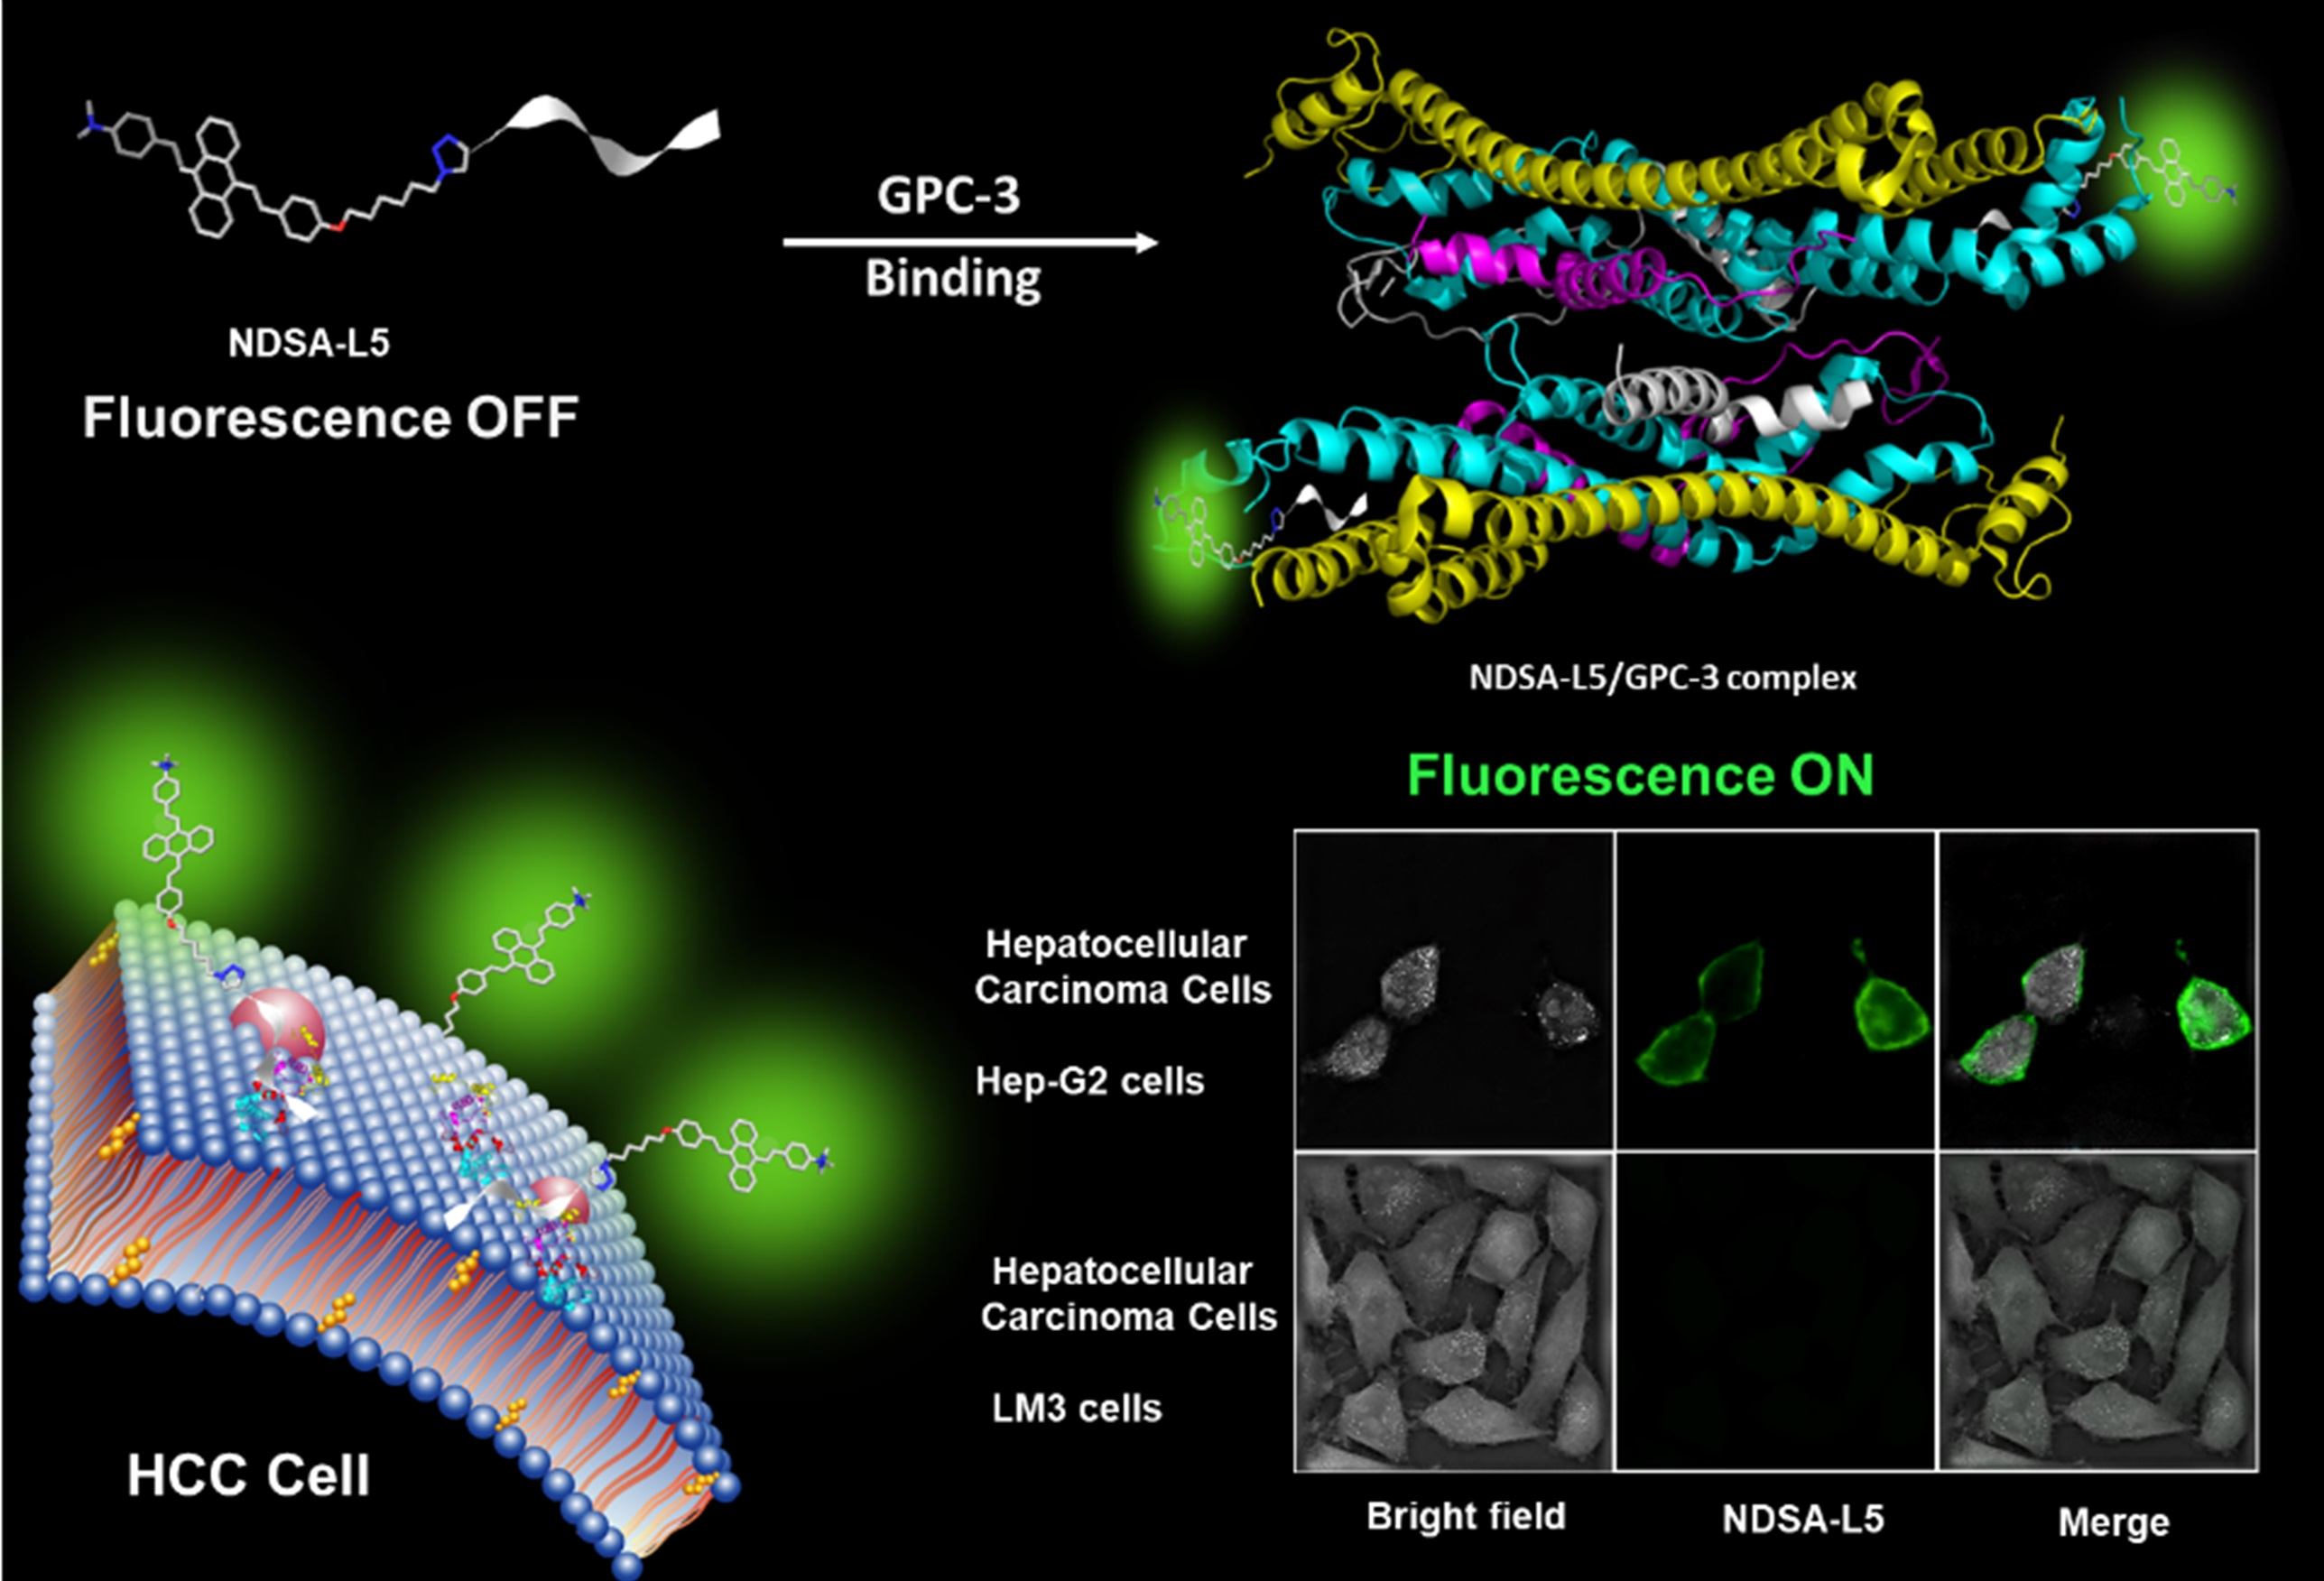
Peptide-Conjugated Aggregation-Induced Emission Fluorogenic Probe for Glypican-3 Protein Detection and Hepatocellular Carcinoma Cells Imaging

1
State Key Laboratory of Supramolecular Structure and Materials, College of Chemistry, Jilin University, Changchun 130012, China
2
CBSR&NLPR, Institute of Automation, Chinese Academy of Sciences, Beijing 100049, China
3
School of Artificial Intelligence, University of Chinese Academy of Sciences, Beijing 100049, China
*
Authors to whom correspondence should be addressed.
These authors contributed equally to this work.
Submission received: 27 April 2022 / Revised: 18 May 2022 / Accepted: 19 May 2022 / Published: 23 May 2022

Abstract

:
Hepatocellular carcinoma (HCC) is a malignant tumor with high morbidity and mortality on a global scale, and the development of accurate detection and imaging methods for HCC cells is urgently needed. Herein, by connecting peptide L5, which can specifically bind to the overexpressed Glypican-3 (GPC-3) protein of HCC cells with aggregation-induced emission (AIE) moiety ammonium cation-functionalized 9,10-distyrylanthracene (NDSA) via the “click” reaction, we synthesized a fluorescent probe NDSA-L5. In an aqueous solution, the probe shows weak emission, whereas, in the presence of the GPC-3 protein, bright fluorescence can be obtained since NDSA-L5 binds to the GPC-3 protein, leading to the restricted intramolecular movement of AIE-active NDSA-L5. The imaging and flow cytometry experiments demonstrate that the NDSA-L5 probe can rapidly accumulate in the subcutaneous HCC cells and liver tumor tissue and shows a potential application in early detection and surgical navigation for HCC cancer.

Graphical Abstract

1. Introduction

Cancer, as one of the most severe diseases threatening the health of human beings, has been arousing significant attention from researchers [1,2,3]. Among these, hepatocellular carcinoma (HCC) is a highly aggressive liver malignant tumor with the characteristics of high clinical incidence and inconspicuous early symptoms [4,5]. Existing therapeutic methods such as surgical resection, radiotherapy, and chemotherapy only have relatively good effects on patients with early hepatocellular carcinoma, but poor effects on advanced HCC [6,7]. Therefore, a fast and efficient method to accurately detect HCC and assess the distribution of HCC cells in the early stage has become a key issue in HCC research [8,9,10,11].
Compared with normal cells, cancer cells have the characteristics of expressed specific proteins or overexpressed specific proteins, which can act as biomarkers for accurate cancer identification [12,13,14]. Glypican-3 (GPC-3), a sulfated acetylglycoprotein existing on the surface of cell membranes, is anchored on the cell surface through an ankyrin-glycosyl phosphatidylinositol anchor membrane protein (glycosyl phosphatidylinositol GPI) and combines with heparin-binding proteins such as growth factors to play an important role in regulating cell growth and differentiation [15,16,17,18]. Comparing the common benign liver disease focal nodular hyperplasia (FNH) and liver cirrhosis tissue with the liver cancer tissue, GPC-3 is highly expressed in the tissue with liver cancers and even overexpressed in HCC tissues [19,20]. However, GPC-3 is less or not expressed in tissues with most other cancers [21,22], indicating that it can help to distinguish HCC from benign liver nodules and has obvious sensitivity and specificity for the diagnosis of HCC, thus can be used as a marker for identifying HCC-specific tumors.
Various imaging techniques have been used in HCC detection, such as Fluorescence microscopy [23,24], Positron Emission Computed Tomography (PET) [25], Computed Tomography (CT) [26], and Magnetic Resonance Imaging (MRI) [27,28]. Among them, fluorescence imaging has been a powerful tool for the in situ real-time detection of biomarkers owing to its good sensitivity and selectivity in living systems. Up to now, several fluorescence imaging probes have been made for GPC-3-specific detection. For example, GPC3-specific fluorescent nanoparticles containing Alexa Flour 645 were used to achieve HCC visualization [29]. A specific strategy for distinguishing GPC-3-expressed tumor tissue from healthy livers can be realized by utilizing a Cy5.5-based probe [30].
However, these fluorescent probes were usually based on conventional organic dyes. The accumulation of these fluorogens in cells often leads to high local concentrations, which usually result in low fluorescent quantum yield due to the aggregation-caused quenching effect. Recently, the fluorophores with aggregation-induced emission (AIE) provided new opportunities to overcome this obstacle and developed light-up probes for specific protein detection and bioimaging [31,32].
Peptide L5 (sequence YFLTTRQ), as a GPC-3 receptor, was screened as a suitable homing moiety targeting GPC-3 expressed tumors and showed a specific affinity for tumor cells expressing GPC-3 [33,34]. Herein, by connecting peptide L5 with AIE moiety ammonium cation-functionalized 9,10-distyrylanthracene (NDSA) via the Click Reaction, we synthesized a new AIE-active fluorescent probe (NDSA-L5) for the specific detection of overexpressed GPC-3 protein in HCC cells. In the buffer solution, the probe exists in the isolated state owing to the quaternary ammonium salt groups and water-soluble peptides, leading to weak fluorescence. As shown in Figure 1a, when binding to the GPC-3 protein positioned on the cell membrane of HCC cells, the probe shows a fluorescent signal due to the AIE effect, allowing the selective and sensitive identification of cancer cells. The results suggest that NDSA-L5 may have potential applications in early detection and surgical navigation for HCC cancer.

2. Materials and Methods

2.1. Materials

The starting materials and all reagents are commercially available and require no further purification. t-BuOK, K2CO3, 4-(diphenylamino) benzaldehyde, 1,6-dibromohexane, and 4-hydroxybenzaldehyde were purchased from J&K Scientific Ltd. (Beijing, China), while the L5 peptide was purchased from GL Biochem., Ltd. (Shanghai, China). Human Glypican-3 (GPC-3) was purchased from ACRO Biosystems. Tetrahydrofuran (THF) and chloroform were bought from Titan Scientific Co., Ltd. (Shanghai, China). All non-aqueous reactions were carried out under an argon atmosphere in oven-dried glassware. Milli-Q water (18.2 MW) was used to prepare the buffer solutions from 1 L PBS stock buffer.

2.2. Synthesis of NDSA-L5

The synthesis of Compounds 14 can be referred to in the methods from our published papers [35,36,37].
Synthesis of Compound 5: A mixture of Compound 4 (0.58 g, 1.01 mmol) and sodium azide (0.66 g, 10.1 mmol) is added to a 25 mL reaction tube with 5 mL dimethyl sulfoxide. The mixture is heated to 80 °C for 4 h. After the reaction is finished, the crude product is purified by silicagel chromatography (1:2 ratio of petroleumether/dichloromethane) to acquire a yellow solid. 1H NMR (500 MHz, DMSO-d6) δ 8.43–8.35 (m, 4H), 7.96 (d, J = 16.5 Hz, 2H), 7.85 (d, J = 16.6 Hz, 2H), 7.75 (d, J = 8.7 Hz, 2H), 7.64 (d, J = 8.7 Hz, 2H), 7.55 (dt, J = 6.9, 3.3 Hz, 4H), 7.03 (d, J = 8.7 Hz, 2H), 6.91–6.75 (m, 5H), 4.05 (t, J = 6.5 Hz, 2H), 2.99 (s, 5H), 1.80–1.75 (m, 2H), 1.59 (d, J = 7.2 Hz, 2H), 1.45 (dd, J = 25.2, 7.4 Hz, 5H). MS m/z: calcd for C38H38N4O, 556; found, 556.338.
Synthesis of Compound NDSA-N3: Compound 5 (0.79 g, 0.093 mmol) and iodide (0.42 mL, 7.52 mmol) was added into a round bottom flask with 25 mL of tetrahydrofuran solution. The mixture was heated to 70 °C for 12 h. After the reaction, the solid was washed with chloroform, and then purified with a Soda extractor to obtain the product. 1H NMR (500 MHz, DMSO-d6) δ 8.45–8.30 (m, 5H), 8.12–8.02 (m, 4H), 7.79–7.73 (m, 2H), 7.58 (dq, J = 6.4, 3.2 Hz, 4H), 7.08–7.01 (m, 3H), 6.88 (d, J = 16.6 Hz, 1H), 4.05 (t, J = 6.5 Hz, 2H), 3.67 (s, 9H), 3.37 (d, J = 5.8 Hz, 3H), 1.77 (q, J = 6.9 Hz, 2H), 1.60 (p, J = 7.0 Hz, 2H), 1.46 (ddt, J = 25.3, 15.4, 7.5 Hz, 4H). MS m/z: calcd for C39H41N4O+ 581; found, 581.398.
Synthesis of Compound NDSA-L5: Compound NDSA-N3 (10 mg) and the peptide (1 mg) were added to a mixed solution of DMSO:H2O (4:1), then anhydrous copper sulfate and sodium citrate (5:1) were added to the solution. After reacting for 12 h, the reaction solution was treated with a filter membrane and separated by HPLC. The obtained solution was freeze-dried to obtain a pure solid product with a yield of 80%. 1H NMR (500 MHz, DMSO-d6) δ 8.44–8.31 (m, 12H), 8.12–8.02 (m, 12H), 7.98 (d, J = 16.6 Hz, 3H), 7.76 (d, J = 8.6 Hz, 6H), 7.57 (dq, J = 6.4, 3.2 Hz, 12H), 7.08–7.01 (m, 9H), 6.88 (d, J = 16.5 Hz, 3H), 4.05 (t, J = 6.4 Hz, 3H), 1.77 (q, J = 6.9 Hz, 6H), 1.60 (p, J = 6.9 Hz, 6H), 1.45 (dd, J = 25.0, 7.9 Hz, 6H), 1.37–1.23 (m, 6H), 1.24 (s, 36H), 0.86 (t, J = 6.7 Hz, 6H). MS m/z: calcd for C97H130N21O16+, 1845; found, 1844.307.

2.3. Cell Culture

All the cell lines, including Hep-G2, Huh-7, Hep-3B, Hela, MCF-7, LM3, and L02, were provided by the Key Laboratory of Molecular Imaging, Institute of Automation. All cells were cultured in a DMEM medium supplemented with 10% (v/v) fetal bovine serum, maintaining a humidified atmosphere containing 5% CO2 at 37 °C.

2.4. Cell Imaging

Hep-G2, Huh-7, Hep-3B, Hela, MCF-7, LM3, and L02 cells were all seeded on confocal Petri dishes at a density of 3 × 10⁵ cells per well and grown for 24 h at 37 °C in 5% CO2. Then, Hep-G2, Huh-7, Hep-3B, Hela, MCF-7, LM3, and L02 cells were incubated with NDSA-L5 (5 µM) for 1 h. The fluorescence images were obtained using a 3D Cell Live Cell Imaging System.
Hep-G2 cells were pretreated via incubation with NDSA-L5. Then the nucleus was stained with 100 µL of DAPI solution for 30 min and the membrane was stained with 100 µL of DiI solution for 30 min. After incubation, cells were washed thrice with PBS (1 mM, pH 7.4). The fluorescence images were obtained using a confocal laser scanning microscope (CLSM, Leica).

2.5. Cell flow Cytometry Analysis

The cytotoxicity of the probe was evaluated by a CCK-8 assay. After digestion, the cell suspension was subjected to statistics, and 4000–5000/mL of the cell suspension was added to the set hole. After being incubated at 37 °C in a 5% CO2 environment for 24 h, the quantified probe mother-liquor was added per hole, resulting in a final 100 µM solution, forming concentrations of 0, 2, 4, 6, 8, and 10 µM/L probe solution. In a 5% CO2 and 37 °C environment, the solution was incubated for 1–2 h, the absorbance was measured using the enzyme gauge, and the cell activity was calculated.

2.6. In Vivo Imaging

All animal experiments were carried out following the guidelines of the institutional ethics committee of animal experimentation at the Institute of Automation, Chinese Academy of Sciences (Beijing, China). The cell suspension was obtained from the Hep-G2 cell digestion of cellular active activity, and the cell suspension was cleaned with a buffer multiplexed 4 × 10⁶/0.2 mL/only, and then inoculated under the prosthetic skin of suitable ageless nude mice. The culture in an animal culture warehouse environment was gradually increased to LCM. Studies on the imaging of mice were then started.

3. Results

NDSA-L5 was synthesized by a copper-catalyzed “click” reaction of a bisazido (BA)-functionalized DSA with an ethylyne (E)-bearing L5 peptide derivative, which had undergone triple-bond modification. The structure of probe NDSA-L5 is shown in Scheme S1. The synthetic route is also shown in Scheme S1, and the related characterizations including MALDI-TOF Mass and NMR are shown in Figures S1–S6 in the Supporting Information.

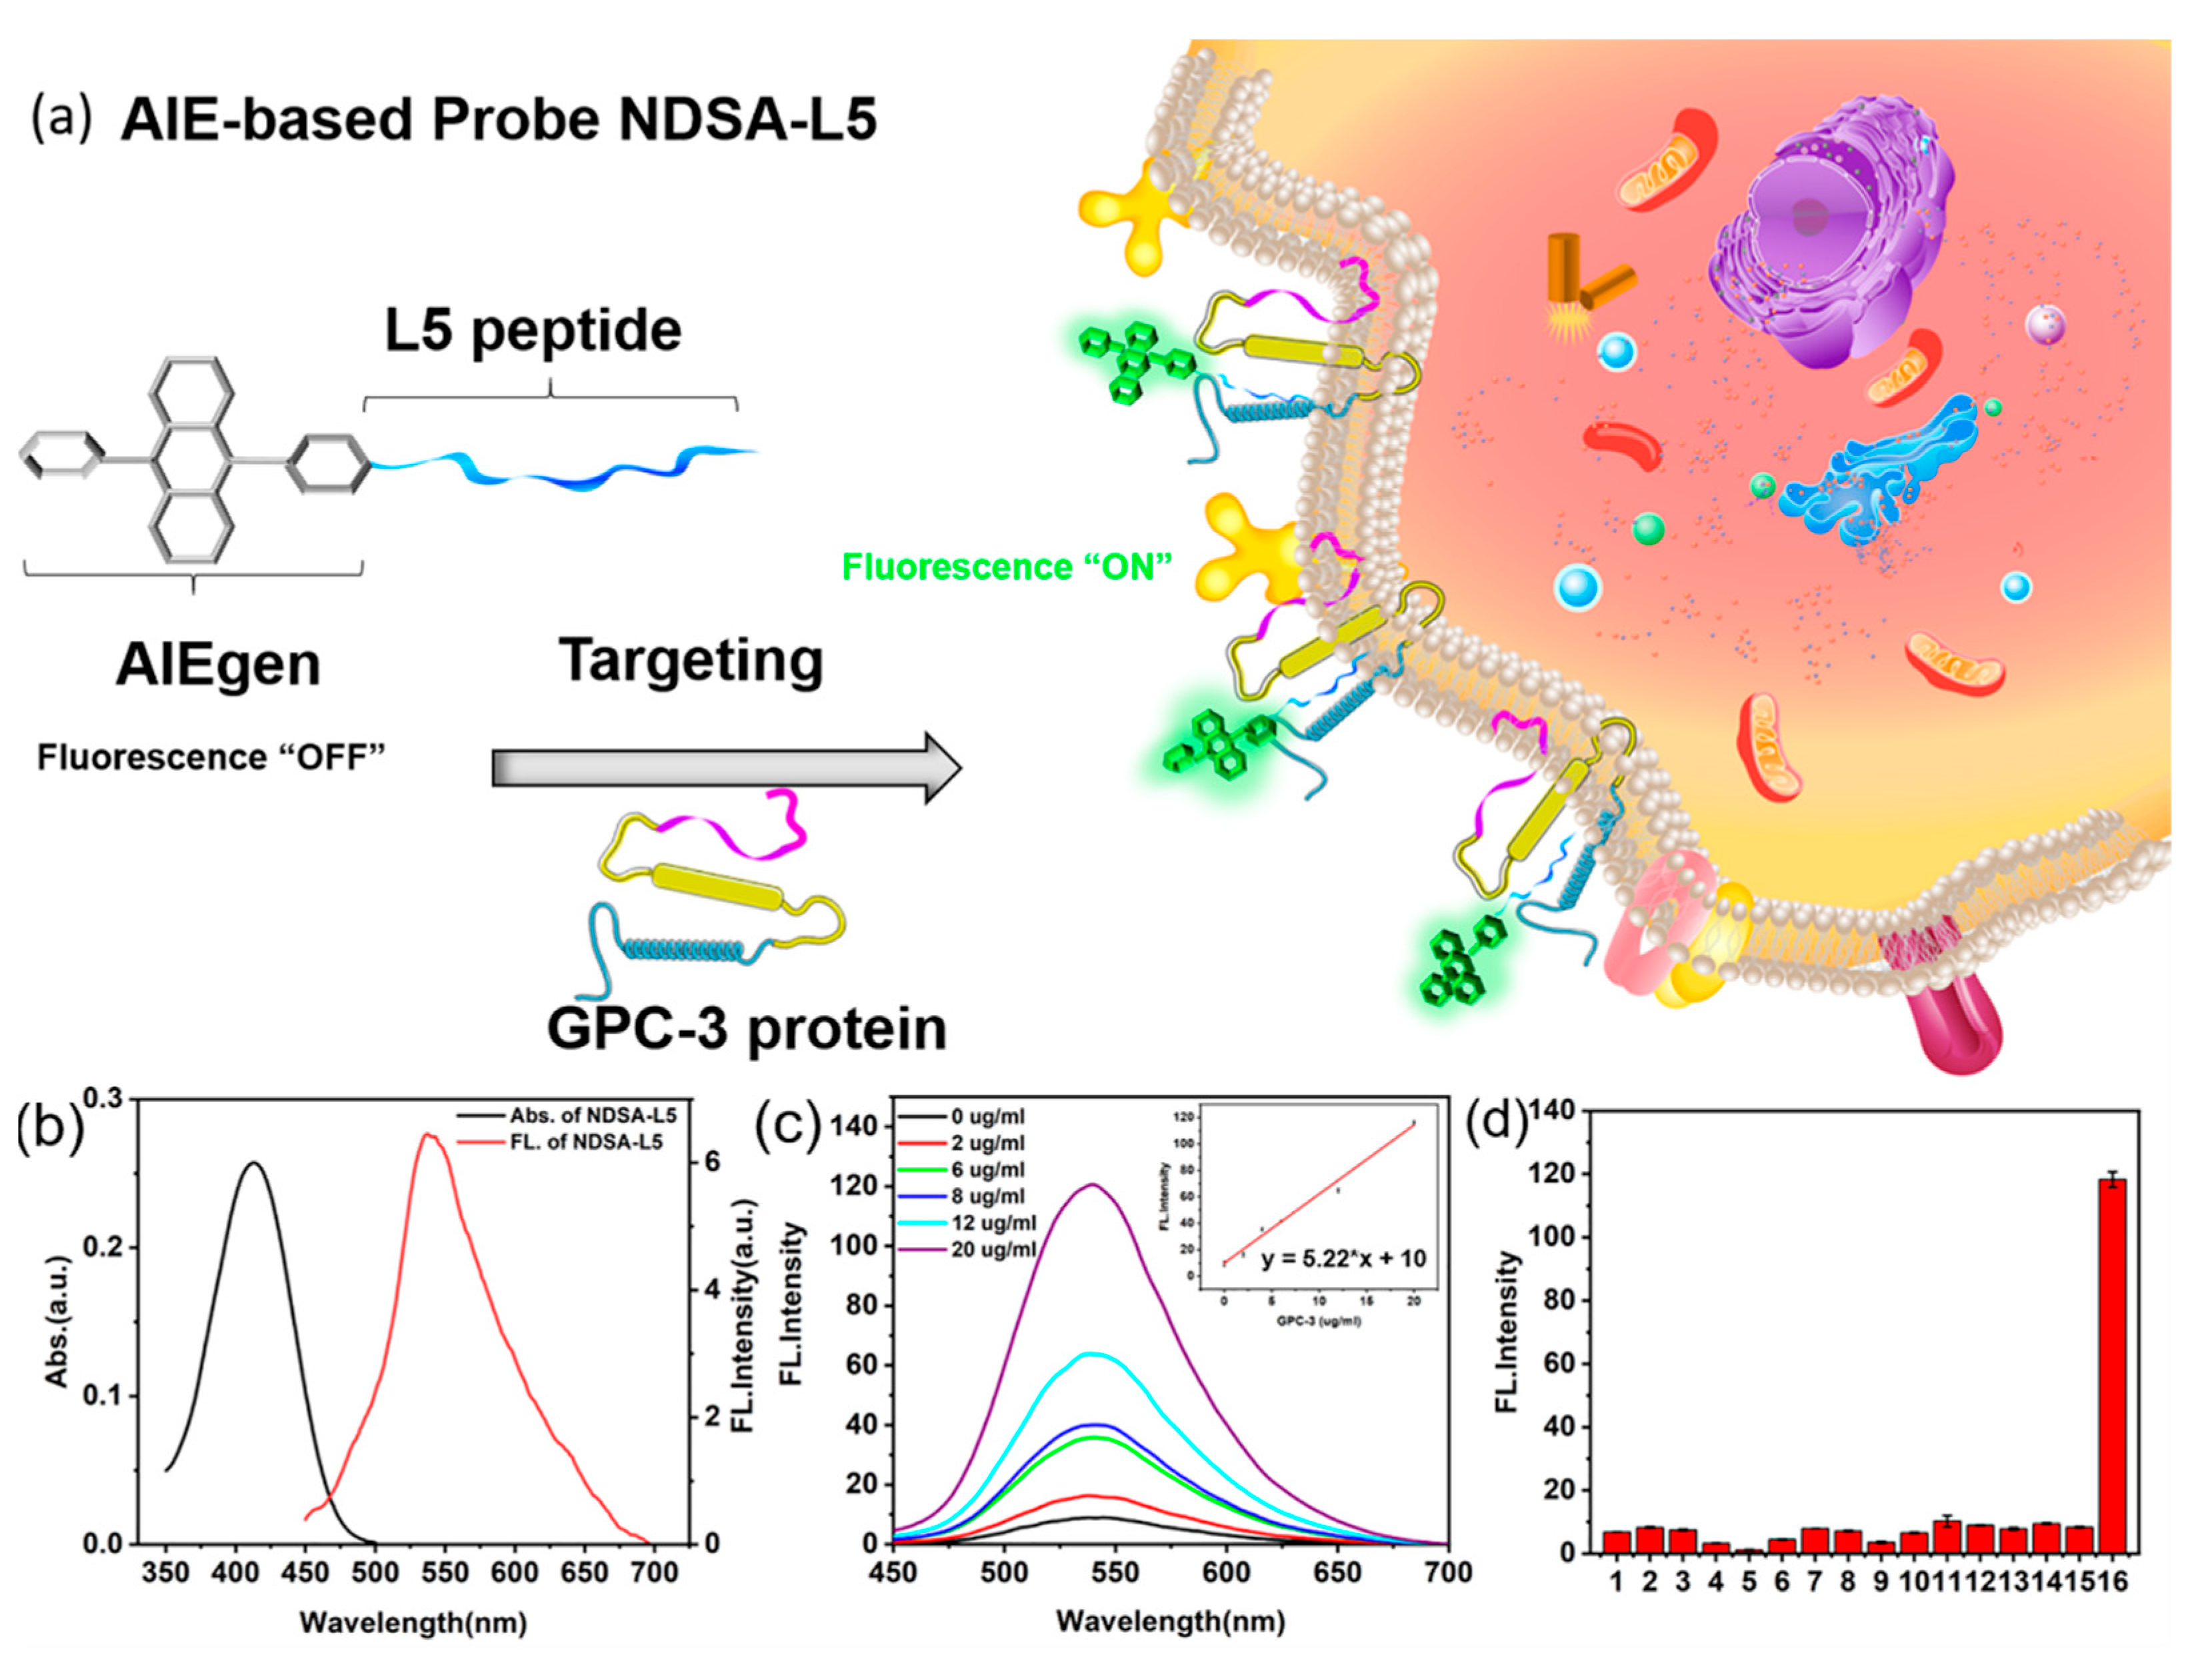
3.1. The Photophysical Properties of NDSA-L5

We firstly investigated the photophysical properties of NDSA-L5. The UV-vis absorption and photoluminescence (PL) spectra of NDSA-L5 (Figure 1b) measured in DMSO solution with a concentration of 5 μM showed maximum absorption at 410 nm and emission at 537 nm. The fluorescence quantum yield of NDSA-L5 in DMSO and n-hexane solution was 0.01 and 0.382 with Rhodamine-B as the reference, respectively. This means that NDSA-L5 is an AIE active probe due to introducing the typical AIE luminescent group DSA. To further examine the AIE characteristics of NDSA-L5, the PL spectra of NDSA-L5 were measured in the mixed solvents of DMSO/n-hexane with increasing n-hexane fractions. As shown in Figure S7a, NDSA-L5 remains non-emissive when the n-hexane fractions(X) stay below 60%, whereas the emission shows a dramatic enhancement after the n-hexane fraction(X) increases from 60% to 99%. Moreover, when comparing the PL spectra of NDSA-L5 with that of NDSA-N3 in PBS buffer (1 mM, pH 7.4) (Figure S7b), we found that only faint fluorescence from NDSA-L5 was detected since NDSA-L5 can be dissolved in PBS buffer (1 mM, pH 7.4) leading to the enhancement of non-radiative transition. The good solubility of NDSA-L5 in PBS buffer (1 mM, pH 7.4) also endows its low fluorescence background, which is a benefit to sensing GPC-3 in a physiological environment.
To demonstrate the potential of the NDSA-L5 probe for light-up detection of GPC-3, the PL intensity was measured in the presence of GPC-3 with different concentrations. Figure 1c shows that NDSA-L5 (5 µM) in PBS buffer (1 mM, pH 7.4) shows a weak emission, but the fluorescence turns on when adding GPC-3, and the intensity gradually enhances with the increase in the GPC-3 concentration (2, 4, 6,12, and 20 µg/mL). The plots of PL intensity against the increasing concentration of GPC-3 are summarized in Figure 1c. In the range of 0–20 µg/mL with R2 = 0.9987, there is a linear trend. The detection limit for GPC-3 was experimentally determined to be 0.0362 µg/mL(0.26 nM), which is low enough relative to the rare GPC-3-specific fluorescence probe (Table S1) [38]. It is, therefore, validated that the probe NDSA-L5 shows a linear turn-on fluorescent signal with an increasing amount of the target GPC-3. The reason behind this fluorescence light-up can be attributed to the restriction of intramolecular motion of NDSA-L5 upon binding to the GPC-3 protein.
To investigate the selectivity of the probe, NDSA-L5 was treated under identical conditions, varying biological ions and molecules other than GPC-3, such as H+, Na+, K+, Cu2+, Fe2+, Cl, OH, Glutathione, L-Cysteine, Trypsin, BSA, Pepsase, Papayotin, Fruin, and ALP (alkaline phosphatase). As shown in Figure 1d, NDSA-L5 displays ~20-fold larger changes in PL than the other biological ions and molecules, which substantiates that NDSA-L5 is indeed a specific probe for the GPC-3 protein.

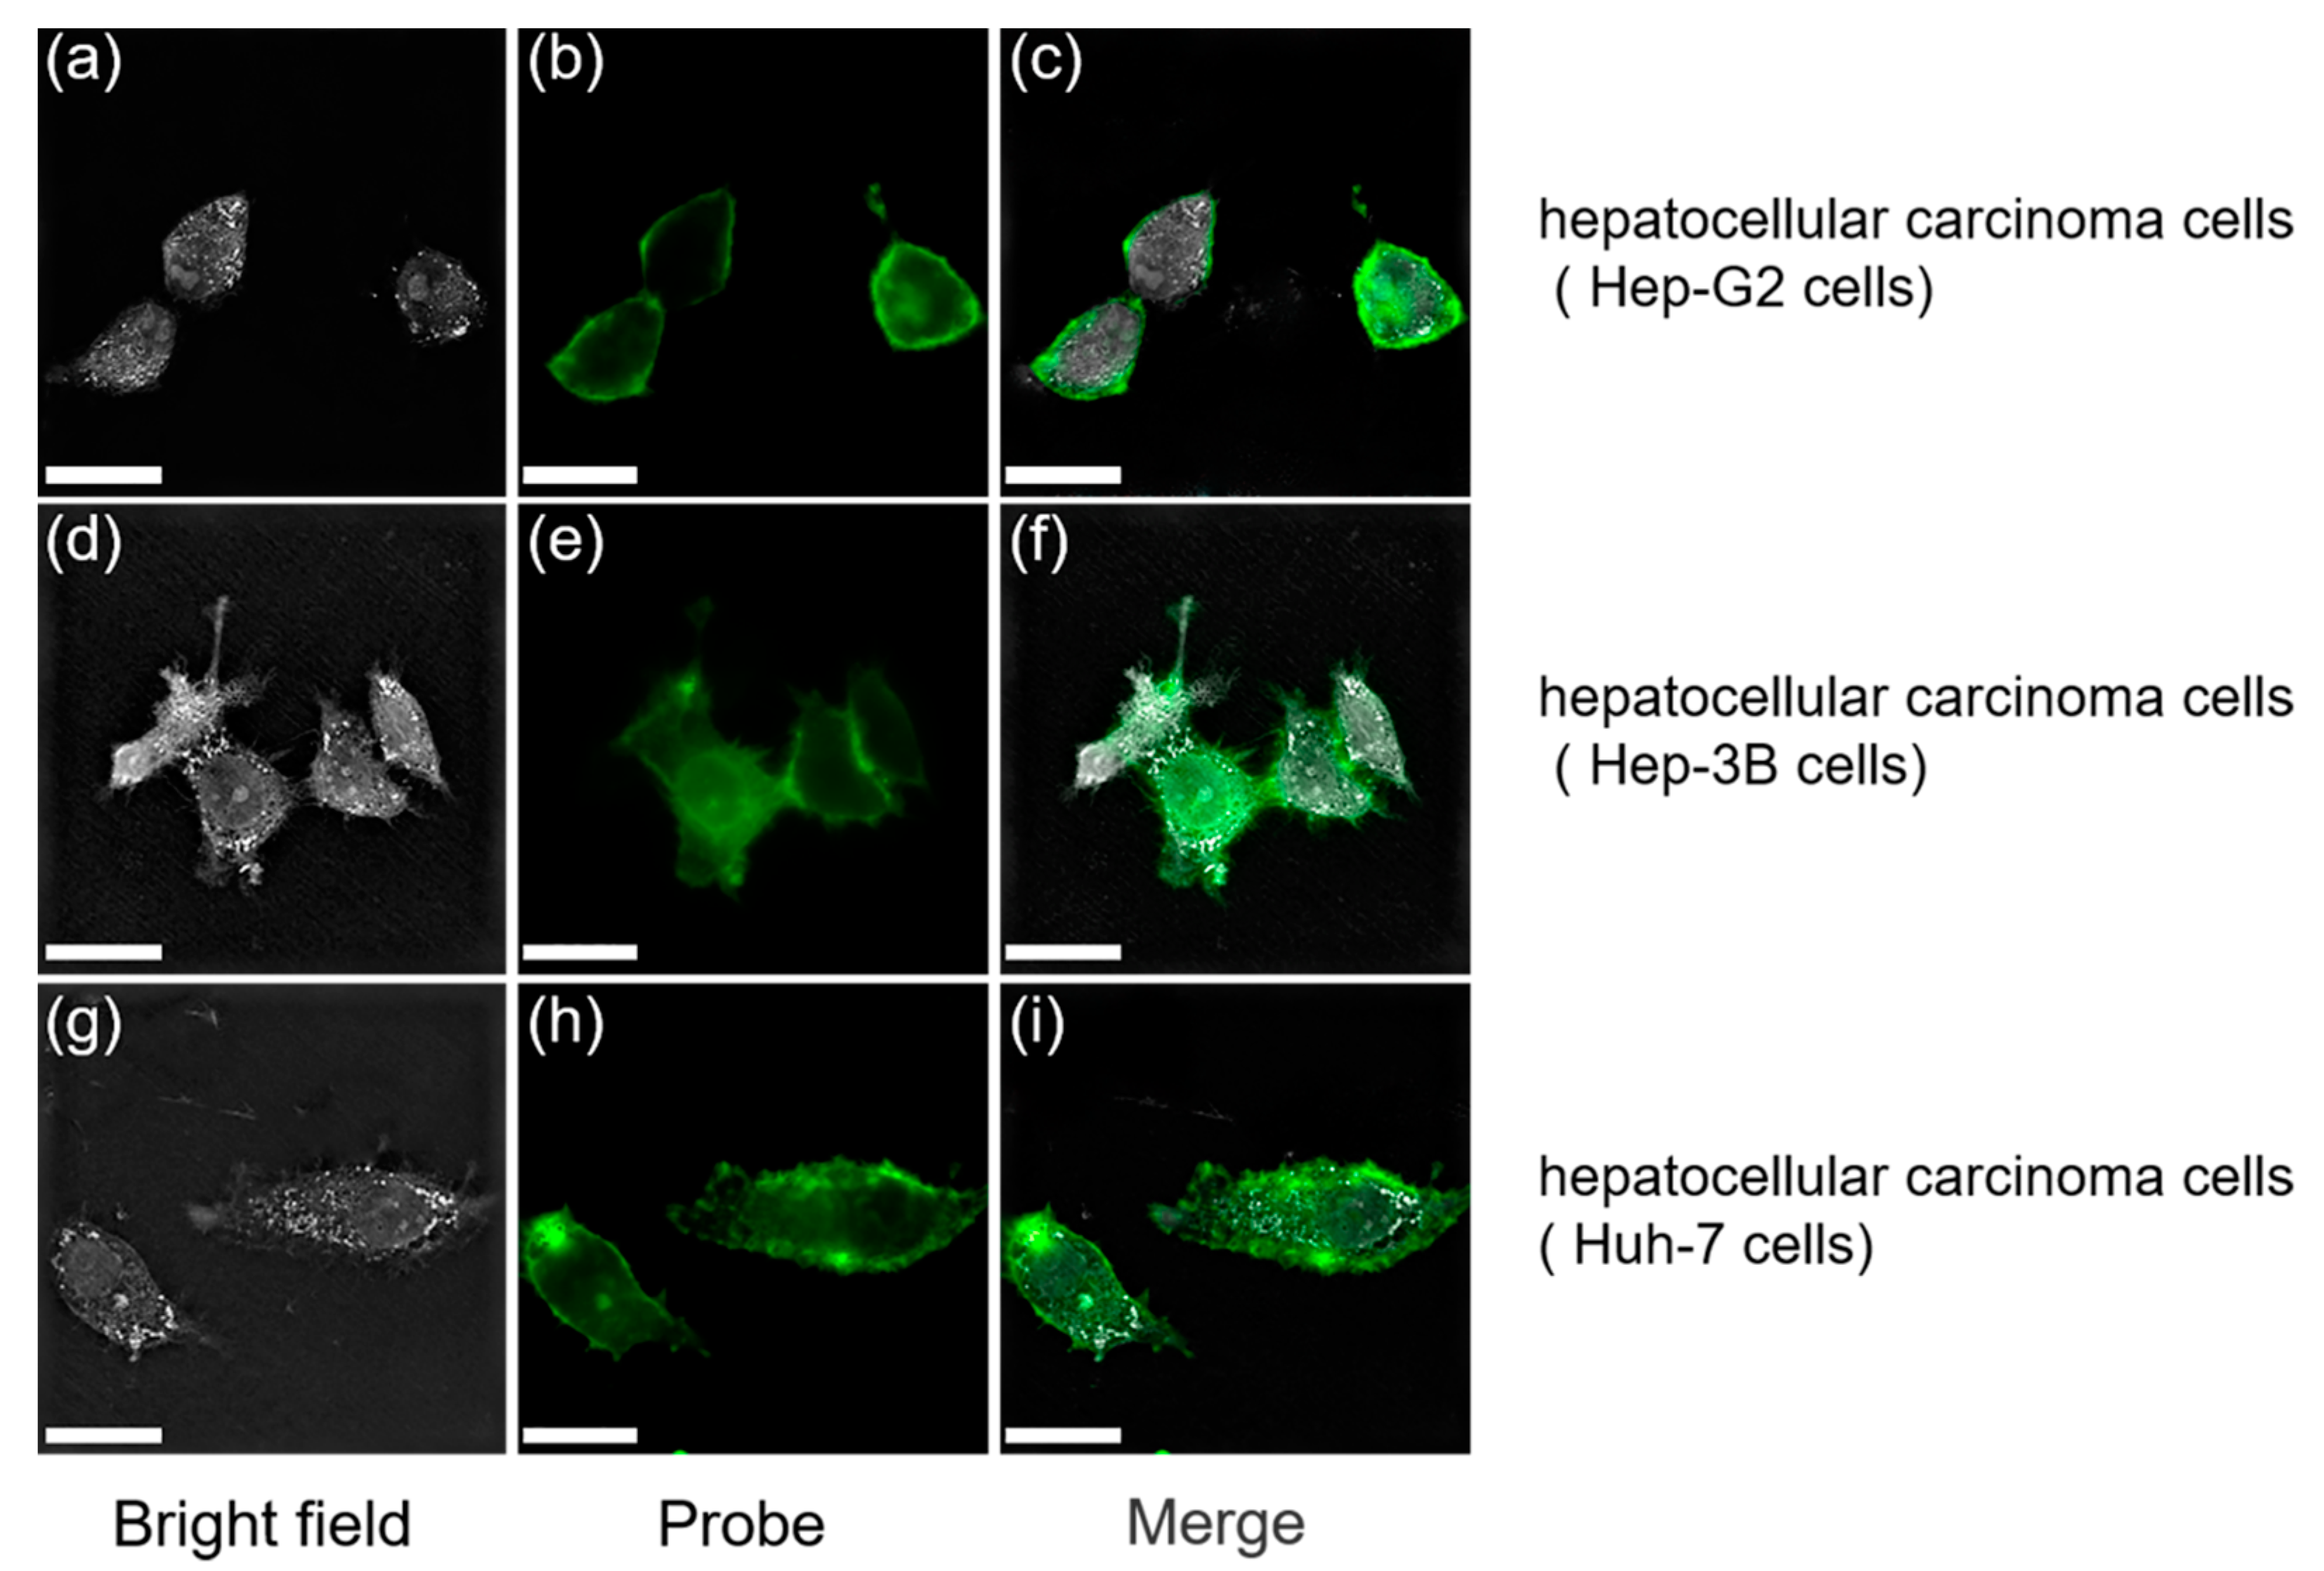
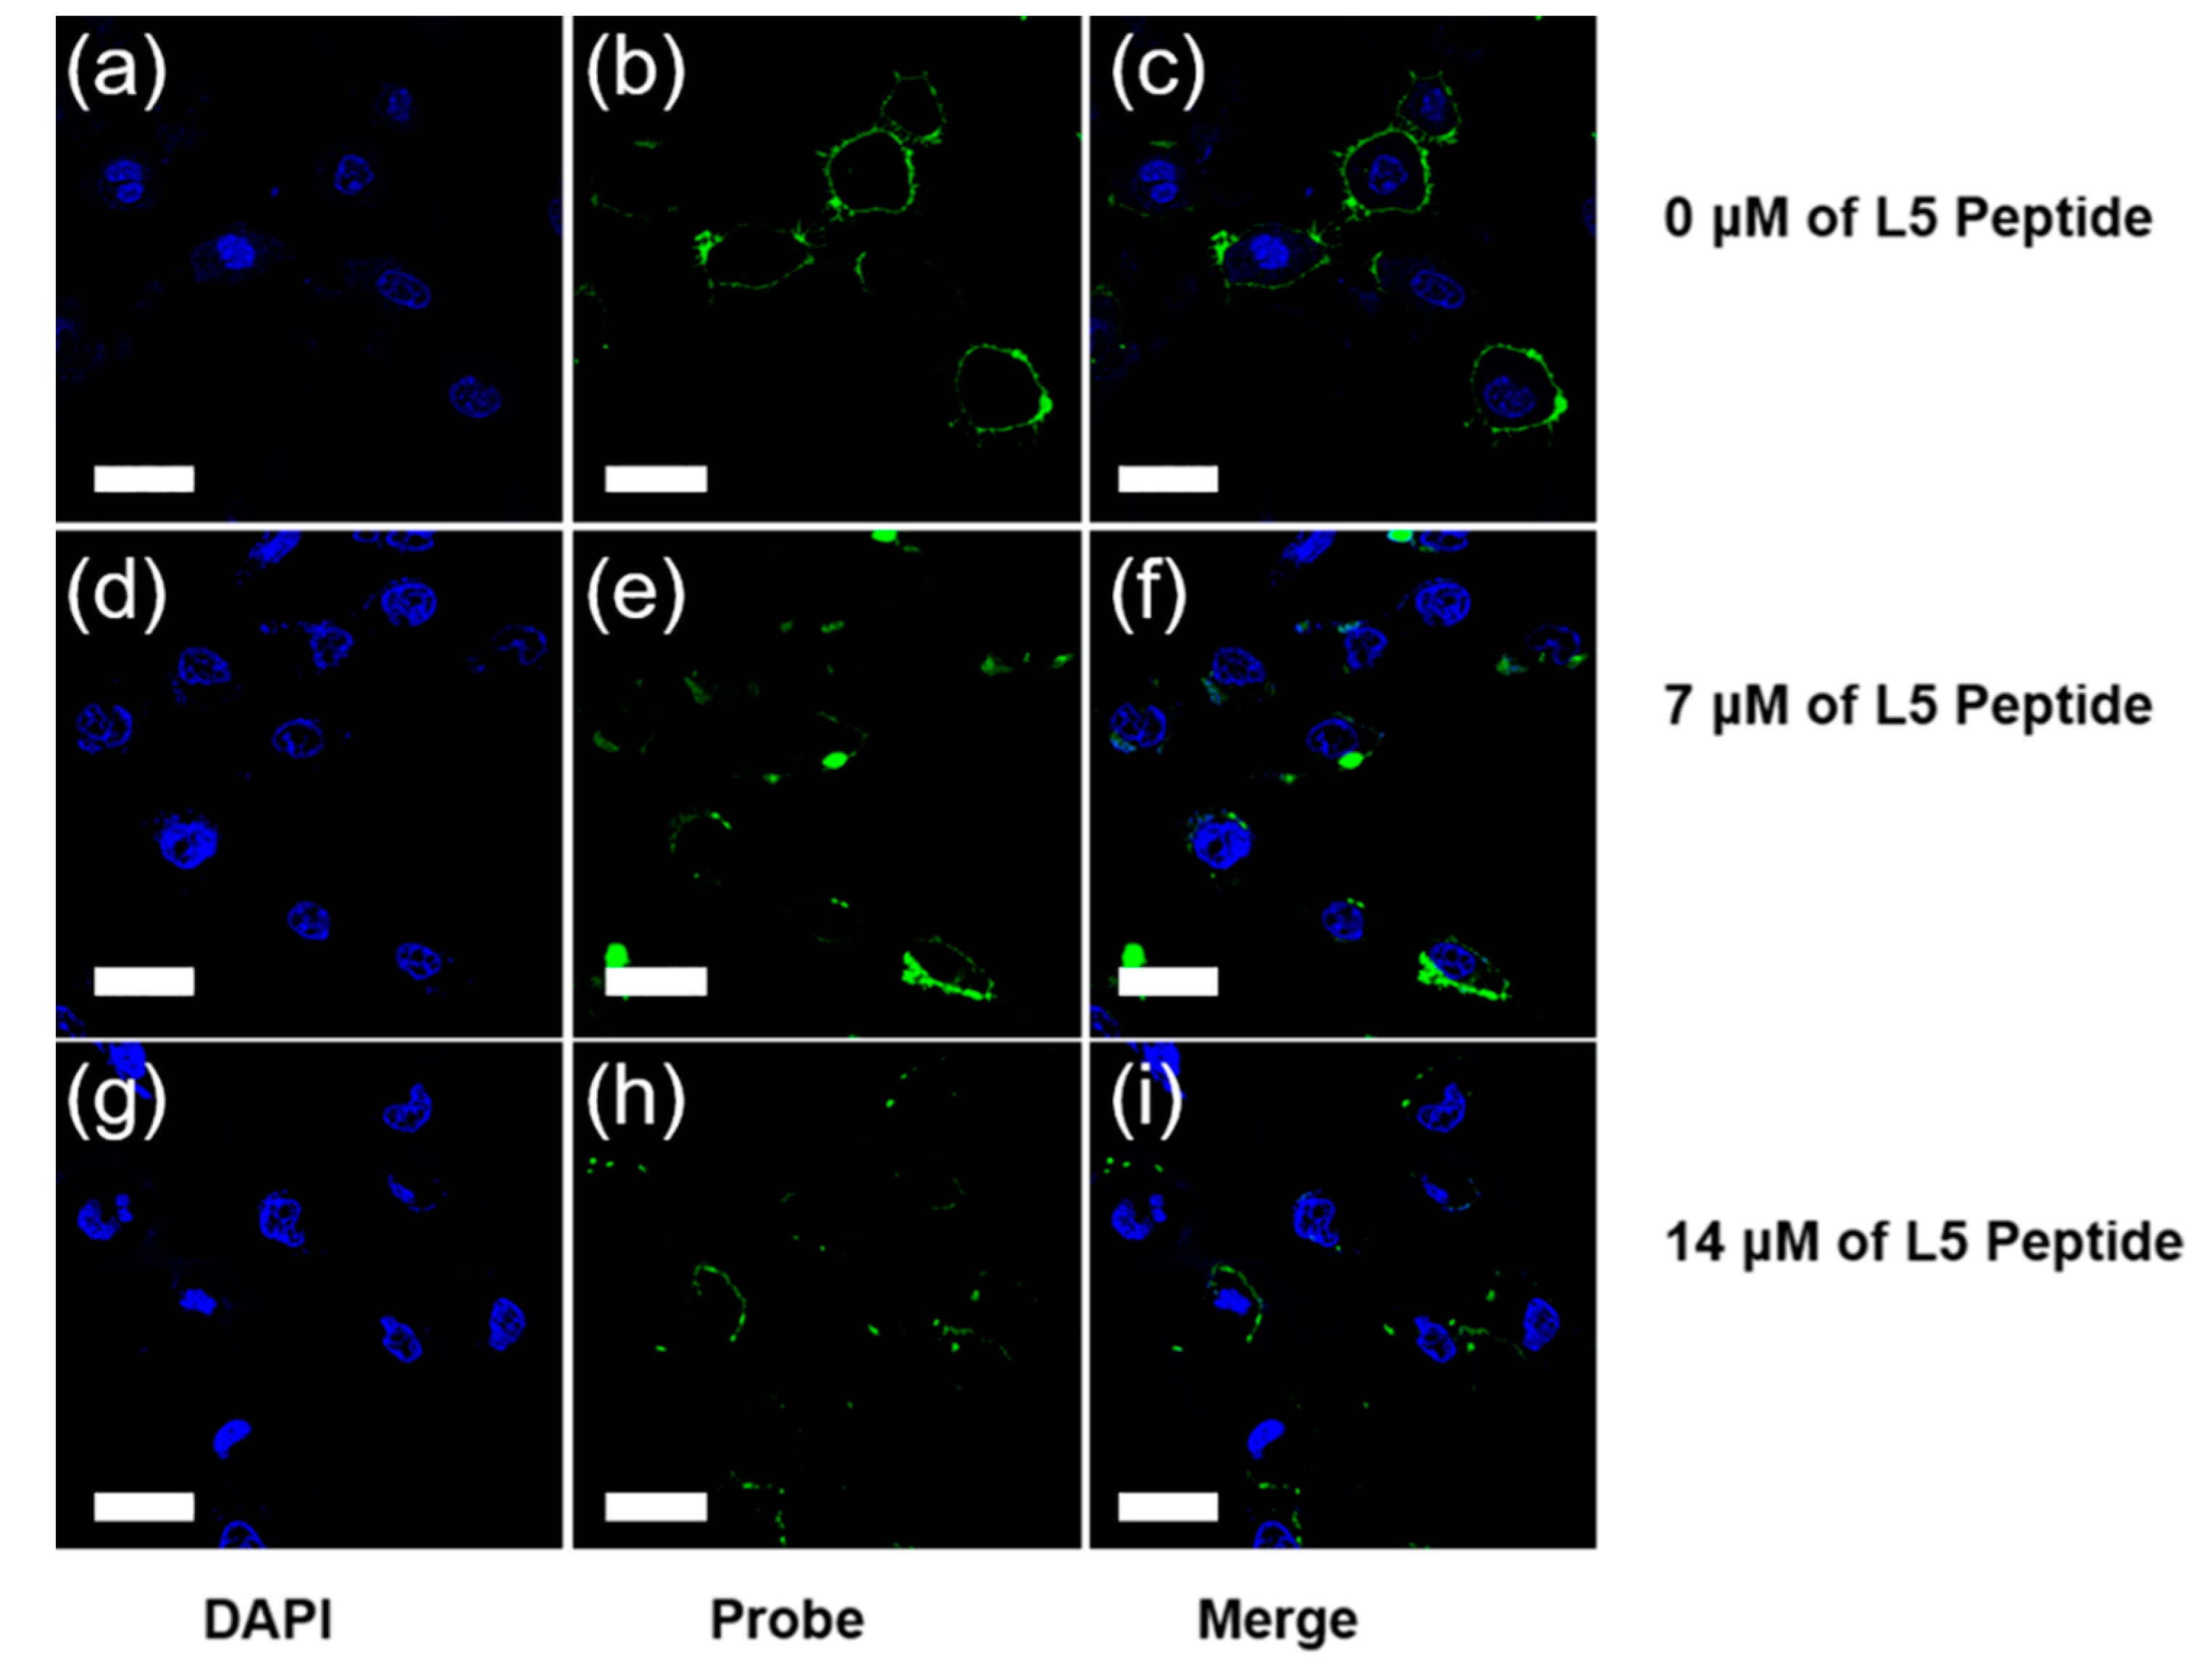
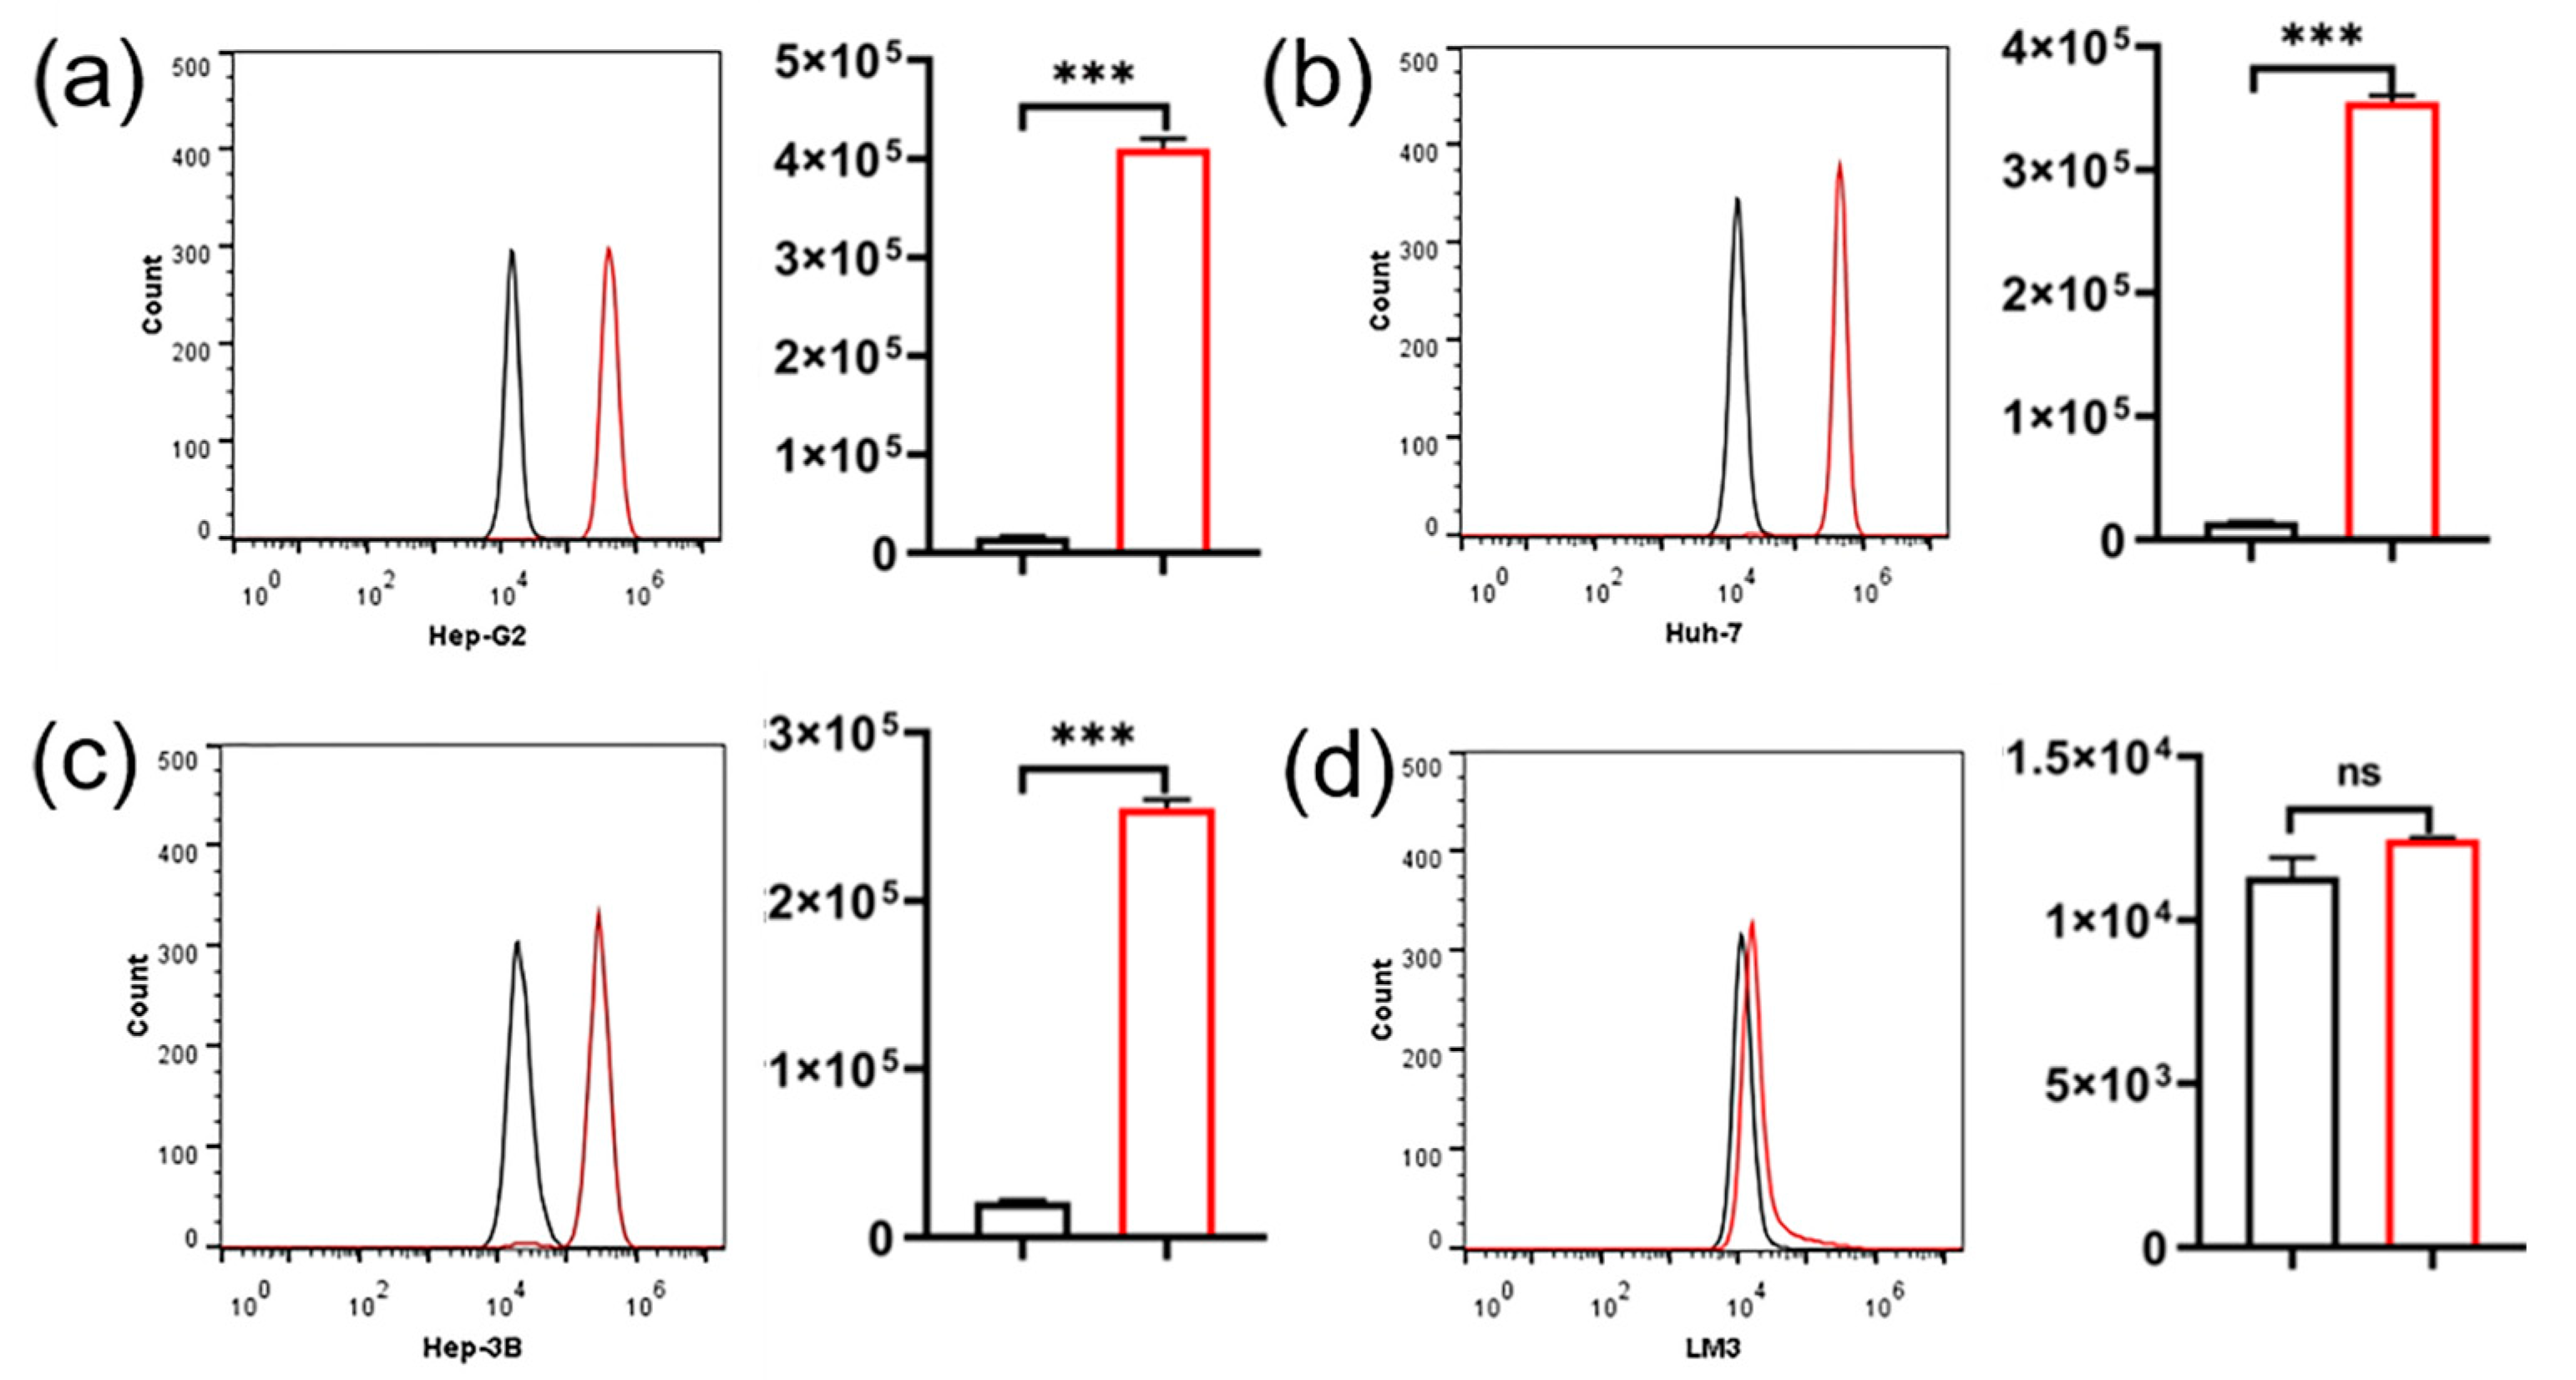
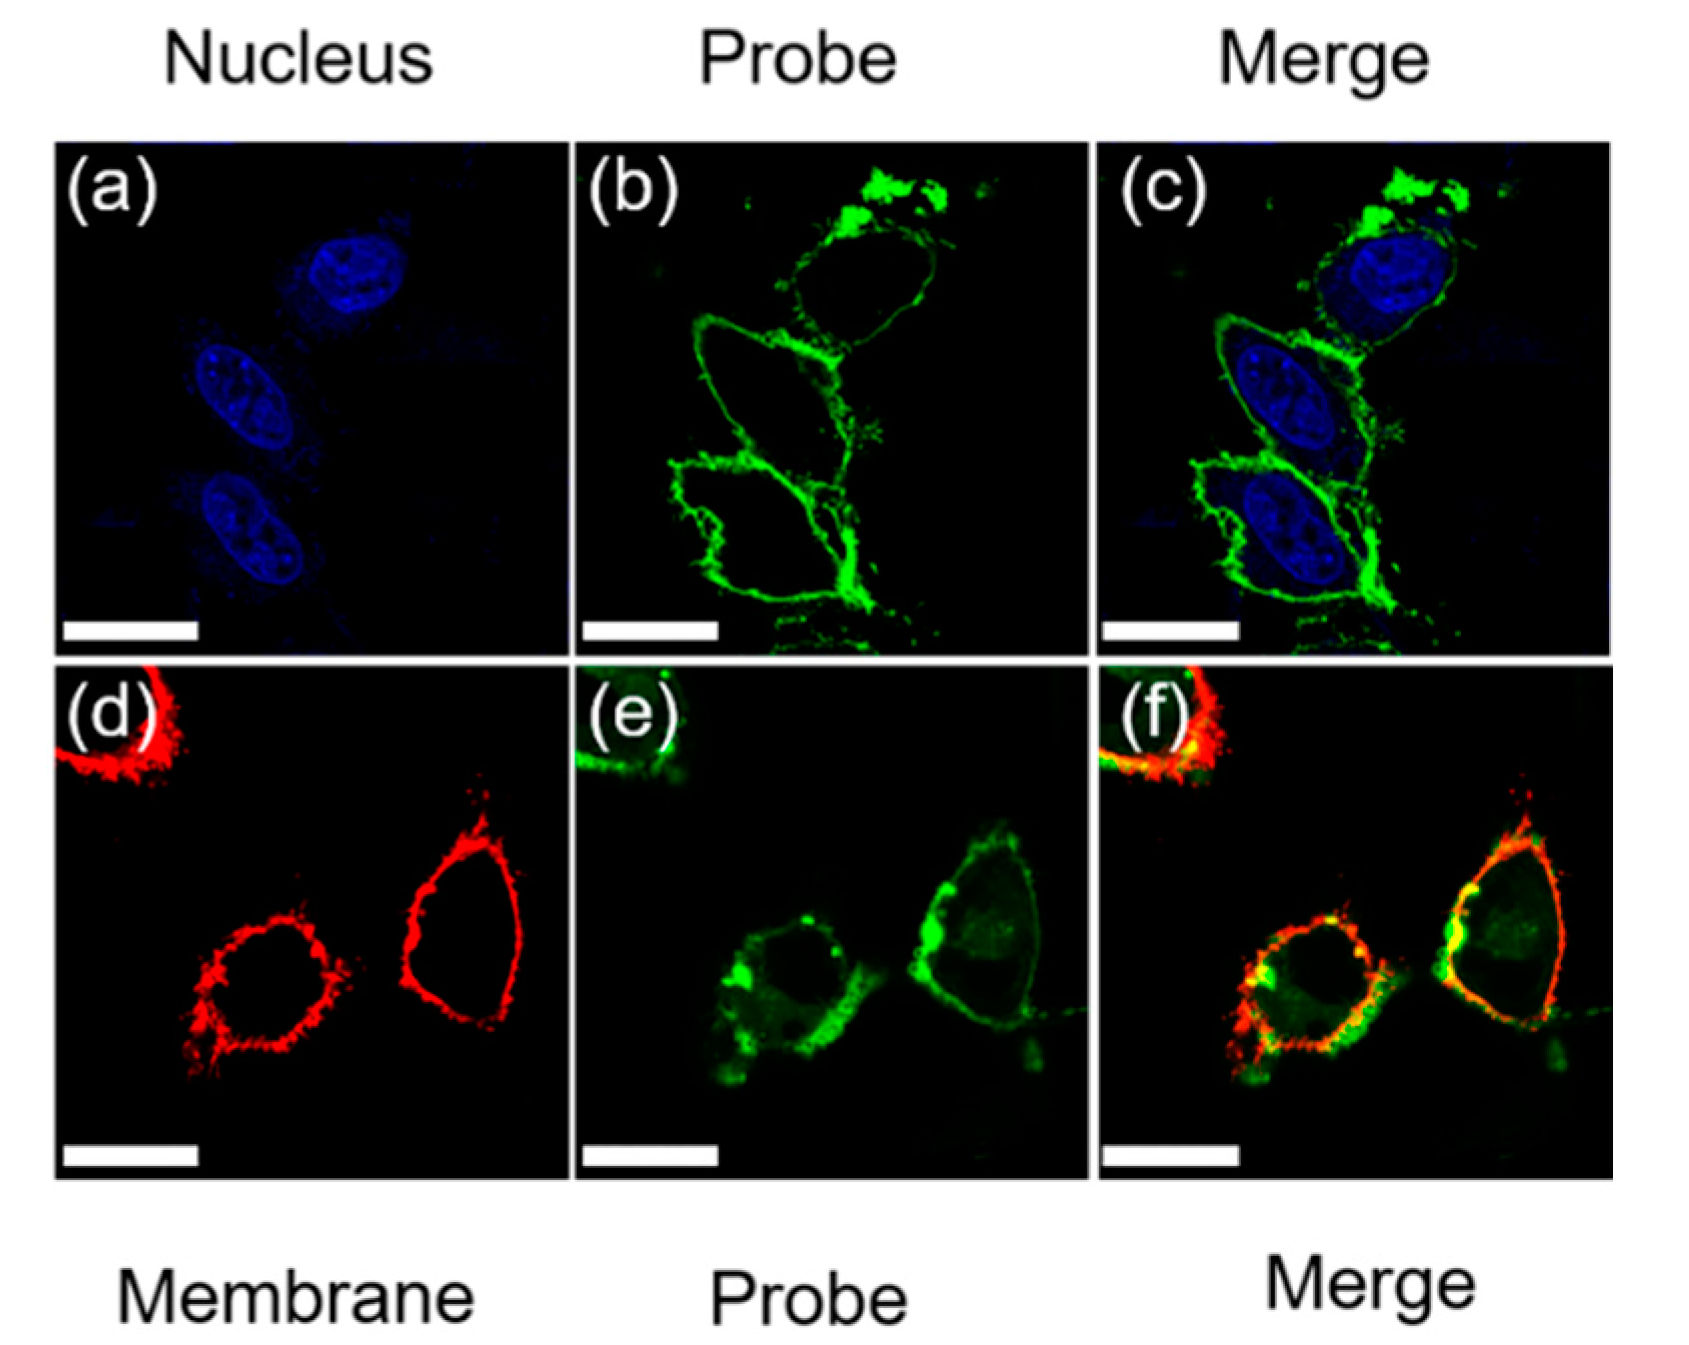
3.2. Cell-Targeted Imaging of NDSA-L5

To explore the possibility of NDSA-L5 as a specific biological probe for the detection of GPC-3 protein in vitro, we tested NDSA-L5 receptor-mediated GPC-3 binding in mammalian cells. Hep-G2 cells, with the same batch of digestion, were seeded in a confocal culture dish. After 12 h, when the cell growth was stable, the same concentration of probes was added to incubate Hep-G2 cells for 0 min, 15 min, 30 min, and 60 min. As shown in Figure S8, it is found that the staining is essentially complete after the probes are incubated with the cells for 30–60 min. In subsequent experiments, the probe incubation time was set to 60 min. Then we selected cancer cells Hep-G2, Huh-7, and Hep-3B overexpressing GPC-3 on the cell membrane as GPC-3-positive cancer cells, and breast cancer cells MCF-7, cervical cancer cells HeLa, normal liver cells L02, and liver cancer cells LM3 with low expression as negative controls. As shown in Figure 2a–i, the imaging of Hep-G2, Huh-7, and Hep-3B obtained an obvious fluorescence signal when the three types of hepatocellular carcinoma cells are incubated with the NDSA-L5 probe. In sharp contrast, under the same experimental conditions, MCF-7, HeLa, L02, and LM3 cells show weak fluorescence signals in the same imaging channel (Figure S9). The results suggest that the probe NDSA-L5 can selectively identify liver cancer cells overexpressing the GPC-3 protein.
To prove the existence of specific binding of NDSA-L5, we carried out a peptide blocking assay. In the blocking experiment, Hep-G2 cells were pre-incubated with varying levels of the L5 peptide followed by the addition of NDSA-L5. As shown in Figure 3a–c, the imaging of Hep-G2 cells that have not been incubated with the L5 peptide solution shows obvious fluorescence signals in the green channel. Meanwhile, the imaging of Hep-G2 cells pre-incubated with different L5 peptide concentration solutions (7 μM and 14 μM) is shown in Figure 3d–g. The green channel signal was significantly decreased as the concentration of peptide increased, likely because the binding sites of the existing GPC-3 were occupied by the L5 peptide, leading to a reduced combination of subsequent NDSA-L5. In order to show the contrast of imaging effects in Figure 3, we performed a quantitative analysis of the images. The mean fluorescence intensity and fluorescence imaging area were calculated, and it could be clearly seen from Figure S10 that the mean fluorescence intensity and fluorescence imaging area decreased significantly with the increase in the L5 peptide, which proved that the green channel signal was significantly decreased as the concentration of peptide increased. These results demonstrated that the L5 peptide-conjugated AIE fluorophore probe has specific binding interactions with the GPC-3 target.
The specific target ability of NDSA-L5 was also verified by the flow cytometry experiment for the GPC-3 protein of cancer cells. After incubation with NDSA-L5, hepatocellular carcinoma cells (Hep-G2, Huh-7, Hep-3B cells) over-expressing the GPC-3 protein were found to be clearly fluorescent, while hepatocellular carcinoma cells (LM3 cells) with low-expressing GPC-3 protein showed weak fluorescence signals (Figure 4a–d). Meanwhile, the other cancer cells (MCF-7, HeLa) and normal liver cells (L02) afforded very weak fluorescence (Figure S11a–f). Therefore, NDSA-L5 can selectively recognize hepatocellular carcinoma cells over-expressing the GPC-3 protein, which is consistent with the results obtained from the fluorescence imaging experiment.
To investigate the cellular localization of the NDSA-L5 probe, we performed confocal imaging of NDSA-L5 on GPC-3-positive Hep-G2 cells. We used DAPI, a commercial cell nuclear positioning fluorescent dye, and NDSA-L5 to perform fluorescence co-positioning experiments. As shown in Figure 5, the green fluorescence of NDSA-L5 exhibits the contour of the cells, being inferred on the cell membrane, which has a significant distinction between the blue fluorescence of the nucleus. To determine the subcellular distribution of the probe, DiI, a commercial red-fluorescent dye used for staining the cell membrane in live cells, was employed to be co-incubated with the Hep-G2 cell lines. The green fluorescence channel of the NDSA-L5 probe and the red fluorescence channel of DiI are well coincident, indicating that the NDSA-L5 probe can successfully target GPC-3 proteins of the cell membrane surface of hepatoma Hep-G2 cells.
Cytotoxicity of the fluorescent probe was evaluated by the widely used CCK-8 assay. As shown in Figure S12, the cell viability of Hep-G2, Hep-3B, Huh-7, MCF-7, Hela, LM3, and L02 cells used in the experiment was assessed. After 24 h of incubation with the medium containing 2, 4, 6, 8, and 10 µM NDSA-L5, the seven types of cells were determined by the CCK-8 assay, and the cell survival rate was 80% when the probe concentration was below 8 µM. The experimental results prove that NDSA-L5 has good biocompatibility and low biotoxicity, beneficial for use in bioimaging.

3.3. In Vivo Imaging in Hep-G2 Cancer Xenograft Mice Model

To analyze the in vivo selective targeting ability, we further investigated in vivo imaging for HCC tumors using NDSA-L5. The experimental tumor model was constructed mainly by inoculating GPC-3-positive Hep-G2 HCC cells in the armpit of mice. Then, in order to demonstrate the specific targeting performance of the probe to the tumor region, we chose the method of tail vein injection to introduce the probe into the circulation of the mice (Figure S13). At 0.5 h after injection, a strong fluorescent signal was observed in the tumor, indicating that NDSA-L5 showed significant accumulation in the tumor area. As the circulation time increased, the fluorescence signal gradually increased within 1.5 h, and then slowly declined due to metabolism, illustrating that NDSA-L5 could be used as a highly versatile agent for tumor imaging.

4. Conclusions

In summary, we succeeded in designing and synthesizing a novel AIE fluorescent probe, NDSA-L5, for the specific detection and imaging of hepatocellular carcinoma cells over-expressing the GPC-3 protein. The probe can image the cell membrane of HCC cells and quickly, highly selectively, and sensitively distinguish HCC cells overexpressing the GPC-3 protein from low-expressed GPC-3 protein HCC cells, other cancer cells, and normal liver cells. In vivo imaging in the Hep-G2 cancer xenograft mice model showed that the probe can significantly accumulate in the tumor tissue rather than in normal cellular tissue. We believe that the fluorescent NDSA-L5 probe has the potential for the early detection of HCC and intraoperative navigation.

Supplementary Materials

The following supporting information can be downloaded at: https://0-www-mdpi-com.brum.beds.ac.uk/article/10.3390/chemosensors10050195/s1, Scheme S1. The synthetic route of NDSA-L5. Figure S1. MALDI-TOF mass spectra of compound 5. Figure S2. 1H NMR spectrum of compound 5 recorded in DMSO-d6. Figure S3. MALDI-TOF mass spectra of NDSA-N3. Figure S4. 1H NMR spectrum of NDSA-N3 recorded in DMSO-d6. Figure S5. MALDI-TOF mass spectra of NDSA-L5. Figure S6. 1H NMR spectrum of NDSA-L5 recorded in DMSO-d6. Figure S7. (a) Fluorescence spectrum of NDSA-L5 in different n-hexane concentrations n-hexane/DMSO solution and NDSA-L5 in n-hexane/-DMSO Line graph of emission intensity of n-hexane volume fraction change, (b) the PL intensities of NDSA-N3 and NDSA-L5 in the PBS buffer (1 mM, pH 7.4). Figure S8. Time-uptake fluorescence imaging results of NDSA-L5 probe on Hep-G2 cells. Figure S9. Fluorescence images of cervical cancer cells (Hela cells, a–c), breast cancer cells (MCF-7 cells d–f), normal liver cells (L02 cells g–i), low-expressing hepatocellular carcinoma cells (LM3 cells k-m). Overlay imaging. Scale bar, 20 µm. Figure S10. Mean fluorescence intensity and fluorescence imaging area of Hep-G2 cell and their corresponding with different amounts of peptides L5 prior to NDSA-L5 treatment. Figure S11. Flow cytometry histograms of different cell lines, (a) and (d) Hela, (b) and (e) MCF-7, (c) and (f) L02, after incubation with NDSA-L5 for 90 min. Figure S12. Biological toxicity of NDSA-L5 in Hep-G2 (a), LM3 (b), huh-7 (c), MCF-7 (d), Hela (e), Hep-3B (f), L02 (g). Figure S13. Image of tumor site fluorescence changing with time. Table S1. Comparison of BTCA with other representative GPC-3 fluorescence probes.

Author Contributions

Conceptualization, W.T. and X.M.; methodology, J.J.; validation, S.Z.; formal analysis, L.M.; writing—original draft preparation, S.Z.; writing—review and editing, W.T.; visualization, B.X. All authors have read and agreed to the published version of the manuscript.

Funding

This work was supported by the Natural Science Foundation of China (21835001, 52073116, 51773080, 82090051, 81871442), the JLU Science and Technology Innovative Research Team (2021TD-03), the National Key Research programs of China (2016YFA0100900, 2016YFA0100902), and the Youth Innovation Promotion Association CAS (Y201930).

Institutional Review Board Statement

The animal study protocol was approved by the Ethics Committee of the Institute of Automation, Chinese Academy of Sciences (protocol code IA-202042) for studies involving animals.

Informed Consent Statement

Not applicable.

Data Availability Statement

Data sharing not applicable.

Acknowledgments

The authors thank State Key Laboratory of Supramolecular Structure and Materials and Institute of Automation, Chinese Academy of Sciences for providing research facilities for this project, and acknowledges funding from the Natural Science Foundation of China (21835001, 52073116, 51773080, 82090051, 81871442), the JLU Science and Technology Innovative Research Team (2021TD-03), the National Key Research programs of China (2016YFA0100900, 2016YFA0100902), and the Youth Innovation Promotion Association CAS (Y201930).

Conflicts of Interest

The authors declare no conflict of interest.

References

  1. Li, Q.Y.; Li, Y.; Min, T.L.; Gong, J.Y.; Du, L.L.; Phillips, D.L.; Liu, J.K.; Lam, J.W.Y.; Sung, H.H.Y.; Williams, I.D.; et al. Time-dependent photodynamic therapy for multiple targets: A highly efficient aie-active photosensitizer for selective bacterial elimination and cancer cell ablation. Angew. Chem. Int. Ed. 2020, 59, 9470–9477. [Google Scholar] [CrossRef] [PubMed] [Green Version]
  2. Hiam-Galvez, K.J.; Allen, B.M.; Spitzer, M.H. Systemic immunity in cancer. Nat. Rev. Cancer 2021, 21, 345–359. [Google Scholar] [CrossRef] [PubMed]
  3. Mattiuzzi, C.; Lippi, G. Current cancer epidemiology. J. Epidemiol. Glob. Health 2019, 9, 217–222. [Google Scholar] [CrossRef] [PubMed] [Green Version]
  4. Dutta, R.; Mahato, R.I. Recent advances in hepatocellular carcinoma therapy. Pharmacol. Ther. 2017, 173, 106–117. [Google Scholar] [CrossRef] [PubMed] [Green Version]
  5. Weaver, R.J.; Blomme, E.A.; Chadwick, A.E.; Copple, I.M.; Gerets, H.H.J.; Goldring, C.E.; Guillouzo, A.; Hewitt, P.G.; Ingelman-Sundberg, M.; Jensen, K.G.; et al. Managing the challenge of drug-induced liver injury: A roadmap for the development and deployment of preclinical predictive models. Nat. Rev. Drug Discov. 2020, 19, 131–148. [Google Scholar] [CrossRef] [PubMed]
  6. Vogel, A.; Saborowski, A. Current strategies for the treatment of intermediate and advanced hepatocellular carcinoma. Cancer Treat. Rev. 2020, 82, 101946. [Google Scholar] [CrossRef] [PubMed] [Green Version]
  7. Anwanwan, D.; Singh, S.K.; Singh, S.; Saikam, V.; Singh, R. Challenges in liver cancer and possible treatment approaches. Biochim. Biophys. Acta Rev. Cancer 2020, 1873, 188314. [Google Scholar] [CrossRef]
  8. Dhanasekaran, R.; Nault, J.C.; Roberts, L.R.; Zucman-Rossi, J. Genomic medicine and implications for hepatocellular carcinoma prevention and therapy. Gastroenterology 2019, 156, 492–509. [Google Scholar] [CrossRef]
  9. Rebouissou, S.; Nault, J.C. Advances in molecular classification and precision oncology in hepatocellular carcinoma. J. Hepatol. 2020, 72, 215–229. [Google Scholar] [CrossRef] [Green Version]
  10. Dimri, M.; Satyanarayana, A. Molecular signaling pathways and therapeutic targets in hepatocellular carcinoma. Cancers 2020, 12, 491. [Google Scholar] [CrossRef] [Green Version]
  11. Chalasani, N.P.; Porter, K.; Bhattacharya, A.; Book, A.J.; Neis, B.M.; Xiong, K.M.; Ramasubramanian, T.S.; Edwards, V.D.K.; Chen, I.; Johnson, S.; et al. Validation of a novel multitarget blood test shows high sensitivity to detect early stage hepatocellular carcinoma. Clin. Gastroenterol. Hepatol. 2022, 20, 173–182. [Google Scholar] [CrossRef] [PubMed]
  12. Qin, Y.; Fan, J.L.; Yang, W.; Shen, B.B.; Yang, Y.P.; Zhou, Q.; Chen, W.M.; Daniyal, M.; Xiao, F.; Sheng, W.B.; et al. Endogenous cys-assisted gsh@agncs-rgo nanoprobe for real-time monitoring of dynamic change in gsh levels regulated by natural drug. Anal. Chem. 2020, 92, 1988–1996. [Google Scholar] [CrossRef] [PubMed]
  13. Ouyang, J.; Sun, L.H.; Zeng, Z.; Zeng, C.; Zeng, F.; Wu, S.Z. Nanoaggregate probe for breast cancer metastasis through multispectral optoacoustic tomography and aggregation-induced nir-i/ii fluorescence imaging. Angew. Chem. Int. Ed. 2020, 59, 10111–10121. [Google Scholar] [CrossRef] [PubMed]
  14. Zhao, M.; Gao, Y.J.; Ye, S.Y.; Ding, J.N.; Wang, A.N.; Li, P.J.; Shi, H.B. A light-up near-infrared probe with aggregation-induced emission characteristics for highly sensitive detection of alkaline phosphatase. Analyst 2019, 144, 6262–6269. [Google Scholar] [CrossRef]
  15. Yi, B.; Wu, T.; Zhu, N.; Huang, Y.; Yang, X.Y.; Yuan, L.; Wu, Y.J.; Liang, X.F.; Jiang, X.Q. The clinical significance of ctc enrichment by gpc3-iml and its genetic analysis in hepatocellular carcinoma. J. Nanobiotechnol. 2021, 19, 74. [Google Scholar] [CrossRef]
  16. Wang, J.Y.; Wang, X.K.; Zhu, G.Z.; Zhou, X.; Yao, J.; Ma, X.P.; Wang, B.; Peng, T. Distinct diagnostic and prognostic values of glypicans gene expression in patients with hepatocellular carcinoma. BMC Cancer 2021, 21, 462. [Google Scholar] [CrossRef]
  17. Qiang, Z.Y.; Zhang, H.F.; Jin, S.; Yan, C.; Li, Z.; Tao, L.Y.; Yu, H.B. The prognostic value of arginase-1 and glypican-3 expression levels in patients after surgical intrahepatic cholangiocarcinoma resection. World J. Surg. Oncol. 2021, 19, 316. [Google Scholar] [CrossRef]
  18. Koksal, A.R.; Aydin, Y.; Lin, D.; Nunez, K.; Thevenot, P.; Parsi, M.A.; Cohen, A.J.; Dash, S. Glypican-3 enriched in exosomes not in the microvesicles: A potential biomarker for hepatocellular carcinoma. Hepatology 2021, 74, 691A–692A. [Google Scholar]
  19. Caviglia, G.P.; Armandi, A.; Rosso, C.; Gaia, S.; Aneli, S.; Rolle, E.; Abate, M.L.; Olivero, A.; Nicolosi, A.; Guariglia, M.; et al. Biomarkers of oncogenesis, adipose tissue dysfunction and systemic inflammation for the detection of hepatocellular carcinoma in patients with nonalcoholic fatty liver disease. Cancers 2021, 13, 2305. [Google Scholar] [CrossRef]
  20. Au, K.Y.; Chan, K.K.S.; Lo, R.C.L. A clinicopathological study of young-onset hepatocellular carcinoma. Anticancer Res. 2021, 41, 2933–2944. [Google Scholar] [CrossRef]
  21. Wang, W.Y.; Wei, C. Advances in the early diagnosis of hepatocellular carcinoma. Genes Dis. 2020, 7, 308–319. [Google Scholar] [CrossRef] [PubMed]
  22. Yao, M.; Yang, J.L.; Wang, L.; Yao, D.F. Carcinoembryonic type specific markers and liver cancer immunotherapy. Zhonghua Gan Zang Bing Za Zhi = Zhonghua Ganzangbing Zazhi = Chin. J. Hepatol. 2020, 28, 466–470. [Google Scholar]
  23. Li, Z.H.; Cheng, J.; Huang, P.; Song, W.H.; Nong, L.; Huang, L.; Lin, W.Y. Imaging and detection of hepatocellular carcinoma with a hepatocyte-specific fluorescent probe. Anal. Chem. 2022, 94, 3386–3393. [Google Scholar] [CrossRef] [PubMed]
  24. Gao, Y.; Zheng, Q.C.; Xu, S.; Yuan, Y.; Cheng, X.; Jiang, S.; Kenry; Yu, Q.; Song, Z.; Liu, B.; et al. Theranostic nanodots with aggregation-induced emission characteristic for targeted and image-guided photodynamic therapy of hepatocellular carcinoma. Theranostics 2019, 9, 1264–1279. [Google Scholar] [CrossRef]
  25. Natarajan, A.; Zhang, H.; Ye, W.; Huttad, L.; Tan, M.D.; Chua, M.S.; Gambhir, S.S.; So, S.K. A humanized anti-gpc3 antibody for immuno-positron emission tomography imaging of orthotopic mouse model of patient-derived hepatocellular carcinoma xenografts. Cancers 2021, 13, 3977. [Google Scholar] [CrossRef]
  26. Kelada, O.J.; Gutsche, N.T.; Bell, M.; Berman, R.M.; Baidoo, K.E.; Warner, B.M.; Szajek, L.P.; Hong, J.; Ho, M.; Choyke, P.; et al. Immunopet as stoichiometric sensor for glypican-3 in models of hepatocellular carcinoma. Int. J. Radiat. Oncol. Biol. Phys. 2020, 108, S180–S181. [Google Scholar] [CrossRef]
  27. Xu, R.; Wang, J.; Huang, X.Y.; Zhang, Q.Y.; Xie, Y.J.; Pang, L.; Bai, L.C.; Zhou, J.L. Clinical value of spectral ct imaging combined with afp in identifying liver cancer and hepatic focal nodular hyperplasia. J. Buon 2019, 24, 1429–1434. [Google Scholar]
  28. Chikhaliwala, P.; Chandra, S. Poly-amidoamine dendrimers@Fe3O4 based electrochemiluminescent nanomaterials for biosensing of liver cancer biomarkers. Electroanalysis 2020, 32, 2404–2414. [Google Scholar] [CrossRef]
  29. Tian, R.; Zhu, L.; Qin, Z.N.; Wang, G.H.; Wang, J.J.; Zhang, H. Glypican-3 (gpc3) targeted fe3o4 core/au shell nanocomplex for fluorescence/mri/photoacoustic imaging-guided tumor photothermal therapy. Biomater. Sci. 2019, 7, 5258–5269. [Google Scholar] [CrossRef]
  30. Park, J.O.; Stephen, Z.; Sun, C.; Veiseh, O.; Kievit, F.M.; Fang, C.; Leung, M.; Mok, H.; Zhang, M.Q. Glypican-3 targeting of liver cancer cells using multifunctional nanoparticles. Mol. Imaging 2011, 10, 69–77. [Google Scholar] [CrossRef]
  31. Zhu, D.L.; Qin, Y.S.; Wang, J.J.; Zhang, L.W.; Zou, S.J.; Zhu, X.H.; Zhu, L. Novel glypican-3-binding peptide for in vivo hepatocellular carcinoma fluorescent imaging. Bioconjug. Chem. 2016, 27, 831–839. [Google Scholar] [CrossRef] [PubMed]
  32. Wang, H.; Ma, K.; Xu, B.; Tian, W.J. Tunable supramolecular interactions of aggregation-induced emission probe and graphene oxide with biomolecules: An approach toward ultrasensitive label-free and “turn-on” DNA sensing. Small 2016, 12, 6613–6622. [Google Scholar] [CrossRef] [PubMed]
  33. Ma, K.; Zhang, F.L.; Sayyadi, N.; Chen, W.J.; Anwer, A.G.; Care, A.; Xu, B.; Tian, W.J.; Goldys, E.M.; Liu, G.Z. “Turn-on” fluorescent aptasensor based on aiegen labeling for the localization of ifn-gamma in live cells. ACS Sens. 2018, 3, 320–326. [Google Scholar] [CrossRef] [PubMed]
  34. La Lee, Y.; Ahn, B.C.; Lee, Y.; Lee, S.W.; Cho, J.Y.; Lee, J. Targeting of hepatocellular carcinoma with glypican-3-targeting peptide ligand. J. Pept. Sci. 2011, 17, 763–769. [Google Scholar] [CrossRef]
  35. Jing, J.B.; Xue, Y.R.; Liu, Y.X.; Xu, B.; Li, H.W.; Liu, L.J.; Wu, Y.Q.; Tian, W.J. Co-assembly of hpv capsid proteins and aggregation-induced emission fluorogens for improved cell imaging. Nanoscale 2020, 12, 5501–5506. [Google Scholar] [CrossRef]
  36. Han, W.K.; Zhang, S.; Qian, J.Y.; Zhang, J.X.; Wang, X.H.; Xie, Z.G.; Xu, B.; Han, Y.Q.; Tian, W.J. Redox-responsive fluorescent nanoparticles based on diselenide-containing aiegens for cell imaging and selective cancer therapy. Chem. Asian J. 2019, 14, 1745–1753. [Google Scholar] [CrossRef]
  37. Zhang, S.; Ma, L.; Ma, K.; Xu, B.; Liu, L.J.; Tian, W.J. Label-free aptamer-based biosensor for specific detection of chloramphenicol using aie probe and graphene oxide. ACS Omega 2018, 3, 12886–12892. [Google Scholar] [CrossRef]
  38. Han, H.-H.; Qiu, Y.-J.; Shi, Y.-Y.; Wen, W.; He, X.-P.; Dong, L.-W.; Tan, Y.-X.; Long, Y.-T.; Tian, H.; Wang, H.-Y. Glypican-3-targeted precision diagnosis of hepatocellular carcinoma on clinical sections with a supramolecular 2d imaging probe. Theranostics 2018, 8, 3268–3274. [Google Scholar] [CrossRef]
Figure 1. (a) Recognition process of NDSA-L5 probe for GPC-3. (b) Absorption and emission spectra of NDSA-L5 in DMSO, (c) fluorescence response of NDSA-L5 related to GPC-3 (0−20 µg/mL), and quantitative detection of GPC-3. (d) Fluorescence response of NDSA-L5 at 540 nm on the addition of other biomolecules and GPC-3 (20 µg/mL): 1. H+ 2. Na+ 3. K+ 4. Cu2+ 5. Fe2+ 6. Cl 7. OH 8. Glutathione 9. L-Cysteine 10. Trypsin 11. BSA 12. Pepsase 13. Papayotin 14. Fruin 15. ALP (alkaline phosphatase) 16. GPC-3.
Chemosensors 10 00195 g001
Figure 2. Fluorescence images of hepatocellular carcinoma cells Hep-G2 cells (ac), Hep-3B cells (df), Huh-7 cells (gi) stained with NDSA-L5 (7 µM). Overlay imaging. Scale bar, 20 µm.
Chemosensors 10 00195 g002
Figure 3. Confocal microscopy images of Hep-G2 cells pretreated with different amounts of peptides L5 prior to NDSA-L5 treatment. (ac) The imaging of Hep-G2 cells incubated with the 0 µM of L5 peptide solution; (df) the imaging of Hep-G2 cells incubated with the 7 µM of L5 peptide solution; (gi) the imaging of Hep-G2 cells incubated with the 14 µM of L5 peptide solution Scale bar, 20 µm.
Chemosensors 10 00195 g003
Figure 4. Flow cytometry histograms of different cell lines, (a) Hep-G2, (b) Huh-7, (c) Hep-3B, (d) LM3 after incubation with NDSA-L5 for 90 min.
Chemosensors 10 00195 g004
Figure 5. Fluorescence images of NDSA-L5, DAPI, DiI in Hep-G2 cancer cells. (a) Stained with DAPI (Nucleus); (b) stained with NDSA-L5 (Probe); (c) merge of (a) and (b); (d) stained with DiI (Membrane); (e) stained with NDSA-L5 (Probe); (f) merge of (d) and (e). Scale bar: 20 µm.
Chemosensors 10 00195 g005
Publisher’s Note: MDPI stays neutral with regard to jurisdictional claims in published maps and institutional affiliations.

