Article

Screen-Printed Gold Electrode Functionalized with Deferoxamine for Iron(III) Detection

1
Department of Chemistry, University of Pavia, Via Taramelli 12, 27100 Pavia, Italy
2
Unità di Ricerca di Pavia, INSTM, Via G. Giusti 9, 50121 Firenze, Italy
*
Author to whom correspondence should be addressed.
Submission received: 26 May 2022 / Revised: 5 June 2022 / Accepted: 5 June 2022 / Published: 6 June 2022
(This article belongs to the Section Electrochemical Devices and Sensors)

Abstract

:
Deferoxamine (DFO), a hydroxamic siderophore with a high affinity for Fe(III), is immobilized as a functionalized self-assembled monolayer of a thiol (SAM) on the gold surface of a screen-printed cell to develop a voltammetric sensor for iron(III). The surface of the working electrode was characterized, before and after functionalization, by determining surface properties such as the area and the double-layer capacitance. The Fe(III) detection was performed by DPV analysis after preconcentration of the cation at the open circuit potential in solution at pH = 1 for two minutes. The method was applied to the iron(III) quantification in water samples giving promising results.

1. Introduction

Deferoxamine (DFO) is a natural siderophore tris-hydroxamate produced by the bacteria Streptomyces pilosus [1]. It is a bidentate ligand that strongly binds hard cations like Fe(III) through its oxygen atoms. It has a low molecular weight, and it is water-soluble. DFO contains one protonable primary amino group and three hydroxamic groups that behave as weak acids [2]. Deferoxamine is the active substance of Desferal©, the only FDA-approved drug employed for use in the treatment of acute or chronic iron overload due to blood transfusions [3]. The drug has, unfortunately, many disadvantages [4,5,6]:
  • it can only be intramuscularly injected;
  • it can cause long term damage to the body;
  • it has a high price;
  • it is toxic when not bound to iron.
These aspects lead to the development and research of new drugs. However, despite the considerable effort to find alternative oral-active iron chelators, none of the candidates succeeded, until now, in being accepted as the optimal iron chelator [3,7].
Although several drawbacks in patient treatment with deferoxamine, thanks to the strong chelation properties toward Fe(III) and other hard cations, DFO is effectively used in the research field to develop functionalized solid phases for separation and preconcentration of hard cations or optical and electrochemical sensors.
Great pharmacokinetics and bioapplicability were recognized for deferoxamine-adamantanes derivatives conjugates [8], nanogel-DFO conjugates [9], and deferoxamine immobilized poly(D, L−lactide) membranes [10].
Deferoxamine properties have also encouraged the development of functional materials used as sorbents or sensors, mainly for Fe(III). For example, mesoporous silica MCM-41 [11,12], filter paper [13], and sepharose gel [14] were functionalized with DFO to develop biomaterials for iron sensing in environmental and biological samples. Moreover, DFO-based synthetic polymers and hybrid materials were also prepared [15,16].
Optical and electrochemical devices were developed by modifying the sensing surfaces with deferoxamine. For example, the fluorescein-deferoxamine fluoroionophore receptor was designed for Fe(III) sensing [17]. DFO-papers obtained by functionalization of Whatman filter papers were applied for simple and low-cost colorimetric detection of Fe(III) and V(V) [13]. Interesting new approaches were SERS and SPR deferoxamine-based sensors [18,19]. Only a few works reported the description of modified electrodes with DFO for potentiometric or voltammetric analysis [20,21,22].
In the present study, deferoxamine is immobilized as a functionalized self-assembled monolayer of a thiol (SAM) on the gold surface of a screen-printed cell to develop an electrochemical sensor for iron(III).
The self-assembled monolayers (SAMs) technique in developing sensors and biosensors has several advantages, such as simple preparation, good stability, and versatility, thanks to the possibility of incorporating different functionalities [23]. SAMs are ordered molecular assemblies, usually prepared by exploiting the affinity of alkanethiols for some metal surfaces, mainly gold [24]. Traditionally, sensors based on SAMs-modified gold electrodes were proposed thanks to their high selectivity and sensitivity toward several metal ions. The increased demand for simple, low-cost, disposable devices for in situ sensing of metal cations supported the use of screen-printing electrodes to develop sensors and biosensors [25]. Moreover, gold screen-printed electrodes can be disposable, miniaturized, mass-produced, and cost-effective. Many studies have been published in the last three years regarding organic and inorganic analytes’ sensing or immunosensing by SAMs-modified gold screen-printed electrodes [26,27,28,29,30,31,32,33,34,35,36,37]; until now, no study described a similar sensor for Fe(III).
From this perspective, the present paper describes a completely screen-printed cell with the gold surface of the working electrode covered with a SAM of mercaptopropionic acid, functionalized with DFO, for voltammetric detection of Fe(III).

2. Materials and Methods

2.1. Reagents and Apparatus

3-Mercaptapropionic acid (MPA), N-(3-dimethylaminopropyl)-N′-ethylcarbodiimide hydrochloride (EDC), N-hydroxysuccinimide (NHS), ethanol, K4Fe(CN)6, H3PO4, H2SO4, NaClO4 and NaOH, all of the analytical grade, were purchased from Merk Life Science S.r.l. (Milano, Italy). Deferoxamine mesylate salt (Desferal, DFO-Novartis Pharma S.p.A, Origgio (VA), Italy) was purchased in a local pharmacy. All these reagents were used as received. Iron standard solution for ICP of 1 g/L (Merk Life Science S.r.l., Milano, Italy) was employed to prepare Fe(III) solutions at the proper concentration. All the aqueous solutions were prepared with ultrapure water.
Screen-printed three-electrode cells (Metrohm/DropSens, Metrohm Italiana Srl, Origgio (VA), Italy) with a ceramic substrate (L33 × W10 × H0.5 mm), electric contacts in silver, Au working electrode (4 mm diameter), Au auxiliary electrode and Ag pseudo reference electrode were used. Before functionalization, the gold surface of the working electrode was polished with alumina powered paste (0.05 µm alumina and ultrapure water), then rinsed with ethanol and ultrapure water, and finally submitted to electrochemical cleaning by cyclic voltammetry in H2SO4 0.5 M solution (10–20 cycles; potential scan from −0.1 V to 0.9 V. scan rate 100 mV/s).
Voltammetric analyses were performed by the potentiostat/galvanostat EmStat4s-PalmSens BV (Houten -The Netherlands).

2.2. Functionalization of the Working Gold Electrode

The procedure for preparing a DFO-SAM on the gold electrode was adapted from that previously reported for an SPR deferoxamine-based sensor [19]. 7 µL of 20 mM MPA aqueous solution was drop-coated and soaked overnight to form the thiol SAM on the cleaned gold electrode surface. Then the Au-MPA SAM was activated by drop-coating 7 µL of 0.1 M phosphate buffer solution (PBS) at pH 5.5, containing 2 mM EDC and 5 mM NHS for 1.5 h. The activated SAM layer was rinsed with PBS and used for functionalization by drop-coating 7 µL of 2 mM DFO aqueous solution and left to react for 2 h at room temperature. The functionalized electrode was rinsed carefully with ultrapure water to eliminate physically adsorbed species and dried in an N2 atmosphere. The functionalized electrode was stored in the 2 mM DFO solution when not immediately used.

2.3. Area and Capacitance of the Modified Gold Working Electrode

Before and after surface modification, the working electrode characterization was accomplished by evaluating the electrochemically effective electrode area and the double-layer capacitance.
The effective gold electrode area was determined by cyclic voltammetry (CV) in 5 mM K4Fe(CN)6/0.1 M KCl at pH 7.2 (start potential −1 V, end potential +1 V, scan rate from 0.025 a 0.5 V/s). The scan rate’s square root is plotted against the intensity of the anodic or cathodic peak. From the slope (K), through the modified Randles-Sevick’s equation [38], the effective area is obtained by the following equation:
A = K C D 1 / 2 2.69 10 5 n 3 / 2
D is the diffusion coefficient of the electrochemical probe; for K4Fe(CN)6, D is equal to 3.09·10−6 cm2/s, C is the concentration of K4Fe(CN)6 (5 mM), and n is the number of the electron exchanged in the reduction: Fe(CN)63− + e → Fe(CN)64− (n = 1).
The value obtained is compared with the geometrical area.
The double-layer capacitance was determined by CV in 1 M acetic buffer at pH 4 (start potential −0.4 V, end potential +1 V, scan rate from 0.025 a 0.5 V/s). The slope of the graph, obtained by plotting the capacitive current (i.e., the difference between the cathodic and anodic peak) versus the scan rate, corresponds to the capacitance. Dividing this value by two, the capacitance of the double layer can be achieved [39].

2.4. Fe(III) Determination by Differential Pulse Voltammetry (DPV)

Fe(III) was accumulated onto the functionalized gold electrode by immersion of the screen-printed cell in 15 mL of 0.1 M HNO3 solution at different Fe(III) content, for 2 min, at the open circuit, under gentle stirring. Then the DPV measurements were performed in 0.1 M acetate buffer at pH 3.5 containing 0.1 M NaClO4 as a supporting electrolyte. Electrochemical conditions were: start potential +0.9 V, end potential −0.1 V, scan rate 100 mV/s, pulse amplitude 50 mV, pulse time 0.04 s.

3. Results and Discussions

3.1. Electrode Functionalization

The procedure to functionalize the working gold electrode was adapted from the previously reported one for an SPR sensor [19]. When working with a screen-printed cell, the main issue is functionalizing the single working electrode and avoiding contamination and compromising the pseudoreference and auxiliary electrodes; consequently, it was impossible to soak the whole cell in the reagents’ solutions. The best option was to drop coat a small volume of each reagent, enough to cover the entire area of the working electrode without affecting the other two electrodes. After trying different volumes, ranging from 3 to 15 µL, the right quantity was 7 µL, so it was decided to keep this quantity for each functionalization step.
The second question was about the selection of the soaking time. For the first step, i.e., the formation of the thiol monolayer, 7 µL of the MPA solution was left to dry at room temperature overnight. For the second and third steps, the solutions were left to dry respectively for 1.5 h and 2 h, i.e., about the half time required for the functionalization of the traditional gold electrodes, as the optimum time values obtained by an experimental design. In particular, a simple full factorial design 22 was applied. Table 1 presents the level definitions for the parameters under investigation.
As a response, the current intensity of the peak obtained in DPV analysis has been evaluated. The data obtained were processed by the open-source program CAT (Chemometric Agile Tool) [40]. The following Figure 1 shows the graph representing the significance of the model’s coefficients.
From the graph of Figure 1, it can be observed that to be significant, are the coefficients b1 related to t2, i.e., the reaction time of the second step, and b12 related to the interaction t2 × t3. Therefore, both coefficients are relevant and cannot be simplified; so the following equation of the model has to be written: R = b0 + b1 t2 + b2 t3 + b12 t2 t3.
The interactions between the significant coefficients are evaluated by analyzing the graphs of the isoresponse surfaces (Figure 2).

3.2. Working Gold Electrode Characterization

Before and after functionalization, the working gold electrode’s surface was characterized by two electrochemical approaches aiming to determine surface properties such as the area and the double-layer capacitance.
Firstly, the effective area of the gold electrode was evaluated by CV measurements, using the probes Fe(CN)64−, by applying the modified Randles-Sevcik equation [38]. For the cleaned gold bare electrode, the computed area is equal to 0.12(7) cm2, not significantly different from the value provided by the manufacturer (0.126 cm2). Therefore, the electrochemically active area corresponds to the total working electrode surface. The area was also determined after functionalization with deferoxamine; in this case, a low value was obtained equal to 0.11(7) cm2. This experimental evidence can be justified considering that the monolayer of deferoxamine above the working electrode reduces the electronic transfer capacity of gold.
The electrode’s double-layer capacitance [39] was determined by cyclic voltammetry in 1 M acetic buffer at pH 4, varying the potential from −0.4 V to +1 V at different scanning rates. For the cleaned gold bare electrode, the capacitance value obtained is 2.7(1) µF, while for the functionalized electrode, a ten times higher value was determined (28.81(4) µF). The capacitance of the double layer increased from the bare electrode to the functionalized one; this means that the presence of the DFO monolayer increased the ability to accumulate electrical charges to the electrode and, therefore, there was an increase in the sensor efficiency. Moreover, for the electrode functionalized with the SAM, the higher capacitance value indicates a low presence of defects in the monolayer, as previously demonstrated by cyclic voltammetry and impedance spectroscopy [41,42]; indeed, a high percentage of defects in SAM would lead to capacitance values similar to those of a bare electrode.

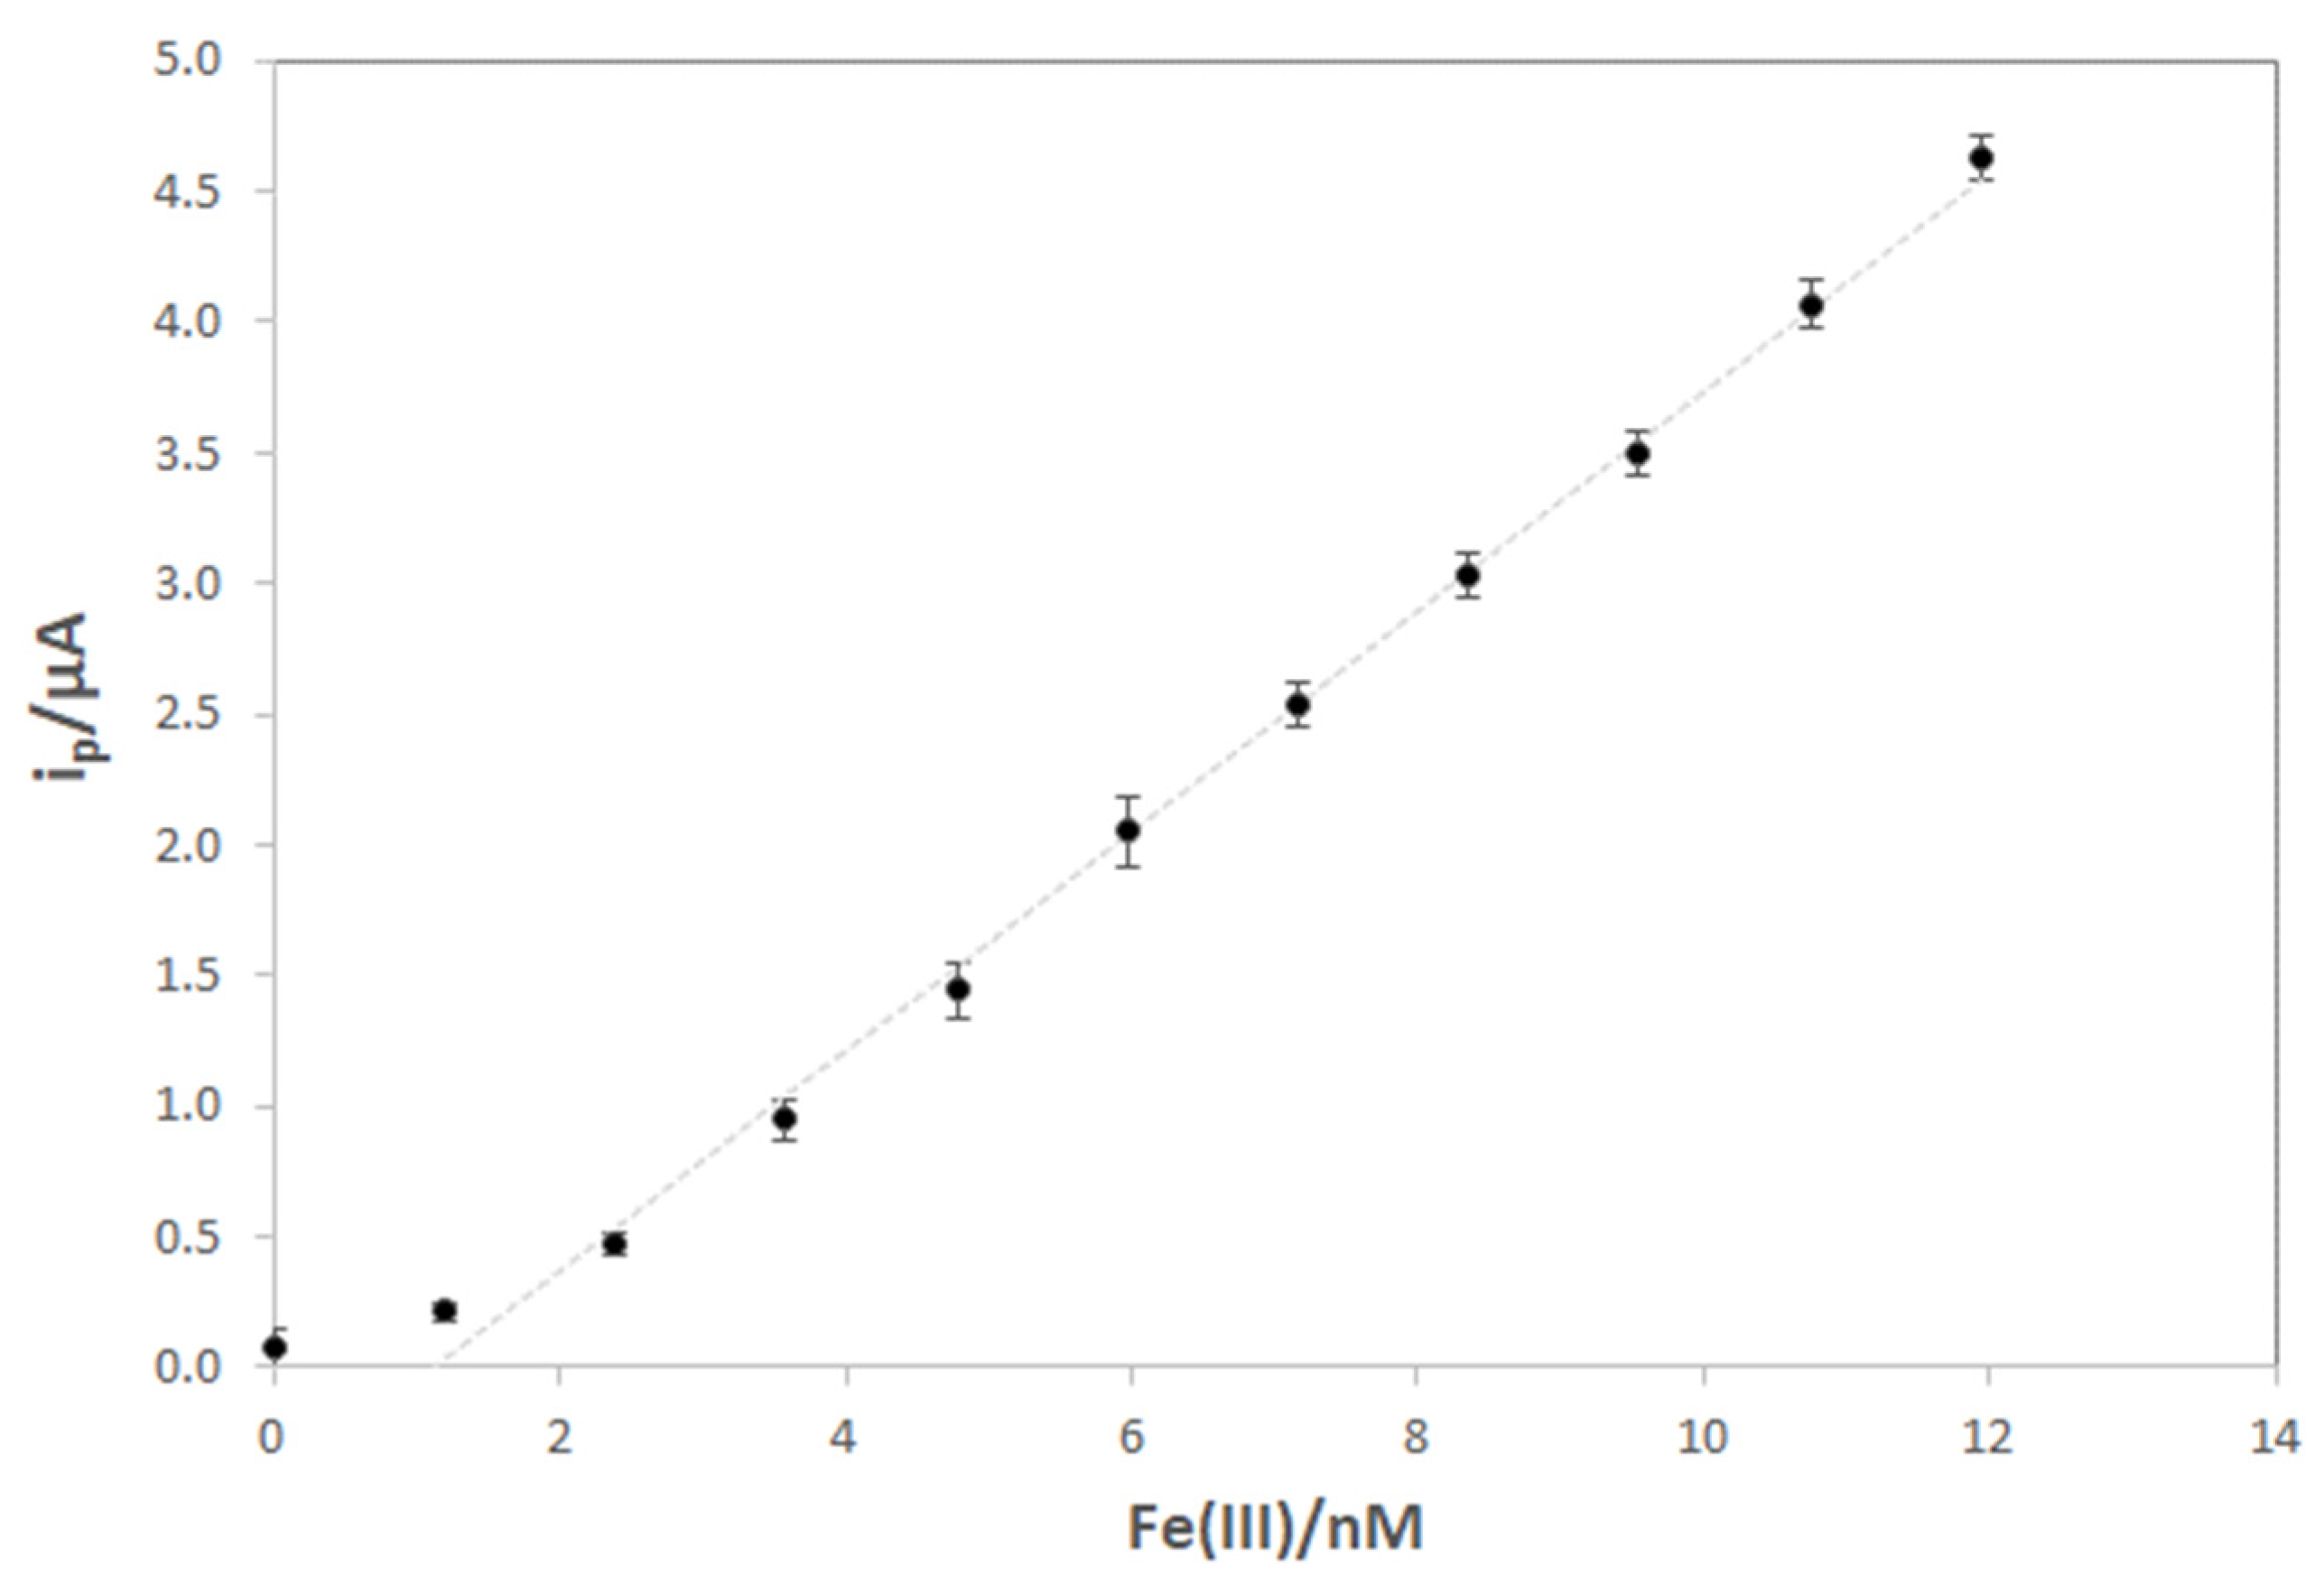
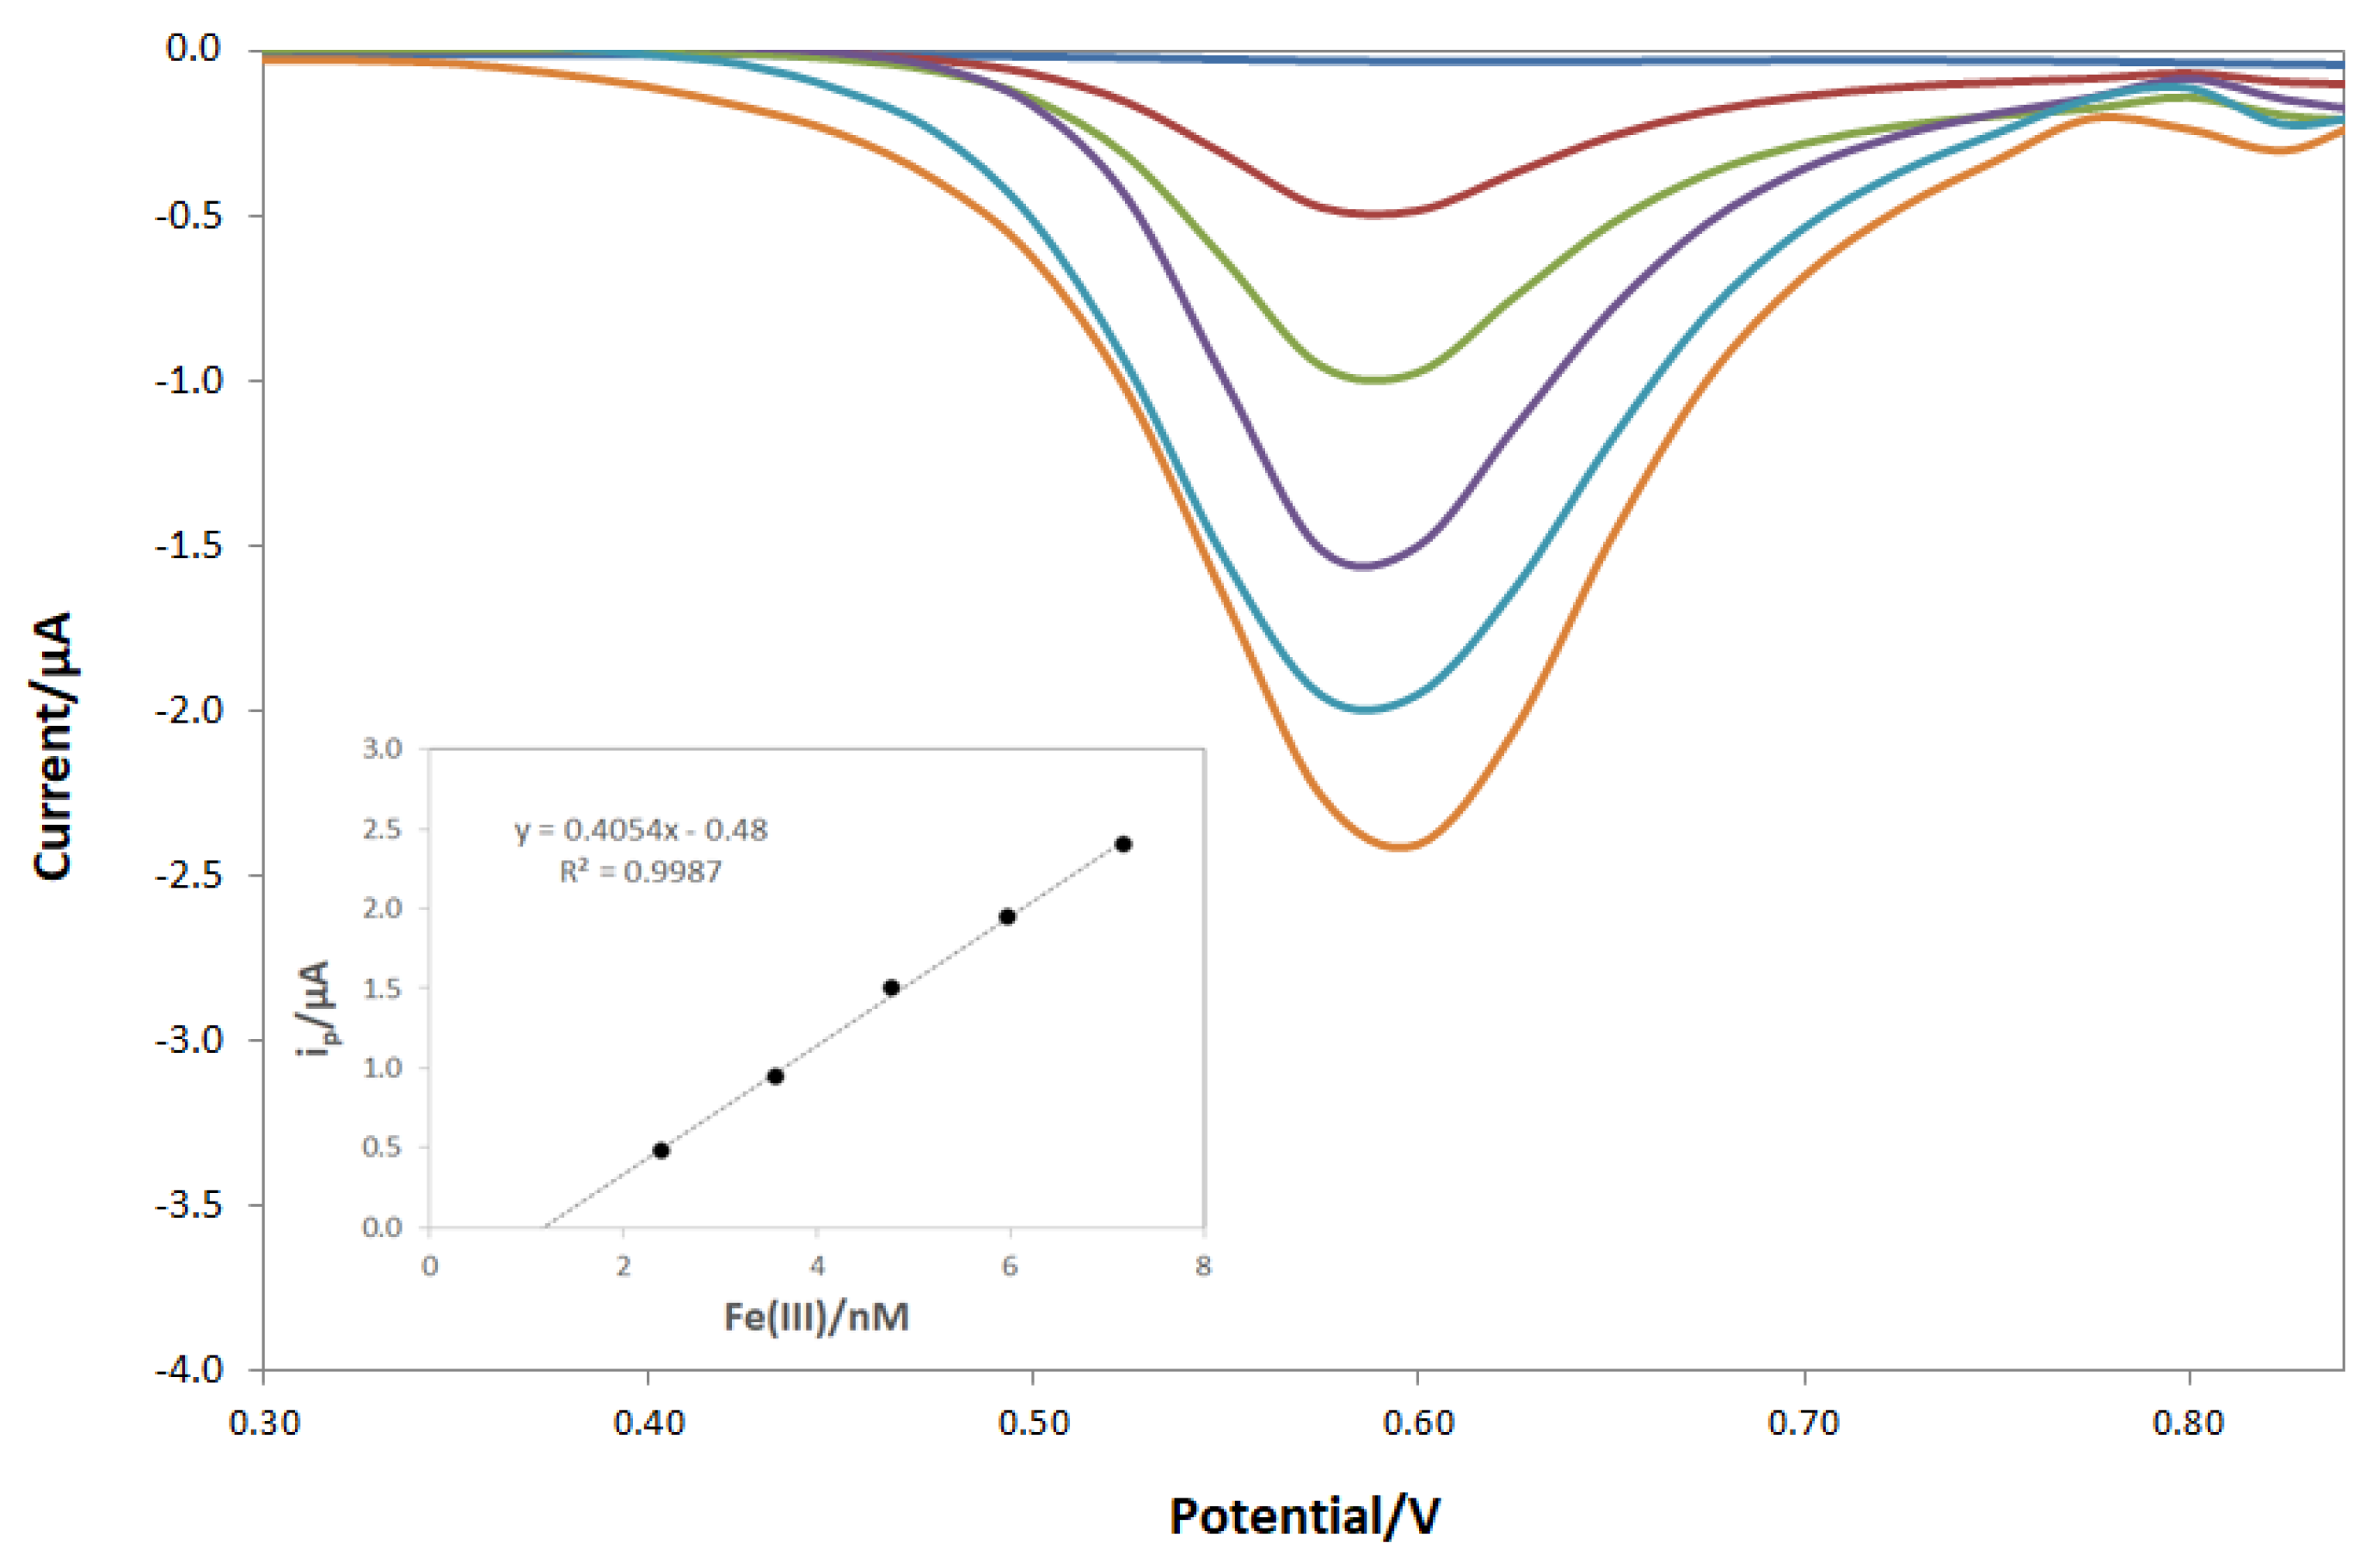
3.3. Fe(III) Determination by DPV Analysis
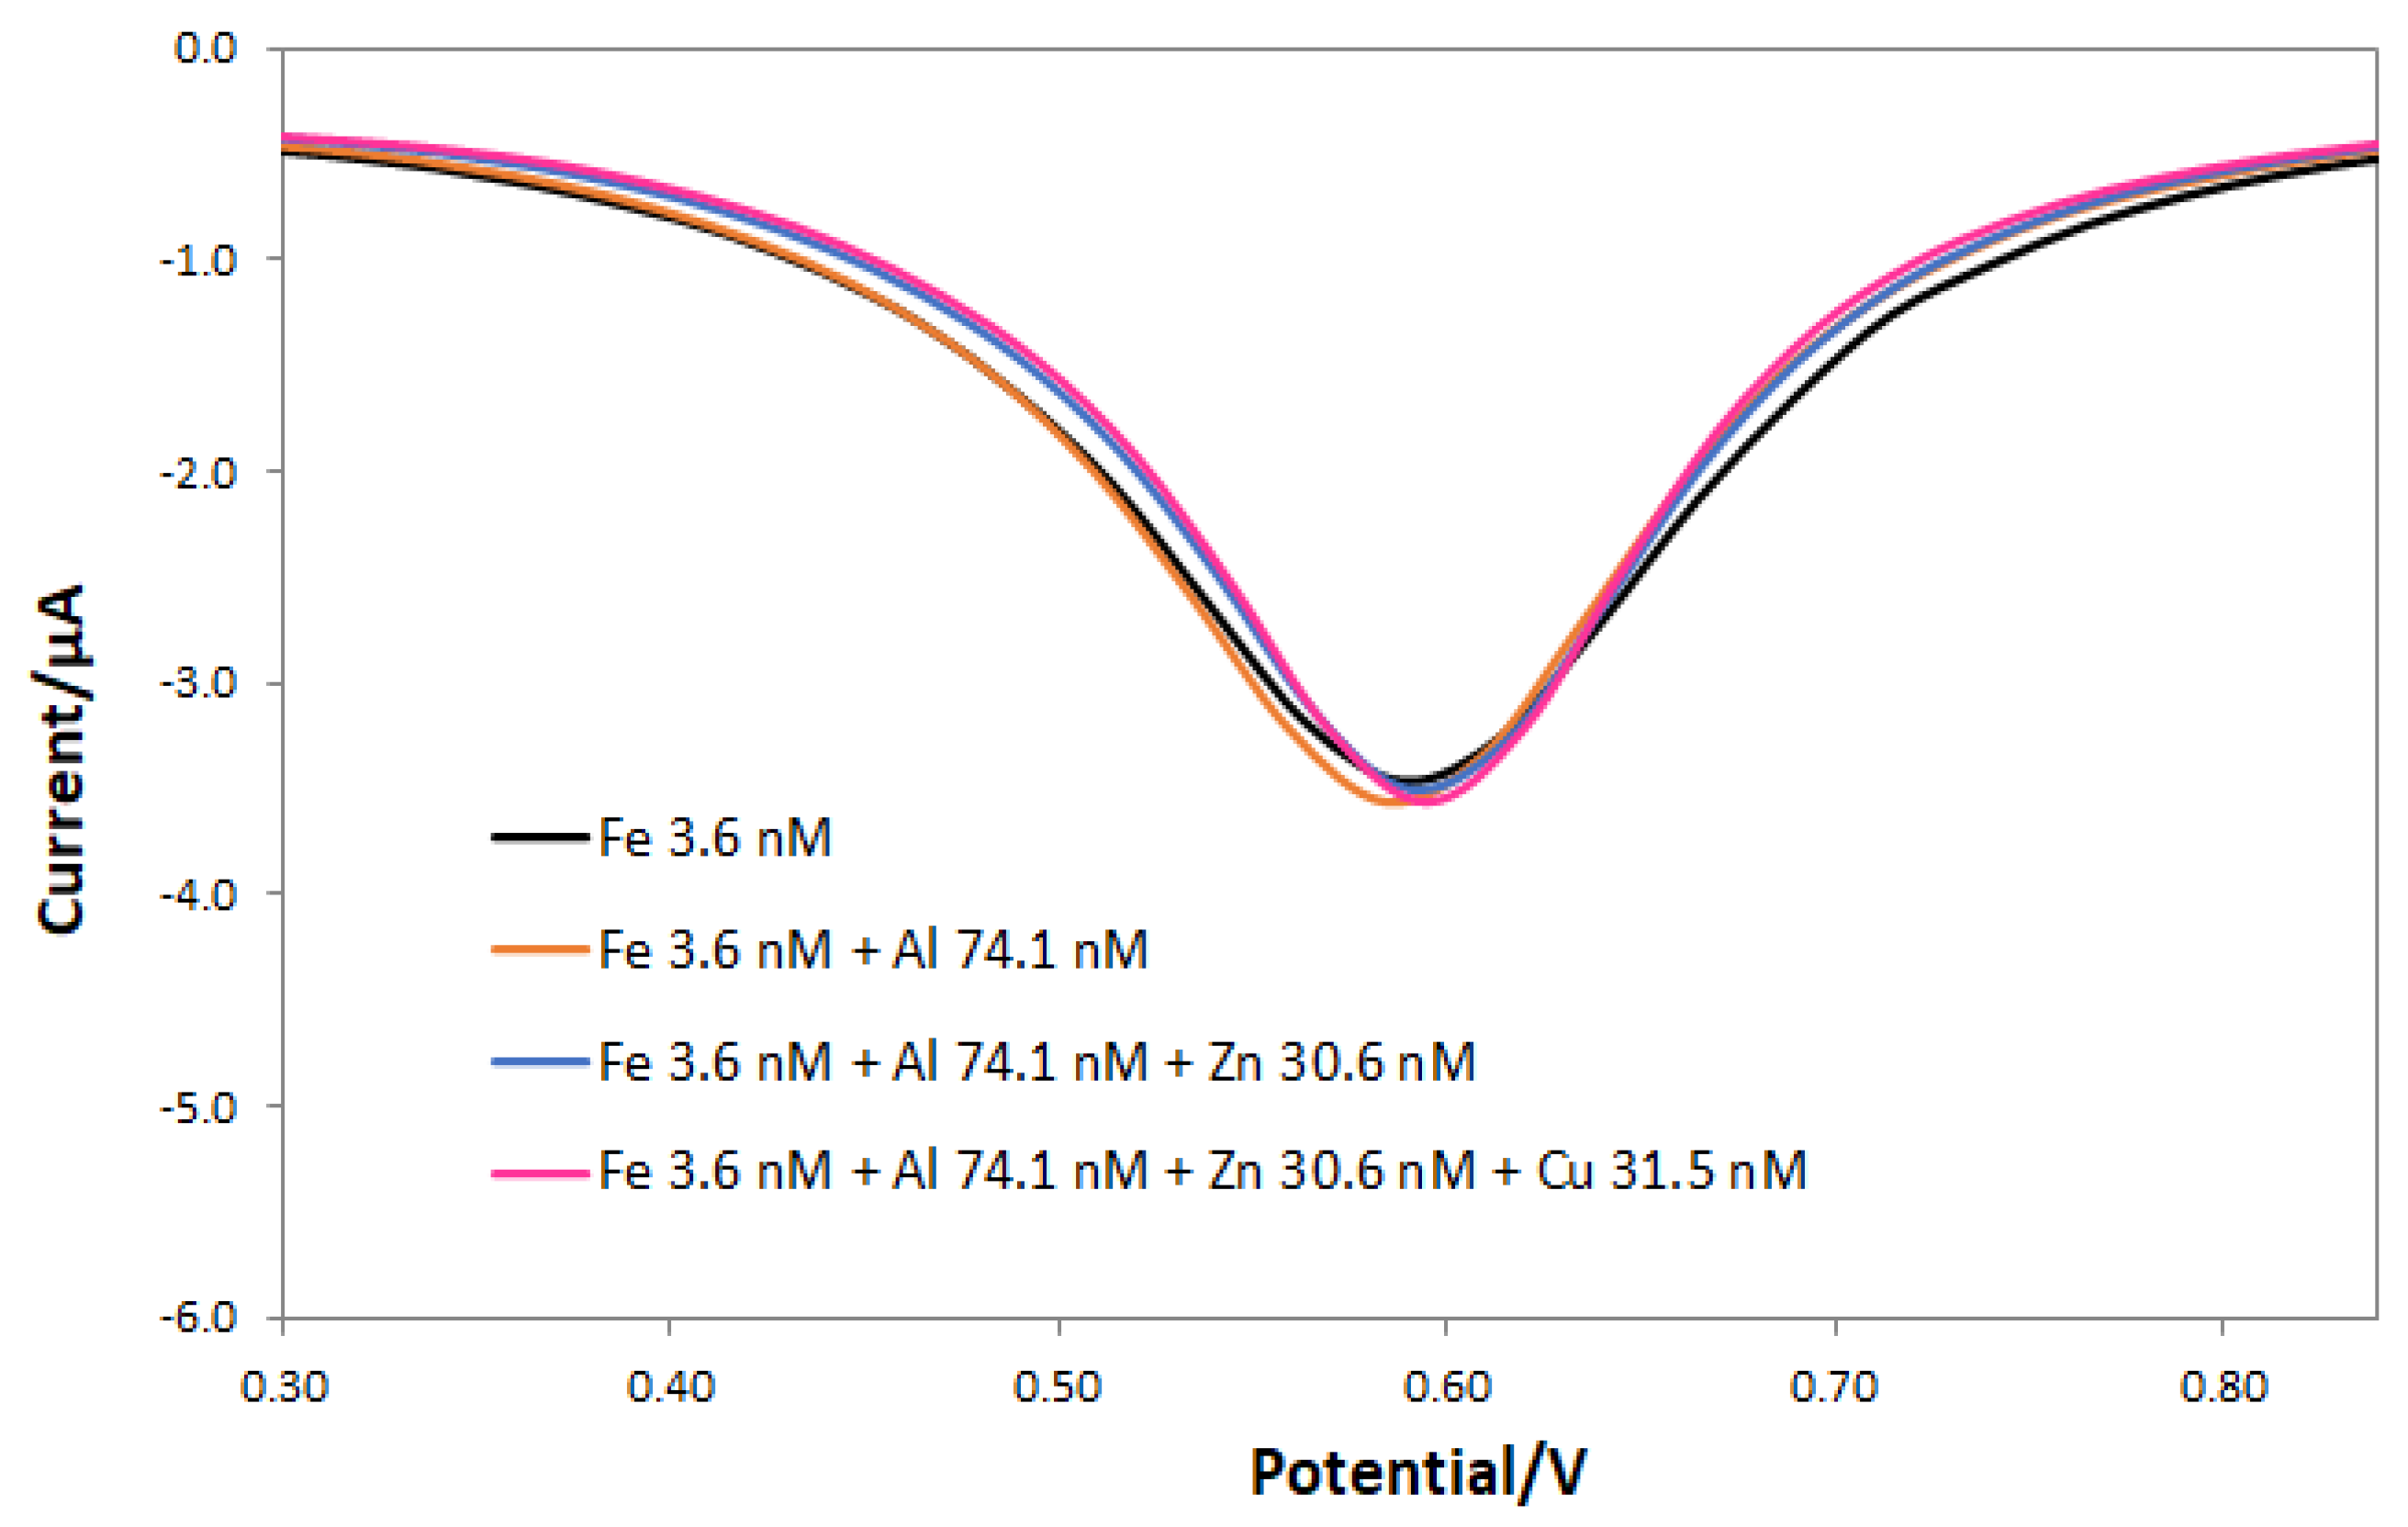
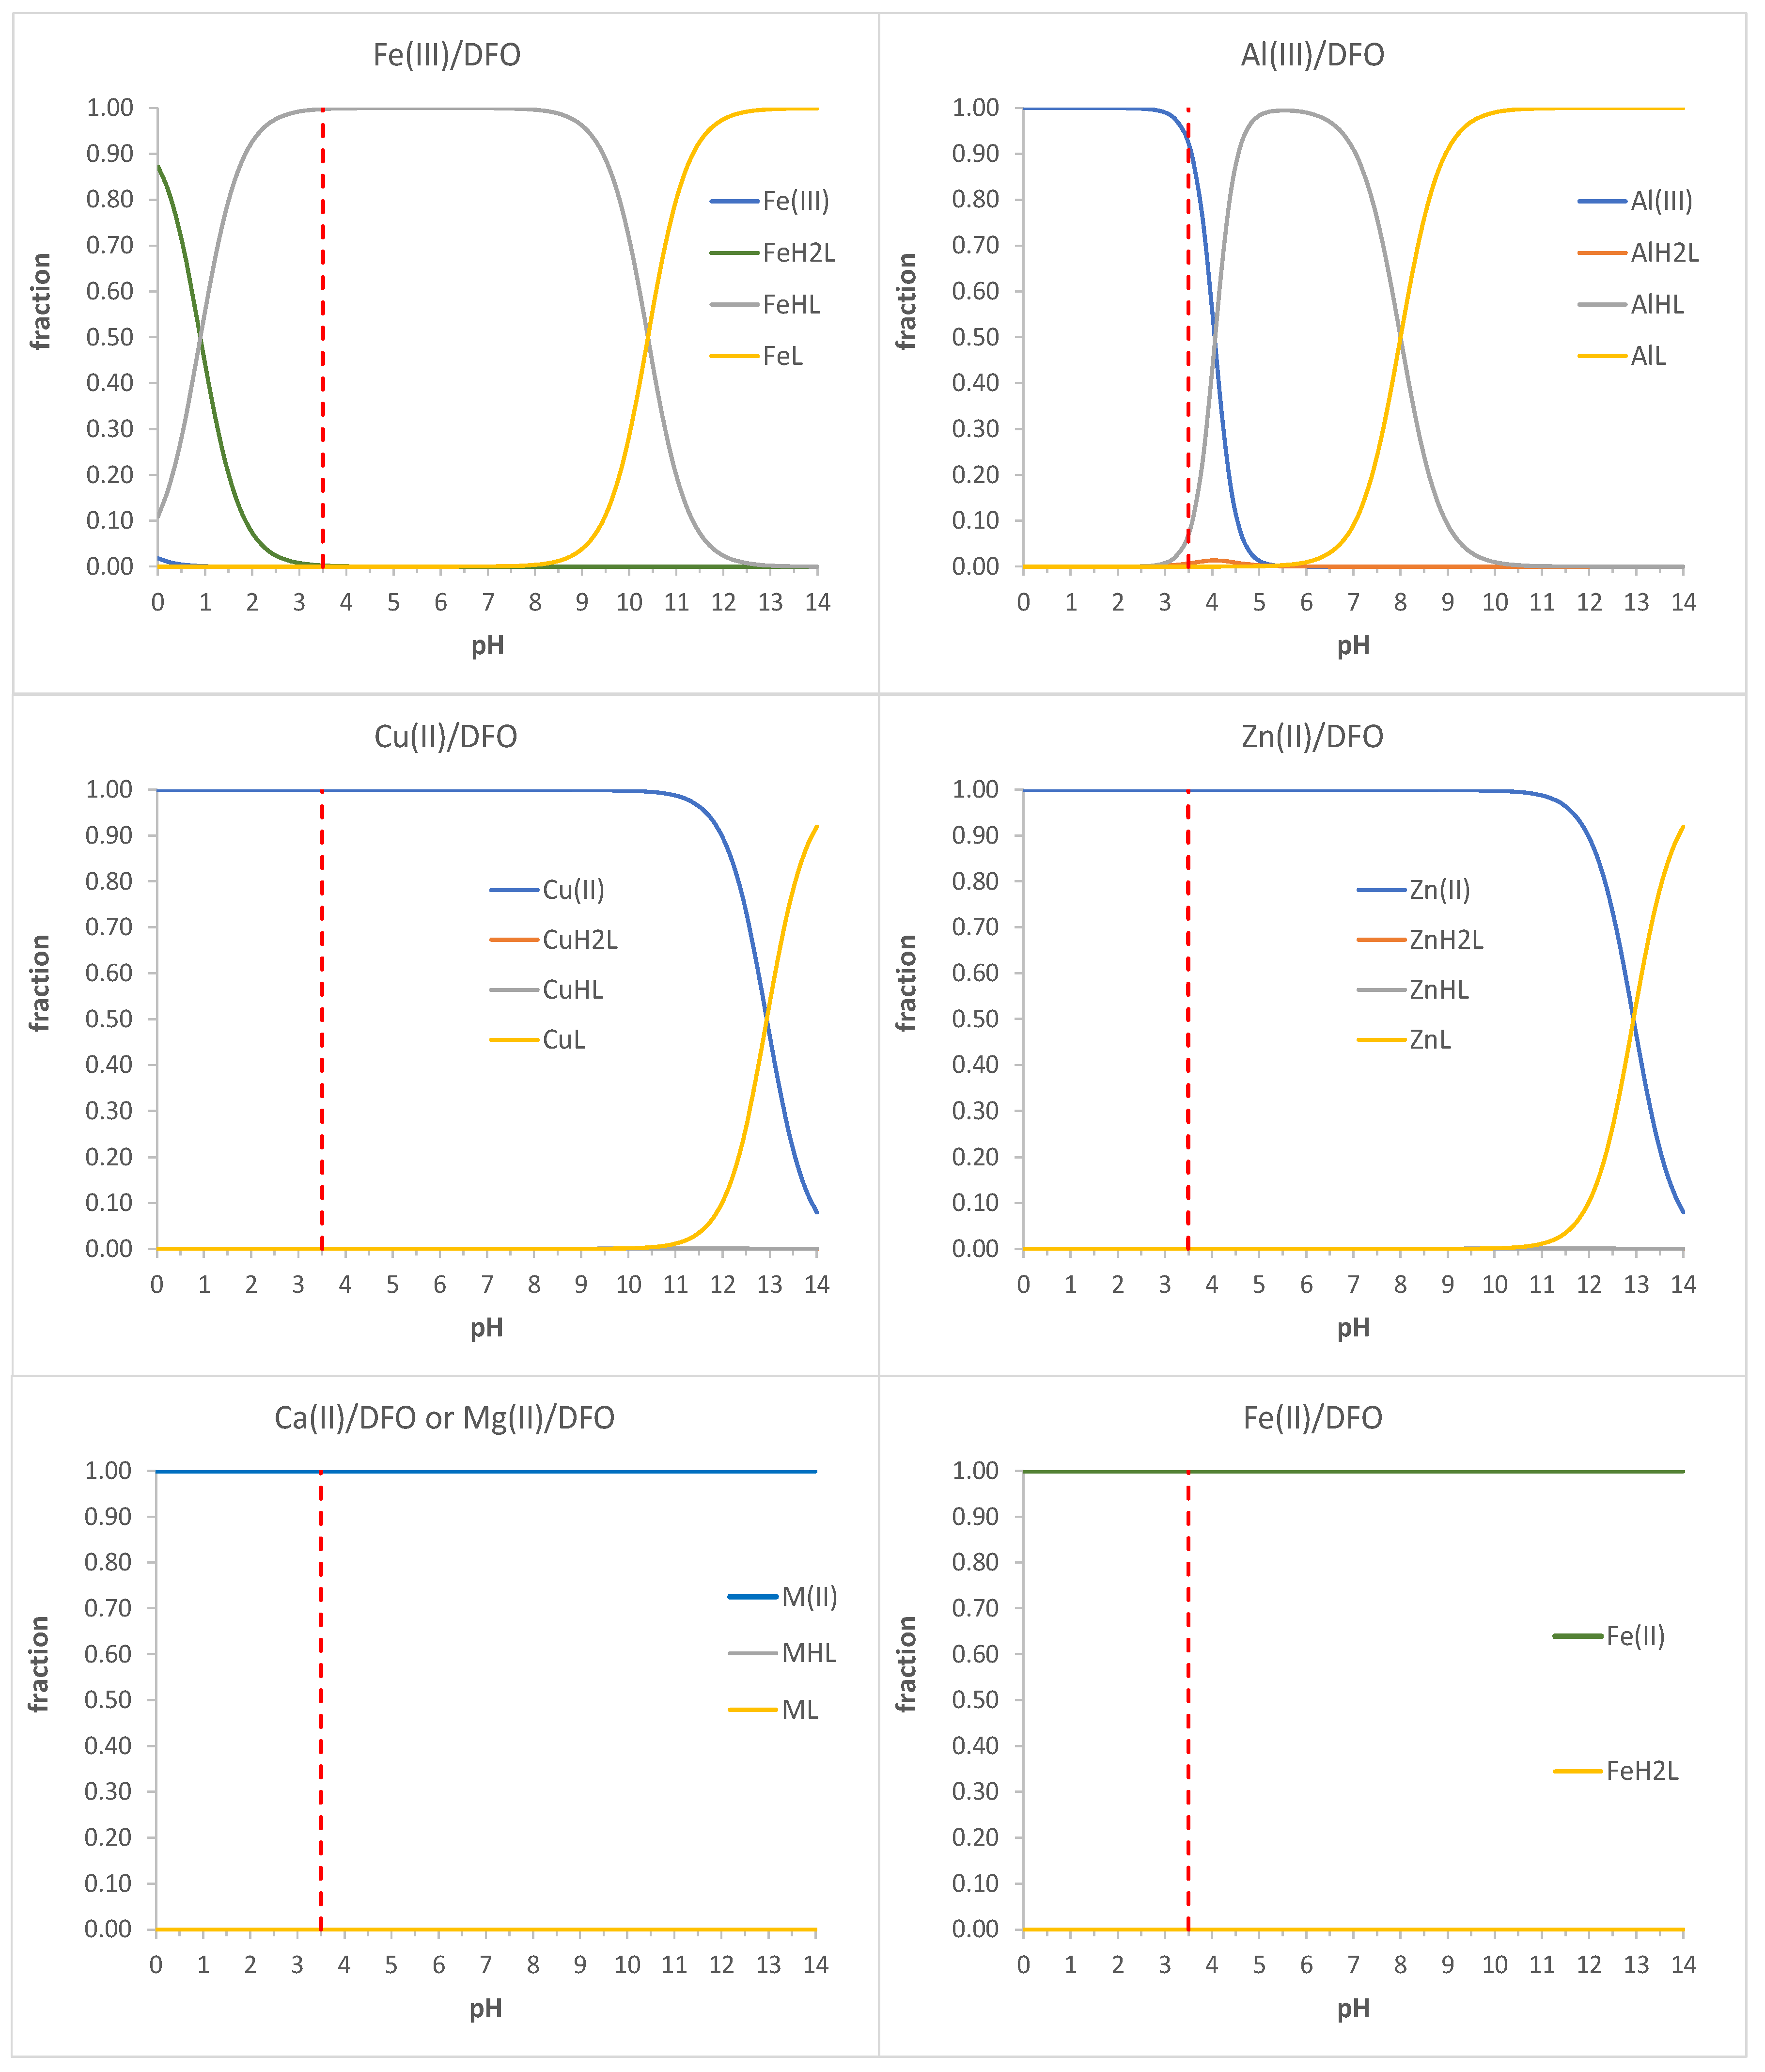
Figure 3 shows a scheme of the procedure.
The accumulation was carried out without applying a deposition potential since it is due to the complexation of Fe(III) with the DFO groups, and no other electrochemical reactions occur. The acid pH of the solution was necessary to avoid the formation of Fe(III) hydrolysis products and to obtain a less strong complexation from the deferoxamine groups. In other words, at higher pHs, a very stable Fe(III)/DFO complex can be formed, and the next electrochemical reduction step would require too negative potential and a long desorption time.
In the second step, the electrochemical reduction of the iron(III) preconcentrated on the electrode surface was obtained by differential pulse voltammetry (DPV) in acetate buffer 0.1 M at pH 3.5, scanning the potential from +0.9 V to −0.1 V vs. Ag/AgCl pseudoreference electrode. A cathodic current peak appeared of about +0.63 V due to the reduction of Fe(III) to Fe(II).
As an example, Figure 4 shows the DPV plot obtained for a calibration curve varying the Fe(III) concentration from 0 to 12 nM.
Since the screen-printed cells are disposable and, moreover, the removal of the thiol SAM would require electrochemical desorption in strong alkali or acid media, calibration curves were realized using different screen-printed cells all functionalized with the same procedure. The calibration curve in Figure 5 represents the average of the peak current values (absolute values, µA) vs. Fe(III) concentration (nM); error bars correspond to the standard deviation of the measurements performed with five electrodes. The following calibration equation was obtained (numbers in parenthesis are the standard deviations on the last digit):
|ip| = 0.421(8) · [Fe(III)] − 0.47(6)   R2 = 0.997
As can be seen from the graph, the linearity range is quite small, covering only one order of magnitude, but enough to determine Fe(III) at a very low concentration.
The limit of detection, computed as 3.3 times the standard deviation of the background on the slope of the calibration curve, is equal to 0.47(6) nM (26(3) ng/L).
Compared to other recently proposed electrochemical methods (see Table 2), the presented sensor enables the selective detection of only Fe (III) at the trace concentration level, using a simple functionalization procedure, low-cost apparatus adaptable for in situ measurement, and speciation analysis.

3.4. Interferences

Although it is now well known that deferoxamine forms very strong complexes with Fe(III), other cations normally present in real samples at relatively high concentrations could give interference problems.
For testing the selectivity of the method proposed here, the possible influence of Al(III), Zn(II), and Cu(II) were evaluated. In particular, the measurements were performed firstly for a Fe(III) solution of 0.2 µg/L (3.6 nM), and then after the addition of Al(III) 2 µg/L (74.1 nM), Zn(II) 2 µg/L (30.6 nM) and Cu(II) 2 µg/L (31.5 nM); the voltammogram was registered after each addition. As shown in Figure 6, the position and the intensity of the reduction peak did not change. Definitely, the Fe(III) determination was not affected by the presence of 10-fold of these cations.
A simulated tap water sample without Fe(III) was analyzed to further prove the selectivity. The metal-ions composition of this sample is reported in Table 3. The obtained solution was diluted 10-fold with HNO3 0.1 M and submitted to the whole procedure to construct the calibration curve (2 min accumulation in HNO3 solution at pH 1, and DPV measurement in 0.1 M acetate buffer at pH 3.5 containing 0.1 M NaClO4 as a supporting electrolyte). Figure 7 shows the results obtained. As can be seen, the slope of the line interpolating the experimental points is equal to 0.405(8) µA/nM, very close to the value obtained for the calibration curves with solutions of only Fe(III).
The absence of interference effects is due to the highest affinity of DFO for Fe(III) compared to the other cations here investigated at the pH of the medium used for both accumulation and analysis. As can be observed in Figure 8, the distribution graphs for the cations/DFO complexes highlight the predominance of the specie FeHL+ at pH 3.5, while all other divalent cations at the same pH are present in solution as free metal-ion specie, and only the complex AlHL+ is partially formed (of about 10%). Moreover, at the pH of the accumulation step (pH 1), only Fe can be complexed by DFO. Figure 8 also shows the distribution diagram for the system Fe(II)/DFO as a demonstration that at pH 3.5, when the reduction of the iron(III) occurs, the cation Fe2+ does not give interference or decrease the detection signal since it cannot be complexed by deferoxamine.

3.5. Fe(III) Determination in a Tap Water Sample

A tap water sample was drawn from the laboratory sink to test the sensor on a real matrix.
The iron(III) content determined by ICP-OES analysis was 17(5) µg/L (0.30(9) µM); therefore, to perform the voltammetric measurement, it was necessary to dilute 100 times the sample with ultrapure water.
For quantification, the method of standard additions was carried out. The determination was made in triplicate with three different screen-printed cells functionalized by the same procedure. The concentration of Fe(III) in the original sample, expressed as the mean of the values obtained with the three electrodes, was 18(6) µg/L (0.3(1) µm), not significantly different from that obtained by ICP-OES.

4. Conclusions

A completely screen-printed cell with the gold surface of the working electrode covered with a SAM of mercaptopropionic acid, functionalized with deferoxamine, for voltammetric detection of Fe(III), was presented.
The ability of the functionalized gold electrode for Fe(III) sensing was proved by using DPV measurements. The method’s advantages are the simple procedure, low consumption of reagents, the very low detection limit of about 0.5 nM, and good precision.
The working electrode’s surface was characterized, before and after functionalization, by two electrochemical approaches aiming to determine surface properties such as the area and the double-layer capacitance. The area after functionalization with deferoxamine; was lower than that of the bare electrode. This experimental evidence can be justified considering that the monolayer of deferoxamine above the working electrode reduces the electronic transfer capacity of gold. The capacitance of the double layer increased from the bare electrode to the functionalized one; this means that the presence of the deferoxamine monolayer increased the ability to accumulate electrical charges to the electrode and, therefore, there was an increase in the sensor efficiency.
The selectivity tests demonstrated that many inorganic cations do not give interference, thanks to the highest affinity of DFO for Fe(III) compared to other cations.
The results obtained analyzing a tap water sample did not significantly differ from those achieved by ICP-OES, so they were promising for a future application of the method to environmental and biological samples at low iron(III) content.

Author Contributions

Conceptualization, G.A.; methodology, G.A. and S.R.; investigation, S.R. and C.Z.; writing—original draft preparation, G.A. and S.R.; writing—review and editing, C.Z., R.B. and L.R.M. All authors have read and agreed to the published version of the manuscript.

Funding

This research received no external funding.

Institutional Review Board Statement

Not applicable.

Informed Consent Statement

Not applicable.

Data Availability Statement

Not applicable.

Acknowledgments

We thank MIUR for funding Lisa Rita Magnaghi’s and Camilla Zanoni’s grants.

Conflicts of Interest

The authors declare no conflict of interest.

References

  1. Keberle, H. The Biochemistry of Desferrioxamine and its Relation to Iron Metabolism. Ann. N.Y. Acad. Sci. 1964, 119, 758–768. [Google Scholar] [CrossRef]
  2. Faa, G.; Crisponi, G. Iron chelating agents in clinical practice. Coord. Chem. Rev. 1999, 184, 291–310. [Google Scholar] [CrossRef]
  3. Velasquez, J.; Wray, A.A. Deferoxamine In StatPearls; StatPearls Publishing LLC.: Treasure Island, FL, USA. Available online: https://0-www-ncbi-nlm-nih-gov.brum.beds.ac.uk/books/NBK557654/ (accessed on 4 April 2022).
  4. Whitten, C.F.; Gibson, G.W.; Good, M.H.; Goodwin, J.F.; Brough, A.J. Studies in Acute Iron Poisoning. I. Desferrioxamine in the Treatment of Acute Iron Poisoning: Clinical Observations, Experimental Studies, and Theoretical Considerations. Pediatrics 1965, 36, 322–335. [Google Scholar] [CrossRef] [PubMed]
  5. Olivieri, N.F. Long-Term Therapy with Deferiprone. Acta Haematol. 1996, 95, 37–48. [Google Scholar] [CrossRef] [PubMed]
  6. Brittenham, G.M. Development of Iron-Chelating Agents for Clinical Use. Blood 1992, 80, 569–574. [Google Scholar] [CrossRef] [Green Version]
  7. Olivieri, N.; Freedman, M.; Koren, G.; Hermann, C.; Bentur, Y.; Chung, D.; Klein, J.; Louis, P.S.; Templeton, D.; McClelland, R. Comparison of oral iron chelator L1 and desferrioxamine in iron-loaded patients. Lancet 1990, 336, 1275–1279. [Google Scholar] [CrossRef]
  8. Liu, J.; Obando, D.; Schipanski, L.G.; Groebler, L.K.; Witting, P.K.; Kalinowski, D.S.; Richardson, D.R.; Codd, R. Conjugates of Desferrioxamine B (DFOB) with Derivatives of Adamantane or with Orally Available Chelators as Potential Agents for Treating Iron Overload. J. Med. Chem. 2010, 53, 1370–1382. [Google Scholar] [CrossRef] [PubMed]
  9. Wang, Y.; Liu, Z.; Lin, T.M.; Chanana, S.; Xiong, M.P. Nanogel−DFO conjugates as a model to investigate pharmacokinetics, biodistribution, and iron chelation in vivo. Int. J. Pharm. 2018, 538, 79–86. [Google Scholar] [CrossRef]
  10. Li, H.; Luo, B.; Wen, W.; Zhou, C.; Tian, L.; Ramakrishna, S. Deferoxamine immobilized poly(D,L−lactide) membrane via polydopamine adhesive coating: The influence on mouse embryoosteoblast precursor cells and human umbilical vein endothelial cells. Mater. Sci. Eng. C 2017, 70, 701–709. [Google Scholar] [CrossRef]
  11. Biesuz, R.; Emma, G.; Milanese, C.; Dacarro, G.; Taglietti, A.; Nurchi, V.M.; Alberti, G. Novel DFO−SAM on mesoporous silica for iron sensing. Part I. Synthesis optimization and characterization of the material. Analyst 2014, 139, 3932–3939. [Google Scholar] [CrossRef] [PubMed] [Green Version]
  12. Alberti, G.; Emma, G.; Colleoni, R.; Pesavento, M.; Nurchi, V.M.; Biesuz, R. Novel DFO−functionalized mesoporous silica for iron sensing. Part 2. Experimental detection of free iron concentration (pFe) in urine samples. Analyst 2014, 139, 3940–3948. [Google Scholar] [CrossRef] [Green Version]
  13. Alberti, G.; Quattrini, F.; Colleoni, R.; Nurchi, V.M.; Biesuz, R. Deferoxamine−paper for iron(III) and vanadium(V) sensing. Chem. Pap. 2015, 69, 1024–1032. [Google Scholar] [CrossRef]
  14. Yehuda, Z.; Hadar, Y.; Chen, Y. Immobilization of Fe Chelators on Sepharose Gel and Its Effect on Their Chemical Properties. J. Agric. Food Chem. 2003, 51, 5996–6005. [Google Scholar] [CrossRef] [PubMed]
  15. Alberti, G.; Zanoni, C.; Magnaghi, L.R.; Santos, M.A.; Nurchi, V.M.; Biesuz, R. DFO@EVOH and 3,4-HP@EVOH: Towards New Polymeric Sorbents for Iron(III). Chemosensors 2020, 8, 111. [Google Scholar] [CrossRef]
  16. Pawlaczyk, M.; Schroeder, G. Deferoxamine-Modified Hybrid Materials for Direct Chelation of Fe(III) Ions from Aqueous Solutions and Indication of the Competitiveness of In Vitro Complexing toward a Biological System. ACS Omega 2021, 6, 15168–15181. [Google Scholar] [CrossRef] [PubMed]
  17. Su, B.-L.; Moniotte, N.; Nivarlet, N.; Tian, G.; Desmet, J. Design and synthesis of fluorescence-based siderophore sensor molecules for FeIII ion determination. Pure Appl. Chem. 2010, 82, 2199–2216. [Google Scholar] [CrossRef]
  18. Galinetto, P.; Taglietti, A.; Pasotti, L.; Pallavicini, P.; Dacarro, G.; Giulotto, E.; Grandi, M.S. SERS Activity of Silver Nanoparticles Functionalized with A Desferrioxamine B Derived Ligand for Fe(III) Binding and Sensing. J. Appl. Spectrosc. 2016, 82, 1052–1059. [Google Scholar] [CrossRef]
  19. Cennamo, N.; Alberti, G.; Pesavento, M.; D’Agostino, G.; Quattrini, F.; Biesuz, R.; Zeni, L. A Simple Small Size and Low Cost Sensor Based on Surface Plasmon Resonance for Selective Detection of Fe(III). Sensors 2014, 14, 4657–4671. [Google Scholar] [CrossRef]
  20. Norocel, L.; Gutt, G. Development and performance testing of an electrochemical sensor for determination of iron ions in wine. Aust. J. Grape Wine Res. 2019, 25, 161–164. [Google Scholar] [CrossRef]
  21. Shervedani, R.K.; Akrami, Z. Gold-deferrioxamine nanometric interface for selective recognition of Fe(III) using square wave voltammetry and electrochemical impedance spectroscopy methods. Biosens. Bioelectron. 2013, 39, 31–36. [Google Scholar] [CrossRef]
  22. Shervedani, R.K.; Garavand, S.; Samiei Foroushani, M.; Yaghoobi, F. Electrochemical determination of Ga(III) through formation of Ga(III)-deferrioxamine B nanostructures on the glassy carbon electrode surface. Talanta 2016, 149, 194–201. [Google Scholar] [CrossRef]
  23. See, W.P.; Heng, L.Y.; Nathan, S. Highly Sensitive Aluminium(III) Ion Sensor Based on a Self-assembled Monolayer on a Gold Nanoparticles Modified Screen-printed Carbon Electrode. Anal. Sci. 2015, 31, 997–1003. [Google Scholar] [CrossRef] [PubMed] [Green Version]
  24. Ulman, A. Formation and Structure of Self-Assembled Monolayers. Chem. Rev. 1996, 96, 1533–1554. [Google Scholar] [CrossRef] [PubMed]
  25. Mirsky, V.M. New electroanalytical applications of self-assembled monolayers. TrAC—Trends Anal. Chem. 2002, 21, 439–450. [Google Scholar] [CrossRef]
  26. Ali, T.A.; Abd-Elaal, A.A.; Mohamed, G.G. Screen printed ion selective electrodes based on self-assembled thiol surfactant-gold-nanoparticles for determination of Cu (II) in different water samples. Microchem. J. 2021, 160, 105693. [Google Scholar] [CrossRef]
  27. Ferreira, D.C.; Batistuti, M.R.; Junior, B.B.; Mulato, M. Aptasensor based on screen-printed electrode for breast cancer detection in undiluted human serum. Bioelectrochemistry 2021, 137, 107586. [Google Scholar] [CrossRef]
  28. Kochana, J.; Starzec, K.; Wieczorek, M.; Knihnicki, P.; Góra, M.; Rokicińska, A.; Kuśtrowski, P. Study on self-assembled monolayer of functionalized thiol on gold electrode forming capacitive sensor for chromium (VI) determination. J. Solid State Electrochem. 2019, 23, 1463–1472. [Google Scholar] [CrossRef] [Green Version]
  29. Koç, Y.; Moralı, U.; Erol, S.; Avci, H. Electrochemical investigation of gold based screen printed electrodes: An application for a seafood toxin detection. Electroanalysis 2021, 33, 1033–1048. [Google Scholar] [CrossRef]
  30. McCormick, W.; McDonagh, P.; Doran, J.; McCrudden, D. Covalent Immobilisation of a Nanoporous Platinum Film onto a Gold Screen-Printed Electrode for Highly Stable and Selective Non-Enzymatic Glucose Sensing. Catalysts 2021, 11, 1161. [Google Scholar] [CrossRef]
  31. Cimafonte, M.; Fulgione, A.; Gaglione, R.; Papaianni, M.; Capparelli, R.; Arciello, A.; Bolletti Censi, S.; Borriello, G.; Velotta, R.; Della Ventura, B. Screen Printed Based Impedimetric Immunosensor for Rapid Detection of Escherichia coli in Drinking Water. Sensors 2020, 20, 274. [Google Scholar] [CrossRef] [Green Version]
  32. Sánchez-Paniagua, M.; Palenzuela-Batista, S.; Manzanares-Palenzuela, C.L.; López-Ruiz, B. Electrochemical genosensor for Klotho detection based on aliphatic and aromatic thiols self-assembled monolayers. Talanta 2020, 212, 120735. [Google Scholar] [CrossRef] [PubMed]
  33. Cevik, E. High sensitive detection of prostate specific antigen by using ferrocene cored asymmetric PAMAM dendrimer interface screen printed electrodes. Electroanalysis 2019, 31, 31–39. [Google Scholar] [CrossRef] [Green Version]
  34. Etorki, A.M.; Awin, L.A.; El-Rais, M.; Elhabbat, M.S.; Shaban, I.S. Application of gold nanoparticles with 1, 6-Hexanedithiol modified screen-printed carbon electrode as a sensor for determination of arsenic in environmental samples. Sens. Lett. 2019, 17, 762–768. [Google Scholar] [CrossRef]
  35. Białobrzeska, W.; Firganek, D.; Czerkies, M.; Lipniacki, T.; Skwarecka, M.; Dziąbowska, K.; Cebula, Z.; Malinowska, N.; Bigus, D.; Bięga, E.; et al. Electrochemical Immunosensors Based on Screen-Printed Gold and Glassy Carbon Electrodes: Comparison of Performance for Respiratory Syncytial Virus Detection. Biosensors 2020, 10, 175. [Google Scholar] [CrossRef]
  36. Kuddusi, K. Modification of screen-printed gold electrode with 1,4-dithiothreitol: Application to sensitive voltammetric determination of Sudan II. Food Qual. Saf. 2021, 5, fyaa039. [Google Scholar]
  37. Cordeiro, T.A.; Gonçalves, M.V.; Franco, D.L.; Reis, A.B.; Martins, H.R.; Ferreira, L.F. Label-free electrochemical impedance immunosensor based on modified screen-printed gold electrodes for the diagnosis of canine visceral leishmaniasis. Talanta 2019, 195, 327–332. [Google Scholar] [CrossRef] [PubMed]
  38. Burak, D.; Emregul, E.; Emregul, K.C. Copper–Zinc Alloy Nanoparticle Based Enzyme-Free Superoxide Radical Sensing on a Screen-Printed Electrode. Talanta 2015, 134, 206–214. [Google Scholar]
  39. Pesavento, M.; Merli, D.; Biesuz, R.; Alberti, G.; Marchetti, S.; Milanese, C. A MIP-based low-cost electrochemical sensor for 2-furaldehyde detection in beverages. Anal. Chim. Acta 2021, 1142, 201–210. [Google Scholar] [CrossRef]
  40. Chemometric Agile Tool (CAT). Available online: http://www.gruppochemiometria.it/index.php/software/19-download-the-rbased-chemometric-software (accessed on 9 July 2021).
  41. Douglass, E.F., Jr.; Driscoll, P.F.; Liu, D.; Burnham, N.A.; Lambert, C.R.; McGimpsey, W.G. Effect of electrode roughness on the capacitive behavior of self-assembled monolayers. Anal. Chem. 2008, 80, 7670–7677. [Google Scholar] [CrossRef] [PubMed]
  42. García-Raya, D.; Madueño, R.; Sevilla, J.M.; Blázquez, M.; Pineda, T. Electrochemical characterization of a 1,8-octanedithiol self-assembled monolayer (ODT-SAM) on a Au (1 1 1) single crystal electrode. Electrochim. Acta 2008, 53, 8026–8033. [Google Scholar] [CrossRef]
  43. Nguyen, L.D.; Huynh, T.M.; Nguyen, T.S.V.; Le, D.N.; Baptist, R.; Doan, T.C.D.; Dang, C.M. Nafion/platinum modified electrode-on-chip for the electrochemical detection of trace iron in natural water. J. Electroanal. Chem. 2020, 873, 114396. [Google Scholar] [CrossRef]
  44. Nguyen, L.D.; Doan, T.C.D.; Huynh, T.M.; Dang, D.M.T.; Dang, C.M. Thermally reduced graphene/nafion modified platinum disk electrode for trace level electrochemical detection of iron. Microchem. J. 2021, 169, 106627. [Google Scholar] [CrossRef]
  45. Nguyen, L.D.; Nguyen, T.S.V.; Huynh, T.M.; Baptist, R.; Doan, T.C.D.; Dang, C.M. Voltammetric determination of iron (III) using sputtered platinum thin film. Electrochim. Acta 2019, 320, 134607. [Google Scholar] [CrossRef]
  46. Lin, M.; Pan, D.; Hu, X.; Han, H.; Li, F. Titanium carbide nanoparticles/ion-exchange polymer-based sensor for catalytic stripping determination of trace iron in coastal waters. Sens. Actuators B Chem. 2015, 219, 164–170. [Google Scholar] [CrossRef]
  47. Han, H.; Pan, D.; Pan, F.; Hu, X.; Zhu, R. A functional micro-needle sensor for voltammetric determination of iron in coastal waters. Sens. Actuators B Chem. 2021, 327, 128883. [Google Scholar] [CrossRef]
  48. Lin, M.; Han, H.; Pan, D.; Zhang, H.; Su, Z. Voltammetric determination of total dissolved iron in coastal waters using a glassy carbon electrode modified with reduced graphene oxide, Methylene Blue and gold nanoparticles. Microchim. Acta 2015, 182, 805–813. [Google Scholar] [CrossRef]
  49. Zhu, Y.; Pan, D.; Hu, X.; Han, H.; Lin, M.; Wang, C. An electrochemical sensor based on reduced graphene oxide/gold nanoparticles modified electrode for determination of iron in coastal waters. Sens. Actuators B Chem. 2017, 243, 1–7. [Google Scholar] [CrossRef]
  50. Bellotti, D.; Remelli, M. Deferoxamine B: A Natural, Excellent and Versatile Metal Chelator. Molecules 2021, 26, 3255. [Google Scholar] [CrossRef] [PubMed]
Figure 1. Experimental design to optimize the reaction times of the two functionalization steps of the working gold electrode: coefficients plot. The greatest values and little black stars (regardless of the sign) may suggest a significant influence of the respective parameter or interaction.
Chemosensors 10 00214 g001
Figure 2. Experimental design to optimize the reaction times of the two Figure 2. the best answers (i.e., highest current peak) were obtained when t2 was taken to its level −1 (90 min) while t3 to the level +1 (120 min).
Chemosensors 10 00214 g002
Figure 3. Schematic representation of Fe(III) determination procedure by Scheme 1. min, the quantity of iron(III) reaching the electrode surface is small, and only after immersion in solutions at high Fe(III) content, a signal significantly different to that of the background appeared. Otherwise, if selecting a longer accumulation time (higher than 5 min), a saturation of the DFO sites of the monolayer occurred. After different trials, the time selected was two minutes, which is a good compromise to obtain significant current peaks also for Fe(III) solutions at nM levels and pretty good linearity of the dose/response curve.
Chemosensors 10 00214 g003
Figure 4. DPV plot obtained on the gold working electrode functionalized with DFO after immersion in Fe(III) standard solutions at pH 1 (from 0 to 12 nM); DPV measurements were performed in 0.1 M acetate buffer at pH 3.5 containing 0.1 M NaClO4 as a supporting electrolyte. Electrochemical conditions were: start potential +0.9 V, end potential −0.1 V, scan rate 100 mV/s, pulse amplitude 50 mV, pulse time 0.04 s.
Chemosensors 10 00214 g004
Figure 5. Calibration curve for Fe(III) determination by DPV. The procedure and conditions are described in the text and caption of Figure 4. Each point is the average value of measurements obtained with five different screen-printed cells. Error bars correspond to the standard deviation of the measurements performed with five electrodes.
Chemosensors 10 00214 g005
Figure 6. DPV plot obtained on the gold working electrode functionalized with DFO after immersion in (1) solution of Fe(III) 3.6 nM at pH 1 (black line), (2) solution of Fe(III) 3.6 nM and Al(III) 74.1 nM at pH 1 (orange line), (3) solution of Fe(III) 3.6 nM, Al(III) 74.1 nM, and Zn(II) 30.6 nM at pH 1 (blue line), (4) solution of Fe(III) 3.6 nM, Al(III) 74.1 nM, Zn 30.6 nM and Cu(II) 31.5 nM at pH 1 (pink line); DPV measurements were performed in 0.1 M acetate buffer at pH 3.5 containing 0.1 M NaClO4 as a supporting electrolyte. Electrochemical conditions were: start potential +0.9 V, end potential −0.1 V, scan rate 100 mV/s, pulse amplitude 50 mV, pulse time 0.04 s.
Chemosensors 10 00214 g006
Figure 7. DPV plot obtained on the gold working electrode functionalized with DFO after immersion in simulated tap water sample diluted 10-fold with nitric acid solutions at pH 1. Addition of Fe(III) from 0 to 7 nM. The calibration curve is reported as inset. The procedure and conditions are described in the text and caption of Figure 4.
Chemosensors 10 00214 g007
Figure 8. Distribution diagrams for the systems Fe(III)/DFO, Al(III)/DFO, Cu(II/DFO; Zn(II)/DFO, Ca(II)/DFO, Mg(II)/DFO, Fe(II)/DFO, at 25 °C and I = 0.1 M. Protonation and complexation constants obtained from ref. [50].
Chemosensors 10 00214 g008
Table 1. Full Factorial Design 22: level definitions for the parameters under investigation.
ParameterMinimum Level (−) Maximum Level (+)
Time second step (t2 min)90180
Time third step (t3 min)60120
Table 2. Comparison with some recent electrochemical methods.
Methods aElectrodes bLinear Range/
µg/L
LOD
/µg/L
Ref.
SWVNanostructured Pt/nafion1–2500.31[43]
SWVPt disck/thermally reduced graphene/nafion1–2000.08[44]
SWVThin-film Pt300–500090[45]
DPVGCE nano titanium carbide/nafion4–39200.4[46]
DPVMicro niddle electrode Au-nanoclustes/PEDOT-PSSc c0.55–2790.17[47]
DPVGCE/reduced graphene oxide/Methylene Blue/AuNPs16.7–55850.84[48]
DPVGCE/reduced graphene oxide/5-Br-PADAP d/AuNPs1.7–1680.20[49]
DPVAu screen-printed0.07–0.70.03This work
a Methods: SWV, Square Wave Voltammetry; DPV, Differential Pulse Voltammetry; b Electrodes: GCE, glassy carbon electrode; HDME, hanging drop mercury electrode; c PEDOT-PSS: poly(3,4-ethylenedioxythiophene)-poly(sodium 4-styrenesulfonate); d 5-Br-PADAP: 2-[(5-bromo-2-pyridinyl)azo]-5-(diethylamino)phenol.
Table 3. Cations’ content of the simulated tap water sample without iron(III).
CationNa(I)K(I)Ca(II)Mg(II)Zn(II)Al(III)
mg/L121.3428.50.0350.025
Publisher’s Note: MDPI stays neutral with regard to jurisdictional claims in published maps and institutional affiliations.

