
Dynamic Measurement of VOCs with Multiple Characteristic Peaks Based on Temperature Modulation of ZnO Gas Sensor


1
College of Information Science and Engineering, Northeastern University, Shenyang 110819, China
2
Hebei Key Laboratory of Micro-Nano Precision Optical Sensing and Measurement Technology, Qinhuangdao 066004, China
3
Key Laboratory of Data Analytics and Optimization for Smart Industry, Northeastern University, Ministry of Education, Shenyang 110819, China
*
Author to whom correspondence should be addressed.
†
These authors contributed equally to this work and should be regarded as co-first authors.
Chemosensors 2022, 10(6), 226; https://0-doi-org.brum.beds.ac.uk/10.3390/chemosensors10060226
Submission received: 10 May 2022
/
Revised: 28 May 2022
/
Accepted: 13 June 2022
/
Published: 15 June 2022
(This article belongs to the Special Issue Chemical Sensors for Volatile Organic Compound Detection)
Abstract
:Volatile organic compounds (VOC) harm human health seriously in the air. Therefore, it is essential to recognize VOC gases qualitatively and quantitatively. The dynamic measurement method can improve the selectivity of metal oxide semiconductor (MOS) gas sensors to VOC, but there is a problem of the insufficient number of characteristic peaks. From the experimental point of view, the primary judgment basis for the correct qualitative and quantitative recognition of VOC gases by the dynamic measurement method is the characteristic peak of the dynamic response signal. However, the traditional dynamic measurement method generally only has two characteristic peaks. In this experiment, the voltage was changed at the time of the second characteristic peak by controlling the constant dynamic response period. Taking ethyl alcohol as an example, the experimental results show that the characteristic peak of the dynamic response signal does not increase when the voltage is constant. However, a new characteristic peak will appear based on a continuously rising heating voltage. The characteristic peaks of the dynamic response of n-propyl alcohol, isopropyl alcohol, and n-butyl alcohol were also increased based on the rising heating voltage waveform. Based on the K-Nearest-Neighbors algorithm, the qualitative and quantitative recognition rate of the four alcohol homologue gases reached 100%.
1. Introduction
MOS gas sensors have been widely used in detecting VOCs gases. MOS gas sensors have some advantages, such as small size [1,2], high sensitivity [3,4,5,6], and simple fabrication [7]. At present, the detection method of VOCs gases by MOS gas sensor includes static measurement method [8,9,10,11] and dynamic measurement method. The types and concentrations of VOCs gases in the atmosphere are not single [12,13]. The heating voltage and power are unchanged in the static measurement method with time. The response signals are obtained at a specific heating temperature. The static response signals have little information and cross-sensitivity. The same current response value can be obtained with the different types and concentrations of VOC gases. So that it is difficult to recognize complex gas components correctly [14,15,16,17,18] under the static measurement method. The dynamic measurement method is to change the heating voltage and get the response signals at different temperatures. Iwata et al. indicate the heater waveform can obtain enhanced information on gas species [19]. The change in temperature is realized by changing the shape and voltage of the input cyclic heating waveforms [20]. Therefore, the dynamic measurement method not only needs to accurately measure the output dynamic response signal, but also needs to measure and record the cyclic heating waveforms. The dynamic measurement method expands the characteristic information in the time dimension, and the same sensor can be regarded as several different gas sensors at different temperatures, which solves the cross-sensitivity problem in the static measurement method. Hossein-Babaei et al. revealed that the dynamic response signal will present different characteristic peaks because the sensitive material will react with different types and concentrations of VOCs gases [21]. Bouricha et al. also detect methanol, toluene, acetone, isopropanol, and ethanol using a dynamic measurement method, which shows different responses [22]. As a result, different gases will have different output current curves under the same heating temperature curve because of the different sensitive responses of different gases at different temperatures, and the influence of the adsorption and desorption process, from which we can distinguish the types of gases. The amplitude of the output current curve has a concentration difference, so we can judge its concentration information by the amplitude. The dynamic response signals for different types and concentrations of VOCs gases are labeled as a sample. Through signal preprocessing and classification algorithms, the VOCs can be quantitatively and qualitatively recognized efficiently, rapidly, and accurately. The dynamic measurement method is significant to improve the selectivity of MOS gas sensor to various VOCs gases.
Based on the dynamic measurement method to improve gas selectivity mainly from two aspects. One is to optimize the late qualitative and quantitative recognition algorithm. Gaggiotti et al. recognize aldehydes (1-hexanal, 1-nonanal, trans-2-nonenal) from the other VOCs by the PCA [23]. Ji et al. adopt PCA weak separation with dynamic measurement to recognize VOCs gases [24]. The identification for different VOCs gases only reached 82% by GRNN [25]. Pan et al. proposed a lightweight network called multiscale convolutional neural network with attention (MCNA). The MCNA identifies ambient gases through signals of semiconductor gas sensor [26]. But the complexity of the algorithm is very high. The other is to increase the characteristic peaks of the dynamic response signal. The position and amplitude of characteristic peaks are the primary basis for qualitative and quantitative recognition of VOCs gases [22,25]. At present, the dynamic measurement method increases the number of characteristic peaks through a lot of exploratory experiments. The response reveals time is long, and the periodic cycle heating waveform is randomly selected. So, it is very challenging and accidental to optimize the characteristic peak of the dynamic response signals base on the traditional dynamic measurement method.
The unsaturated phenomenon was solved by a dynamic interval temperature modulation pattern in the paper [27]. The result revealed that the number of dynamic response signal characteristic peaks is only two under the experiment. As a result, the dynamic response signals of the four alcohol homologues are remarkably similar. The recognition rate of qualitative and quantitative is only 97.62%. Therefore, it is necessary to optimize the characteristic peak of dynamic response signals to improve the selectivity of which ZnO gas sensor to the VOCs gases.
In this paper, the experiments are carried out based on improving the conventional cyclic heating triangular wave to explore the optimization of characteristic peaks. Taking ethanol as an example, the same period of the cyclic heating triangular is applied. Firstly, the constant heating voltage is applied when the second characteristic peak of the response signal appears. After that, the heating voltage is continuously increased when the second characteristic peak appears. Then the experimental method was used to detect the other three alcohol homologue gases. The characteristic peaks of the dynamic response signal all are optimized. This paper provides an experimental idea and method to increase the number of characteristic peaks of the dynamic response signal.
2. Experiment
2.1. Synthesis of ZnO Nanomaterials
The hydrothermal method is one of the mainstream synthesis methods for metal oxide nanomaterial. Li et al. synthesized SnO2 microspheres by hydrothermal method which had high sensitivity for formaldehyde [28]. The α-MoO3@SnS2 nanosheets by hydrothermal method display a high response of 114.9 for 100 ppm TEA [29]. The nanomaterials are closely related to the experiment condition. Chu et al. investigated heating duration and the heating temperature on the gas-sensing properties of the sensors. It is found that the sensor based on MoO3 nanomaterial (200 °C, 4 h) exhibits the best performance [30]. The sensor-based on LaFeO3 (800 °C, 2 h) can detect trimethylamine [31]. So, the experiment needs to be accurately adjusted.
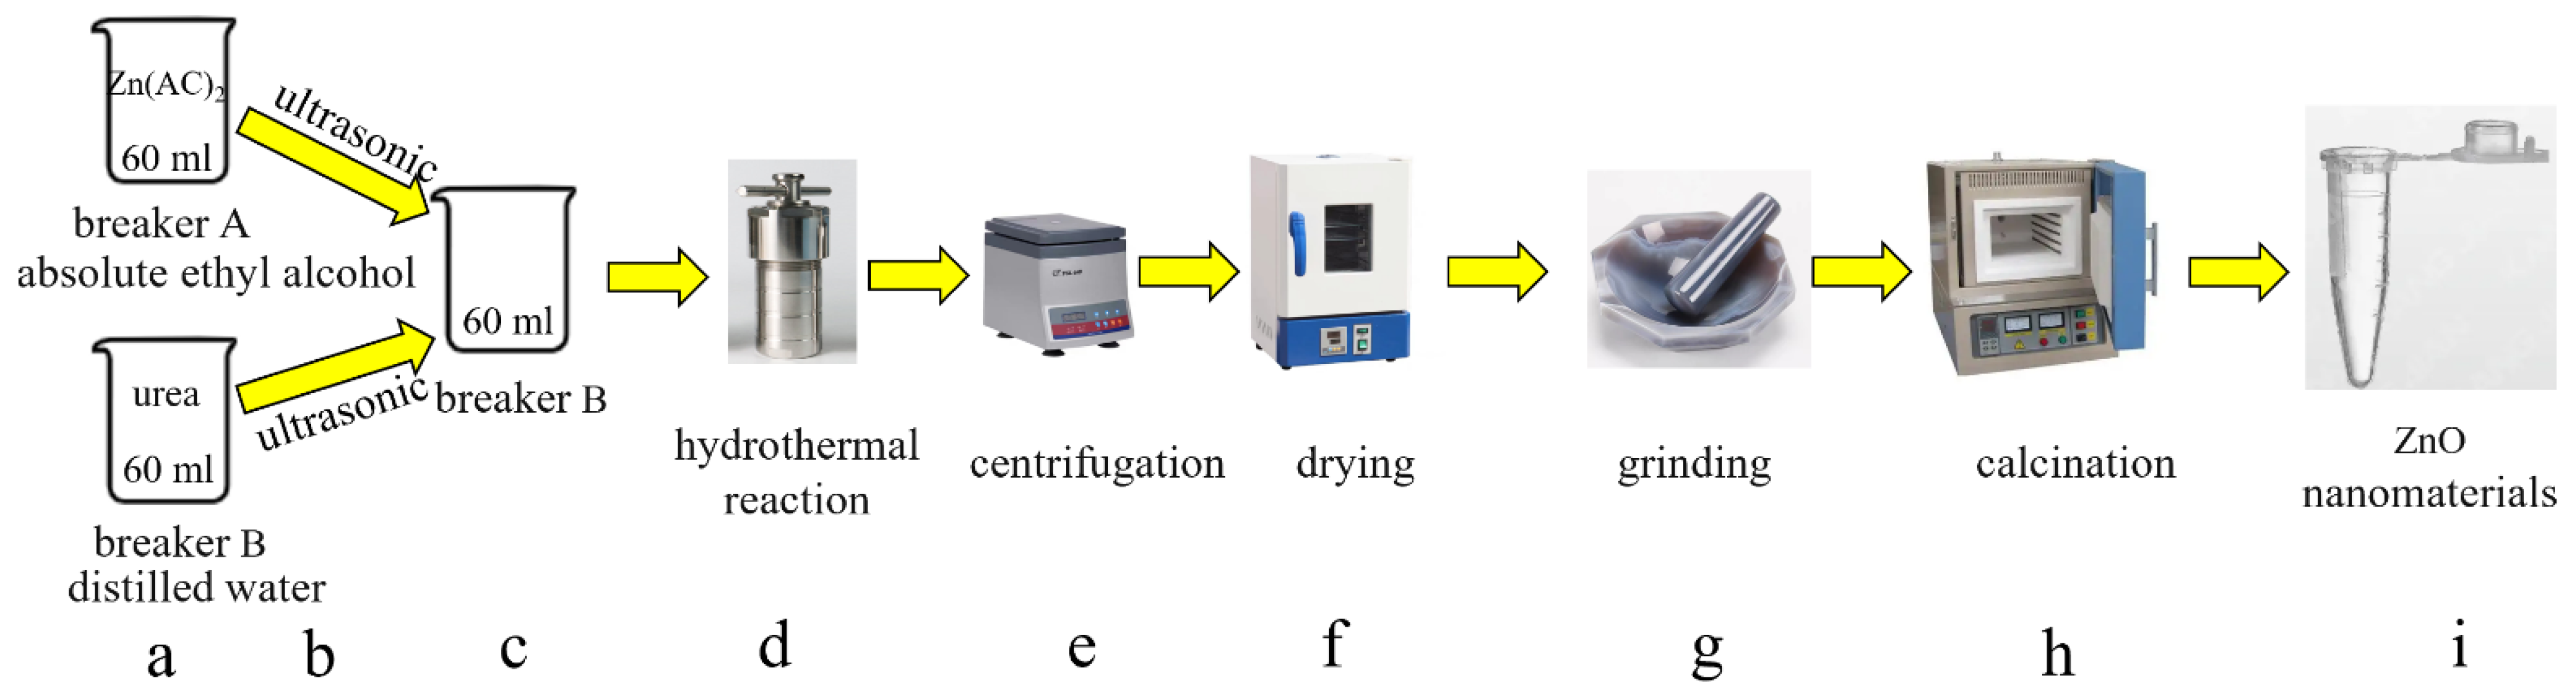
The synthesis of ZnO nanomaterials is shown in Figure 1. Zn(AC)2, absolute ethyl alcohol, urea, and other AR are purchased from Shanghai Aladdin Biochemical Technology Company Limited. The distilled water is generated by the ultrapure water machine provided by the Hefei intelligent Institute of the Chinese Academy of Sciences. All drugs are weighed by a precision analytical balance (ME155DU). The preparation of ZnO nanomaterials needs nine steps. Step A is to prepare solution. A total of 1.1 g Zn(AC)2 was dissolved in 30 mL absolute ethyl alcohol and placed in a 60 mL beaker A. A total of 0.6 g urea was dissolved in 30 mL distilled water and placed in a 60 mL beaker B. Step B is ultrasound. Both standard solutions were ultrasonic for 15 min to clarify the solution. The purpose of ultrasound is to allow sufficient dissolution of Zn(AC)2 in absolute ethyl alcohol and urea in distilled water. The ultrasonic cleaning machine (DT) from Hubei Dingtai Hengsheng Technology Equipment Company Limited. Step C is stirring. The breaker B was placed at room temperature, and the breaker A was poured into the breaker B. The mixed solution was stirred for 2 h under the magnetic stirrers (C-MAG HS 7, made in IKA). Step D is hydrothermal reaction. The 60 mL mixed solution is evenly placed in four 30 mL autoclaves (ax-fO25, made in Hangzhou Tongniu Technology Company Limited). The hydrothermal reaction was at 180 °C for 6 h. Step E is centrifugation. The purpose of centrifugation is to alternately clean the precipitate with absolute ethyl alcohol and distilled water. The speed of centrifuge (TGL-16B, made in Shanghai Anting Scientific Instrument Factory) is set at 6000 r/min. Finally, the distilled water on the upper layer is poured out to obtain white precipitation. Step F is drying. The white precipitation was placed in an oven at 80 °C (LDO, made in Shanghai Longyue Instrument Equipment Company Limited) for 6 h to form Zn(OH)2 white crystals. Step G is grinding. The obtained white crystals are ground into a white powder in an agate mortar. Step H is calcination at a high temperature. The white powder was calcined in a muffle furnace (OTF-12000X, made in Hefei Material Crystal Material Technology Company Limited). The calcination temperature is 800 °C and the calcination time is 3 h. Finally, the ZnO is placed in a transparent plastic tube.
2.2. Characterization Details
Energy Dispersive Spectrometer (EDS) is an instrument used to analyze the element type and content of the materials. (Al5%, Mg1%) co-doped ZnO by EDS can get the O, Zn, Mg, and Al elements [32]. The X-axis of EDS represents the energy value, and the unit is keV. The Y-axis represents the counts of x-rays emitted by different elements. X-Ray Diffraction (XRD) can obtain the crystal peak of the nanomaterial. Shen et al. characterize CuO by XRD and all the sharp diffraction peaks of the product can be labeled as the monoclinic CuO (JCPDS No.: 48-1548) [33]. The crystal can be compared with a standard PDF card to determine the type of nanomaterial. The purity of the nanomaterial can be determined by EDS and XRD characterization.
2.3. Experimental Measurement Process
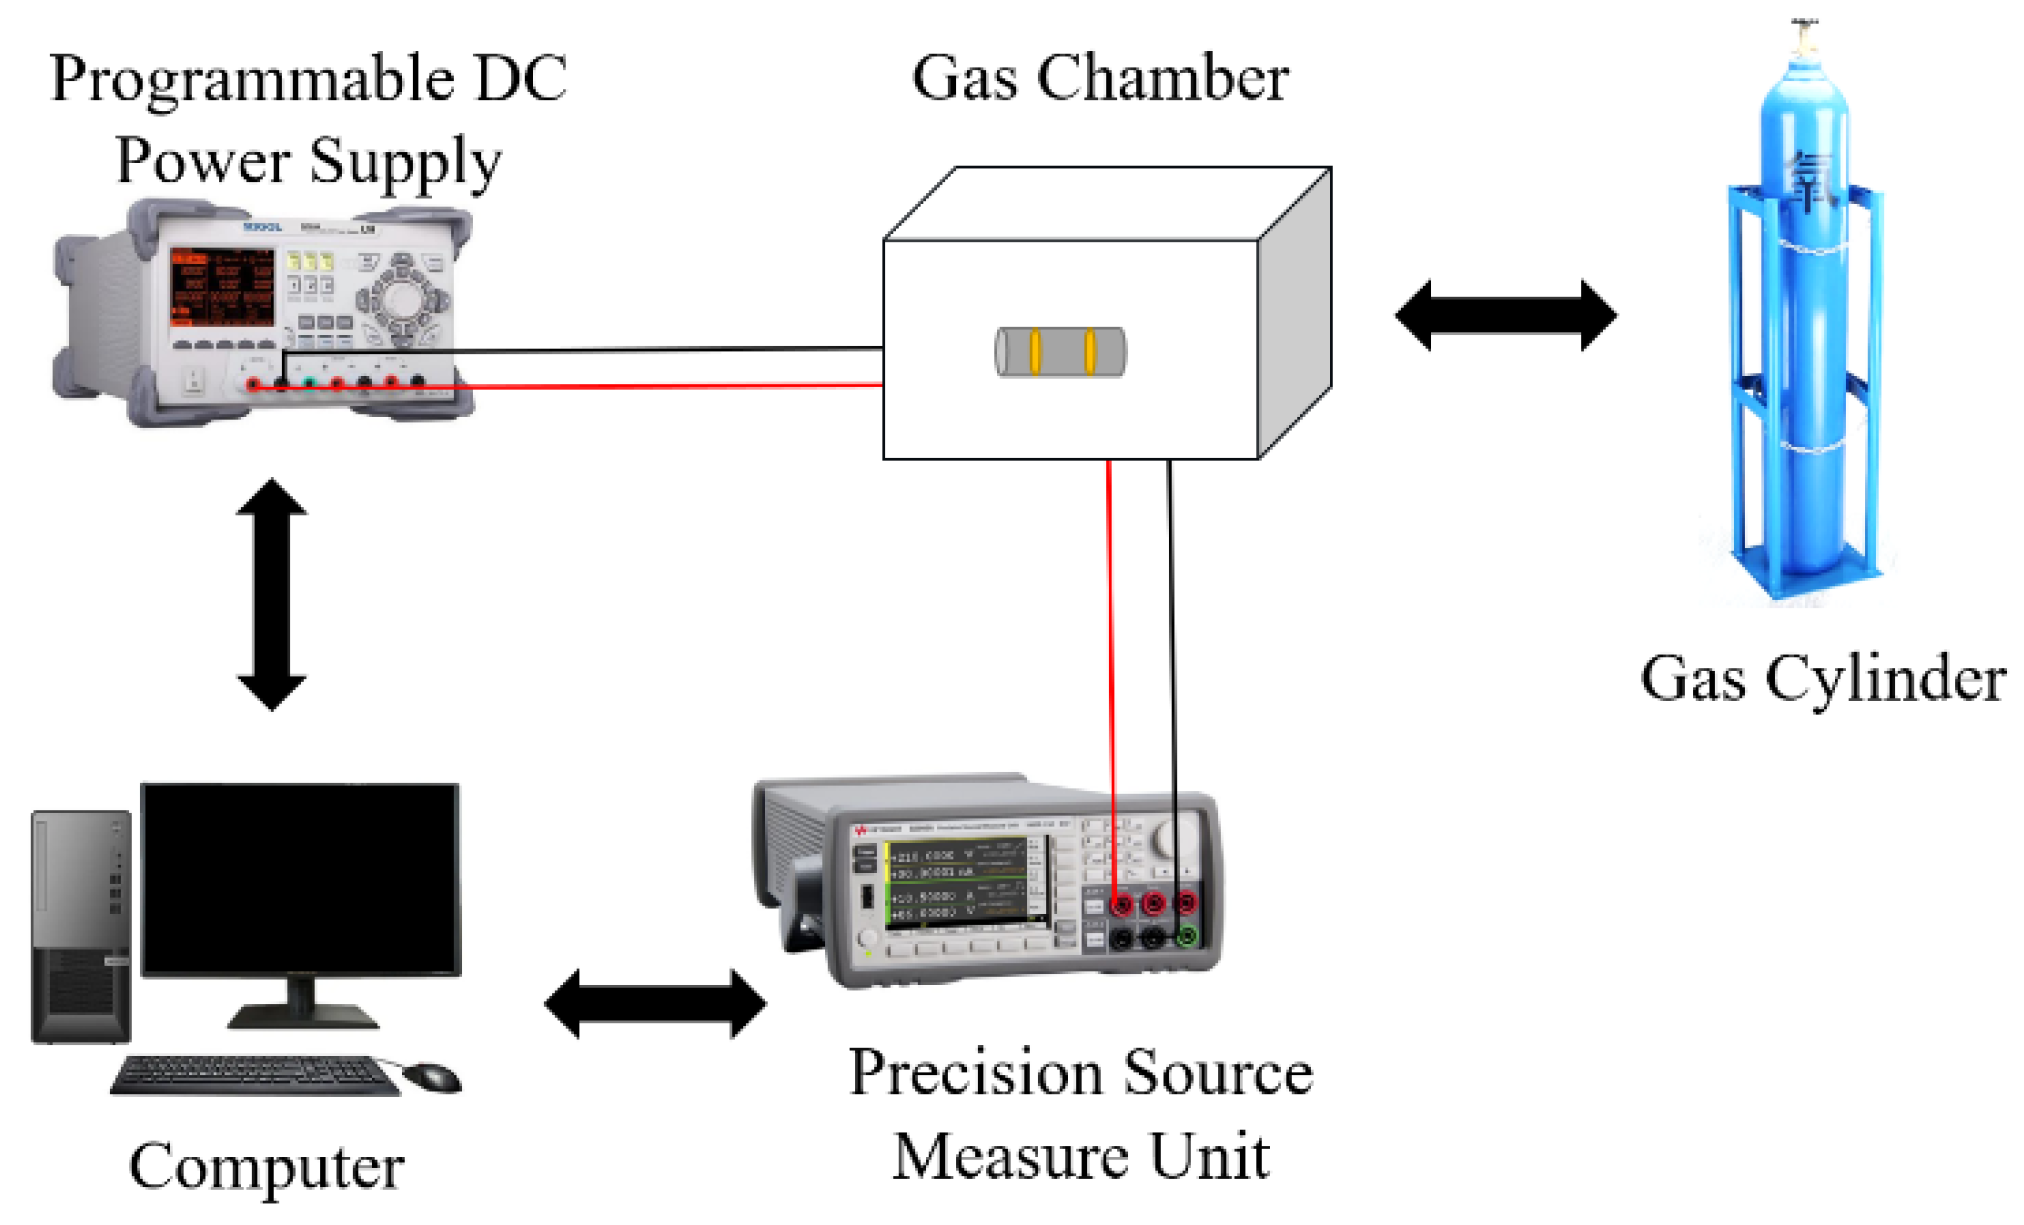
The experimental apparatus diagram is shown in Figure 2. The experimental apparatus is mainly composed of a programmable DC power supply, precision source measure unit, computer, gas chamber, and gas cylinder. The programmable DC power supply is designed to provide different cycle heating waveforms. The precision source measure unit is used to collect dynamic response signals under different cycle heating waveforms. The computer is used to display dynamic response signals. The reaction between ZnO nanomaterials and the VOCs gas is carried out in the gas chamber. The gas cylinder is used to fill the gas chamber with synthetic air. The synthetic air is passed into the air chamber to simulate the natural atmospheric environment before passing into the VOCs gas. Then the programmable DC power supply input the heating waveform. The precision source measure unit also shows a periodic change when the VOCs gases through the syringe into the gas chamber. Finally, the dynamic response signal (usually five cycles) is collected.
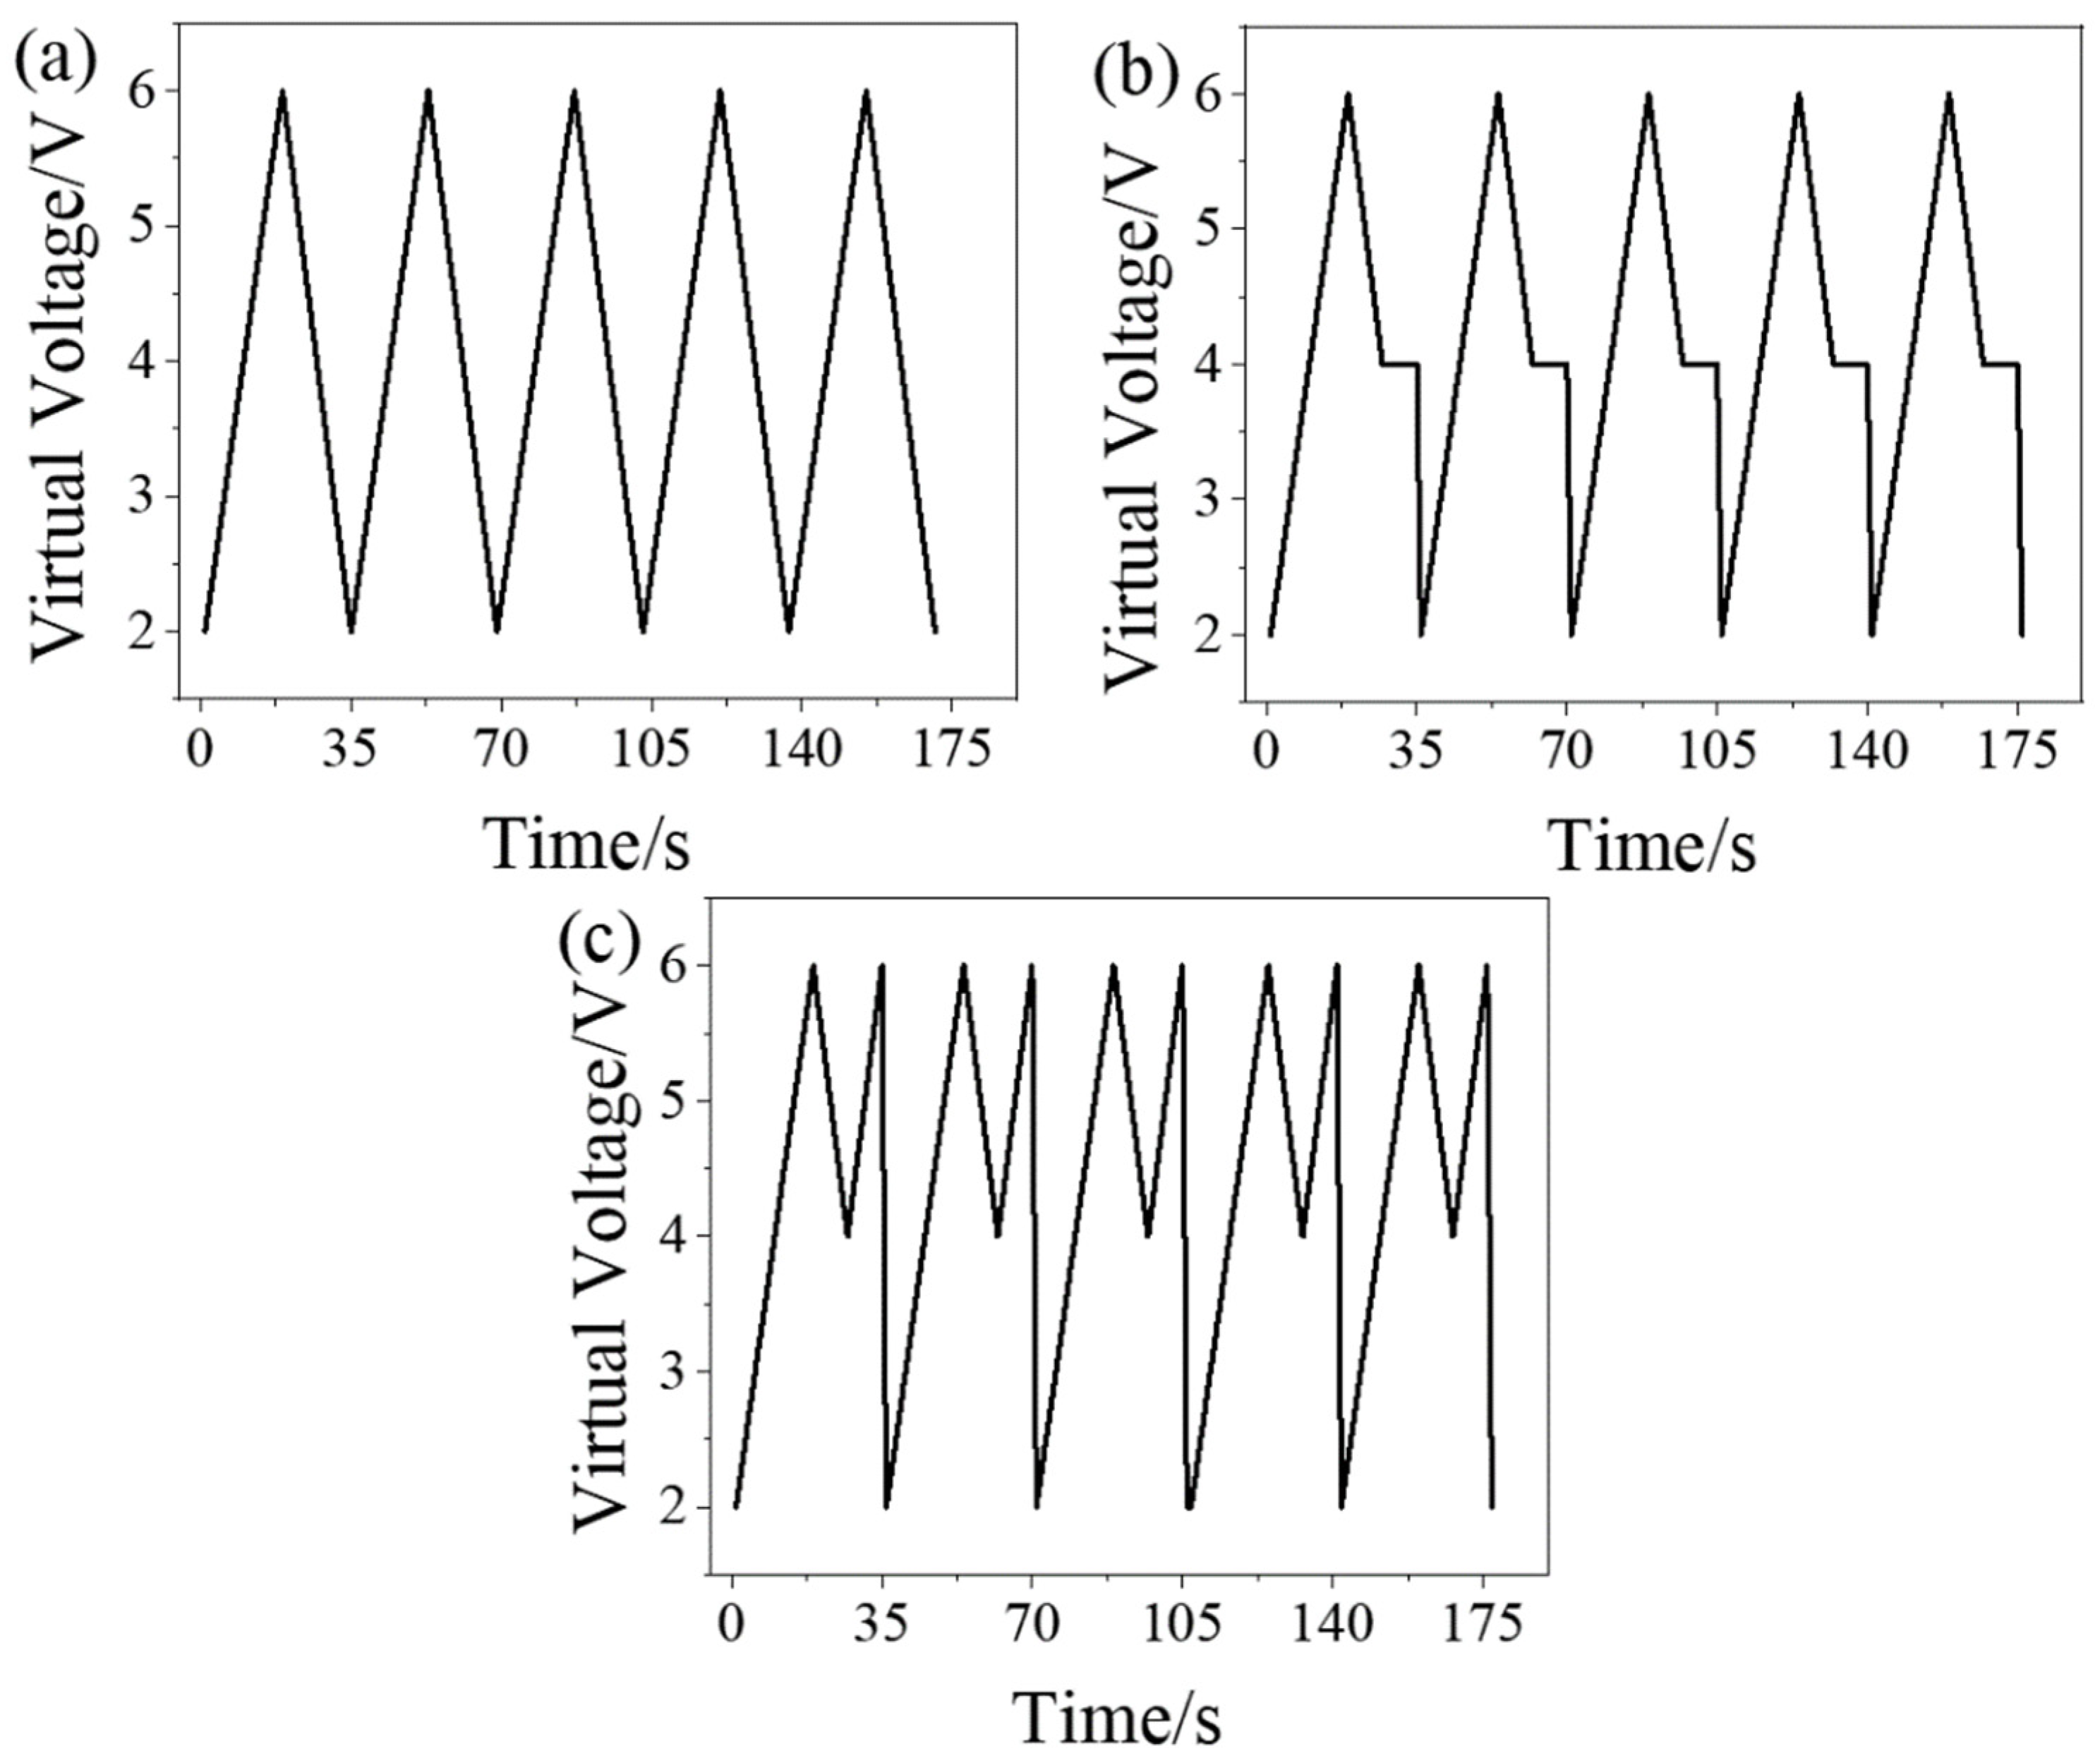
According to a previous study [27], the cycle heating triangular waveform of the saturated dynamic response signal for dynamic measurement of alcohol homolog gases has a period of 35 s and a symmetry of 57% (TW-1). Taking ethyl alcohol as an example, the second characteristic peak appeared at about 22 s. After 22 s, the voltage continued to fall, but no new characteristic peak appeared in the dynamic response signal. In this experiment, the periodic heating cycle was maintained unchanged. Then, 100 ppm ethyl alcohol was measured by applying constant heating voltage (TW-2) and increasing heating voltage (TW-3). Figure 3 shows three different heating triangular waveforms. After that, 100 ppm n-propyl alcohol, isopropyl alcohol, and n-butyl alcohol were detected based on the TW-3 waveform. The dynamic response signal curves of the three alcohol homolog gases were obtained. Finally, the concentration gradients of the four alcohol homolog gases were measured at 100–500 ppm under the TW-3 waveform.
3. Experimental Results and Discussion
3.1. Characterization of the ZnO Nanomaterials
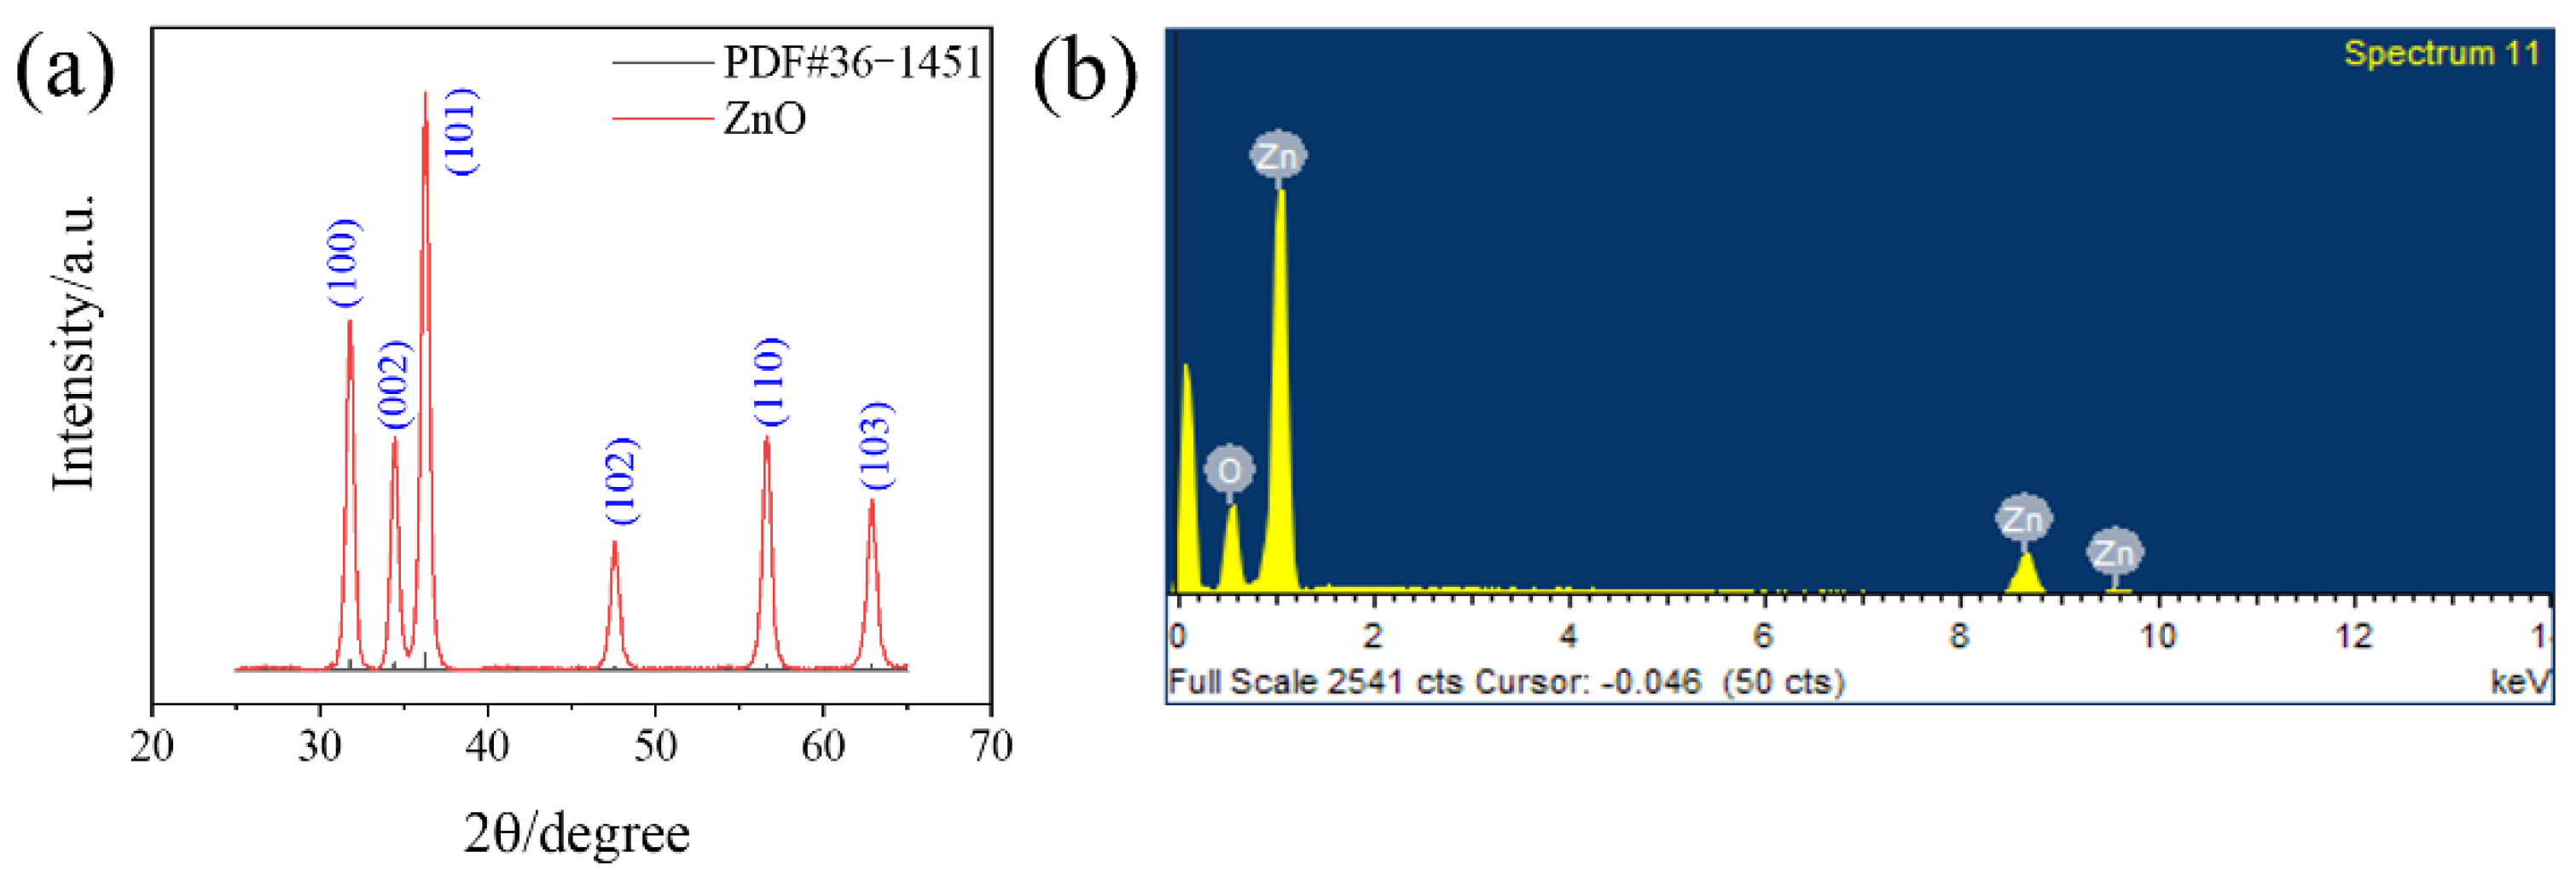
The XRD and EDS of ZnO nanomaterial prepared by the hydrothermal method is shown in Figure 4.
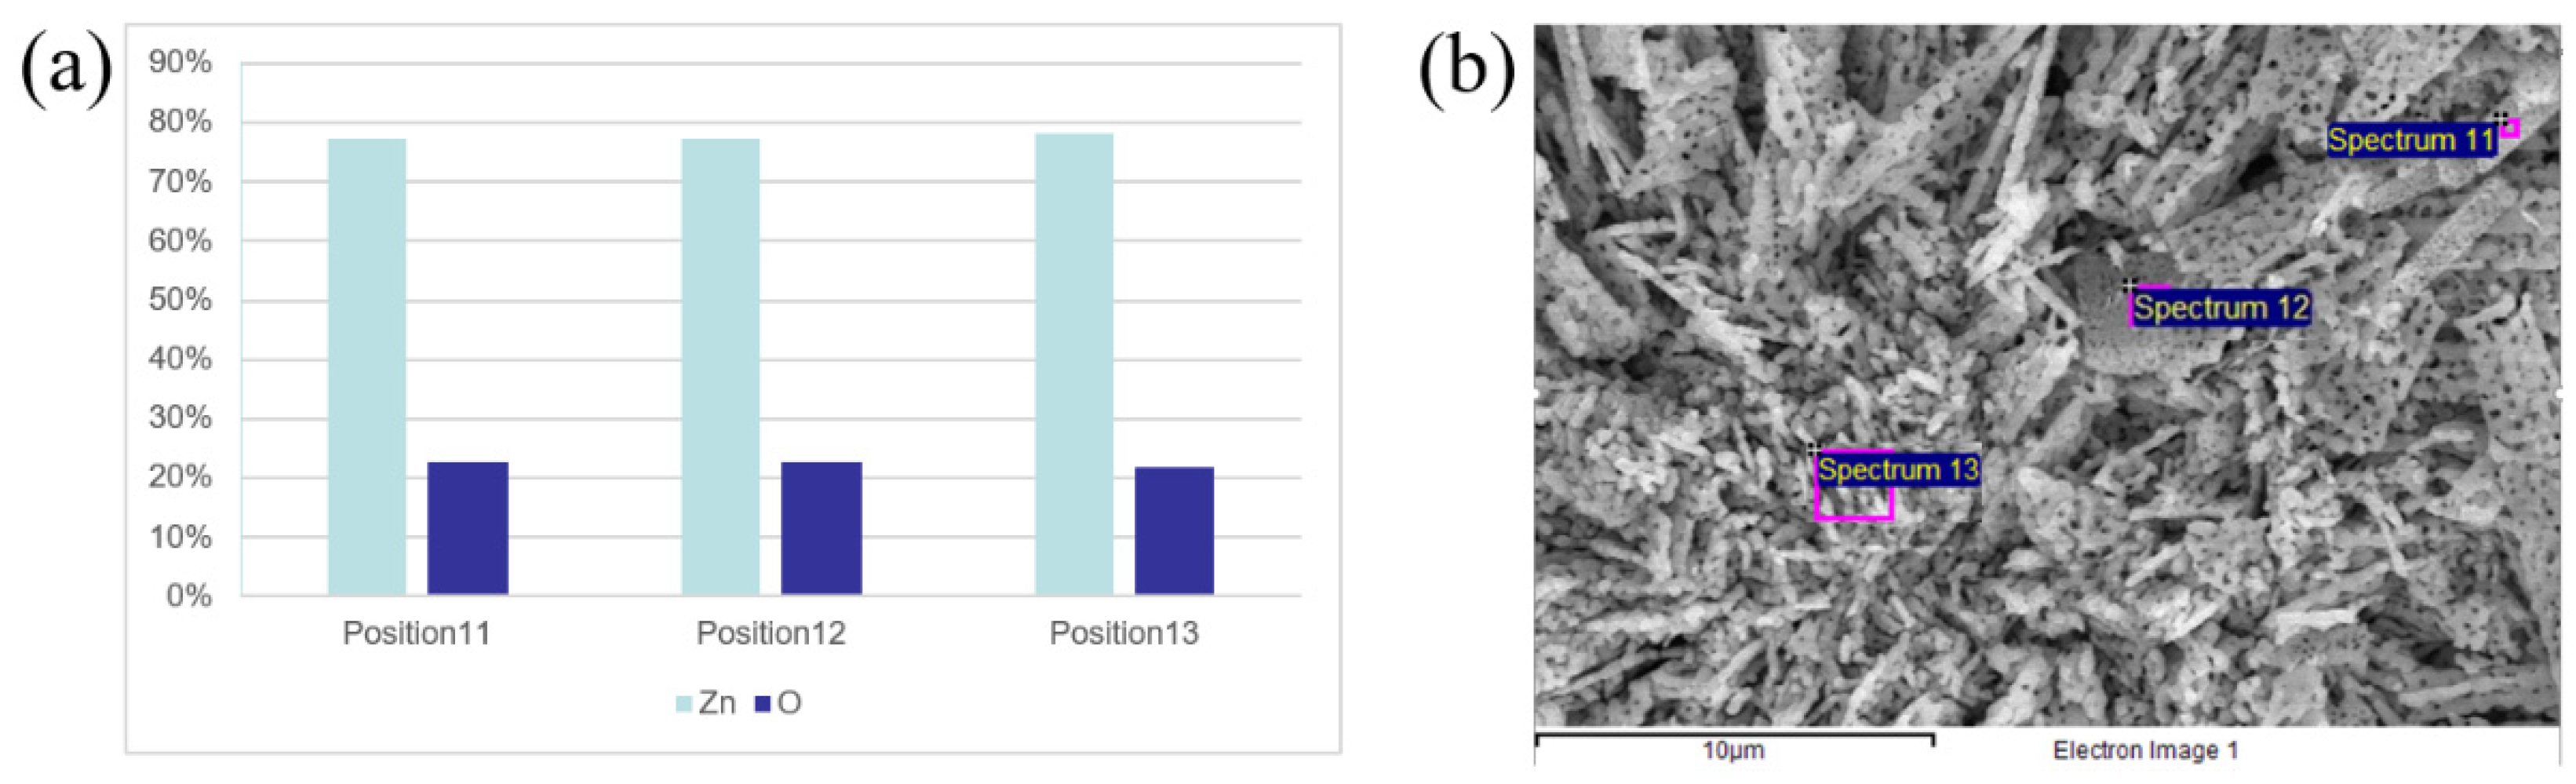
The XRD is in the 25° to 65° at a scanning rate of 5°/min. The six peaks appear at 31.77°, 34.42°, 36.25°, 47.54°, 56.60°, and 62.86° which correspond to the (100), (002), (101), (102), (110), and (105) crystal surfaces of the ZnO PDF standard card (36-1451). There are no peaks of other crystals. This indicates that ZnO has a high purity. According to Figure 4b, Zn and O are found in the ZnO nanomaterials without other elements. The purity of ZnO nanomaterial synthesized by the hydrothermal method is high. The ZnO nanomaterial with higher purity produces stable dynamic response signals to various VOCs gases, which is suitable for dynamic measurement. Figure 5a shows the distribution of O elements and Zn elements at three different positions under Figure 5b. Each position is about 78% Zn elements and 22% O elements. It can be seen from the table that the distribution of Zn element and O element at different positions are relatively uniform.
3.2. Dynamic Response Signal of Ethyl Alcohol
Figure 6a shows the concentration gradient of the characteristic peak of the four alcohol homologous gases at 100–400 ppm under the TW-1. It can be seen that the response signal current of different VOCs gases at different concentrations are generally different. As the concentration of the measured gases increases, the output current also increases. However, the characteristic peak current of 200 ppm ethyl alcohol and 250 ppm n-propyl alcohol are the same, resulting in an error in recognizing the two gases from the characteristic peak current. As the concentration of the measured gases increases, the current value of the highest peak of the ethyl alcohol increases more slowly than that of the isopropyl alcohol, which results in the coincidence of the current value of the highest peak of ethyl alcohol and isopropyl alcohol at a later same concentration. Therefore, a characteristic peak current of the dynamic response signal cannot be used as a basis for qualitative and quantitative recognition of the alcohol homologue gases. Figure 6b is the current concentration gradient diagram of the two characteristic peaks of the four alcohol homologs gases at 100–400 ppm under TW-1. It can be seen that the response signal current values of the tested VOCs gases at different concentrations are generally different from the first peak and the secondary peak. However, the response ratios of ethyl alcohol at 100–400 ppm and n-propyl alcohol at 150–350 ppm will overlap, which makes the recognition of these two gases appear to be wrong. So, when the peak number of the dynamic response signal is 2, the qualitative and quantitative recognition of the alcohol homologue gases will be wrong.
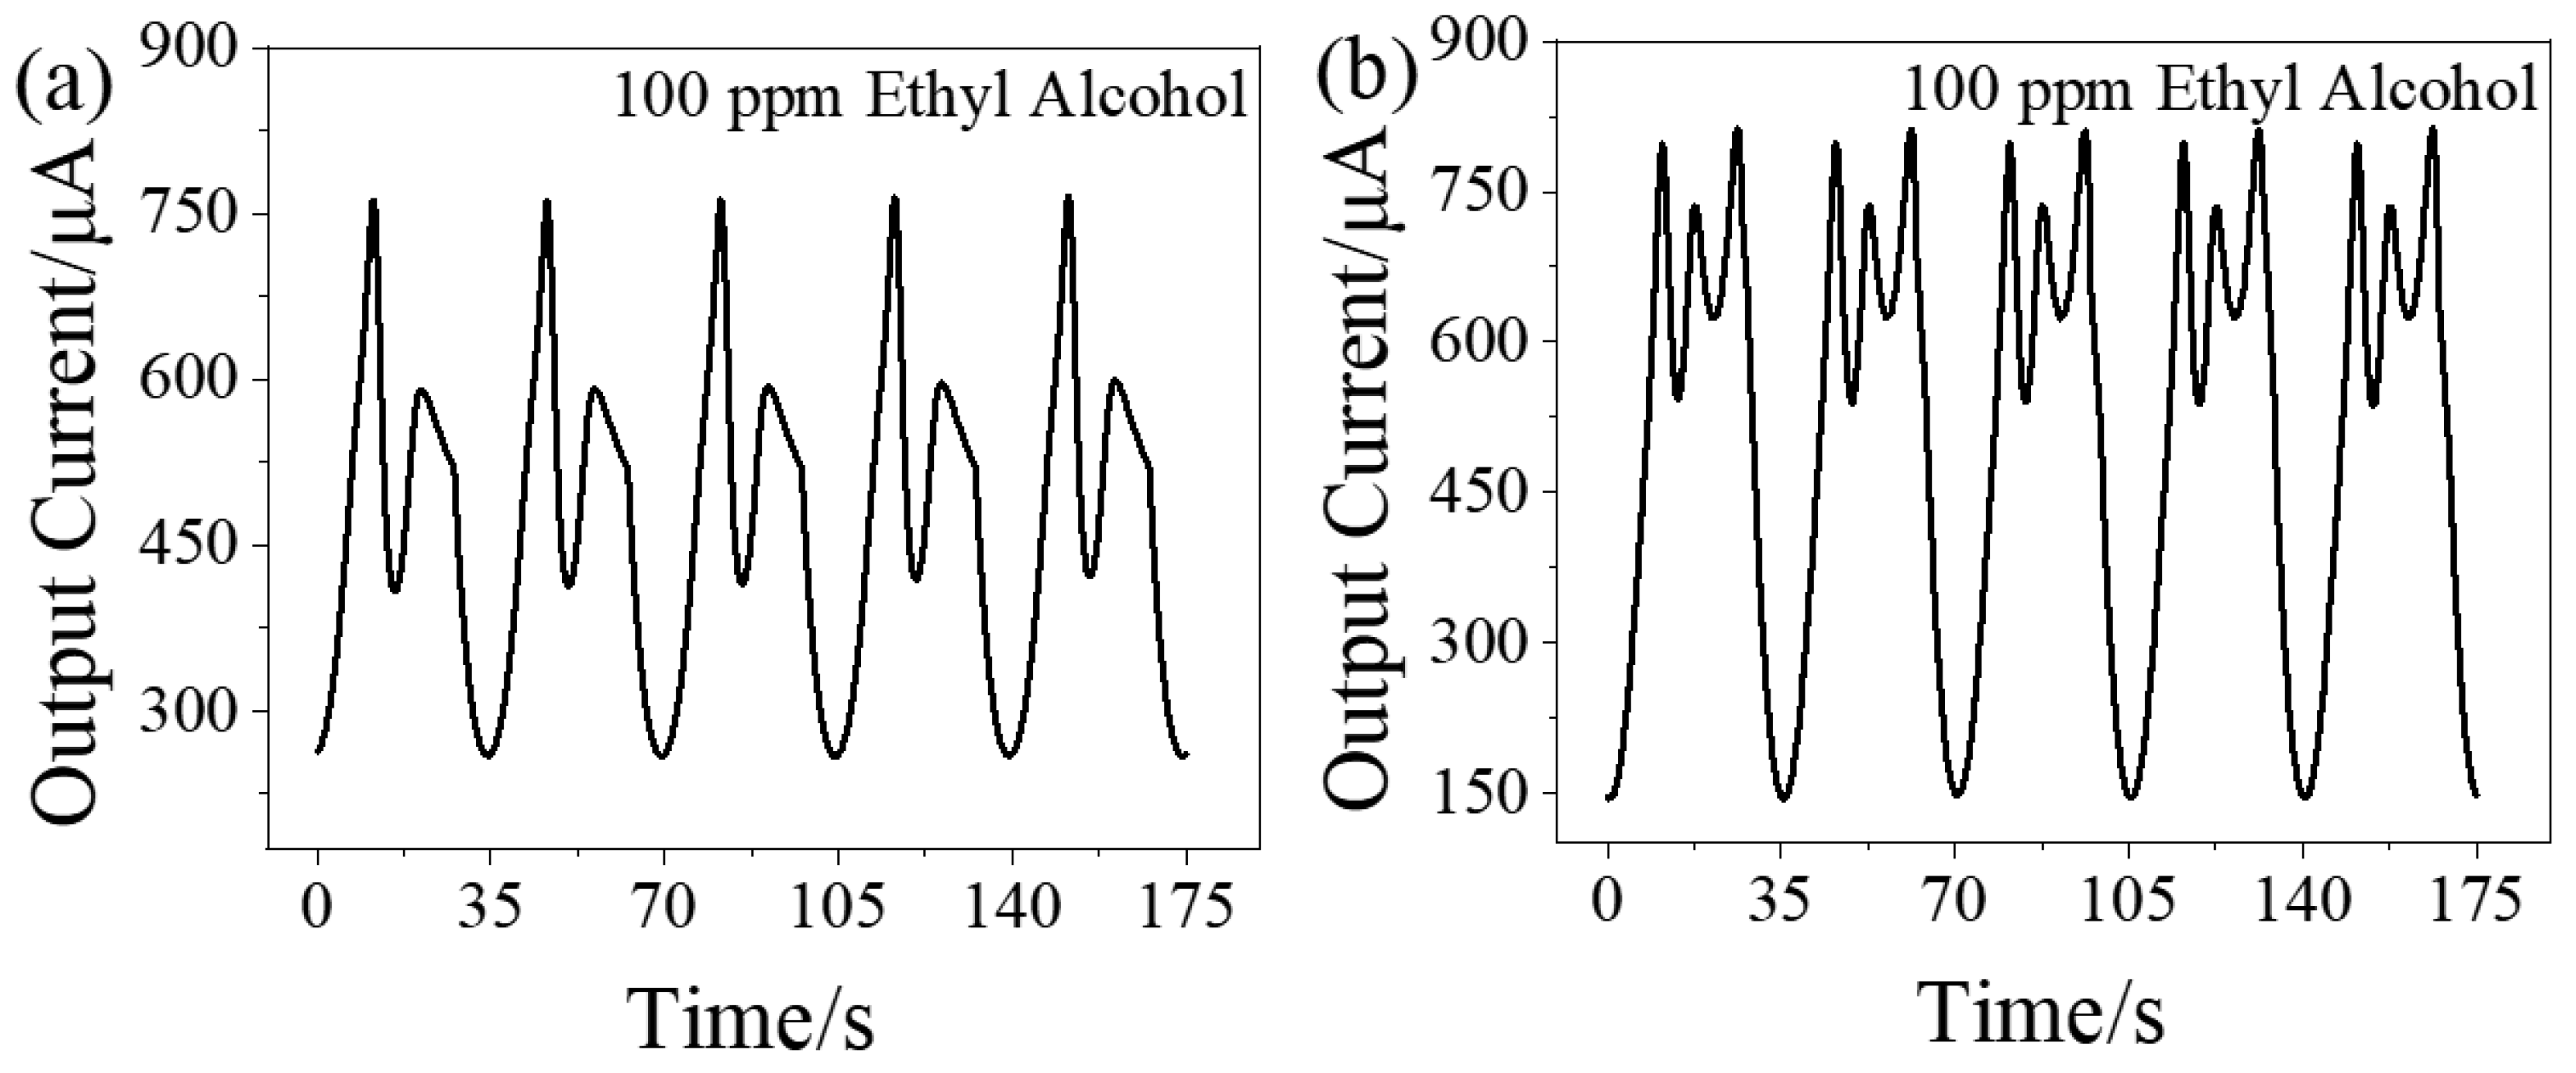
Under the TW-2, the dynamic response signal curve of 100 ppm ethyl alcohol was obtained, as shown in Figure 7a. It can be seen that the number of characteristic peaks of the ethyl alcohol did not increase when the heating voltage was kept constant at the second characteristic peak. In the 20 s of the cycle, the second characteristic peak appears in the dynamic response signal. At 20 s–28 s of the cycle, the current signal has a sharp decline trend. After 28 s, the current signal begins to decline slowly. Under the TW-1, the second characteristic peak of the ethyl alcohol appeared at the 22 s of the cycle. Under the TW-2, the second characteristic peak of the ethyl alcohol appeared 2 s earlier. The essential influencing factor of dynamic measurement is the temperature, and the change of circulating heating voltage is the change of the temperature. The temperature will not change much if the voltage is maintained at 4 V. At the same time, the type of oxygen ions adsorbed on the ZnO nanomaterials surface remains unchanged, and no new chemical or physical reactions occur between oxygen ions and hydroxyl groups of ethyl alcohol. Therefore, the dynamic response signal of the 100 ppm ethyl alcohol under TW-2 does not appear a new characteristic peak.
The dynamic response signal curve of 100 ppm ethyl alcohol under TW-3 is shown in Figure 7b. By comparing Figure 7a,b, it can be seen that the number of characteristic peaks of dynamic response signals can indeed be increased by increasing the heating voltage when the second characteristic peak appears. The second characteristic peak appears in the 17 s. The third characteristic peak appears at the 26 s. The second characteristic peak of 100 ppm ethyl alcohol under TW-1 appeared at the 22 s. The second characteristic peak appeared at 20 s under TW-2. The second characteristic peak appeared at 17 s under TW-3, and the third characteristic peak appeared at 26 s. In other words, with the increase of heating voltage, the second characteristic peak will appear earlier. Under the TW-3, the heating voltage reaches 4.25 V at 26 s, and the second characteristic peak of the TW-1 also appears at about 4 V. Under the TW-3, there is a characteristic peak when the heating voltage is 4 V. It is possible that new oxygen ions appear on the surface of ZnO nanomaterials, and a new physical or chemical reaction occurs with the hydroxyl group, which results in a new characteristic peak.
3.3. Dynamic Response Signal of Other Alcohol Homologue Gases
Based on the TW-2, the 100 ppm n-propyl alcohol, isopropyl alcohol, and n-butyl alcohol were detected. The dynamic response signal was shown in Figure 8. It can be seen that it is similar to ethyl alcohol. There is no new characteristic peak appeared in the three alcohol homologue gases under the TW-2. The number of characteristic peaks was two. For 100 ppm ethyl alcohol, n-propyl alcohol, isopropyl alcohol, and n-butyl alcohol, the improved cyclic heating triangle wave did not increase the number of characteristic peaks, but the position of the characteristic peak was different. The second characteristic peak of the n-propyl alcohol appeared at 28 s. The second characteristic peak of the isopropyl alcohol appeared at 25 s. The second characteristic peak of the n-butyl alcohol appeared at 29 s. For 100 ppm n-propyl alcohol, the output current decreases slowly after 28 s of the cycle. For 100 ppm isopropyl alcohol, its dynamic response signal curve is similar to the ethyl alcohol. There is a sharp current decline trend in the 25–30 s, and the output current shows a slow decline trend after the 30 s. For 100 ppm n-butyl alcohol, the dynamic response curve is similar to the n-propyl alcohol. After the appearance of the second characteristic peak, the output current always presents a trend of gentle decline. This may be because the number of hydroxyl groups in n-propyl alcohol and n-butyl alcohol is the same, so they have similar dynamic response signals when they react with the surface of ZnO nanomaterials for oxygen adsorption.
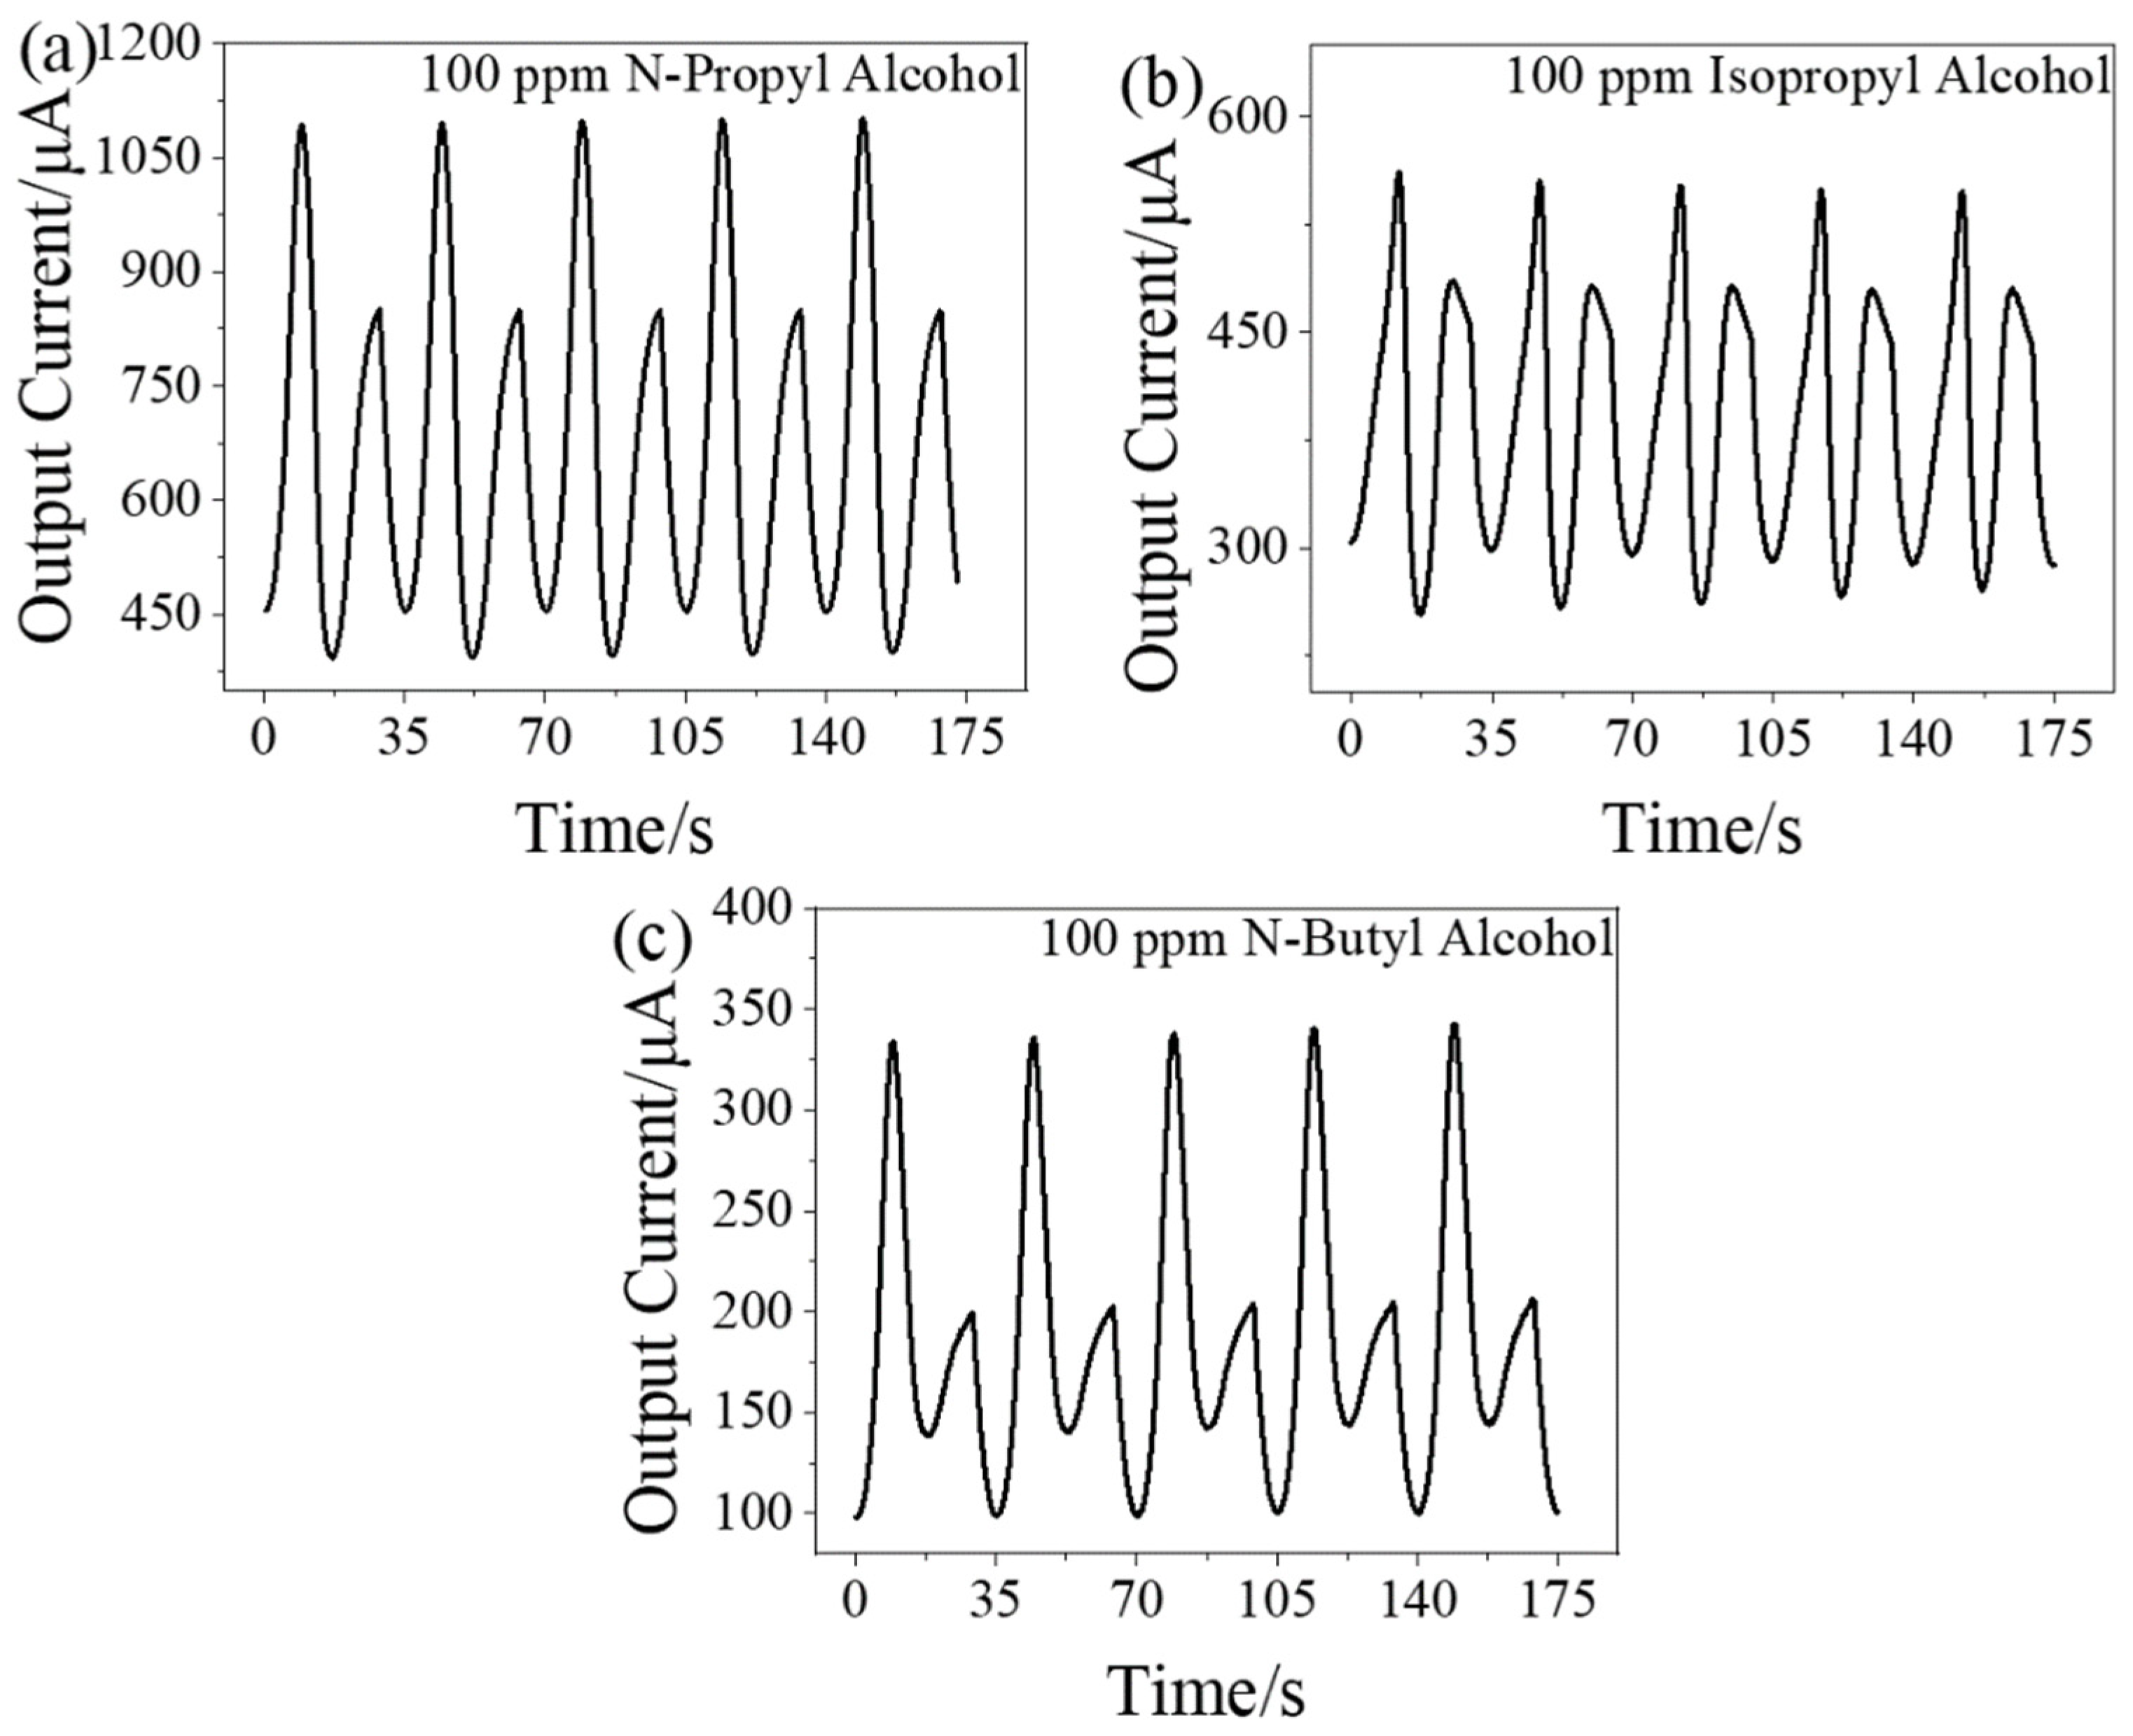
The 100 ppm n-propyl alcohol, isopropyl alcohol, and n-butyl alcohol were detected based on the TW-3. As shown in Figure 9, when the second characteristic peak appears, the three alcohol homologues all appear as the new characteristic peaks with the increase of heating voltage. The second characteristic peak of the n-propyl alcohol appeared in the 23 s, and the third characteristic peak appeared in the 30 s of the cycle. The second characteristic peak of the isopropyl alcohol appeared in the 26 s of the cycle, and the third characteristic peak appeared in the 30 s of the cycle. The number of characteristic peaks of n-butyl alcohol reached 4. The second, third, and fourth characteristic peaks appeared in the 18 s, 25 s, and 28 s respectively. Compared with the time of the second characteristic peak under the TW-3, the time of the characteristic peak will advance with the increase of heating voltage. This may be because the overall temperature will be higher with the increase of the heating voltage. The reaction between oxygen ions adsorbed on the ZnO surface and hydroxyl group will occur physical or chemical reaction at an earlier time. Thus, the characteristic peaks appear.
3.4. Dynamic Response Mechanism
There are hydroxyl groups in the alcohol homolog gas, located on H and O. The electronegativity of O is higher than that of H, and the ability to attract electrons is very strong. The electrons in the O-H bond are heavily biased toward O, which results in the polarity of the O-H bond. It is easily broken to form O ions and H ions. Along the way, other products will emerge. Literature shows that ethyl alcohol, part of it can react with adsorbed oxygen to produce CO2 and H2O directly. Most lose H ions as they are captured by the adsorbent oxygen. Three intermediates CH3CH2O−, CH3CO−, and CH3COO− are also generated when CO2 is generated. The reaction between alcohol homologue gases and oxygen anions is completed in multiple steps. The hydroxyl groups have a slow equilibrium and competitive effect on the surface of sensitive materials. The types of oxygen ions adsorbed on the surface of sensitive materials will change with the temperature change, and the reaction with hydroxyl groups will change. Under the TW-1, the temperature continues to decrease, and the reaction between oxygen ions and hydroxyl groups may be incomplete. When the heating voltage is kept constant at 4 V, the temperature will decrease slowly. The continuous high temperature makes oxygen ions entirely react with hydroxyl groups, which results in the significant increase of dynamic response current signals of the four alcohol homologues gases. Under the TW-2, the reaction temperature of oxygen ions and hydroxyl groups increases, but it is possible that the reaction temperature at this time does not change the type of oxygen ions on the surface of ZnO nanomaterials, and the electronic activity does not change. There is no new chemical reaction between oxygen ions on the surface of ZnO nanomaterials and alcohol homologue gases. Therefore, the characteristic peak is not optimized. The essence of the increase in the TW-3 waveform heating voltage is the increase in temperature, which may be the emergence of new oxygen ion states with the increase in temperature. There is a new transformation between oxygen ions with the increase of electronic activity. The reaction between hydroxyl and oxygen negative ions also accelerates, resulting in the emergence of the third characteristic peak.
3.5. Qualitative and Quantitative Analysis of Alcohol Homologue Gases
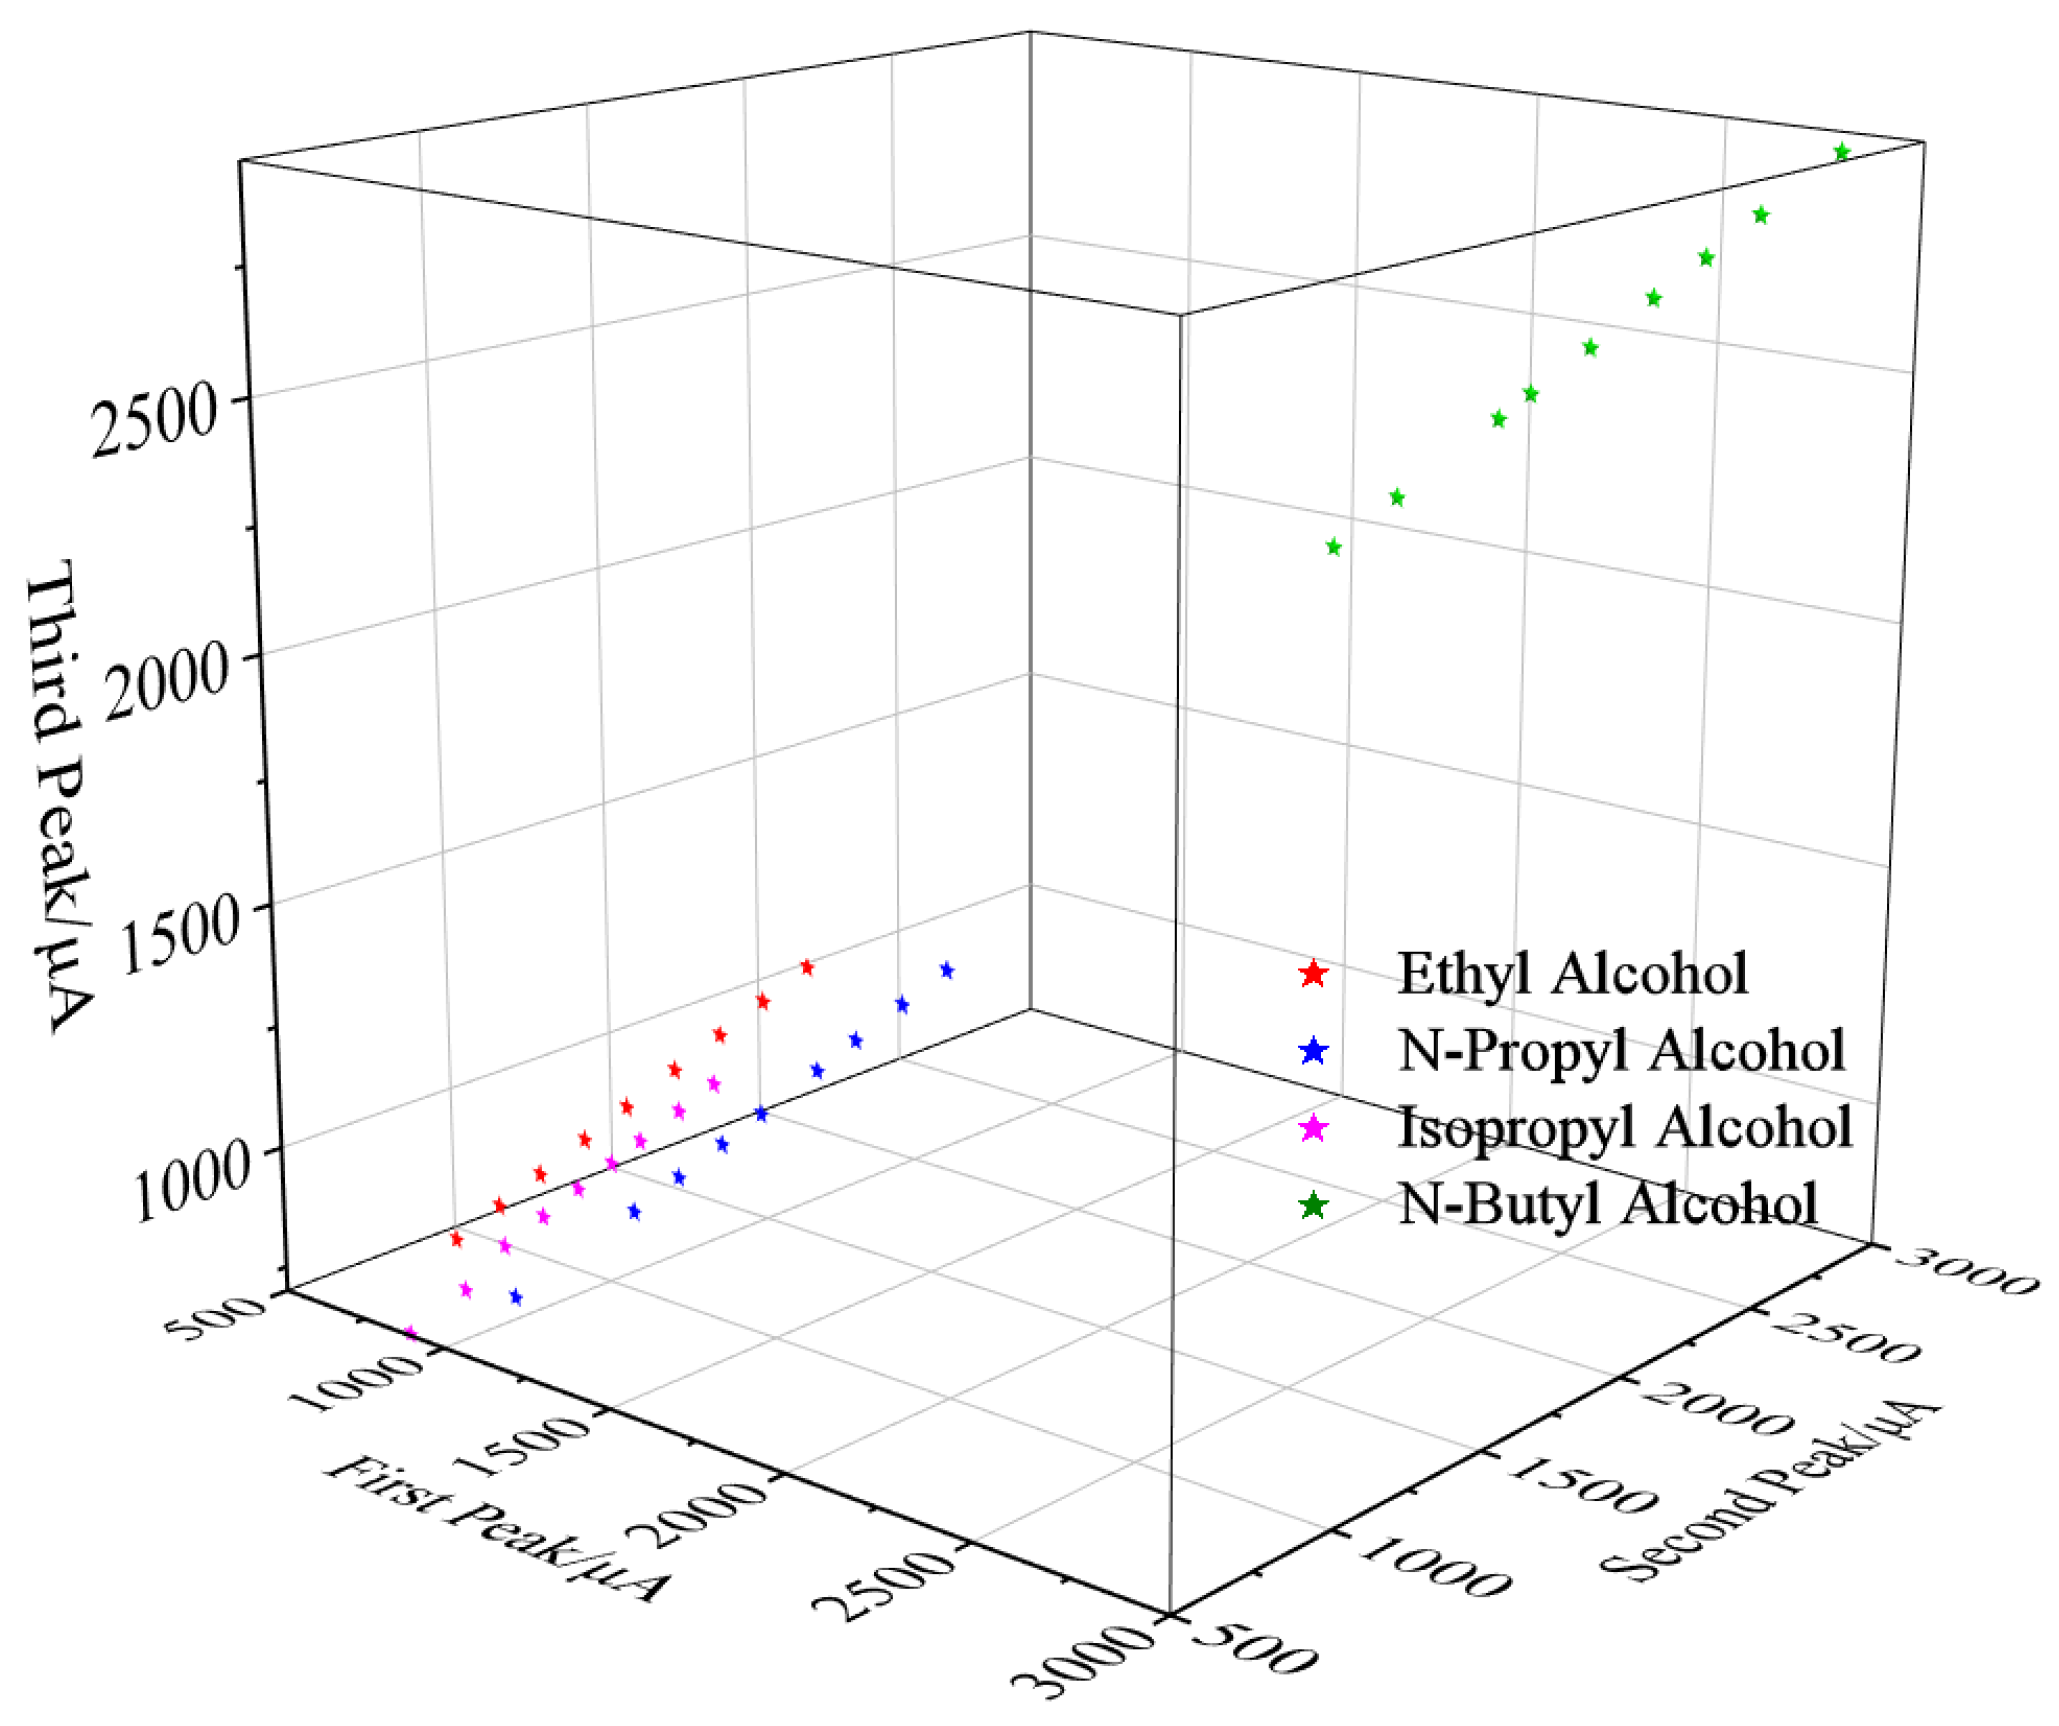
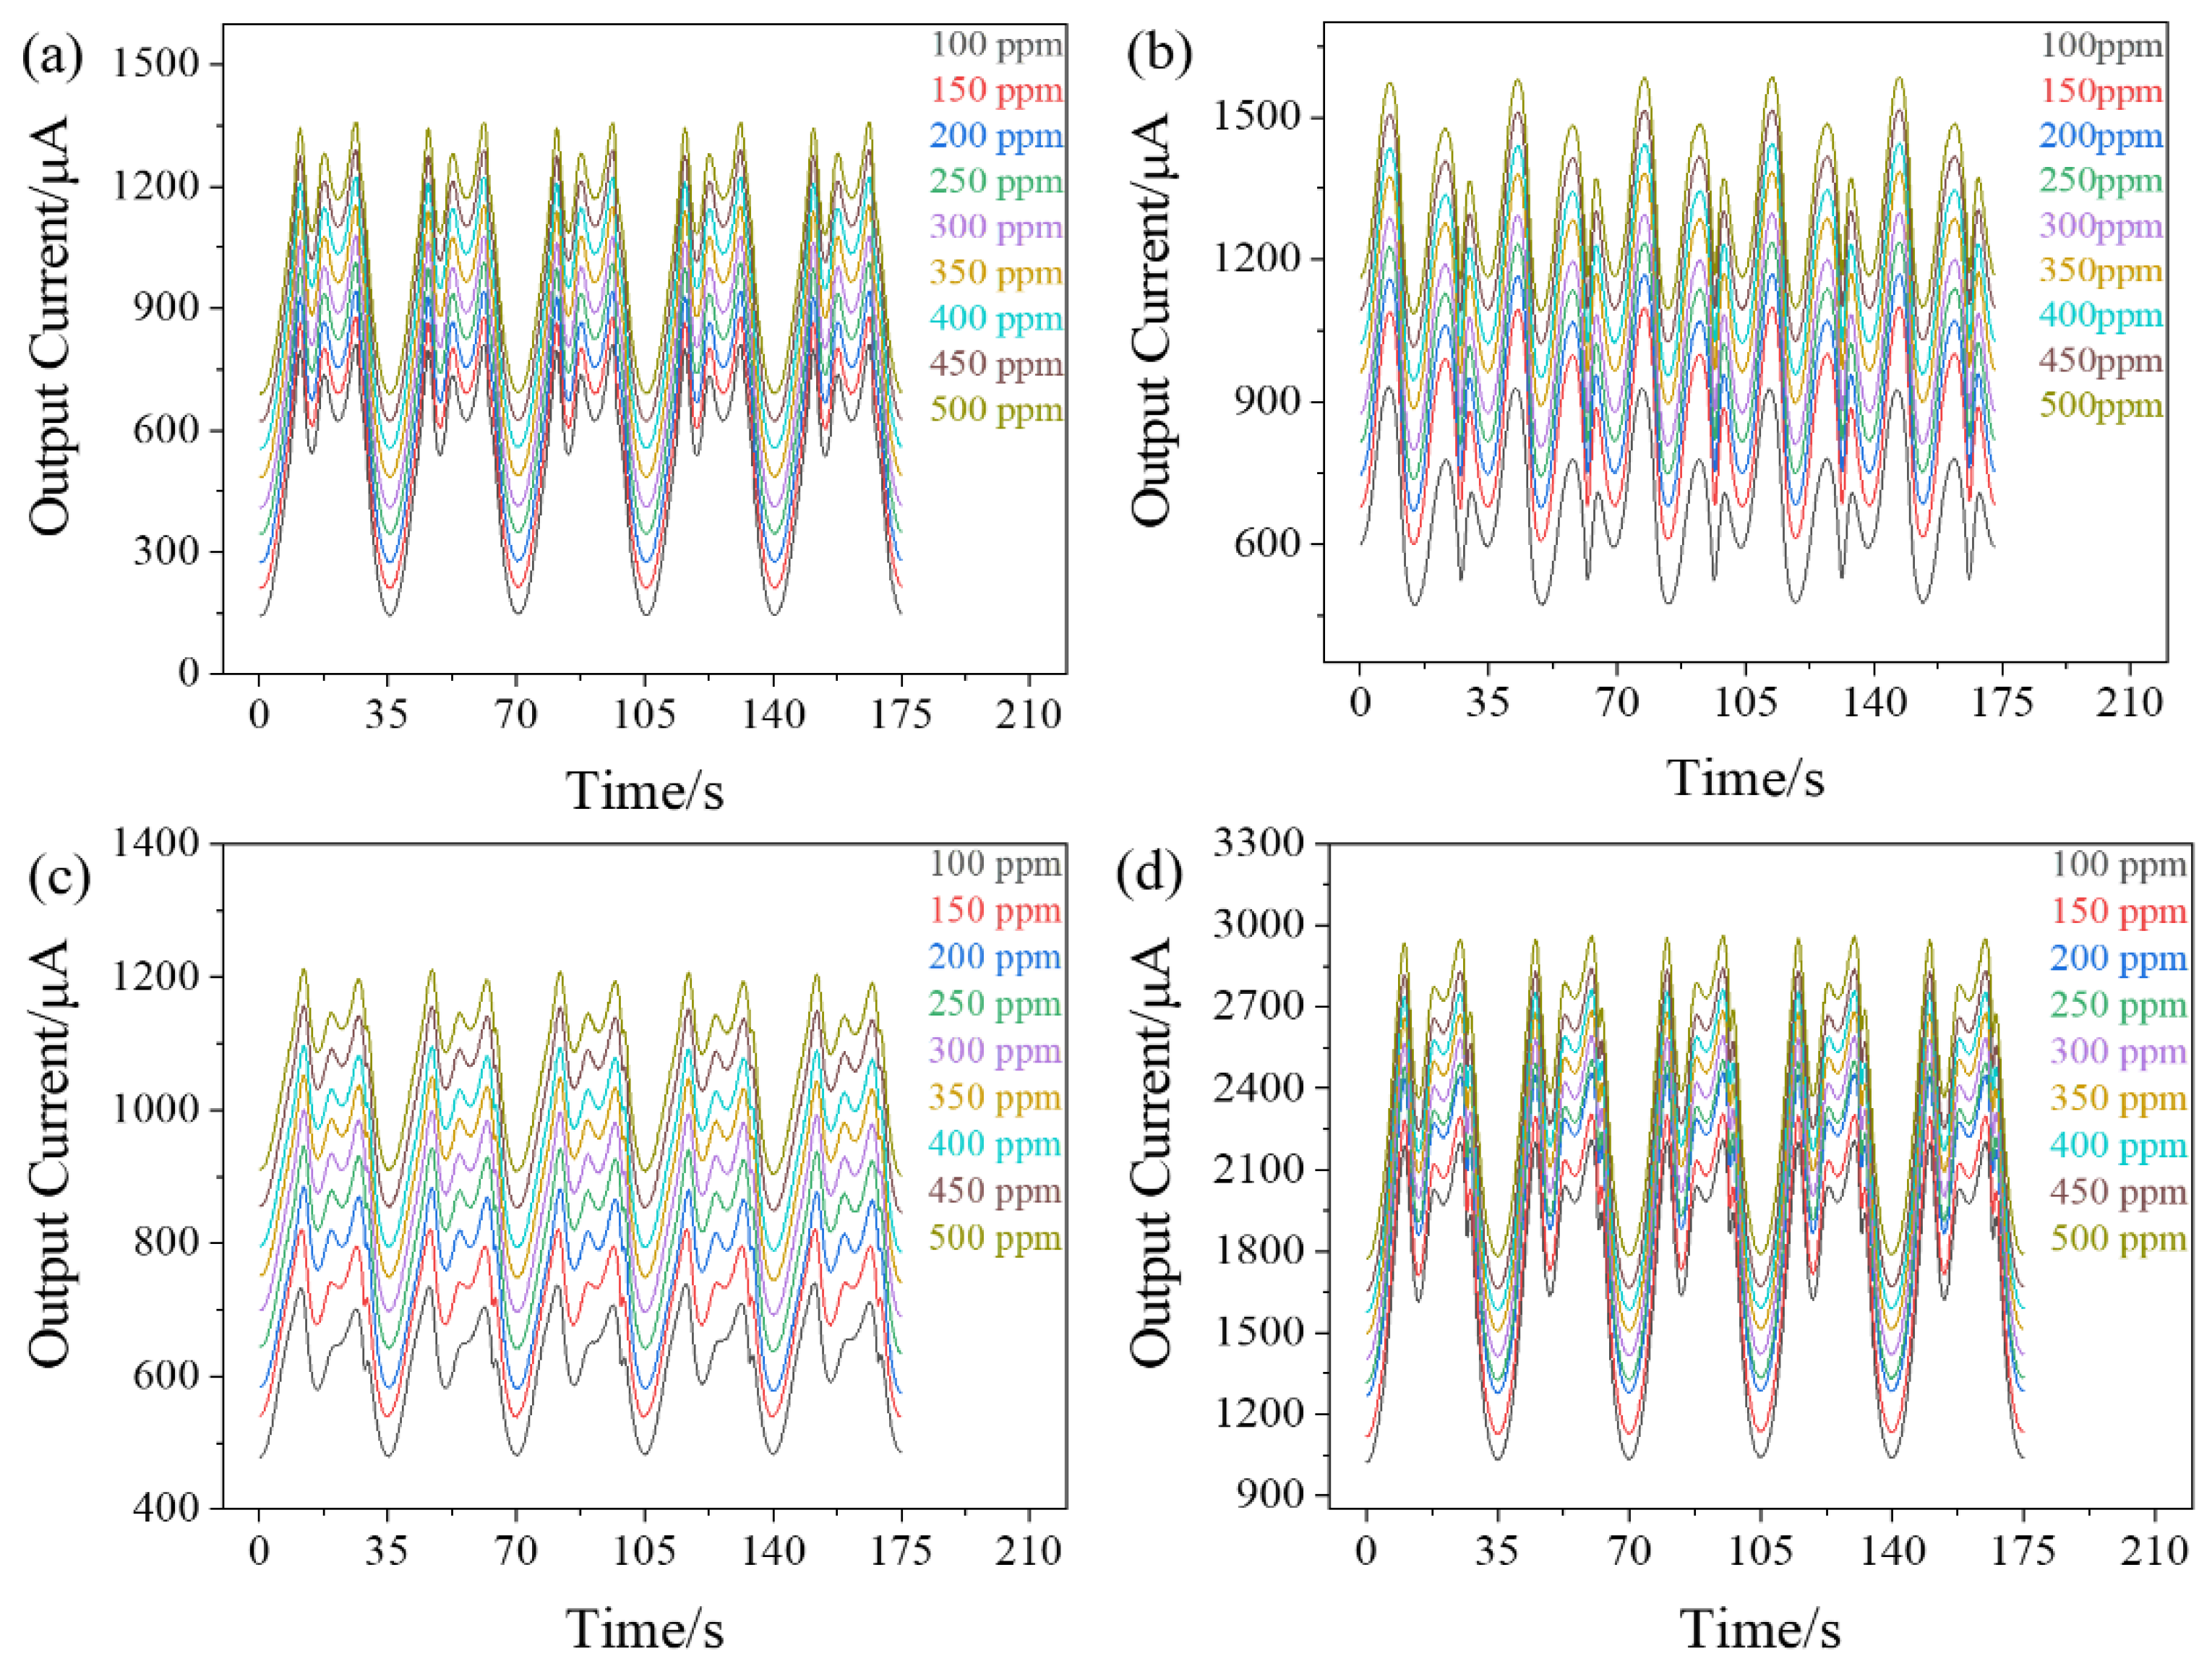
Based on TW-3, nine different concentrations of four alcohol homologue gases are dynamically detected, and the concentrations are 100 ppm, 150 ppm, 200 ppm, 250 ppm, 300 ppm, 350 ppm, 400 ppm, 450 ppm, and 500 ppm, respectively. Figure 10 shows the relationship between the three characteristic peak output currents and concentrations of four alcohol homologue gases under TW-3. In particular, n-butyl alcohol obtained the second, third and fourth characteristic peaks. The characteristic peak current increases with the increasing concentration. The characteristic peak currents of ethyl alcohol, n-propyl alcohol, isopropyl alcohol, and n-butyl alcohol are almost parallel to each other as the concentration increases. However, the three characteristic peak currents obtained under the TW-3 do not have the cross-sensitivity problem of four alcohol homologue gases. Compared with Figure 6, the increase in the number of characteristic peaks can indeed increase the recognition rate of measured VOCs gases. The concentration gradient curve is shown in Figure 11. It can be seen that the positions of characteristic peaks of different gases are different. With the increase of gas concentration, the dynamic response current value of each gas increases, but the positions of characteristic peaks do not change. The location and number of characteristic peaks of the same gas are the same, but the current of the characteristic peak increases with the increase of gas concentration. The three characteristic peaks of ethyl alcohol occur at 10 s, 17 s, and 22 s of the cycle respectively; The three characteristic peaks of N-Propyl alcohol appear in the 8 s, 23 s, and 30 s of the cycle respectively; The three characteristic peaks of isopropyl alcohol appear at the 12 s, 26 s and 30 s of the cycle respectively; The four characteristic peaks of n-butyl alcohol appeared at the 10 s, 18 s, 25 s and 28 s of the cycle respectively. It may be that different chemical constituents are involved in the reaction of the different gases. As a result, the measured gases with oxygen atoms need different times to reach equilibrium and the characteristic peaks appear at different times. Different concentrations of the same gas have the same chemical composition and react with the oxygen atoms. The number of chemicals increases, so the current signal increases as the concentration increases.
K-nearest Neighbor (KNN) is a point corresponding to the feature space for each sample of the same dimension. The output is the result labels. Feature points with similar distances will be classified into the same result label. KNN needs to calculate the distance from the test sample point to each other sample point. When the dimension increases, the number of different sample points from a sample point will decrease within the unit distance, which will cause us to look for a longer length to find the adjacent value. In this experiment, each tag is a sample containing 350-dimension data. Too large of a dimension is easy to cause dimension disaster. Therefore, Principal Component Analysis (PCA) is used to reduce the dimension of the data set. The proportion curve of dimension reduction information is shown in Figure 12. Its principle is to recombine many original indexes with certain correlations into a new group of linear and mutually independent comprehensive indexes. Dimensionality reduction needs to reduce information, but also ensure that important information is not lost. In the experiment, nine concentration information of 4 sample gases were collected, with a total of 36 result labels. Each result label is a sample containing 350-dimensional data. Each sample is repeatedly collected five times, a total of 180 samples. It can be known from the proportion of the information curve after the dimension reduction, the proportion of information in three-dimensional data is 99.7%. After that, the three-dimensional data are recognized by the KNN algorithm, and the accuracy of dynamic reorganization of four alcohol homologue gases by the ZnO Gas sensor is 100%.
4. Conclusions
In this paper, the characteristic peak of the dynamic response signal is increased by optimizing the periodic cyclic heating triangular waveform. The results show that the number of characteristic peaks can increase if increasing the heating voltage at the last characteristic peaks of the dynamic response signal. There are two characteristic peaks of ethyl alcohol in the TW-1 and TW-2 waveforms, and three characteristic peaks in the TW-3 waveform. Based on the TW-3 waveform, 100 ppm n-propyl alcohol, isopropyl alcohol, and n-butyl alcohol were tested. The number of characteristic peaks of dynamic response signals of the three alcohol homologue gases also is optimized. Under the TW-3 waveform, the concentration gradients of the four alcohol homologue gases of 100 ppm, 150 ppm, 200 ppm, 250 ppm, 300 ppm, 350 ppm, 400 ppm, 450 ppm, and 500 ppm were tested respectively. A total of 180 samples and 36 labels were obtained. After the dimensionality reduction of the data through PCA, the KNN algorithm has a recognition rate of 100% for the qualitative and quantitative analysis of four alcohol homologue gases.
Author Contributions
Conceptualization, F.M.; methodology, H.J.; software, H.Z.; validation, F.M.; formal analysis, H.Z.; investigation, H.J.; resources, X.S.; data curation, X.S.; writing—original draft preparation, X.S.; writing—review and editing, H.Z.; visualization, H.J.; supervision, F.M.; project administration, F.M.; funding acquisition, F.M. All authors have read and agreed to the published version of the manuscript.
Funding
This work was supported by the National Natural Science Foundation of China (62071112, 61833006, 62033002, and 61973058), the Fundamental Research Funds for the Central Universities in China (N2201008), the 111 Project (B16009), and Hebei Natural Science Foundation (F2020501040).
Institutional Review Board Statement
Not applicable.
Informed Consent Statement
Not applicable.
Data Availability Statement
Not applicable.
Conflicts of Interest
The authors declare no conflict of interest.
References
- Zhao, S.; Shen, Y.; Yan, X.; Zhou, P.; Yin, Y.; Lu, R.; Han, C.; Cui, B.; Wei, D. Complex-surfactant-assisted hydrothermal synthesis of one-dimensional ZnO nanorods for high-performance ethanol gas sensor. Sens. Actuators B Chem. 2019, 286, 501–511. [Google Scholar] [CrossRef]
- Zhao, S.; Shen, Y.; Zhou, P.; Zhong, X.; Han, C.; Zhao, Q.; Wei, D. Design of Au@WO3 core∓shell structured nanospheres for ppb-level NO2 sensing. Sens. Actuators B Chem. 2019, 282, 917–926. [Google Scholar] [CrossRef]
- Kumarage, G.; Comini, E. Low-Dimensional Nanostructures Based on Cobalt Oxide (Co3O4) in Chemical-Gas Sensing. Chemosensors 2021, 9, 197. [Google Scholar] [CrossRef]
- Acharyya, S.; Nag, S.; Kimbahune, S.; Ghose, A.; Pal, A.; Guha, P.K. Selective Discrimination of VOCs Applying Gas Sensing Kinetic Analysis over a Metal Oxide-Based Chemiresistive Gas Sensor. ACS Sens. 2021, 6, 2218–2224. [Google Scholar] [CrossRef] [PubMed]
- Lin, T.; Lv, X.; Hu, Z.; Xu, A.; Feng, C. Semiconductor Metal Oxides as Chemoresistive Sensors for Detecting Volatile Organic Compounds. Sensors 2019, 19, 233. [Google Scholar] [CrossRef] [Green Version]
- Acharyya, S.; Jana, B.; Nag, S.; Saha, G.; Guha, P.K. Single resistive sensor for selective detection of multiple VOCs employing SnO2 hollowspheres and machine learning algorithm: A proof of concept. Sens. Actuators B Chem. 2020, 321, 128484. [Google Scholar] [CrossRef]
- Zhang, J.; Yu, Y.; Fang, P.; Liu, L.; Yue, H.; Qu, J.; Han, A. Anodization of aluminum in a sealed container. Electrochem. Commun. 2021, 129, 107086. [Google Scholar] [CrossRef]
- Subin David, S.P.; Veeralakshmi, S.; Sandhya, J.; Nehru, S.; Kalaiselvam, S. Room temperature operatable high sensitive toluene gas sensor using chemiresistive Ag/Bi2O3 nanocomposite. Sens. Actuators B Chem. 2020, 320, 128410. [Google Scholar] [CrossRef]
- Ghazi, M.; Janfaza, S.; Tahmooressi, H.; Tasnim, N.; Hoorfar, M. Selective detection of VOCs using microfluidic gas sensor with embedded cylindrical microfeatures coated with graphene oxide. J. Hazard. Mater. 2022, 424, 127566. [Google Scholar] [CrossRef]
- Zhu, L.; Zeng, W.; Ye, H.; Li, Y. Volatile organic compound sensing based on coral rock-like ZnO. Mater. Res. Bull. 2018, 100, 259–264. [Google Scholar] [CrossRef]
- Liu, B.; Zhu, Q.; Pan, Y.; Huang, F.; Tang, L.; Liu, C.; Cheng, Z.; Wang, P.; Ma, J.; Ding, M. Single-Atom Tailoring of Two-Dimensional Atomic Crystals Enables Highly Efficient Detection and Pattern Recognition of Chemical Vapors. ACS Sens. 2022, 7, 1533–1543. [Google Scholar] [CrossRef] [PubMed]
- Jiménez-Garzaa, O.; Guob, L.; Byunc, H.; Carrierid, M.; Bartoluccid, G.; Barrón-Vivancoe, B.; Baccarelli, A. Aberrant promoter methylation in genes related to hematopoietic malignancy in workers exposed to a VOC mixture. Toxicol. Appl. Pharm. 2018, 339, 65–72. [Google Scholar] [CrossRef] [PubMed]
- Kim, D.; Shin, W.; Hong, S.; Jeong, Y.; Jung, G.; Park, J.; Lee, J. Effects of Electrode Structure on H2S Sensing and Low-Frequency Noise Characteristics in In2O3-Based Resistor-Type Gas Sensors. IEEE Sens. J. 2022, 22, 6311–6320. [Google Scholar] [CrossRef]
- Huang, J.; Wu, Y.; Gu, C.; Zhai, M.; Sun, Y.; Liu, J. Fabrication and gas-sensing properties of hierarchically porous ZnO ar-chitectures. Sens. Actuators B Chem. 2011, 155, 126–133. [Google Scholar] [CrossRef]
- Zheng, K.; Yang, T.; Guo, Z. Porous Pb-Doped ZnO Nanobelts with Enriched Oxygen Vacancies: Preparation and Their Chemoreceptive Sensing Performance. Chemosensors 2022, 10, 96. [Google Scholar] [CrossRef]
- Hemmati, S.; Anaraki Firooz, A.; Khodadadi, A.; Mortazavi, Y. Nanostructured SnO2-ZnO sensors: Highly sensitive and selective to ethanol. Sens. Actuators B Chem. 2011, 160, 1298–1303. [Google Scholar] [CrossRef]
- Gu, C.; Shanshan, L.; Huang, J.; Shi, C.; Liu, J. Preferential growth of long ZnO nanowires and its application in gas sensor. Sens. Actuators B Chem. 2013, 177, 453–459. [Google Scholar] [CrossRef]
- Bai, S.; Guo, J.; Shua, X.; Xiang, X.; Luo, R.; Li, D.; Chen, A.; Liu, C. Surface functionalization of Co3O4 hollow spheres with ZnO nanoparticles for modulating sensing properties of formaldehyde. Sens. Actuators B Chem. 2017, 245, 359–368. [Google Scholar] [CrossRef]
- Iwata, T.; Saeki, M.; Okura, Y.; Yoshikawa, T. Gas discrimination based on enhanced gas-species related information obtained by a single gas sensor with novel temperature modulation. Sens. Actuators B Chem. 2022, 354, 131225. [Google Scholar] [CrossRef]
- Meng, F.; Ji, H.; Yuan, Z.; Chen, Y.; Zhang, H.; Qin, W.; Gao, H. Dynamic Measurement and Recognition Methods of SnO2 Sensor to VOCs Under Zigzag-Rectangular Wave Temperature Modulation. IEEE Sens. J. 2021, 21, 10915–10922. [Google Scholar] [CrossRef]
- Hossein-Babaei, F.; Amini, A. A breakthrough in gas diagnosis with a temperature-modulated generic metal oxide gas sensor. Sens. Actuators B Chem. 2012, 166–167, 419–425. [Google Scholar] [CrossRef]
- Bouricha, B.; Sekrafi, T.; Labidi, A.; Dridi, C. VOCs Identification Method Based on One Single ZnTTP Sensor. IEEE Sens. J. 2022, 22, 671–677. [Google Scholar] [CrossRef]
- Gaggiotti, S.; Hurotb, C.; Weerakkodyb, J.; Matheyb, R.; Buhotb, A.; Mascinia, M.; Houb, Y.; Compagnone, D. Development of an optoelectronic nose based on surface plasmon resonance imaging with peptide and hairpin DNA for sensing volatile organic compounds. Sens. Actuators B Chem. 2020, 303, 127188. [Google Scholar] [CrossRef]
- Ji, H.; Qin, W.; Yuan, Z.; Meng, F. Qualitative and quantitative recognition method of drug-producing chemicals based on SnO2 gas sensor with dynamic measurement and PCA weak separation. Sens. Actuators B Chem. 2021, 348, 130698. [Google Scholar] [CrossRef]
- Yuan, Z.; Han, E.; Meng, F.; Zuo, K. Detection and Identification of Volatile Organic Compounds Based on Temperature Modulated ZnO Sensors. IEEE Trans. Instrum. Meas. 2020, 69, 4533–4544. [Google Scholar] [CrossRef]
- Pan, J.; Yang, A.; Wang, D.; Chu, J.; Lei, F.; Wang, X.; Rong, M. Lightweight Neural Network for Gas Identification Based on Semiconductor Sensor. IEEE Trans. Instrum. Meas. 2022, 71, 1–8. [Google Scholar] [CrossRef]
- Meng, F.; Shi, X.; Yuan, Z.; Ji, H.; Qin, W.; Shen, Y.; Xing, Z. Detection of four alcohol homologue gases by ZnO gas sensor in dynamic interval temperature modulation mode. Sens. Actuators B Chem. 2022, 350, 130867. [Google Scholar] [CrossRef]
- Chu, X.; Zhu, X.; Dong, Y.; Zhang, W.; Bai, L. Formaldehyde Sensing Properties of SnO–Graphene Composites Prepared via Hydrothermal Method. J. Mater. Sci. Technol. 2015, 31, 913–917. [Google Scholar] [CrossRef]
- Dong, X.; Han, Q.; Kang, Y.; Li, H.; Huang, X.; Fang, Z.; Yuan, H.; Chi, Z.; Wu, G.; Xie, W. Rational construction and triethylamine sensing performance of foam shaped α-MoO3@SnS2 nanosheets. Chin. Chem. Lett. 2022, 33, 567–572. [Google Scholar] [CrossRef]
- Chu, X.; Liang, S.; Sun, W.; Zhang, W.; Chen, T.; Zhang, Q. Trimethylamine sensing properties of sensors based on MoO3 microrods. Sens. Actuators B Chem. 2010, 148, 399–403. [Google Scholar] [CrossRef]
- Chu, X.; Zhou, S.; Zhang, W.; Shui, H. Trimethylamine sensing properties of nano-LaFeO3 prepared using solid-state reaction in the presence of PEG400. Mater. Sci. Eng. 2009, 164, 65–69. [Google Scholar] [CrossRef]
- Jaballah, S.; Alaskar, Y.; Alshunaifi, I.; Ghiloufi, I.; Neri, G.; Bouzidi, C.; Dahman, H.; El Mir, L. Effect of Al and Mg Doping on Reducing Gases Detection of ZnO Nanoparticles. Chemosensors 2021, 9, 300. [Google Scholar] [CrossRef]
- Shen, X.; Shi, G.; Zhang, Y.; Weng, S. Wireless Volatile Organic Compound Detection for Restricted Internet of Things Environments Based on Cataluminescence Sensors. Chemosensors 2022, 10, 179. [Google Scholar] [CrossRef]
Figure 1.
Synthesis of ZnO nanomaterials.

Figure 2.
The diagram of the experimental apparatus.

Figure 3.
The heating waveforms (a) TW-1 (b) TW-2 (c) TW-3.

Figure 4.
The characterizations of ZnO nanoparticles (a) XRD (b) EDS.

Figure 5.
(a) The plots of Zn and O elements at different positions (b) three different positions of electron image.
Figure 5.
(a) The plots of Zn and O elements at different positions (b) three different positions of electron image.

Figure 6.
(a) The concentration gradient diagram of peak gas concentrations of four alcohol homologues under TW-1 (b) The first peak and secondary peak concentration gradients of four alcohol homologues under TW-1.
Figure 6.
(a) The concentration gradient diagram of peak gas concentrations of four alcohol homologues under TW-1 (b) The first peak and secondary peak concentration gradients of four alcohol homologues under TW-1.

Figure 7.
The dynamic response signal curves of ethyl alcohol-based on (a) TW-2 and (b) TW-3.

Figure 8.
The dynamic response signal curves based on TW-2 (a) n-propyl alcohol (b) isopropyl alcohol (c) n-butyl alcohol.
Figure 8.
The dynamic response signal curves based on TW-2 (a) n-propyl alcohol (b) isopropyl alcohol (c) n-butyl alcohol.

Figure 9.
The dynamic response signal curves based on TW-3 (a) n-propyl alcohol (b) isopropyl alcohol (c) n-butyl alcohol.
Figure 9.
The dynamic response signal curves based on TW-3 (a) n-propyl alcohol (b) isopropyl alcohol (c) n-butyl alcohol.

Figure 10.
The diagram between characteristic peak output currents vs ppm of four alcohol homologue gases under TW-3.
Figure 10.
The diagram between characteristic peak output currents vs ppm of four alcohol homologue gases under TW-3.

Figure 11.
The 100–500 ppm concentration gradient curve under TW-3 of four alcohol homologues gases. (a) ethyl alcohol (b) n-propyl alcohol (c) isopropyl alcohol (d) n-butyl alcohol.
Figure 11.
The 100–500 ppm concentration gradient curve under TW-3 of four alcohol homologues gases. (a) ethyl alcohol (b) n-propyl alcohol (c) isopropyl alcohol (d) n-butyl alcohol.

Figure 12.
The proportion of dimensions and information.

Publisher’s Note: MDPI stays neutral with regard to jurisdictional claims in published maps and institutional affiliations. |
© 2022 by the authors. Licensee MDPI, Basel, Switzerland. This article is an open access article distributed under the terms and conditions of the Creative Commons Attribution (CC BY) license (https://creativecommons.org/licenses/by/4.0/).
Share and Cite
MDPI and ACS Style
Shi, X.; Zhang, H.; Ji, H.; Meng, F. Dynamic Measurement of VOCs with Multiple Characteristic Peaks Based on Temperature Modulation of ZnO Gas Sensor. Chemosensors 2022, 10, 226. https://0-doi-org.brum.beds.ac.uk/10.3390/chemosensors10060226
AMA Style
Shi X, Zhang H, Ji H, Meng F. Dynamic Measurement of VOCs with Multiple Characteristic Peaks Based on Temperature Modulation of ZnO Gas Sensor. Chemosensors. 2022; 10(6):226. https://0-doi-org.brum.beds.ac.uk/10.3390/chemosensors10060226
Chicago/Turabian StyleShi, Xue, Hua Zhang, Hanyang Ji, and Fanli Meng. 2022. "Dynamic Measurement of VOCs with Multiple Characteristic Peaks Based on Temperature Modulation of ZnO Gas Sensor" Chemosensors 10, no. 6: 226. https://0-doi-org.brum.beds.ac.uk/10.3390/chemosensors10060226
Note that from the first issue of 2016, this journal uses article numbers instead of page numbers. See further details here.