
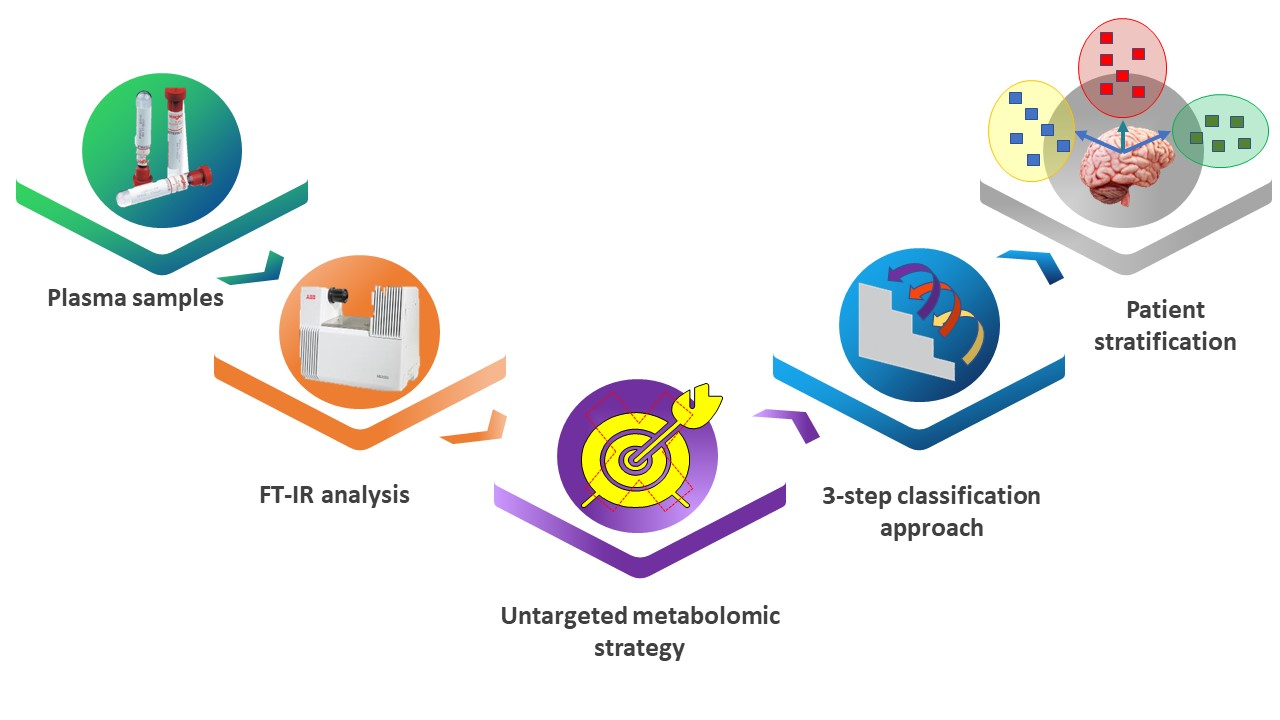
Extraction of Reduced Infrared Biomarker Signatures for the Stratification of Patients Affected by Parkinson’s Disease: An Untargeted Metabolomic Approach


Abstract
:
1. Introduction
Aim of the Study
2. Materials and Methods
2.1. Study Population
2.2. Collection and Handling of Plasma Samples
2.3. Instrument
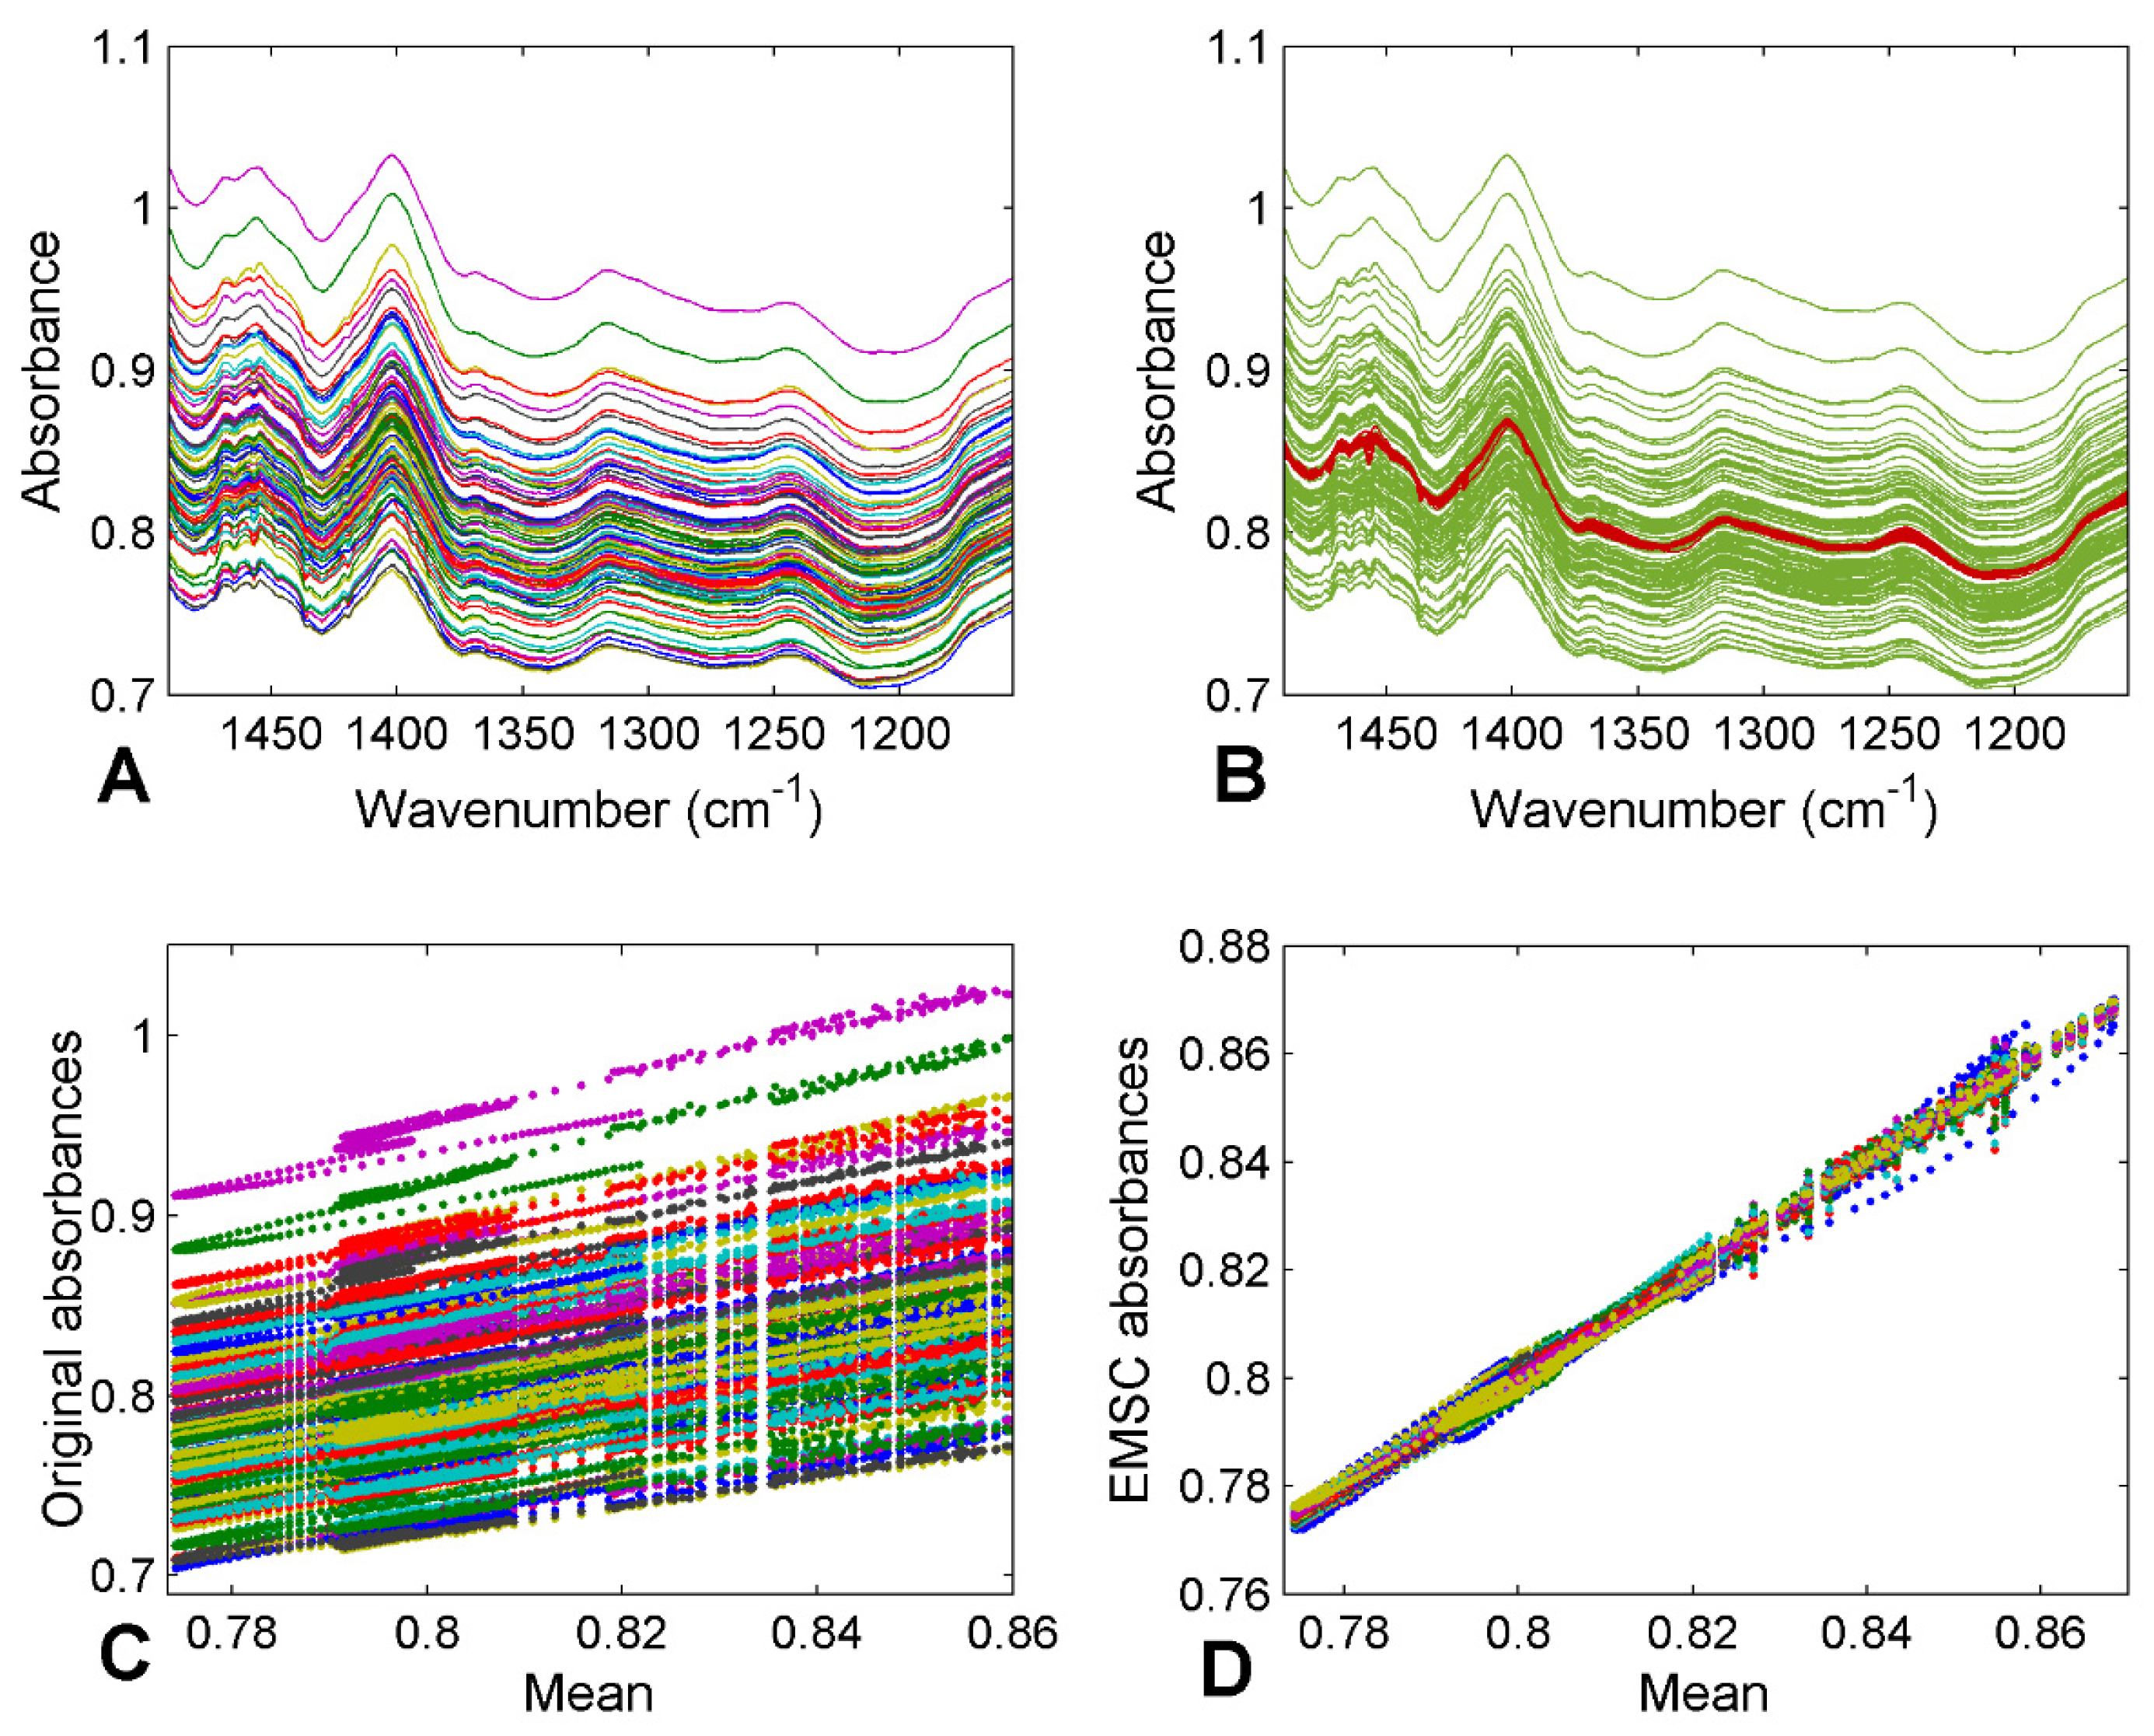
2.4. Pre-Processing of Spectra
2.5. Data Analysis
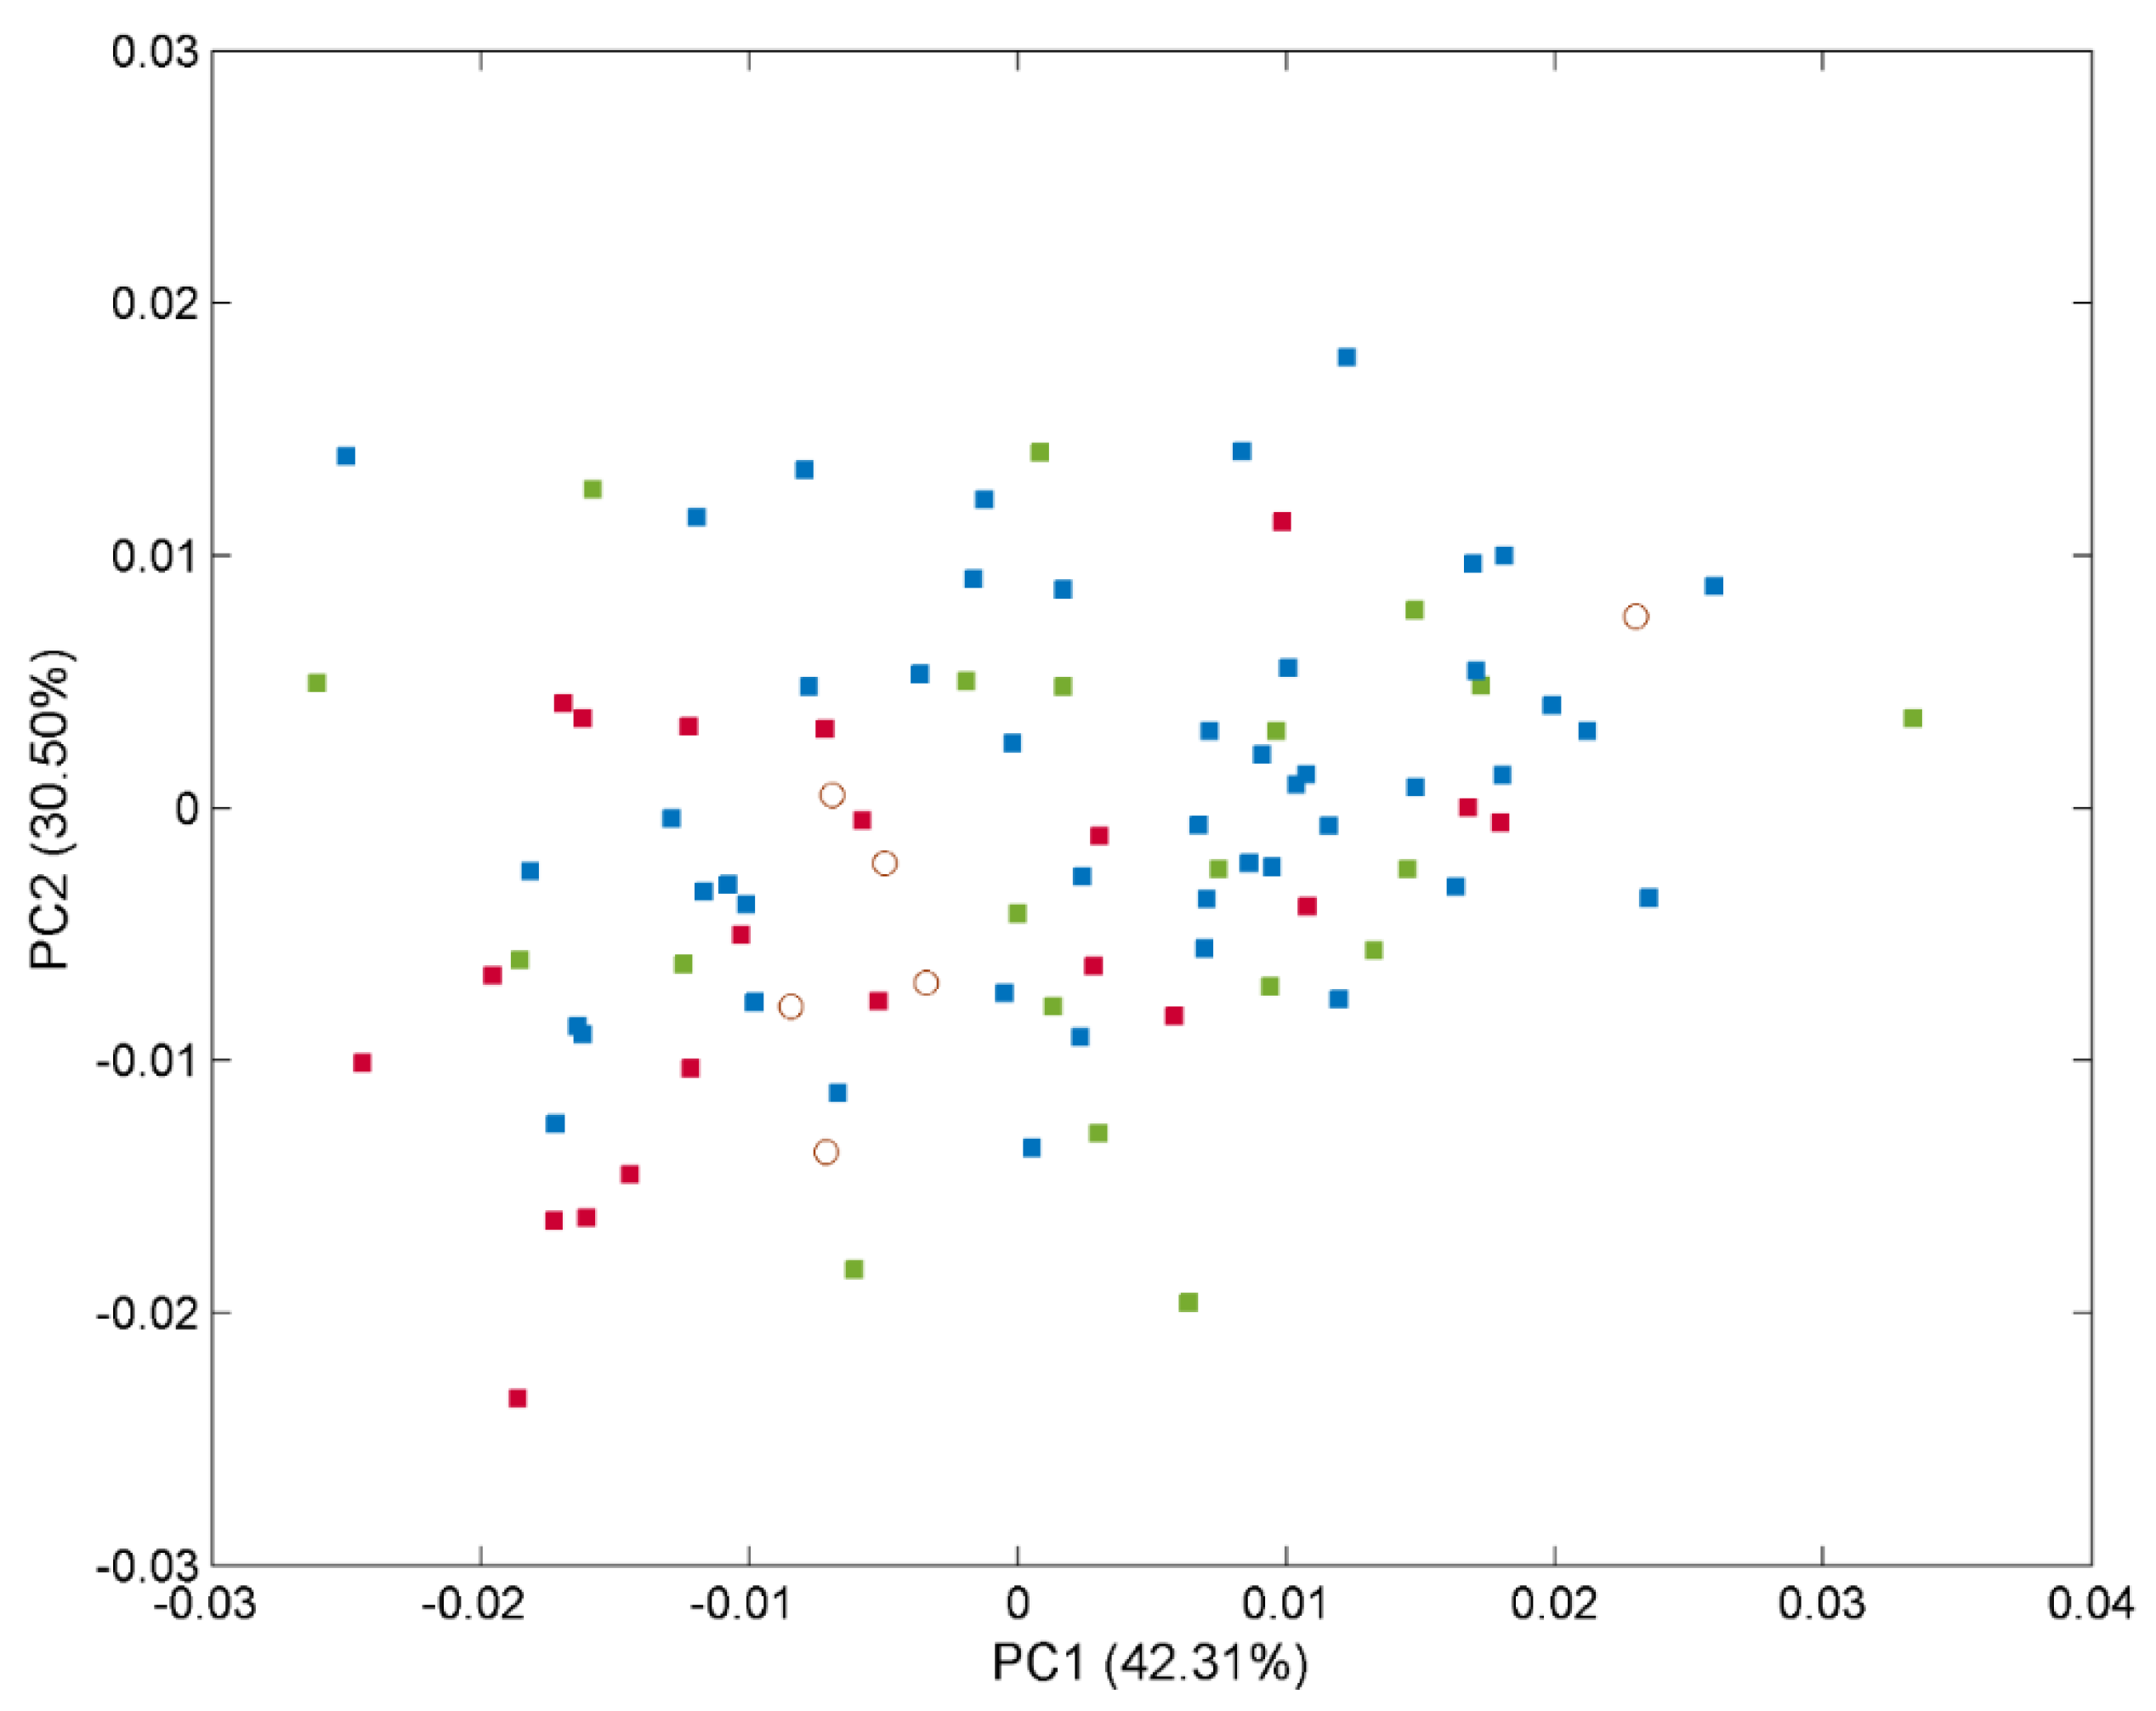
2.5.1. PCA
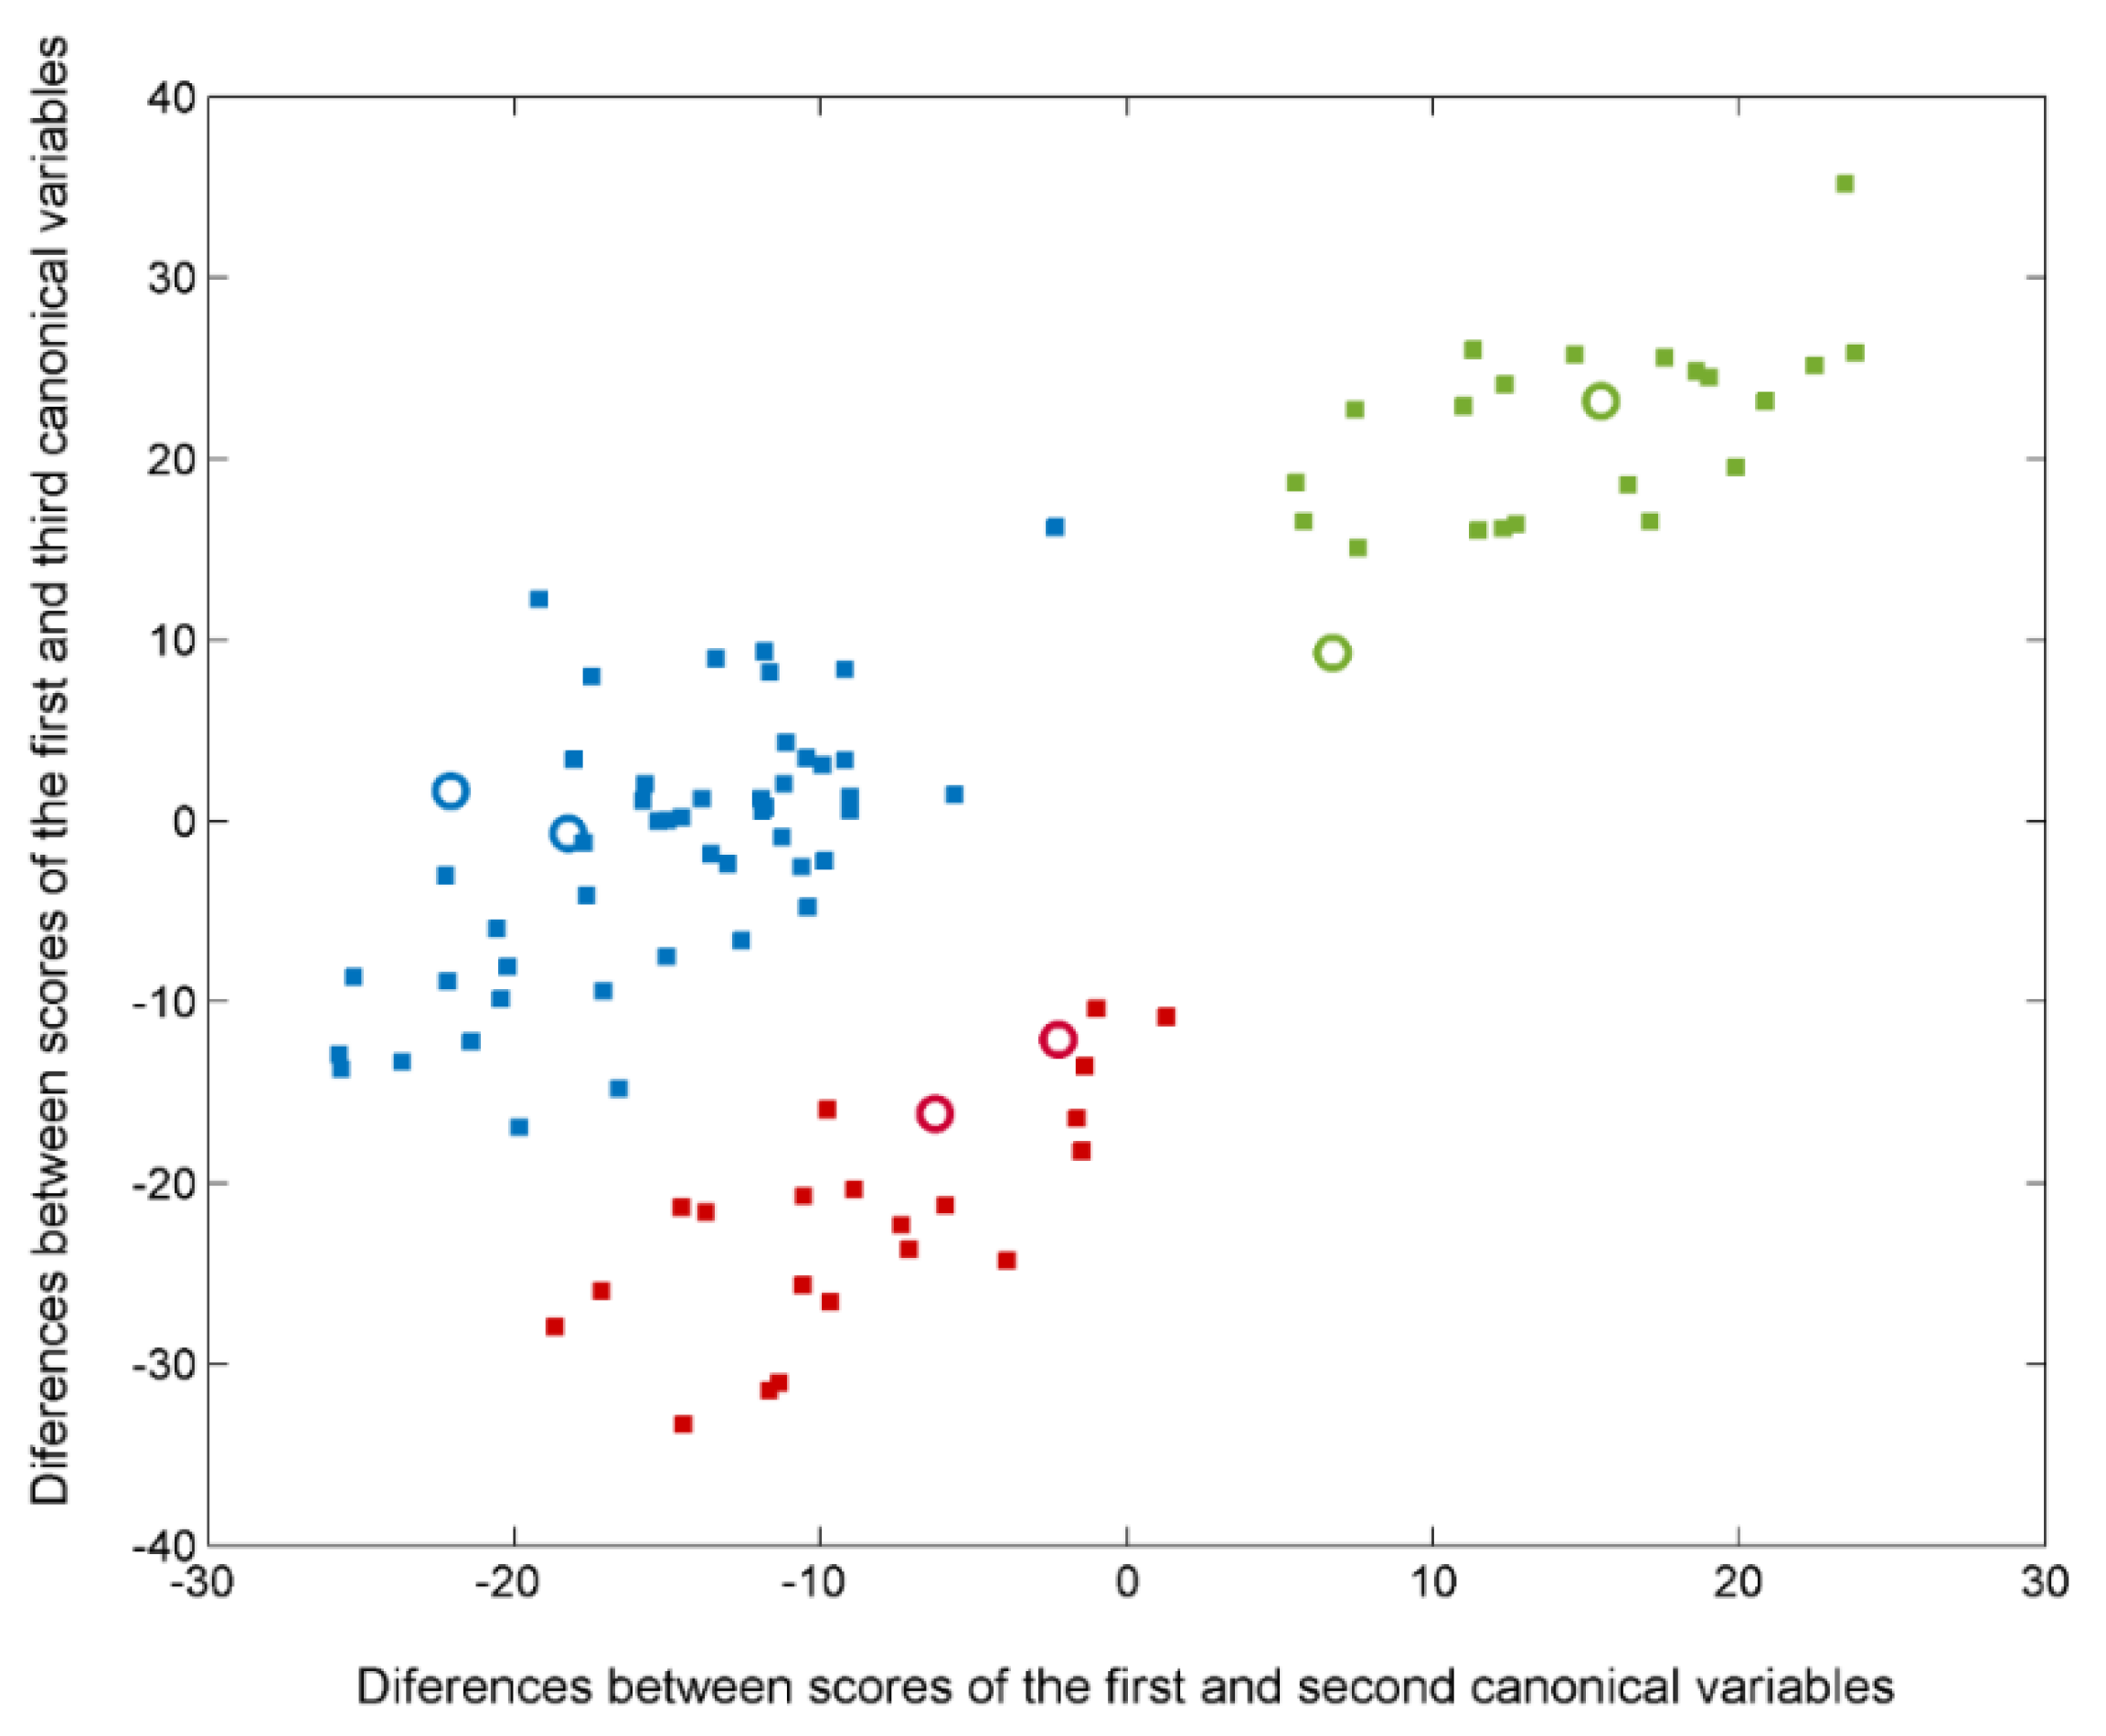
2.5.2. Classification Methods
- -
- Total classification (prediction) rate (TR)
- -
- Category c rate (Rc)where mcc is the number of correct classifications (predictions) for a certain category c, is the total number of correct classifications (predictions), Nc is the number of classifications (predictions) for a certain category c, and N is the total number of classifications (total predictions). Since an object can be classified several times during cross-validation, Nc is not always equal to the number of samples belonging to class c, just as N does not always represent the total number of objects.
3. Results
3.1. FTIR Spectral Profiles
3.2. Global Classification: 3-Class Approach for Discriminating Patients with PD, AD, and Healthy Controls
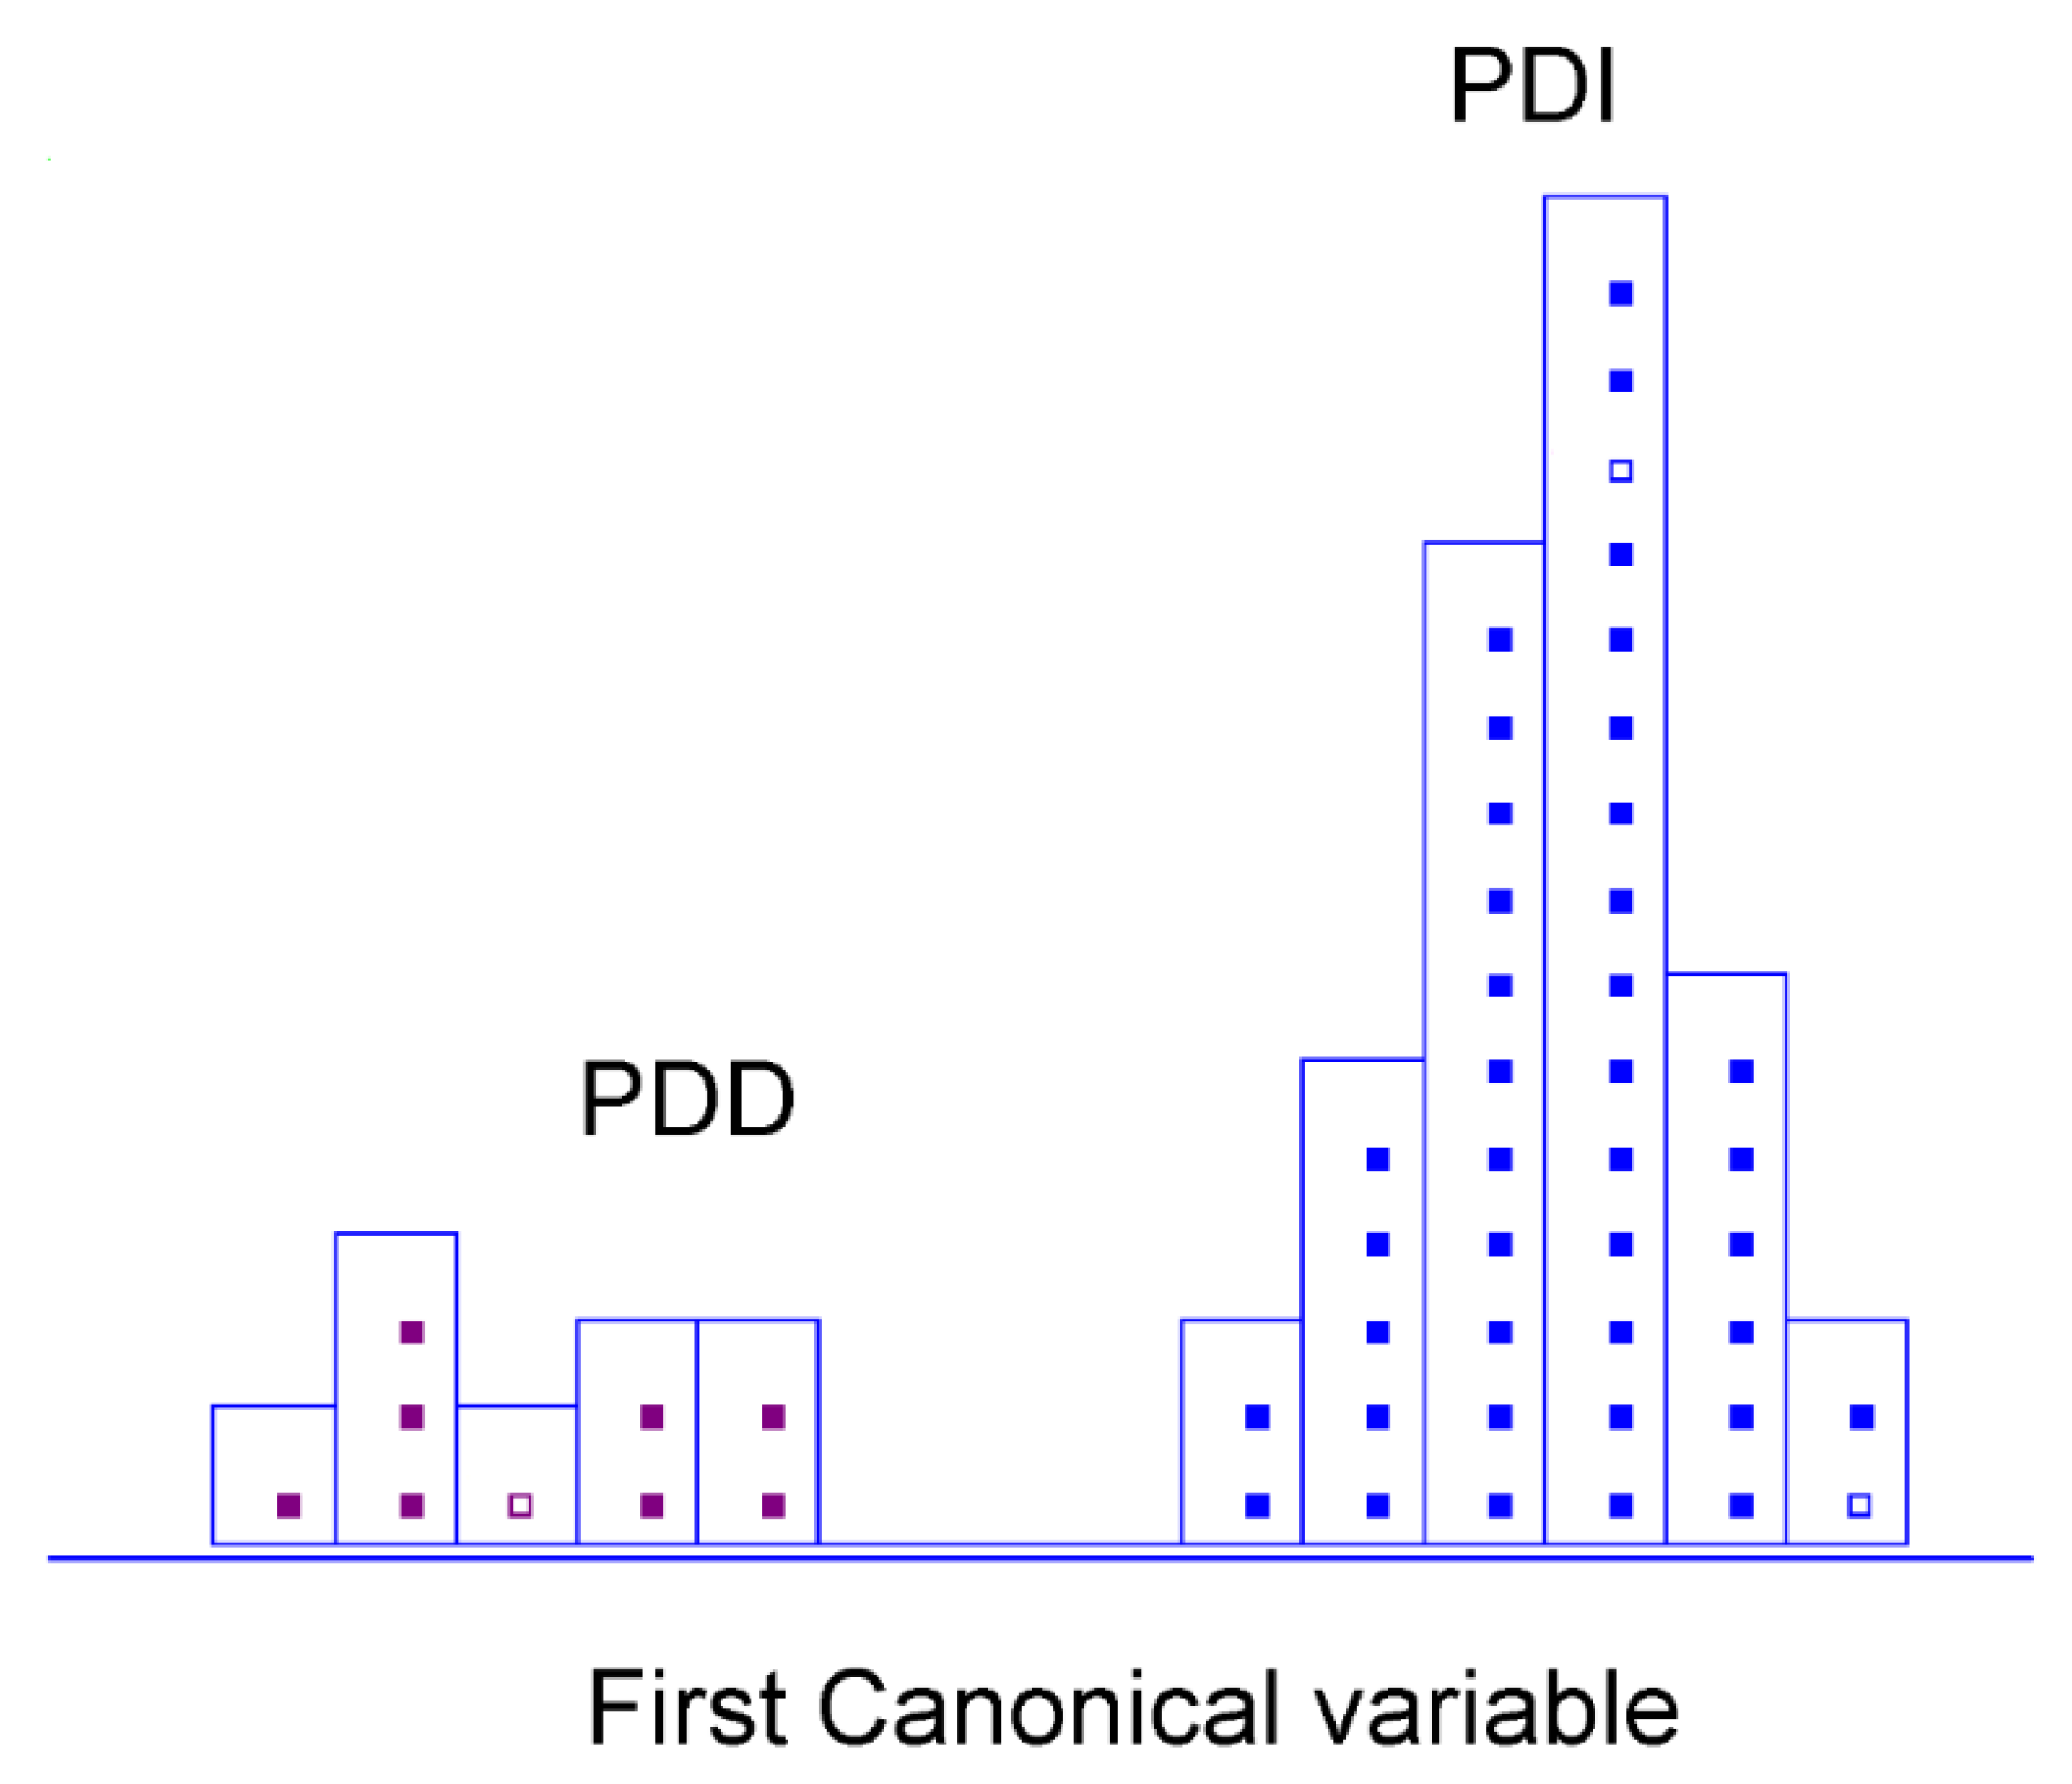
3.3. PD Stratification: 2-Class Approach for Discriminating between Patients with Early-Stage PD and PD-Related Dementia
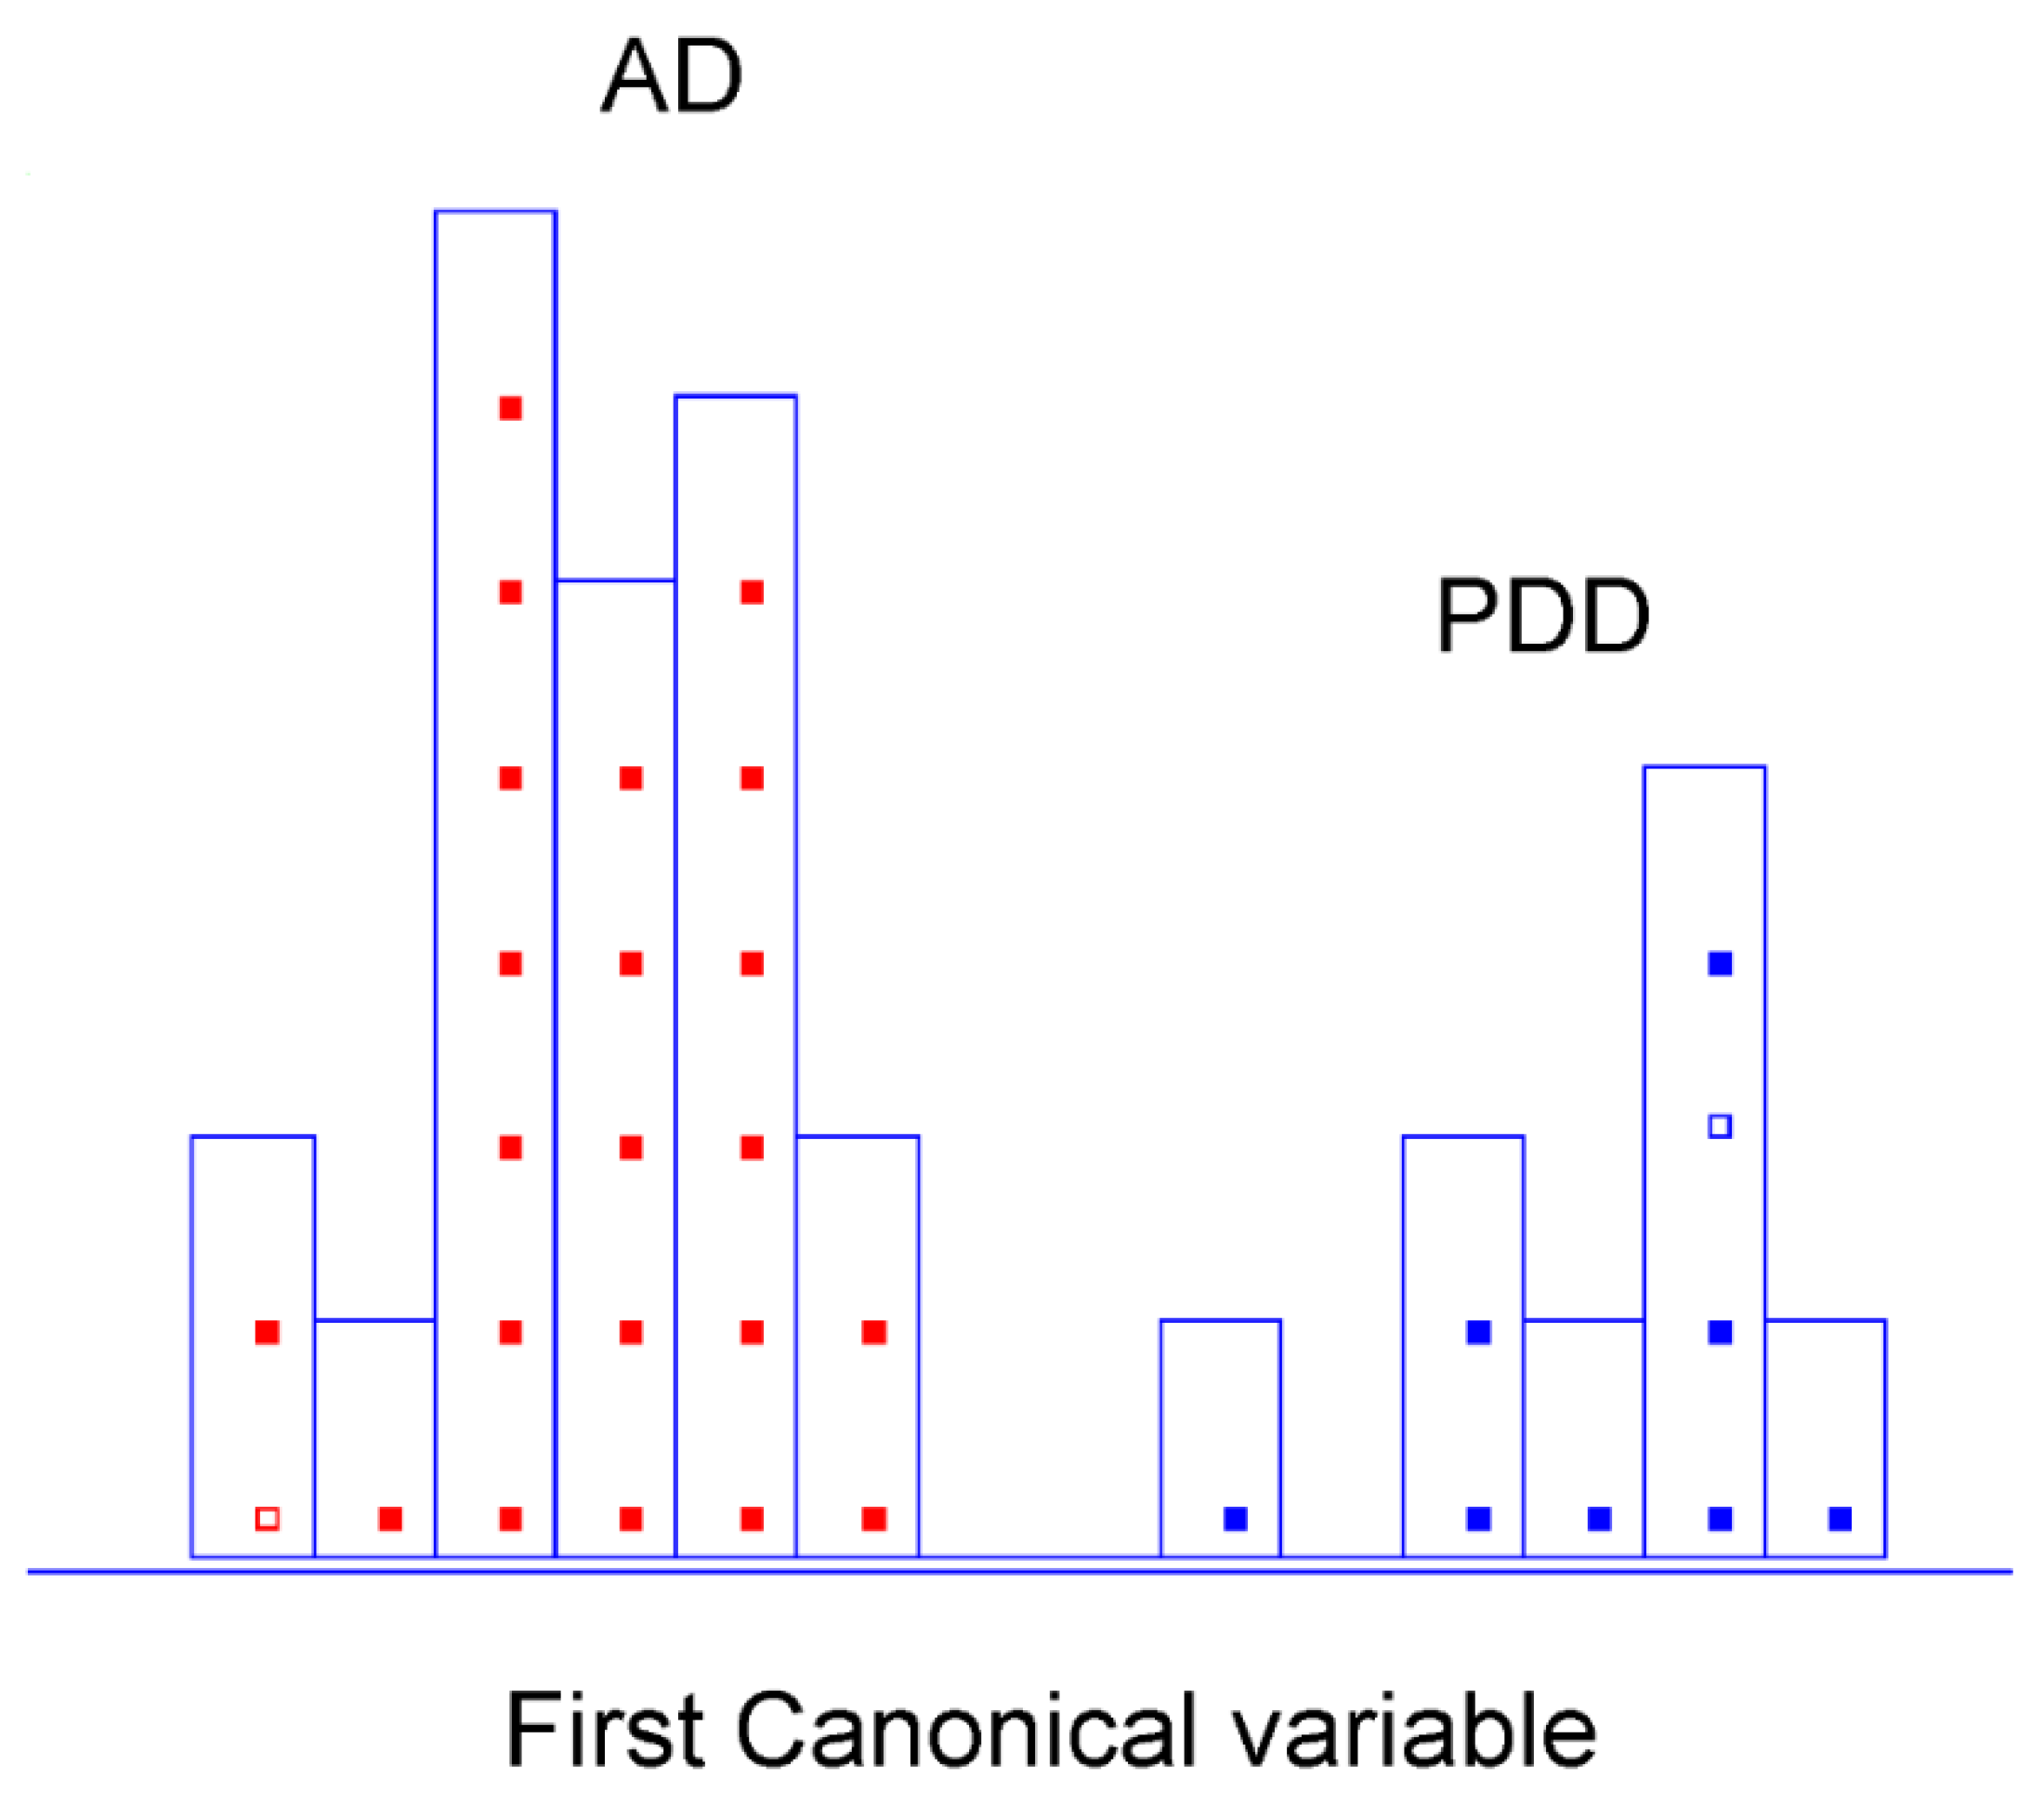
3.4. Dementia Type Differentiation: 2-Class Approach for Discriminating between Patients with PD-Related Dementia and Alzheimer’s Dementia
4. Discussion
Limit of the Study
5. Conclusions
Author Contributions
Funding
Institutional Review Board Statement
Informed Consent Statement
Data Availability Statement
Acknowledgments
Conflicts of Interest
Abbreviations
Appendix A

| Spectral Regions in Literature | Peak Position (cm−1) ± 1 | Tentative Band Assignment | Contributions |
|---|---|---|---|
| ~1155 | 1156, 1159 | sym. (CO-O-C) | Carbohydrates |
| ~1185–1120 | 1171, 1182 | (C-C) and (O-P-O); (C-O) ring vibrations | Nucleic acid “sugars” |
| ~1225 | 1215 | asym. (O-P-O) | Nucleic acids, phospholipids |
| ~1250–1220 | 1253 | sym. (P = O) of the PO2 groups | Nucleic acids, phospholipids |
| ~1360–1220 | 1266, 1271, 1284, 1286, 1288, 1289, 1294, 1302, 1312, 1316, 1319, 1335, 1336, 1377 | (C-C) and (C-O) (C-N) and C-(NO2) sym. (PO2), predominantly (C-N) with significant contributions from (CH2) of carbohydrate residues, δ (CH2) | Amide III band, proteins |
| ~1370 | 1377 | sym. def. CH3 and sym. def. CH2 | Proteins, amino acids (cytosine, guanine, proline) lipids, phospholipids |
| ~1400 | 1403 | (C = O) of (COO) group | Fatty acids and amino acids |
| ~1420 | 1424 | sym. (COO), δ asym. (CH2) | Polysaccharides |
| ~1455–1450 | 1455 | δ asym. (CH3) and (CH2) modes | Proteins, lipids |
| ~1490–1470 | 1474, 1477, 1489 | δ (CH2) | Lipids |
| Spectral Regions in Literature | Peak Position (cm−1) ± 1 | Tentative Band Assignment | Contributions |
|---|---|---|---|
| ~1185–1120 | 1170, 1171 | (C-C) and (O-P-O); (C-O) ring vibrations | Nucleic acid “sugars” |
|
~1233 ~1225 | 1214, 1224, 1226 | asym. (O-P-O) | Nucleic acids; phospholipids; uric ring vibrations |
| ~1360–1220 | 1292, 1294, 1297, 1342 | ); sym. (PO2) predominantly (C-N) with significant contributions from (CH2) of carbohydrate residues; δ (CH2) | Amide III band; proteins; collagen |
| ~1420 | 1435, 1437 | sym. (COO); δ (CH2) | Polysaccharides |
| ~1455–1450 | 1443, 1445 | δ asym. (CH3) and (CH2) modes | Proteins; lipids |
| ~1490–1470 | 1475, 1476 | δ (CH2) | Lipids |
| Spectral Regions in Literature | Peak Position (cm−1 | Tentative Band Assignment | Contributions |
|---|---|---|---|
| ~1185–1120 | 1187, 1188 | (C-C) and (O-P-O) (C-O) ring vibrations | Nucleic acid “sugars” |
| ~1360–1220 | 1277 1340 | (C-C) and (C-O) ) sym. (PO2) (C-N) with significant contributions from (CH2) of carbohydrate residues, δ (CH2) | Amide III band; proteins; collagen |
| ~1370 | 1379, 1380, 1382 | sym. def. CH3 and sym. def. CH2 | Proteins; amino acids (cytosine, guanine, proline) Lipids; phospholipids |
| ~1405–1400 | 1402 | (C = O) of (COO) group (C = C) | Fatty acids; amino acids; (aspartate, glutamate) Uric acid |
| ~1490–1470 | 1487, 1488 | δ (CH2) | Lipids |
References
- Mhyre, T.R.; Boyd, J.T.; Hamill, R.W.; Maguire-Zeiss, K.A. Parkinson’s Disease. Subcell. Biochem. 2012, 65, 389–455. [Google Scholar] [CrossRef] [PubMed] [Green Version]
- Selkoe, D.J.; Peter, J.; Lansbury, J. Alzheimer’s Disease Is the Most Common Neurodegenerative Disorder. Basic Neurochem. Mol. Cell. Med. Asp. 1999, 6, 101–102. [Google Scholar]
- Rizek, P.; Kumar, N.; Jog, M.S. An Update on the Diagnosis and Treatment of Parkinson Disease. CMAJ 2016, 188, 1157–1165. [Google Scholar] [CrossRef] [Green Version]
- Meade, R.M.; Fairlie, D.P.; Mason, J.M. Alpha-Synuclein Structure and Parkinson’s Disease. Mol. Neurodegener. 2019, 14, 29. [Google Scholar] [CrossRef] [Green Version]
- Rocha, E.M.; De Miranda, B.; Sanders, L.H. Alpha-Synuclein: Pathology, Mitochondrial Dysfunction and Neuroinflammation in Parkinson’s Disease. Neurobiol. Dis. 2018, 109, 249–257. [Google Scholar] [CrossRef]
- Goldman, J.G.; Andrews, H.; Amara, A.; Naito, A.; Alcalay, R.N.; Shaw, L.M.; Taylor, P.; Xie, T.; Tuite, P.; Henchcliffe, C.; et al. Cerebrospinal Fluid, Plasma, and Saliva in the BioFIND Study: Relationships among Biomarkers and Parkinson’s Disease Features. Mov. Disord. 2018, 33, 282–288. [Google Scholar] [CrossRef] [Green Version]
- Gnanalingham, K.K.; Byrne, E.J.; Thornton, A.; Sambrook, M.A.; Bannister, P. Motor and Cognitive Function in Lewy Body Dementia: Comparison with Alzheimer’s and Parkinson’s Diseases. J. Neurol. Neurosurg. Psychiatry 1997, 62, 243–252. [Google Scholar] [CrossRef]
- Tofaris, G.K. A Critical Assessment of Exosomes in the Pathogenesis and Stratification of Parkinson’s Disease. J. Parkinsons Dis. 2017, 7, 569–576. [Google Scholar] [CrossRef] [Green Version]
- D’Andrea, G.; Pizzolato, G.; Gucciardi, A.; Stocchero, M.; Giordano, G.; Baraldi, E.; Leon, A. Different Circulating Trace Amine Profiles in De Novo and Treated Parkinson’s Disease Patients. Sci. Rep. 2019, 9, 6151. [Google Scholar] [CrossRef]
- Picca, A.; Calvani, R.; Landi, G.; Marini, F.; Biancolillo, A.; Gervasoni, J.; Persichilli, S.; Primiano, A.; Urbani, A.; Bossola, M.; et al. Circulating Amino Acid Signature in Older People with Parkinson’s Disease: A Metabolic Complement to the EXosomes in PArkiNson Disease (EXPAND) Study. Exp. Gerontol. 2019, 128, 110766. [Google Scholar] [CrossRef]
- Trošt, M.; Perovnik, M.; Pirtošek, Z. Correlations of Neuropsychological and Metabolic Brain Changes in Parkinson’s Disease and Other α-Synucleinopathies. Front. Neurol. 2019, 10, 1204. [Google Scholar] [CrossRef] [PubMed]
- Galvagnion, C. The Role of Lipids Interacting with α-Synuclein in the Pathogenesis of Parkinson’s Disease. J. Parkinsons Dis. 2017, 7, 433–450. [Google Scholar] [CrossRef] [PubMed] [Green Version]
- Jenner, P.; Dexter, D.T.; Sian, J.; Schapira, A.H.V.; Marsden, C.D. Oxidative Stress as a Cause of Nigral Cell Death in Parkinson’s Disease and Incidental Lewy Body Disease. Ann. Neurol. 1992, 32, S82–S87. [Google Scholar] [CrossRef] [PubMed]
- Yu, Z.; Zhang, S.; Wang, D.; Fan, M.; Gao, F.; Sun, W.; Li, Z.; Li, S. The significance of uric acid in the diagnosis and treatment of Parkinson disease: An updated systemic review. Medicine 2017, 96, e8502. [Google Scholar] [CrossRef] [PubMed]
- Zhong, L.-L.; Song, Y.-Q.; Tian, X.-Y.; Cao, H.; Ju, K.-J. Level of Uric Acid and Uric Acid/Creatinine Ratios in Correlation with Stage of Parkinson Disease. Medicine 2018, 97, e10967. [Google Scholar] [CrossRef] [PubMed]
- Marques, A.; Dutheil, F.; Durand, E.; Rieu, I.; Mulliez, A.; Fantini, M.L.; Boirie, Y.; Durif, F. Glucose Dysregulation in Parkinson’s Disease: Too Much Glucose or Not Enough Insulin? Parkinsonism Relat. Disord. 2018, 55, 122–127. [Google Scholar] [CrossRef] [PubMed]
- Anichtchik, O.V.; Peitsaro, N.; Anichtchik, O.V.; Rinne, J.O.; Kalimo, H.; Kalimo, H.; Panula, P. Distribution and Modulation of Histamine H3 Receptors in Basal Ganglia and Frontal Cortex of Healthy Controls and Patients with Parkinson’s Disease. Neurobiol. Dis. 2001, 8, 707–716. [Google Scholar] [CrossRef] [Green Version]
- Shan, L.; Swaab, D.F.; Bao, A.M. Neuronal Histaminergic System in Aging and Age-Related Neurodegenerative Disorders. Exp. Gerontol. 2013, 48, 603–607. [Google Scholar] [CrossRef]
- Hertel, J.; Harms, A.C.; Heinken, A.; Baldini, F.; Thinnes, C.C.; Glaab, E.; Vasco, D.A.; Pietzner, M.; Stewart, I.D.; Wareham, N.J.; et al. Integrated Analyses of Microbiome and Longitudinal Metabolome Data Reveal Microbial-Host Interactions on Sulfur Metabolism in Parkinson’s Disease. Cell Rep. 2019, 29, 1767–1777.e8. [Google Scholar] [CrossRef] [Green Version]
- Kataoka, H.; Sugie, K. Serum Adiponectin Levels between Patients with Parkinson’s Disease and Those with PSP. Neurol. Sci. 2020, 41, 1125–1131. [Google Scholar] [CrossRef]
- Maass, F.; Michalke, B.; Willkommen, D.; Leha, A.; Schulte, C.; Tönges, L.; Mollenhauer, B.; Trenkwalder, C.; Rückamp, D.; Börger, M.; et al. Elemental Fingerprint: Reassessment of a Cerebrospinal Fluid Biomarker for Parkinson’s Disease. Neurobiol. Dis. 2020, 134, 104677. [Google Scholar] [CrossRef] [PubMed]
- Espay, A.J.; Kalia, L.V.; Gan-Or, Z.; Williams-Gray, C.H.; Bedard, P.L.; Rowe, S.M.; Morgante, F.; Fasano, A.; Stecher, B.; Kauffman, M.A.; et al. Disease Modification and Biomarker Development in Parkinson Disease: Revision or Reconstruction? Neurology 2020, 94, 481–494. [Google Scholar] [CrossRef] [PubMed] [Green Version]
- Santaella, A.; Kuiperij, H.B.; Van Rumund, A.; Esselink, R.A.J.; Van Gool, A.J.; Bloem, B.R.; Verbeek, M.M. Inflammation Biomarker Discovery in Parkinson’s Disease and Atypical Parkinsonisms. BMC Neurol. 2020, 20, 26. [Google Scholar] [CrossRef] [PubMed] [Green Version]
- Öhman, A.; Forsgren, L. NMR Metabonomics of Cerebrospinal Fluid Distinguishes between Parkinson’s Disease and Controls. Neurosci. Lett. 2015, 594, 36–39. [Google Scholar] [CrossRef] [PubMed]
- Obeso, J.A.; Stamelou, M.; Goetz, C.G.; Poewe, W.; Lang, A.E.; Weintraub, D.; Burn, D.; Halliday, G.M.; Bezard, E.; Przedborski, S.; et al. Past, Present, and Future of Parkinson’s Disease: A Special Essay on the 200th Anniversary of the Shaking Palsy. Mov. Disord. 2017, 32, 1264–1310. [Google Scholar] [CrossRef]
- Ohmichi, T.; Mitsuhashi, M.; Tatebe, H.; Kasai, T.; Ali El-Agnaf, O.M.; Tokuda, T. Quantification of Brain-Derived Extracellular Vesicles in Plasma as a Biomarker to Diagnose Parkinson’s and Related Diseases. Parkinsonism Relat. Disord. 2019, 61, 82–87. [Google Scholar] [CrossRef]
- Ahmed, S.S.; Santosh, W.; Kumar, S.; Christlet, H.T.T. Metabolic Profiling of Parkinson’s Disease: Evidence of Biomarker from Gene Expression Analysis and Rapid Neural Network Detection. J. Biomed. Sci. 2009, 16, 63. [Google Scholar] [CrossRef] [Green Version]
- Shao, Y.; Le, W. Recent Advances and Perspectives of Metabolomics-Based Investigations in Parkinson’s Disease. Mol. Neurodegener. 2019, 14, 3. [Google Scholar] [CrossRef] [PubMed] [Green Version]
- Figura, M.; Kuśmierska, K.; Bucior, E.; Szlufik, S.; Koziorowski, D.; Jamrozik, Z.; Janik, P. Serum Amino Acid Profile in Patients with Parkinson’s Disease. PLoS ONE 2018, 13, e191670. [Google Scholar] [CrossRef]
- Dashti, H.; Westler, W.M.; Tonelli, M.; Wedell, J.R.; Markley, J.L.; Eghbalnia, H.R. Spin System Modeling of Nuclear Magnetic Resonance Spectra for Applications in Metabolomics and Small Molecule Screening. Anal. Chem. 2017, 89, 12201–12208. [Google Scholar] [CrossRef]
- Antcliffe, D.; Jiménez, B.; Veselkov, K.; Holmes, E.; Gordon, A.C. Metabolic Profiling in Patients with Pneumonia on Intensive Care. EBioMedicine 2017, 18, 244–253. [Google Scholar] [CrossRef] [PubMed] [Green Version]
- Bereman, M.S.; Kirkwood, K.I.; Sabaretnam, T.; Furlong, S.; Rowe, D.B.; Guillemin, G.J.; Mellinger, A.L.; Muddiman, D.C. Metabolite Profiling Reveals Predictive Biomarkers and the Absence of β-Methyl Amino-l-Alanine in Plasma from Individuals Diagnosed with Amyotrophic Lateral Sclerosis. J. Proteome Res. 2020, 19, 3276–3285. [Google Scholar] [CrossRef] [PubMed]
- Ros-Mazurczyk, M.; Jelonek, K.; Marczyk, M.; Binczyk, F.; Pietrowska, M.; Polanska, J.; Dziadziuszko, R.; Jassem, J.; Rzyman, W.; Widlak, P. Serum Lipid Profile Discriminates Patients with Early Lung Cancer from Healthy Controls. Lung Cancer 2017, 112, 69–74. [Google Scholar] [CrossRef] [PubMed]
- Yao, L.; Lyu, N.; Chen, J.; Pan, T.; Yu, J. Joint Analyses Model for Total Cholesterol and Triglyceride in Human Serum with Near-Infrared Spectroscopy. Spectrochim. Acta-Part A Mol. Biomol. Spectrosc. 2016, 159, 53–59. [Google Scholar] [CrossRef]
- Khalil, S.K.H.; Azooz, M.A.; Division, P. Application of Vibrational Spectroscopy in Identification of the Composition of the Urinary Stones. J. Appl. Sci. Res. 2007, 3, 387–391. [Google Scholar]
- Selvaraju, R.; Raja, A.; Thiruppathi, G. FT-Raman Spectral Analysis of Human Urinary Stones. Spectrochim. Acta-Part A Mol. Biomol. Spectrosc. 2012, 99, 205–210. [Google Scholar] [CrossRef]
- Roy, S.; Perez-Guaita, D.; Bowden, S.; Heraud, P.; Wood, B.R. Spectroscopy Goes Viral: Diagnosis of Hepatitis B and C Virus Infection from Human Sera Using ATR-FTIR Spectroscopy. Clin. Spectrosc. 2019, 1, 100001. [Google Scholar] [CrossRef]
- Lilo, T.; Morais, C.L.M.; Ashton, K.M.; Pardilho, A.; Davis, C.; Dawson, T.P.; Gurusinghe, N.; Martin, F.L. Spectrochemical Differentiation of Meningioma Tumours Based on Attenuated Total Reflection Fourier-Transform Infrared (ATR-FTIR) Spectroscopy. Anal. Bioanal. Chem. 2020, 412, 1077–1086. [Google Scholar] [CrossRef] [Green Version]
- Carmona, P.; Molina, M.; Calero, M.; Bermejo-Pareja, F.; Martínez-Martín, P.; Toledano, A. Discrimination Analysis of Blood Plasma Associated with Alzheimer’s Disease Using Vibrational Spectroscopy. J. Alzheimer’s Dis. 2013, 34, 911–920. [Google Scholar] [CrossRef] [Green Version]
- Ahmed, S.S.S.J.; Santosh, W.; Kumar, S.; Thanka Christlet, T.H. Neural Network Algorithm for the Early Detection of Parkinson’s Disease from Blood Plasma by FTIR Micro-Spectroscopy. Vib. Spectrosc. 2010, 53, 181–188. [Google Scholar] [CrossRef]
- Li, S.; Liu, J.; Li, G.; Zhang, X.; Xu, F.; Fu, Z.; Teng, L.; Li, Y.; Sun, F. Near-Infrared Light-Responsive, Pramipexole-Loaded Biodegradable PLGA Microspheres for Therapeutic Use in Parkinson’s Disease. Eur. J. Pharm. Biopharm. 2019, 141, 1–11. [Google Scholar] [CrossRef] [PubMed]
- Wang, X.; Wu, Q.; Li, C.; Zhou, Y.; Xu, F.; Zong, L.; Ge, S. A Study of Parkinson’s Disease Patients’ Serum Using FTIR Spectroscopy. Infrared Phys. Technol. 2020, 106, 103279. [Google Scholar] [CrossRef]
- Perez-Guaita, D.; Garrigues, S.; de la, M.; Guardia. Infrared-Based Quantification of Clinical Parameters. TrAC-Trends Anal. Chem. 2014, 62, 93–105. [Google Scholar] [CrossRef]
- Pizarro, C.; Esteban-Díez, I.; Espinosa, M.; Rodríguez-Royo, F.; González-Sáiz, J.M. An NMR-Based Lipidomic Approach to Identify Parkinson’s Disease-Stage Specific Lipoprotein-Lipid Signatures in Plasma. Analyst 2019, 144, 1334–1344. [Google Scholar] [CrossRef] [PubMed]
- Lawton, M.; Baig, F.; Toulson, G.; Morovat, A.; Evetts, S.G.; Ben-Shlomo, Y.; Hu, M.T. Blood Biomarkers with Parkinson’s Disease Clusters and Prognosis: The Oxford Discovery Cohort. Mov. Disord. 2020, 35, 279–287. [Google Scholar] [CrossRef] [Green Version]
- Zhao, H.W.; Lin, J.; Wang, X.B.; Cheng, X.; Wang, J.Y.; Hu, B.L.; Zhang, Y.; Zhang, X.; Zhu, J.H. Assessing Plasma Levels of Selenium, Copper, Iron and Zinc in Patients of Parkinson’s Disease. PLoS ONE 2013, 8, e83060. [Google Scholar] [CrossRef]
- Barth, A. Infrared Spectroscopy of Proteins. Biochim. Biophys. Acta-Bioenerg. 2007, 1767, 1073–1101. [Google Scholar] [CrossRef] [Green Version]
- Pizarro, C.; Arenzana-Rámila, I.; Pérez-del-Notario, N.; Pérez-Matute, P.; González-Sáiz, J.M. Thawing as a Critical Pre-Analytical Step in the Lipidomic Profiling of Plasma Samples: New Standardized Protocol. Anal. Chim. Acta 2016, 912, 1–9. [Google Scholar] [CrossRef]
- Forina, M.; Lanteri, S.; Armanino, C.; Oliveos, M.C.C.; Casolino, M.C.; Casale, M. V-Parvus 2011, an Extendable Package of Programs for Explorative Data Analysis, Classification and Regression Analysis, Dip. Chimica e Tecnologie Farmaceutiche ed Alimentari, University of Genova, Genova (Italy). 2011. Available online: https://iris.unige.it/handle/11567/202703 (accessed on 18 March 2022).
- Tabora, J.E.; Domagalski, N. Multivariate Analysis and Statistics in Pharmaceutical Process Research and Development. Annual Review of Chemical and Biomolecular Engineering. Annu. Rev. Chem. Biomol. Eng. 2017, 8, 403–426. [Google Scholar] [CrossRef]
- Forina, M.; Oliveri, P.; Casale, M. Complete Validation for Classification and Class Modeling Procedures with Selection of Variables and/or with Additional Computed Variables. Chemom. Intell. Lab. Syst. 2010, 102, 110–122. [Google Scholar] [CrossRef]
- Casale, M.; Sáiz Abajo, M.J.; González Sáiz, J.M.; Pizarro, C.; Forina, M. Study of the Aging and Oxidation Processes of Vinegar Samples from Different Origins during Storage by Near-Infrared Spectroscopy. Anal. Chim. Acta 2006, 557, 360–366. [Google Scholar] [CrossRef]
- Worsfold, P.J. Chemometrics: A Textbook (Data Handling in Science and Technology, Vol. 2). Anal. Chim. Acta 1989, 225, 457–458. [Google Scholar] [CrossRef]
- Bury, D.; Morais, C.L.M.; Paraskevaidi, M.; Ashton, K.M.; Dawson, T.P.; Martin, F.L. Spectral Classification for Diagnosis Involving Numerous Pathologies in a Complex Clinical Setting: A Neuro-Oncology Example. Spectrochim. Acta-Part A Mol. Biomol. Spectrosc. 2019, 206, 89–96. [Google Scholar] [CrossRef] [PubMed]
- Mitchell, A.L.; Gajjar, K.B.; Theophilou, G.; Martin, F.L.; Martin-Hirsch, P.L. Vibrational Spectroscopy of Biofluids for Disease Screening or Diagnosis: Translation from the Laboratory to a Clinical Setting. J. Biophotonics 2014, 7, 153–165. [Google Scholar] [CrossRef] [PubMed]
- Zhao, J.; Shi, L.; Zhang, L.R. Neuroprotective Effect of Carnosine against Salsolinol-Induced Parkinson’s Disease. Exp. Ther. Med. 2017, 14, 664–670. [Google Scholar] [CrossRef] [Green Version]
- Cheng, J.S.; Dubal, D.B.; Kim, D.H.; Legleiter, J.; Cheng, I.H.; Yu, G.-Q.; Tesseur, I.; Wyss-Coray, T.; Bonaldo, P.; Mucke, L. Collagen VI Protects Neurons against Aβ Toxicity. Nat. Neurosci. 2009, 12, 119–121. [Google Scholar] [CrossRef] [PubMed] [Green Version]
- Paraskevaidi, M.; Morais, C.L.M.; Lima, K.M.G.; Snowden, J.S.; Saxon, J.A.; Richardson, A.M.T.; Jones, M.; Mann, D.M.A.; Allsop, D.; Martin-Hirsch, P.L.; et al. Differential Diagnosis of Alzheimer’s Disease Using Spectrochemical Analysis of Blood. Proc. Natl. Acad. Sci. USA 2017, 114, E7929–E7938. [Google Scholar] [CrossRef] [Green Version]
- Jim Enez-Jim Enez, F.J.; Alonso-Navarro, H.; Garc Ia-Mart, E.; Ag Undez, J.A.G. Cerebrospinal and Blood Levels of Amino Acids as Potential Biomarkers for Parkinson’s Disease: Review and Meta-Analysis. Eur. J. Neurol. 2020, 2020, 2336–2347. [Google Scholar] [CrossRef]


| 3-Class Approach SELECT-LDA: Global Classification with 30 Variables | |||
|---|---|---|---|
| Classification % | Prediction (CV 10) % | External Prediction % | |
| PD (I + D) | 100.00 | 86.36 | 100.00 |
| AD | 99.79 | 89.58 | 100.00 |
| Control group | 100.00 | 95.24 | 100.00 |
| Total rate | 99.89 | 90.11 | 100.00 |
| 1st Step Differentiation Approach: 30 Biomarkers | |||
|---|---|---|---|
| 3 Global Categories (PD, AD and HC) Differentiation | |||
| Selection Order | Wavenumber (cm−1) | Selection Order | Wavenumber (cm−1) |
| 1 | 1489.9008 | 16 | 1336.5712 |
| 2 | 1171.6696 | 17 | 1289.3187 |
| 3 | 1316.3201 | 18 | 1335.6069 |
| 4 | 1377.0734 | 19 | 1253.6382 |
| 5 | 1319.6382 | 20 | 1182.2773 |
| 6 | 1312.4628 | 21 | 1203.4927 |
| 7 | 1284.4970 | 22 | 1474.4714 |
| 8 | 1271.9606 | 23 | 1302.8194 |
| 9 | 1266.1746 | 24 | 1455.1847 |
| 10 | 1215.0647 | 25 | 1294.1404 |
| 11 | 1156.2402 | 26 | 1334.6425 |
| 12 | 1159.1332 | 27 | 1438.7909 |
| 13 | 1443.1286 | 28 | 1477.3644 |
| 14 | 1286.4257 | 29 | 1424.3259 |
| 15 | 1288.3544 | 30 | 1403.1105 |
| 2-Class Approach SELECT-LDA: Parkinson’s Differentiation with 15 Variables | |||
|---|---|---|---|
| Classification % | Prediction (LOO) % | External Prediction % | |
| PDI | 100.00 | 100.00 | 100.00 |
| PDD | 100.00 | 100.00 | 100.00 |
| Total rate | 100.00 | 100.00 | 100.00 |
| 2nd Step Differentiation Approach: 15 Biomarkers | |
|---|---|
| 2 Categories (PDI and PDD) Differentiation | |
| Selection Order | Wavenumber (cm−1) |
| 1 | 1294.1404 |
| 2 | 1292.2117 |
| 3 | 1437.8266 |
| 4 | 1435.8979 |
| 5 | 1443.6126 |
| 6 | 1475.4357 |
| 7 | 1297.0334 |
| 8 | 1476.4001 |
| 9 | 1342.3572 |
| 10 | 1170.7052 |
| 11 | 1171.6696 |
| 12 | 1226.6368 |
| 13 | 1445.5413 |
| 14 | 1224.7081 |
| 15 | 1214.1004 |
| 2nd-Class Approach SELECT-LDA: Dementia’s Type Differentiation with 10 Variables | |||
|---|---|---|---|
| Classification % | Prediction (CV 10) % | External Prediction % | |
| PDD | 100.00 | 87.50 | 100.00 |
| AD | 100.00 | 100.00 | 100.00 |
| Total rate | 100.00 | 96.67 | 100.00 |
| 3rd Step Differentiation Approach: 10 Biomarkers | |
|---|---|
| 2 Categories (PDD and AD) Differentiation | |
| Selection order | Wavenumber (cm−1) |
| 1 | 1340.4286 |
| 2 | 1487.0078 |
| 3 | 1488.9365 |
| 4 | 1187.0990 |
| 5 | 1277.7466 |
| 6 | 1380.9307 |
| 7 | 1188.0633 |
| 8 | 1379.0020 |
| 9 | 1382.8594 |
| 10 | 1402.1461 |
Publisher’s Note: MDPI stays neutral with regard to jurisdictional claims in published maps and institutional affiliations. |
© 2022 by the authors. Licensee MDPI, Basel, Switzerland. This article is an open access article distributed under the terms and conditions of the Creative Commons Attribution (CC BY) license (https://creativecommons.org/licenses/by/4.0/).
Share and Cite
Tkachenko, K.; Espinosa, M.; Esteban-Díez, I.; González-Sáiz, J.M.; Pizarro, C. Extraction of Reduced Infrared Biomarker Signatures for the Stratification of Patients Affected by Parkinson’s Disease: An Untargeted Metabolomic Approach. Chemosensors 2022, 10, 229. https://0-doi-org.brum.beds.ac.uk/10.3390/chemosensors10060229
Tkachenko K, Espinosa M, Esteban-Díez I, González-Sáiz JM, Pizarro C. Extraction of Reduced Infrared Biomarker Signatures for the Stratification of Patients Affected by Parkinson’s Disease: An Untargeted Metabolomic Approach. Chemosensors. 2022; 10(6):229. https://0-doi-org.brum.beds.ac.uk/10.3390/chemosensors10060229
Chicago/Turabian StyleTkachenko, Kateryna, María Espinosa, Isabel Esteban-Díez, José M. González-Sáiz, and Consuelo Pizarro. 2022. "Extraction of Reduced Infrared Biomarker Signatures for the Stratification of Patients Affected by Parkinson’s Disease: An Untargeted Metabolomic Approach" Chemosensors 10, no. 6: 229. https://0-doi-org.brum.beds.ac.uk/10.3390/chemosensors10060229