Selectivity of Chemoresistive Sensors Made of Chemically Functionalized Carbon Nanotube Random Networks for Volatile Organic Compounds (VOC)


Abstract
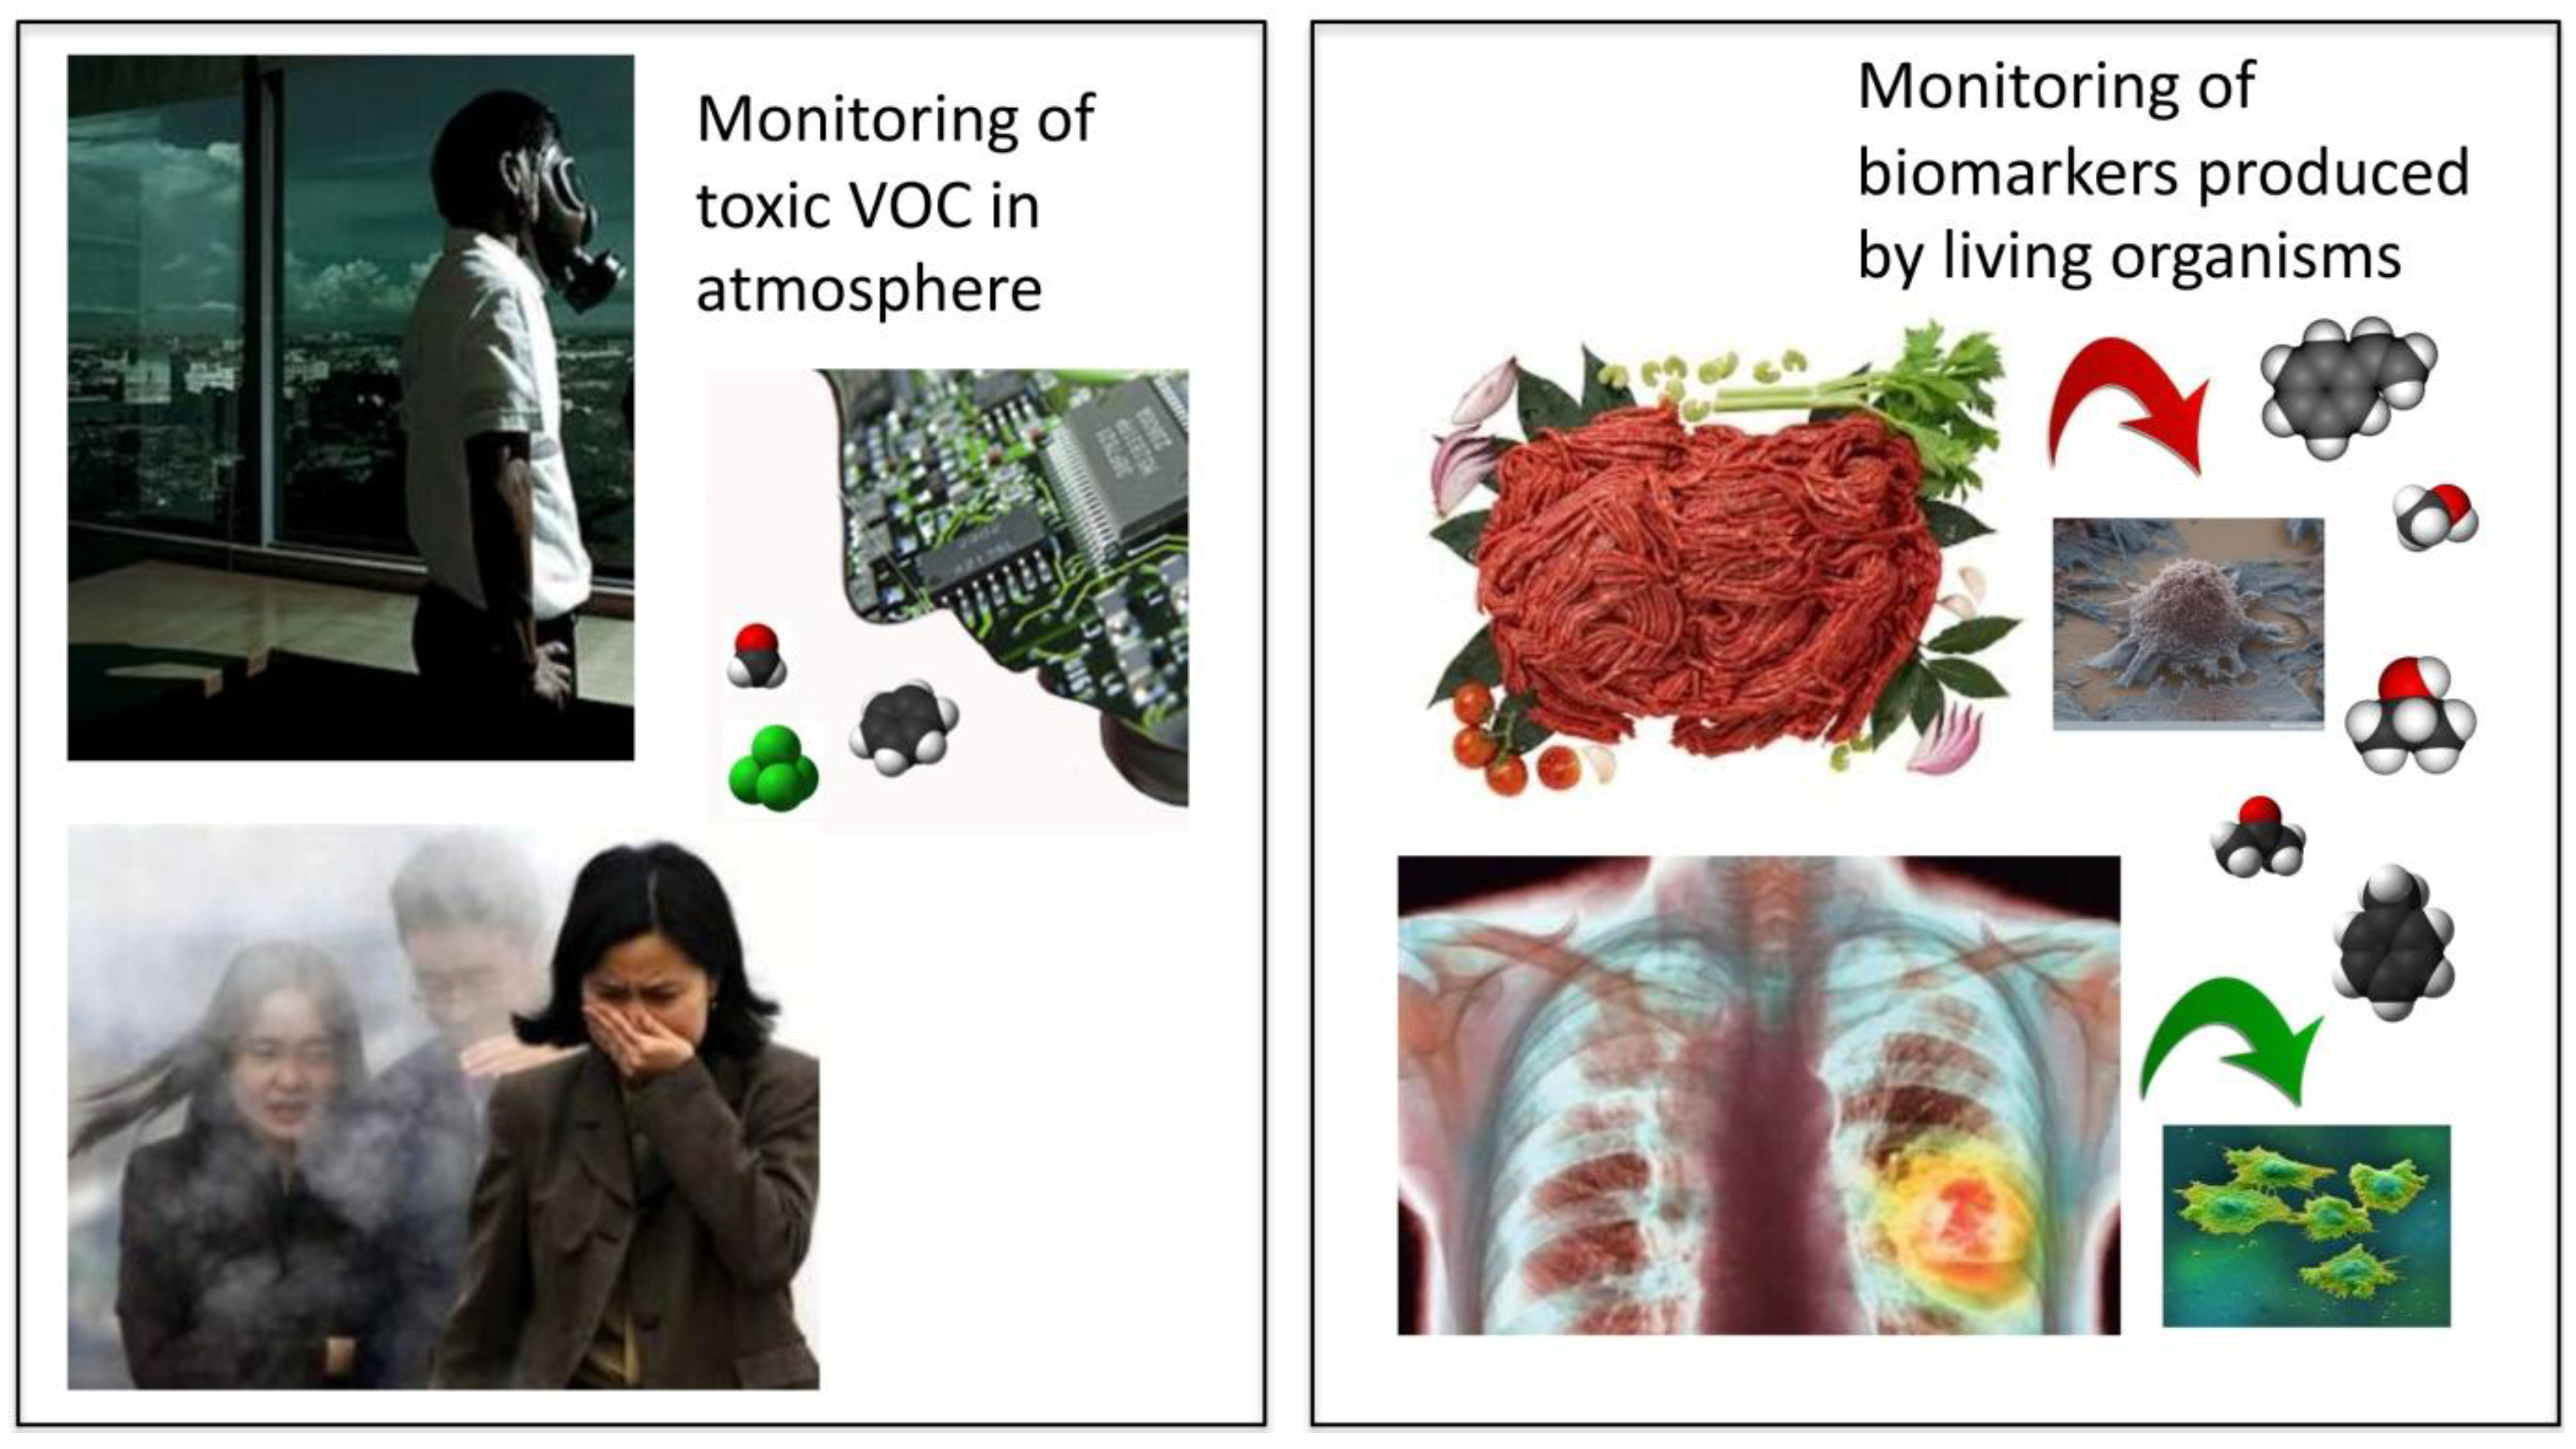
:1. Introduction
2. Experimental
2.1. Materials

| Property | Value | Technique | ||||
|---|---|---|---|---|---|---|
| 7000 | short | NH2 | OH | COOH | ||
| Average Diameter | 9.5 nm | 9.5 nm | 9.5 nm | 9.5 nm | 9.5 nm | TEM |
| Average Length | 1.5 µm | <1 µm | <1 µm | <1 µm | <1 µm | TEM |
| Carbon Purity | 90% | 90% | >95% | >5% | >95% | TGA |
| Metal Oxide (impurity) | 10% | 10% | <5% | <5% | <5% | TGA |
| Functionalization | <0.5% | <6% | <4% | XPS | ||
2.2. Techniques
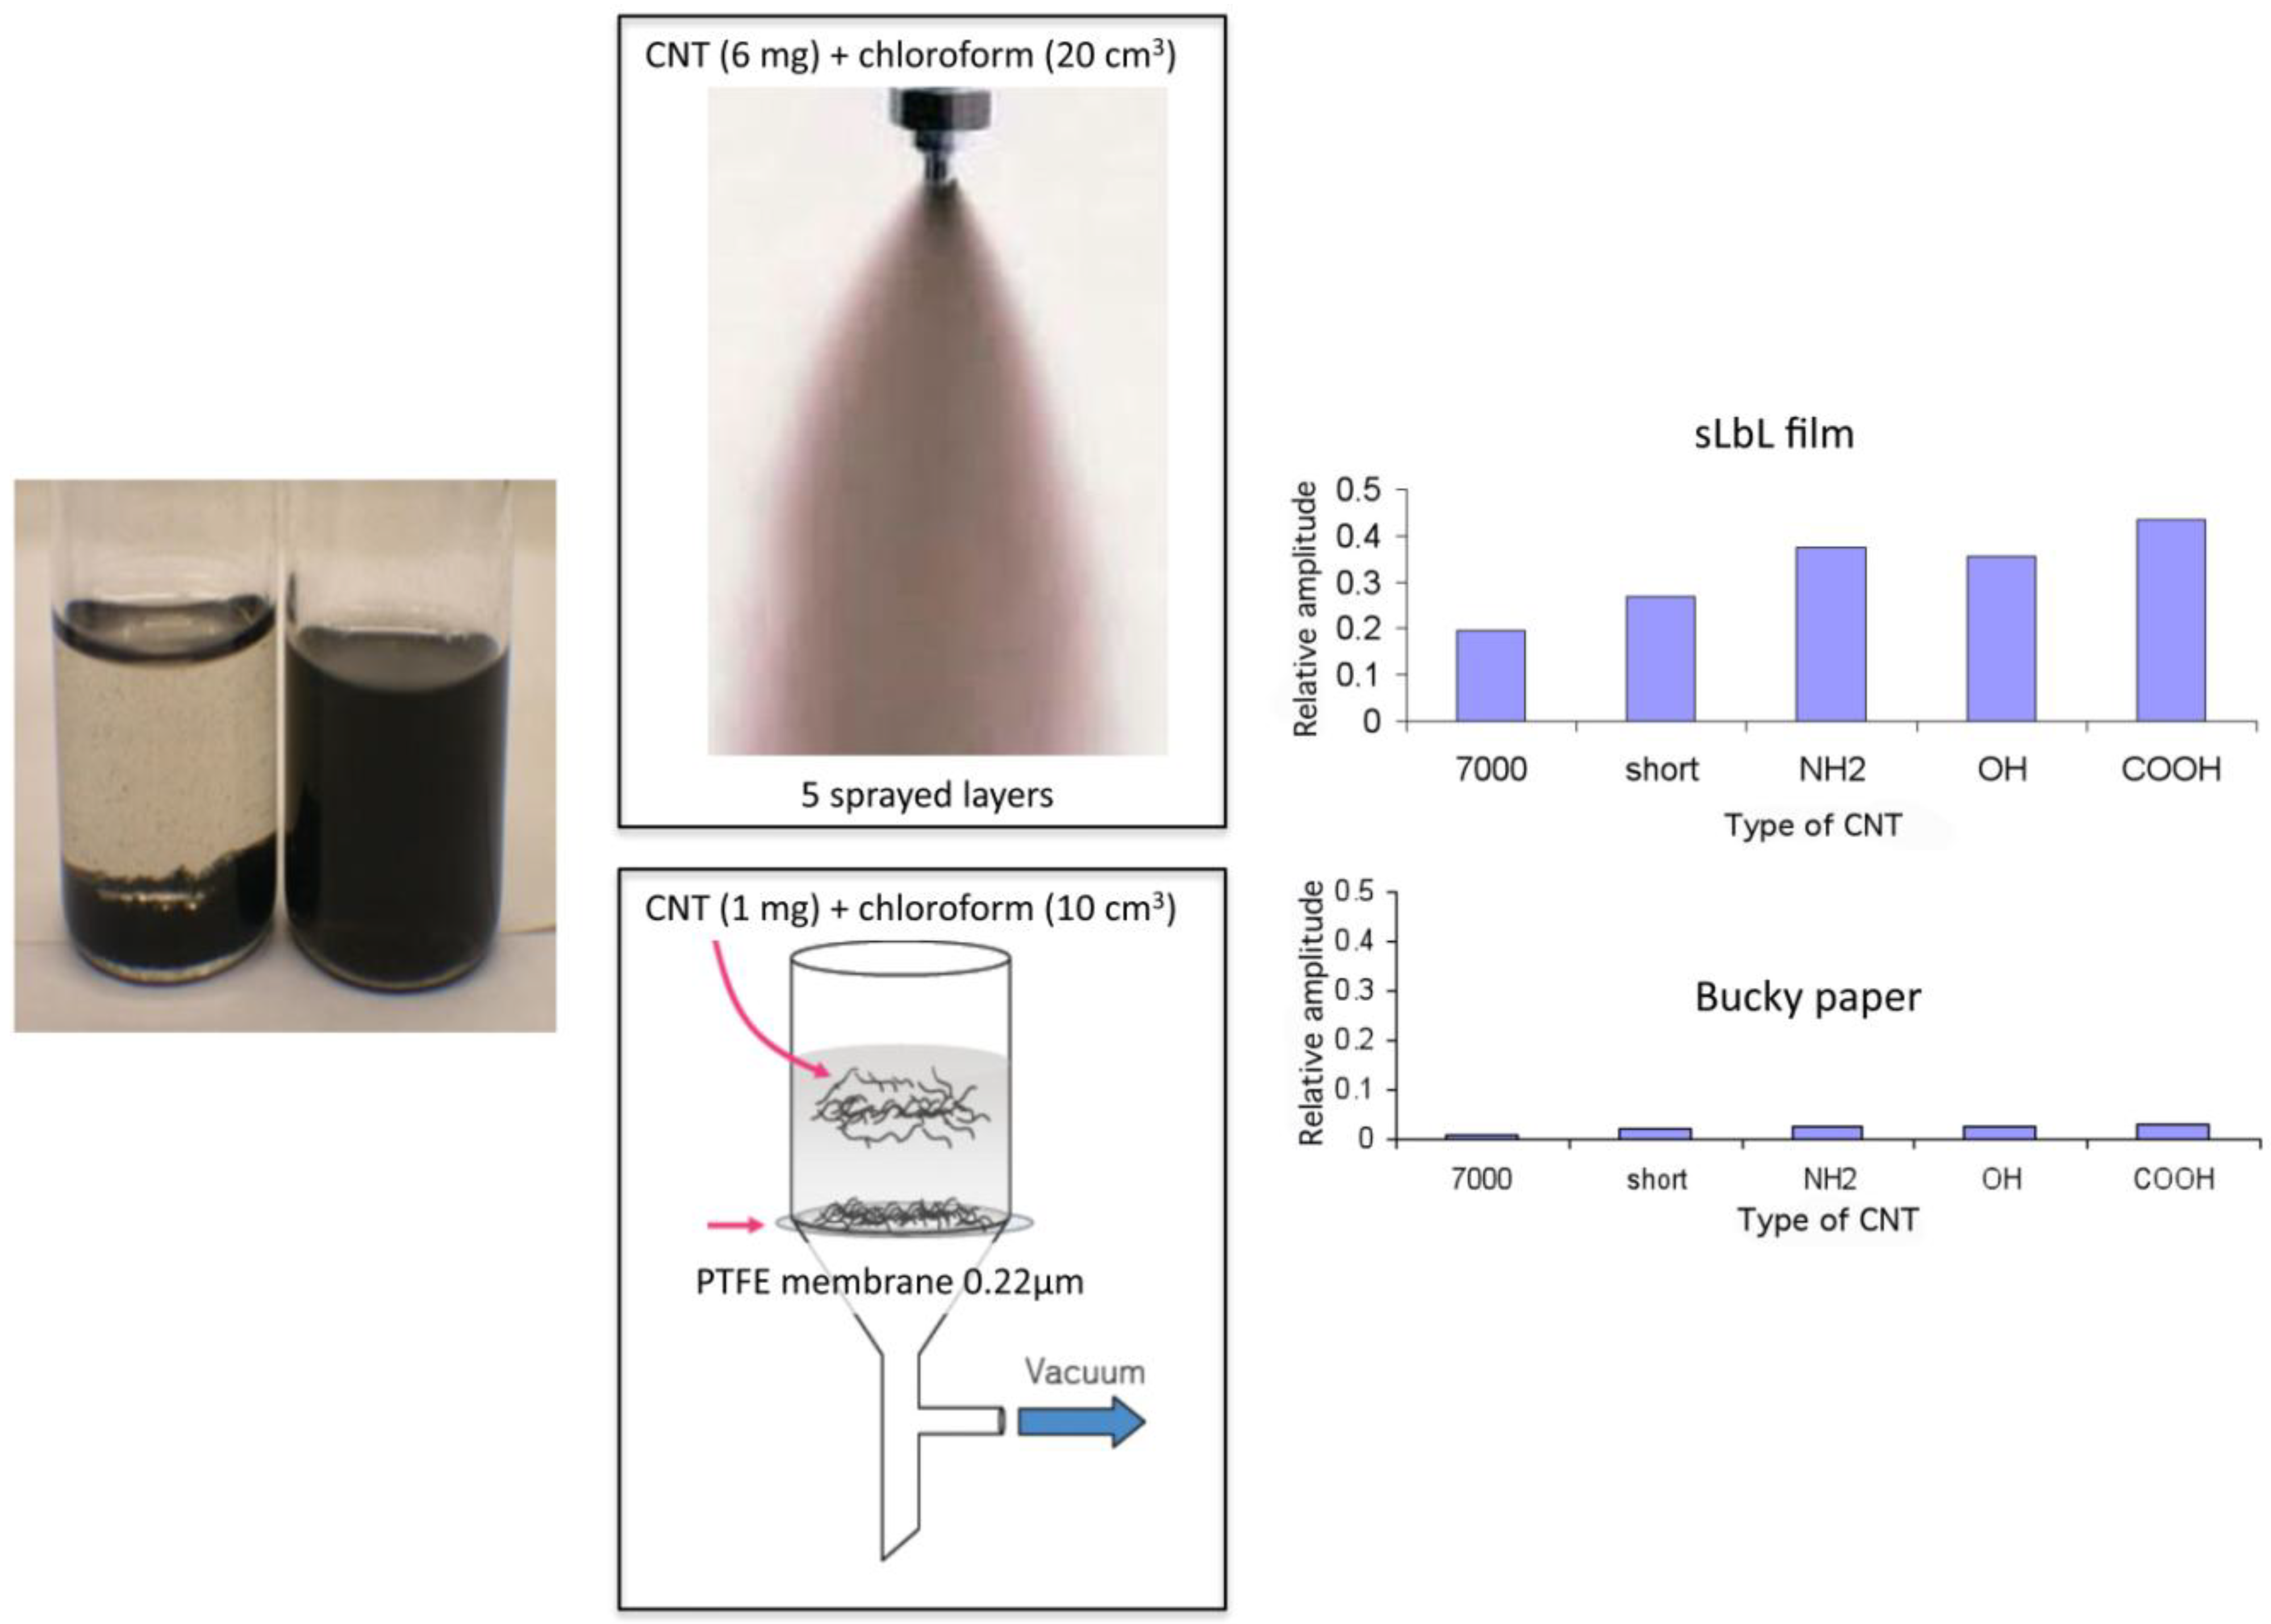
2.2.1. Fabrication of CNT Transducers by Spraying Layer-by-Layer (sLbL)
2.2.2. Fabrication of CPC Transducers by sLbL

2.2.3. Fabrication of CNT Transducers by Filtration on a PTFE Membrane under Vacuum to Make Bucky Papers (BP)
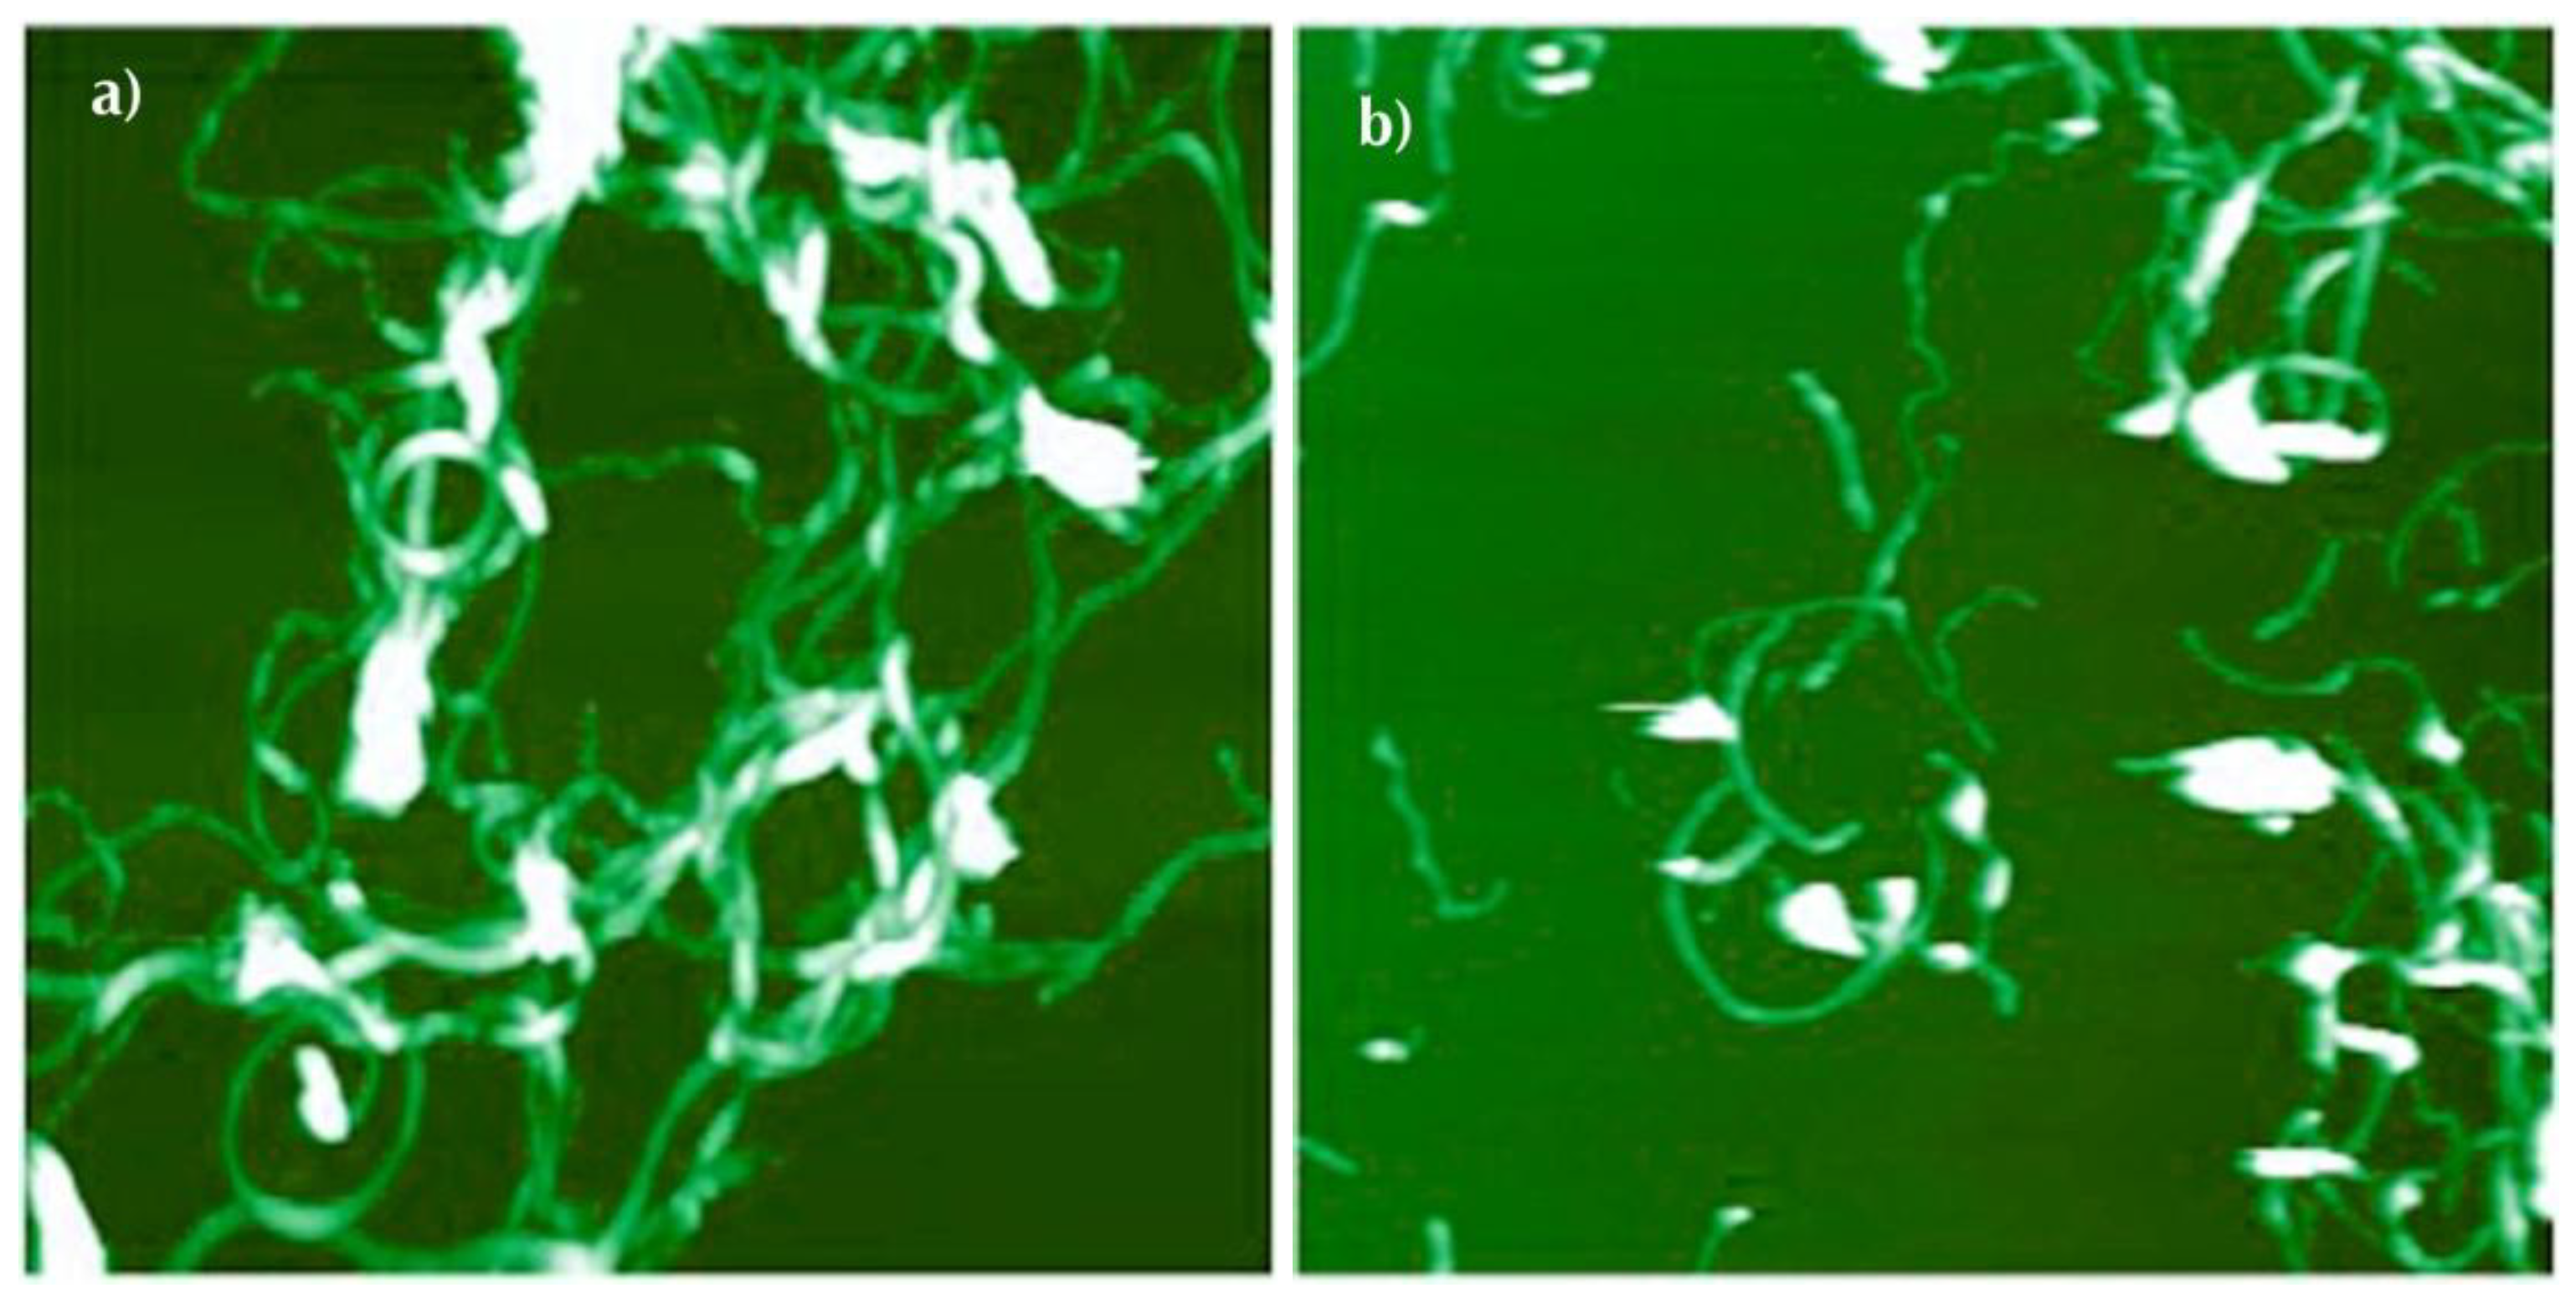
2.2.4. Atomic Force Microscopy Characterization (AFM)
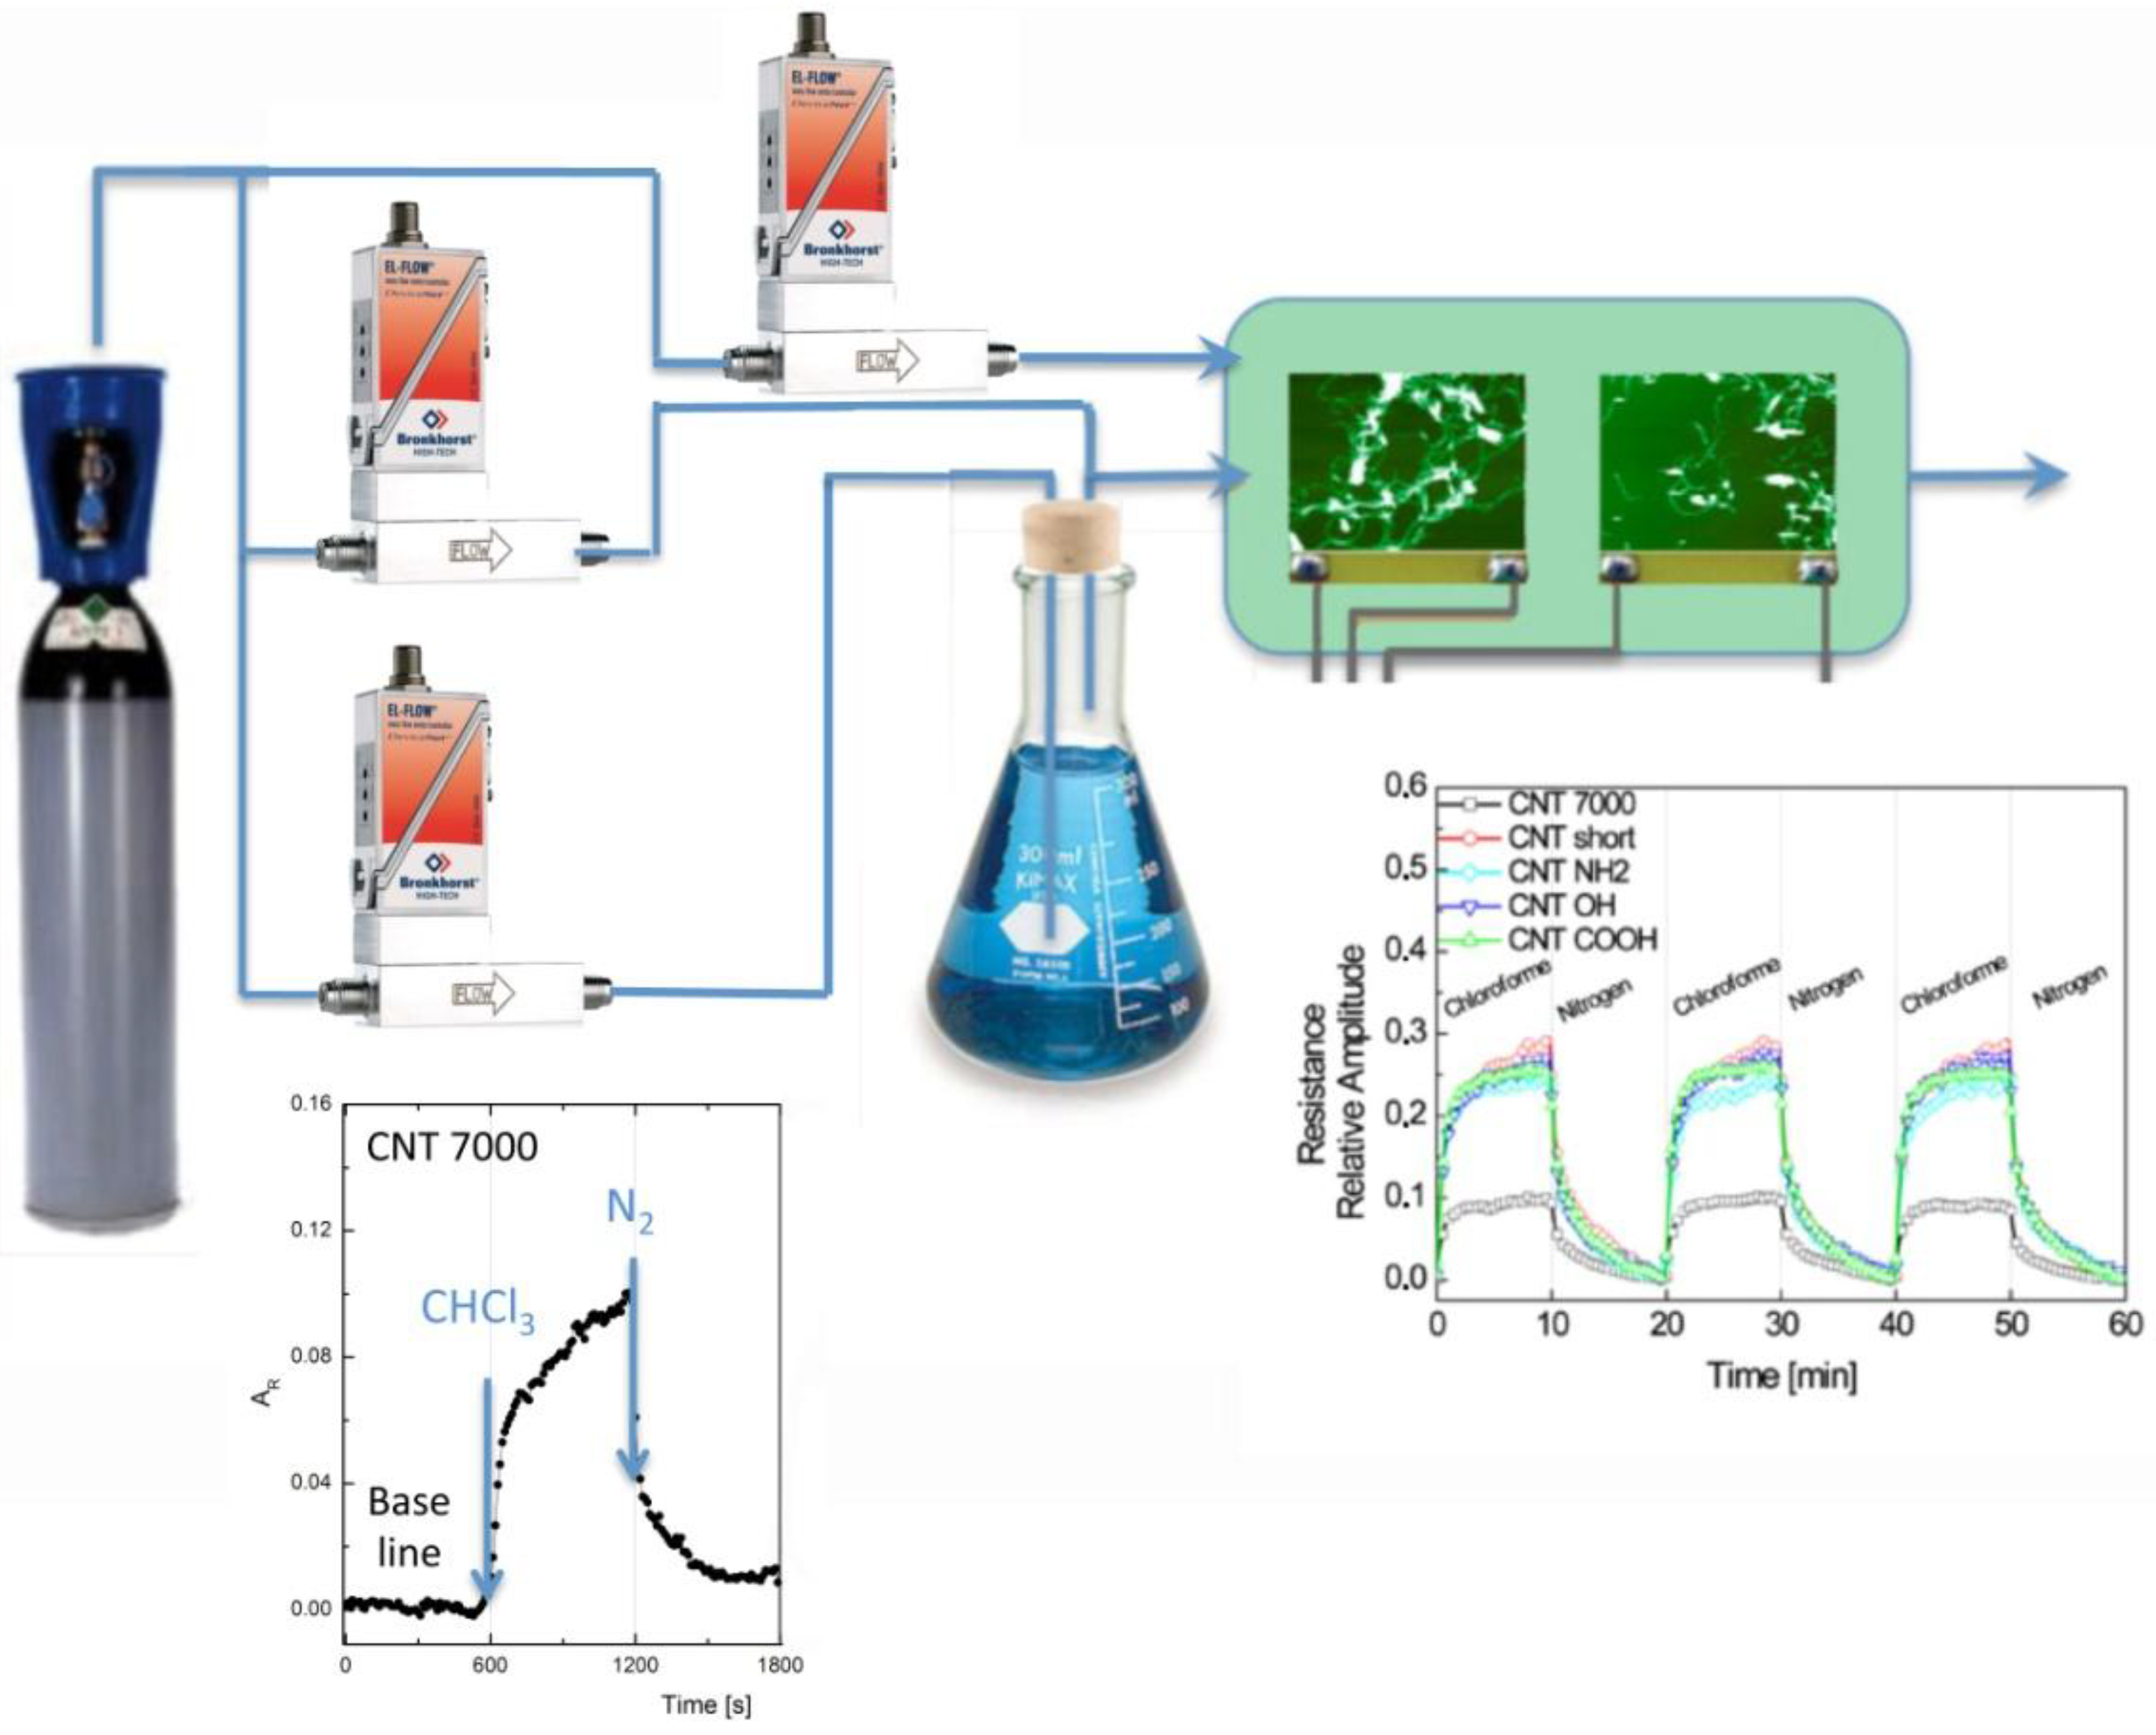
2.2.5. Dynamical Vapor Sensing Measurement

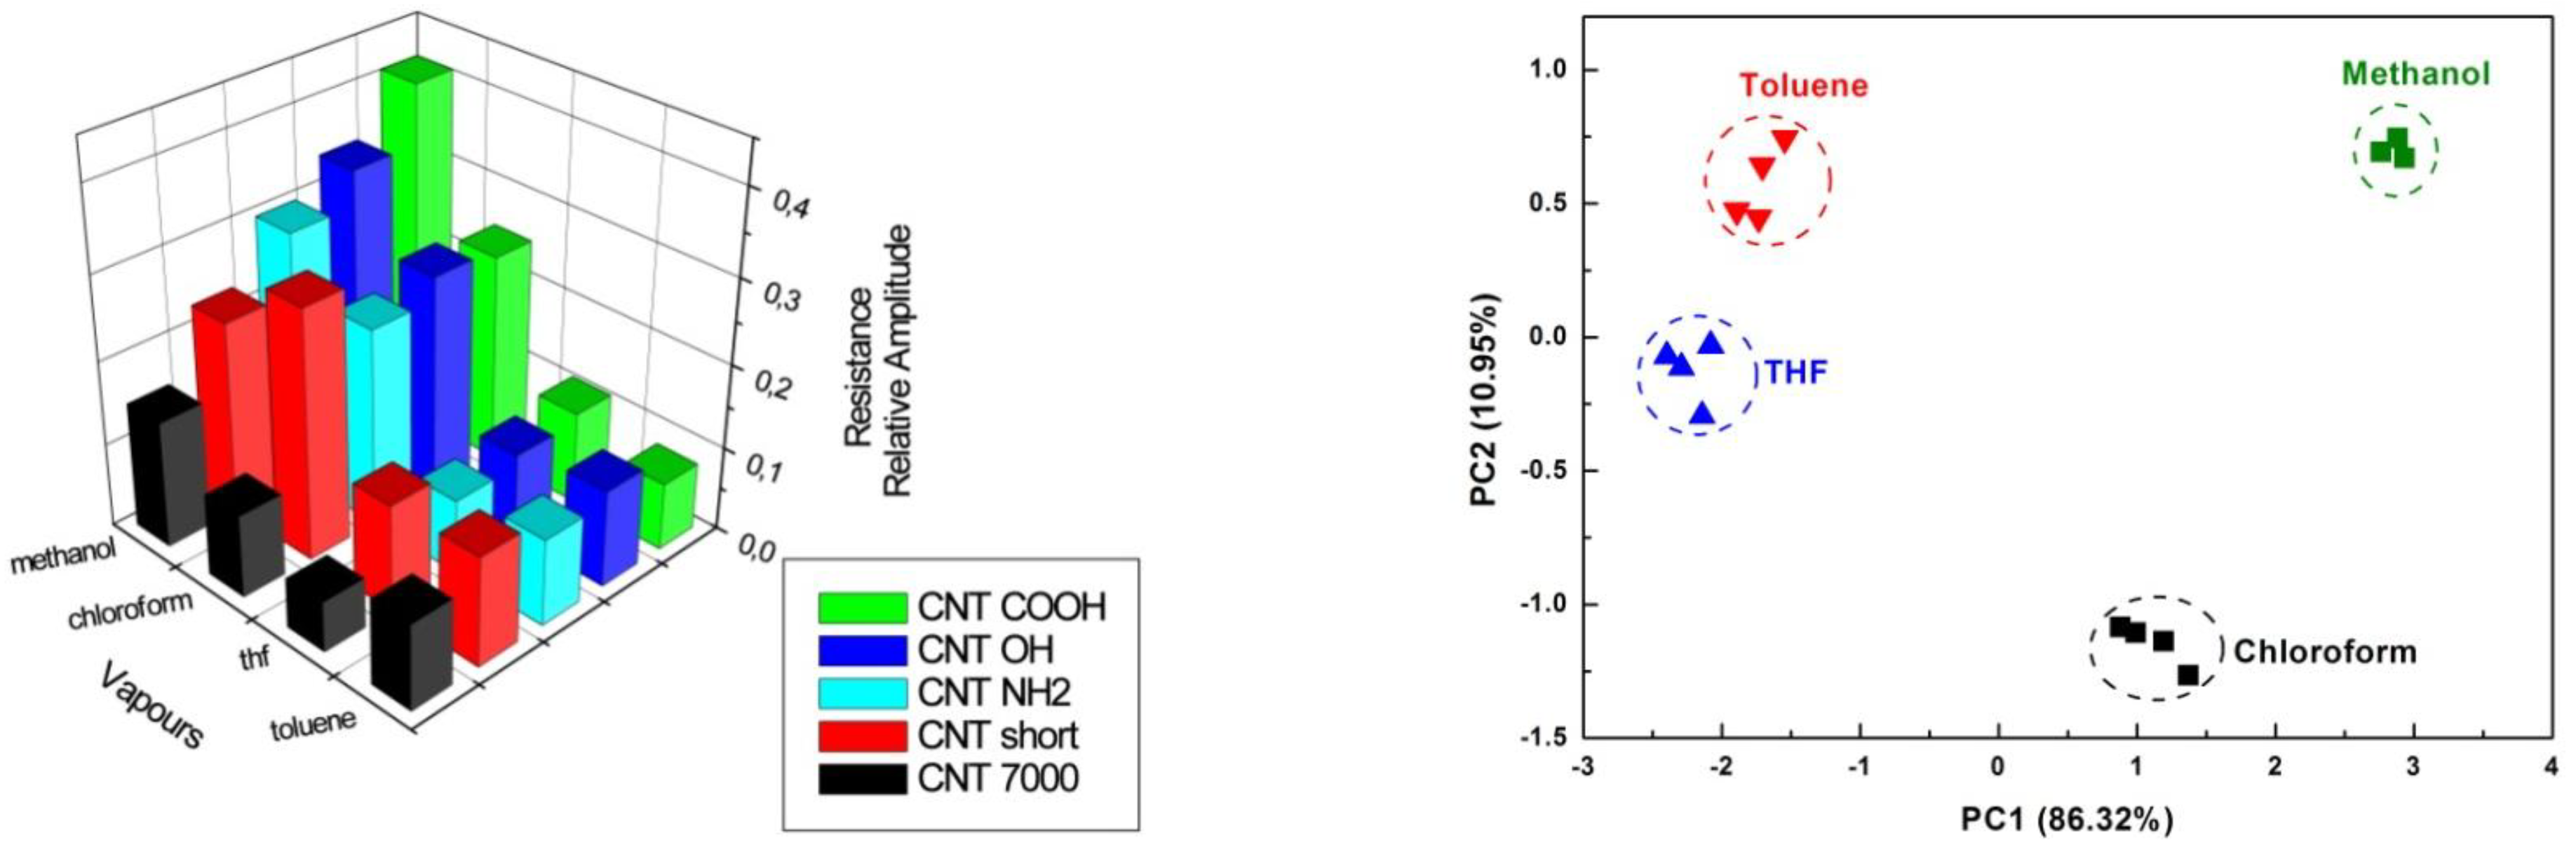
2.2.6. Data Analysis Using Principal Component Analysis (PCA)
3. Results and Discussion
3.1. Selection of Transducers’ Optimal Process
3.2. Analysis of Transducer’s Morphology by AFM

3.3. Vapor Sensing Performances of Transducers
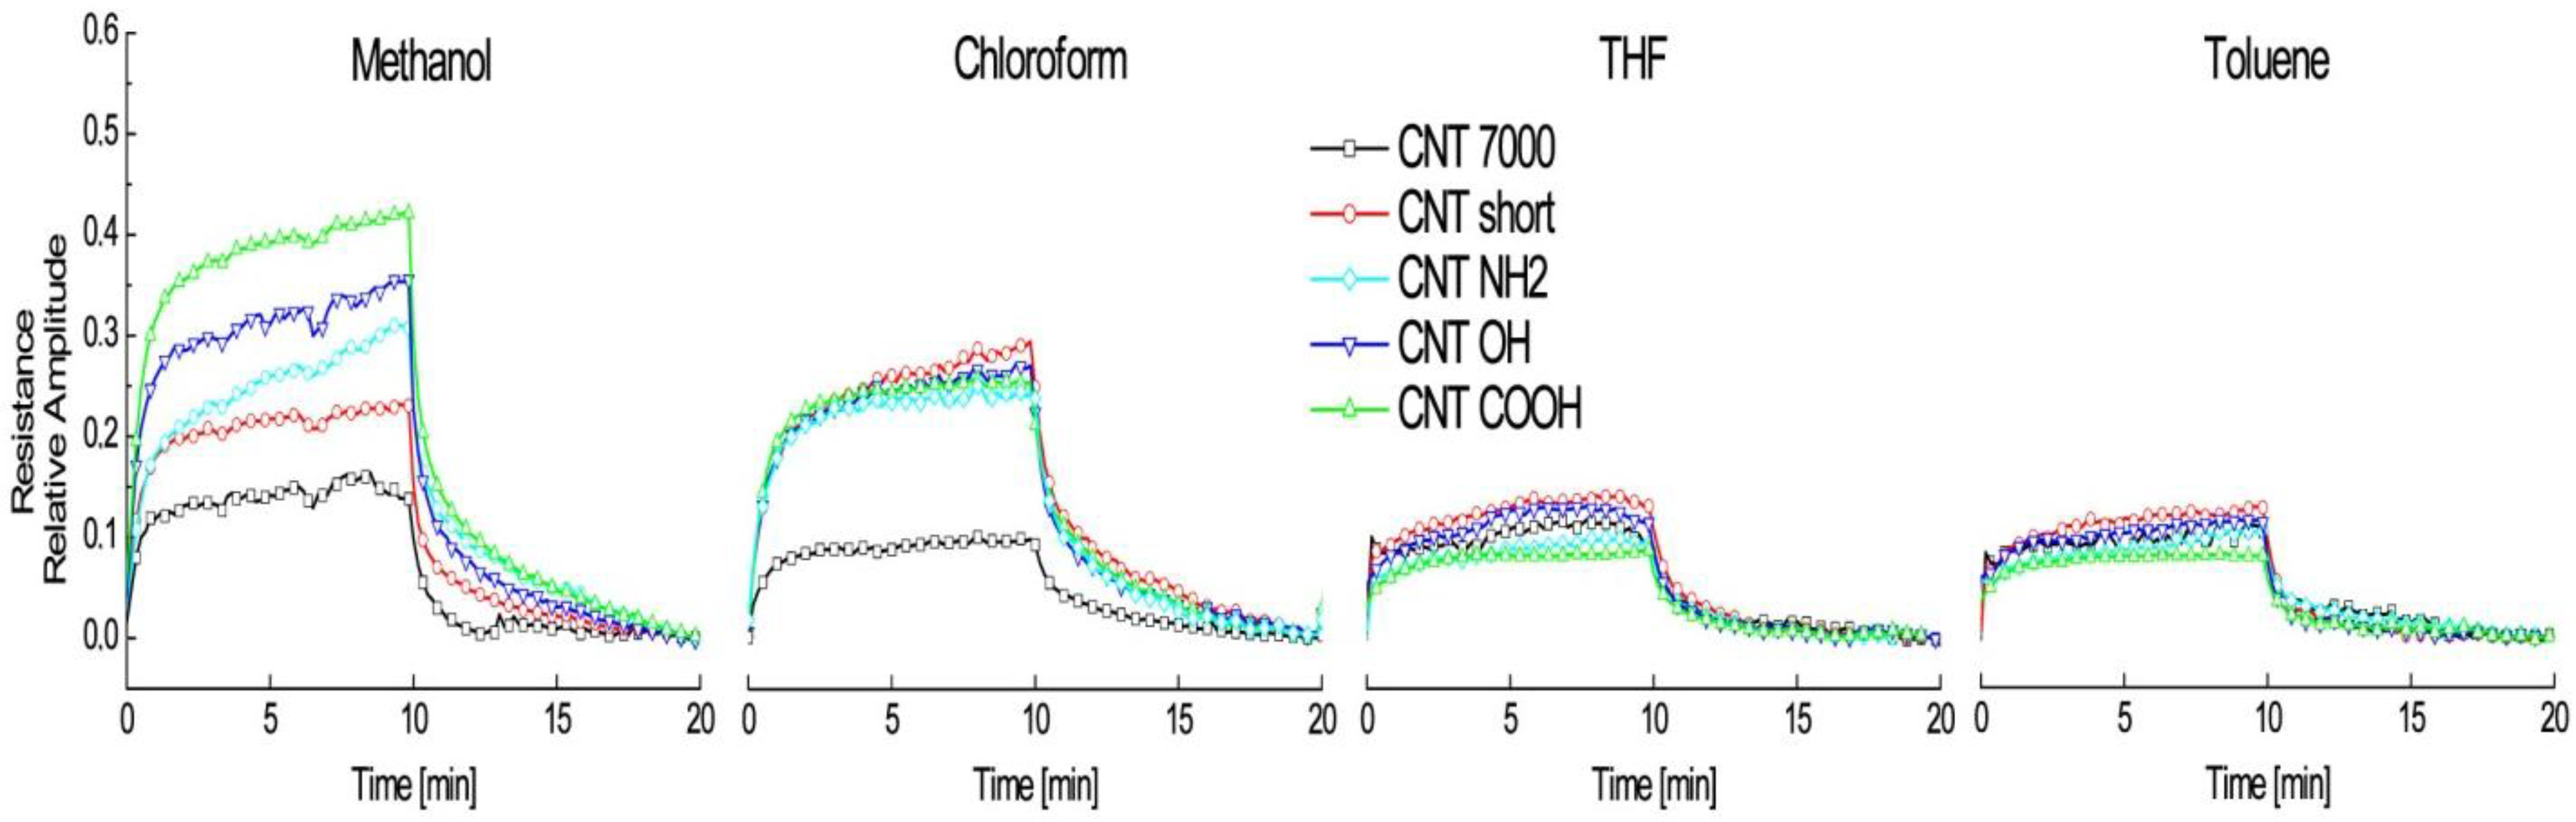
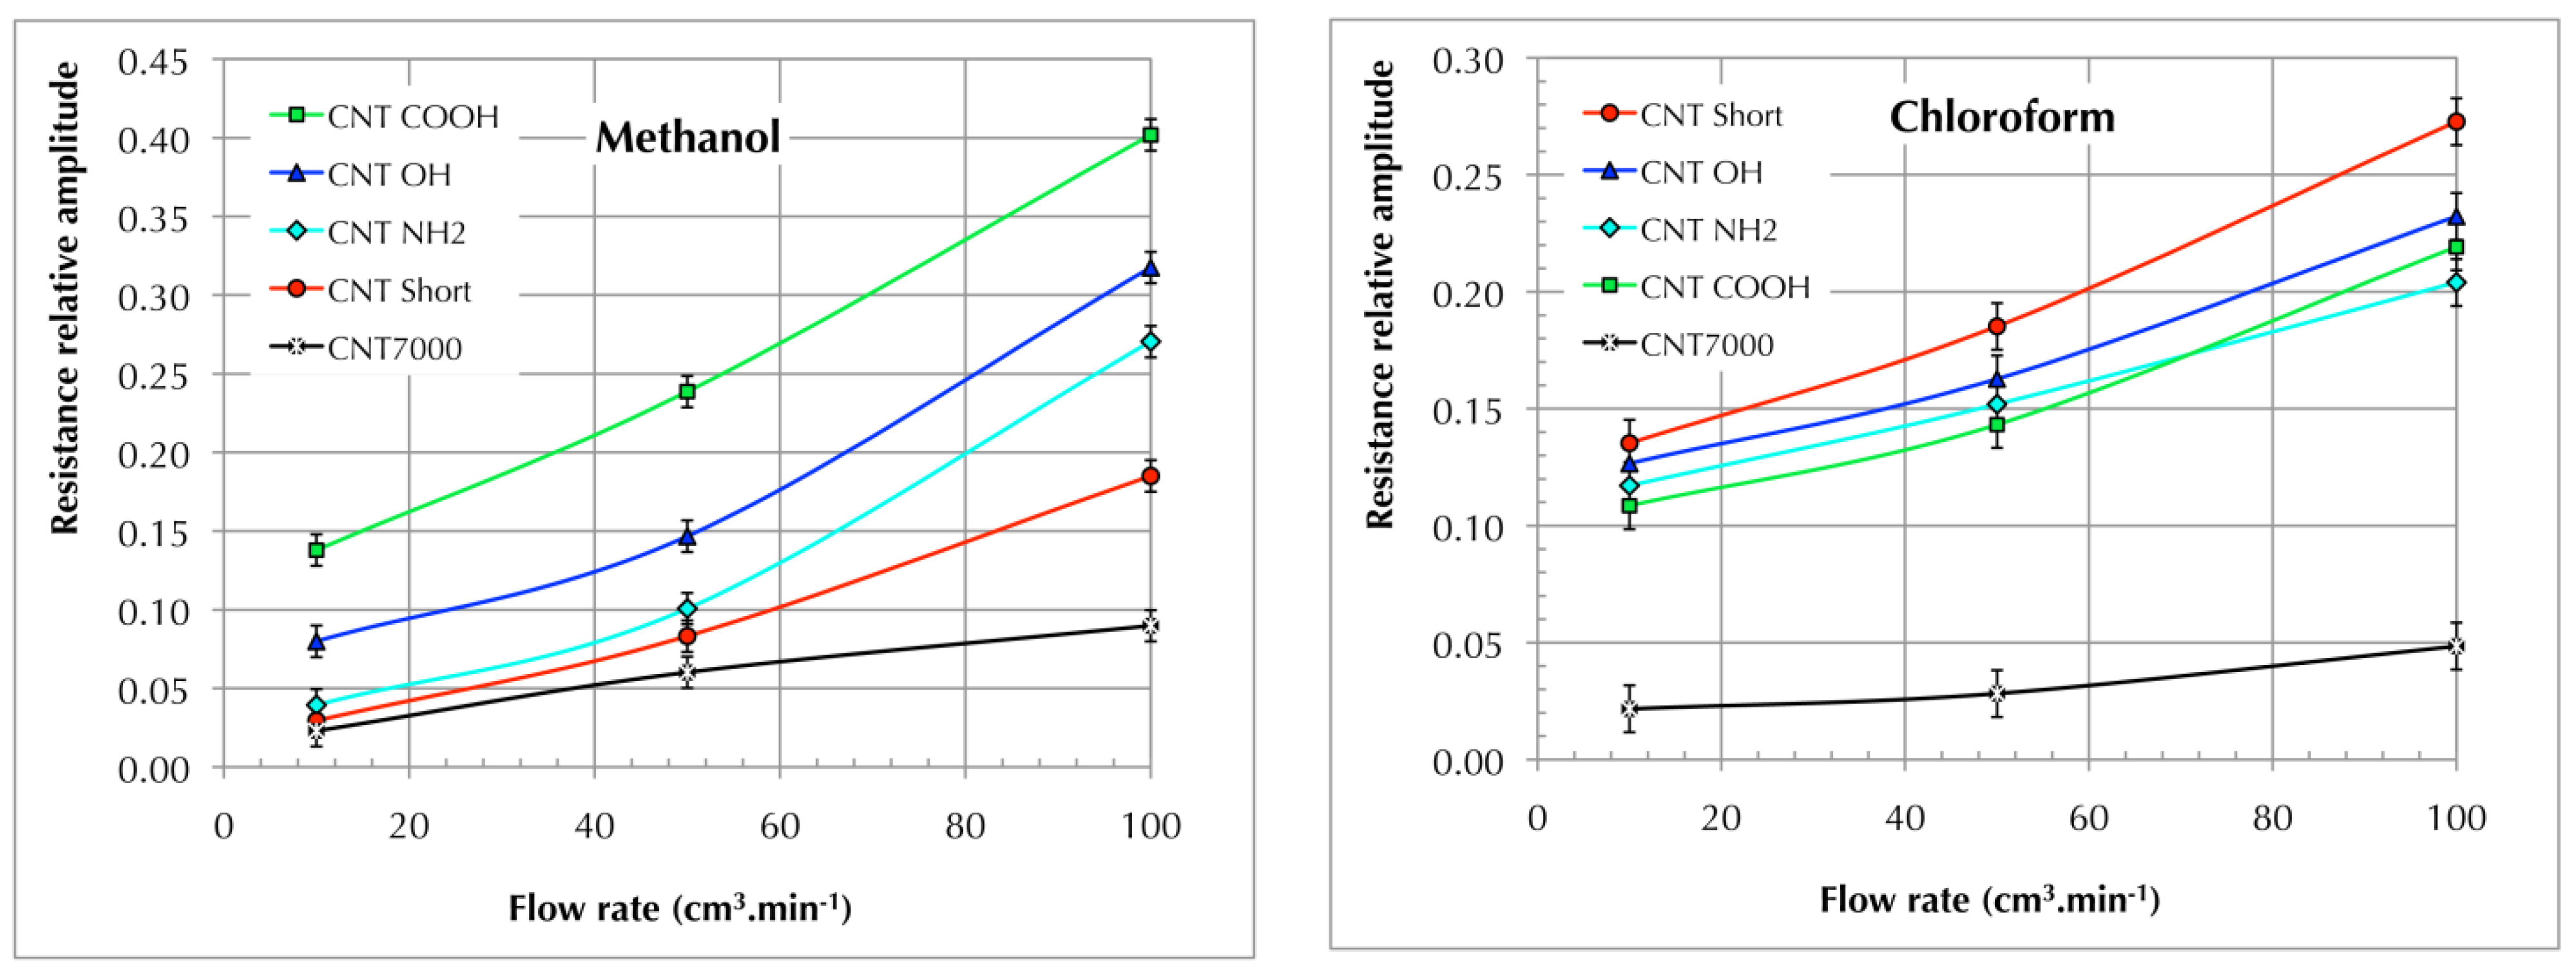
3.3.1. Chemoresistive Behavior

| Polarity Constant (N) | Molar mass (g·mol−1) | Density at 20 °C (g·cm−3) | |
|---|---|---|---|
| Methanol CH4O | 0.762 | 32.04 | 0.7910 |
| Chloroform CHCl3 | 0.259 | 119.38 | 1.4891 |
| THF C4H8O | 0.207 | 72.11 | 0.8892 |
| Toluene C7H8 | 0.099 | 92.14 | 0.8668 |

3.3.2. Quantitativity of Sensors’ Responses

3.3.3. Vapor Discrimination Ability of CNT Sensors

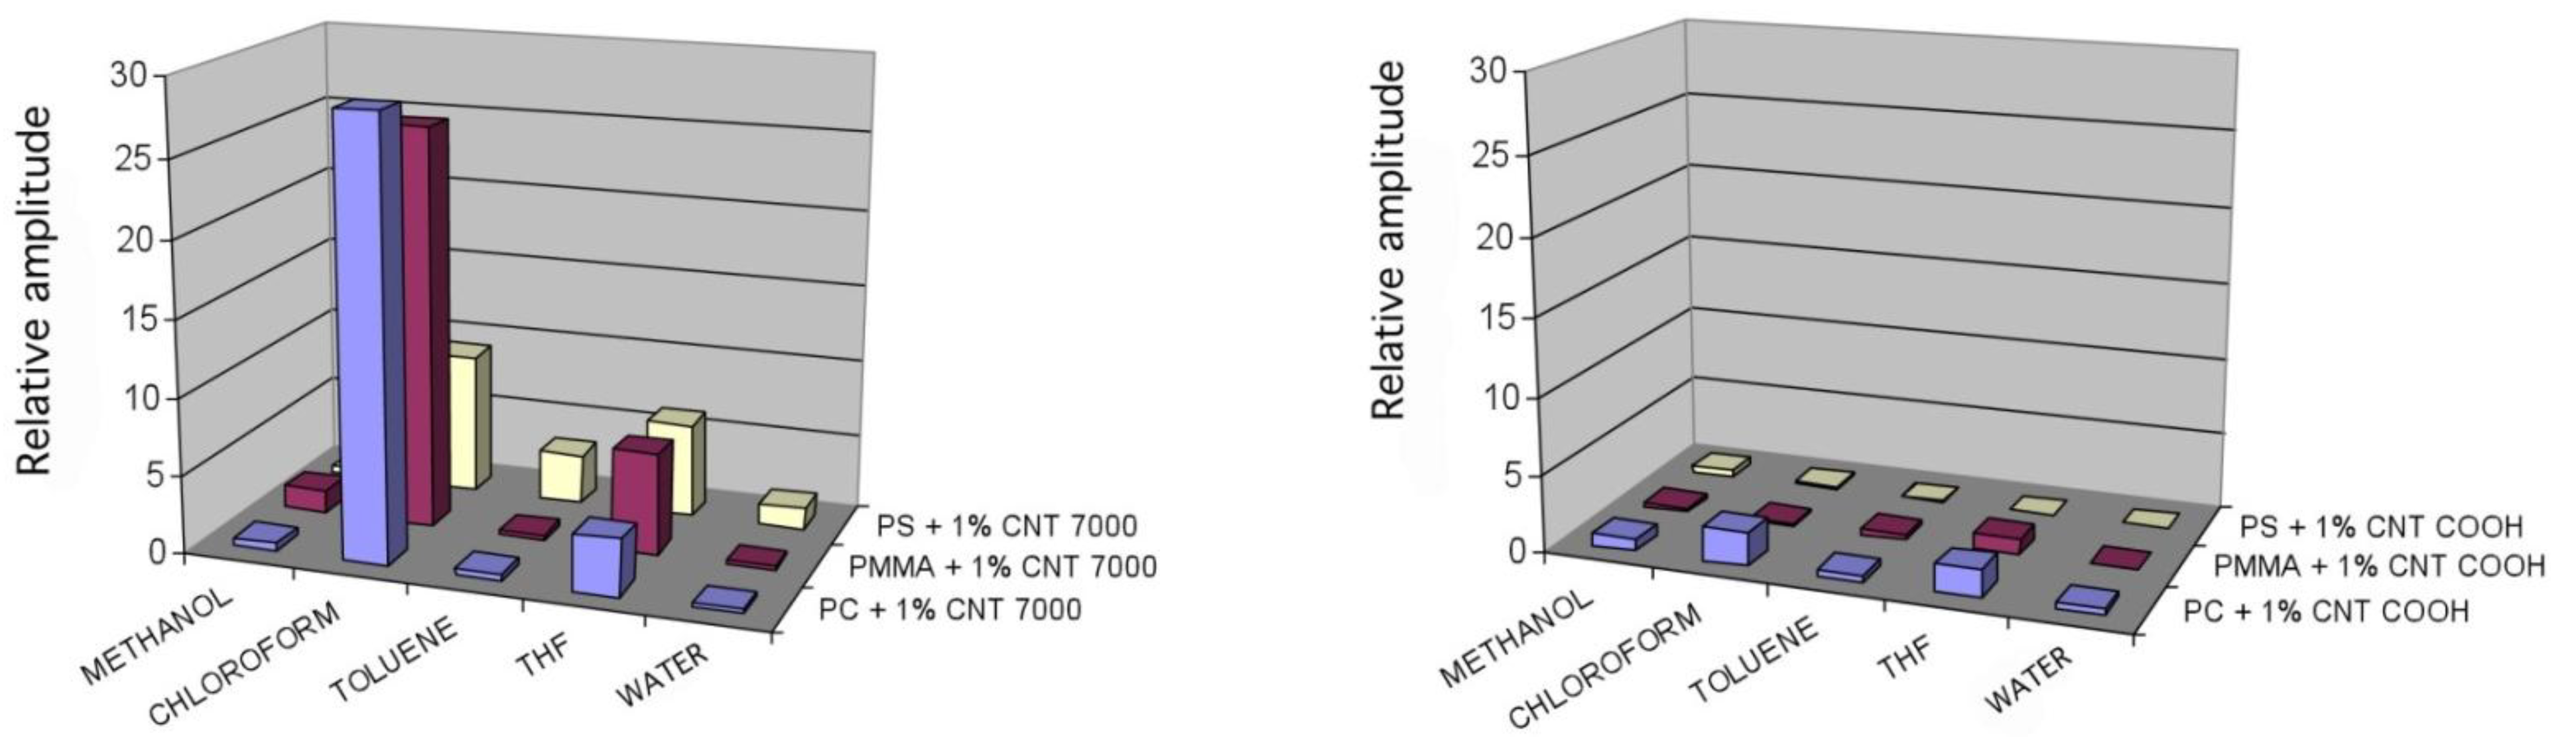
3.3.4. Input of Polymer Matrices in the Sensitivity and Selectivity of Sensors

4. Conclusions

Acknowledgments
Conflicts of Interest
References
- Radushkevich, L.V.; Lukyanovich, M.V. About the structure of carbon formed by thermal decomposition of carbon monoxide on iron substrate. J. Phys. Chem. (Moscow). 1952, 26, 88–95. [Google Scholar]
- Iijima, S. Helical microtubules of graphitic carbon. Nature 1991, 354, 56–58. [Google Scholar] [CrossRef]
- Dillon, A.C.; Gilbert, K.E.H.; Parilla, P.A.; Alleman, J.L.; Hornyak, G.L.; Jones, K.M.; Heben, M.J. Storage of hydrogen in single-walled carbon nanotubes. Nature 1997, 386, 377–379. [Google Scholar] [CrossRef]
- Chambers, A.; Park, C.; Baker, R.T.K.; Rodriguez, N.M. Hydrogen storage in graphite nanofibers. J. Phys. Chem. B 1998, 102, 4253–4256. [Google Scholar] [CrossRef]
- Ahn, C.C.; Ye, Y.; Ratnakumar, B.V.; Witham, C.; Bowman, R.C.; Fultz, B. Hydrogen desorption and adsorption measurements on graphite nanofibers. Appl. Phys. Lett. 1998, 73, 3378–3381. [Google Scholar]
- Flujiwara, A.; Ishii, K.; Suematsu, H.; Kataura, H.; Maniwa, Y.; Suzuki, S.; Achiba, Y. Gas adsorption in the inside and outside of single-walled carbon nanotubes. Chem. Phys. Lett. 2001, 336, 205–211. [Google Scholar] [CrossRef]
- Collins, P.G.; Bradley, K.; Ishigami, M.; Zettle, A. Extreme oxygen sensitivity of electronic properties of carbon nanotubes. Science 2000, 287, 1801–1804. [Google Scholar] [CrossRef]
- Sumanasekera, G.U.; Adu, C.K.W.; Fang, F.; Eklund, P.C. Effect of gas adsorption on electrical transport in single walled carbon nanotubes. Phys. Rev. Lett. 2000, 85, 1096–1099. [Google Scholar] [CrossRef]
- Zahab, A.; Spin, L.; Poncharaal, P. Water vapour effect on the electrical conductivity of a single walled carbon nanotube mat. Phys. Rev. B 2000, 62, 10000–10003. [Google Scholar] [CrossRef]
- Zhao, J.; Buldum, A.; Han, J.; Lu, J.P. Gas molecule adsorption in carbon nanotubes and nanotube bundles. Nanotechnology 2002, 13, 195–200. [Google Scholar] [CrossRef]
- Chang, H.; Lee, J.D.; Lee, S.M.; Lee, Y.H. Adsorption of NH3 and NO2 molecules on carbon nanotubes. Appl. Phys. Lett. 2001, 79, 3863–3866. [Google Scholar] [CrossRef]
- Cantalini, C.; Valentini, L.; Armentano, I.; Lozzi, L.; Kenny, J.M.; Santucci, S. Sensitivity to NO2 and cross-sensitivity analysis to NH3, ethanol and humidity of carbon nanotubes thin film prepared by PECVD. Sens. Actuators B: Chem. 2003, 95, 195–202. [Google Scholar] [CrossRef]
- Kong, J.; Franklin, N.R.; Zhou, C.; Chapline, M.; Peng, S.; Cho, K.; Dai, H. Nanotubes molecular wires as chemical sensors. Science 2000, 287, 622–625. [Google Scholar] [CrossRef]
- Adu, C.K.W.; Sumanasekera, G.U.; Pradhan, B.K.; Romero, H.E.; Eklund, P.C. Carbon nanotubes: A thermoelectric nano-nose. Chem. Phys. Lett. 2001, 337, 31–35. [Google Scholar]
- Dai, H. Carbon nanotubes: Synthesis, integration, and properties. Acc. Chem. Res. 2002, 35, 1035–1044. [Google Scholar] [CrossRef]
- Li, J.; Lu, Y.; Ye, Q.; Cinke, M.; Han, J.; Meyyappan, M. Carbon nanotube sensors for gas and organic vapor detection. Nano Lett. 2003, 3, 927–933. [Google Scholar]
- Someya, T.; Small, J.; Kim, P.; Nuckolls, C.; Yardley, J.T. Alcohol vapor sensors based on single-walled carbon nanotube field effect transistors. Nano Lett. 2003, 3, 877–881. [Google Scholar] [CrossRef]
- Kauffman, D.R.; Star, A. Carbon nanotube gas and vapor sensors. Angew. Chem. (Int. Ed.) 2008, 47, 6550–6570. [Google Scholar]
- Goldoni, A.; Petaccia, L.; Lizzit, S.; Larciprete, R. Sensing gases with carbon nanotubes: A review of the actual situation. J. Phys.: Condens. Matter 2010, 22, 1–8. [Google Scholar]
- Madu, M.J.; Morrison, S.R. Chemical Sensing with Solid State Devices; Academic Press: New York, NY, USA, 1989. [Google Scholar]
- Seiyama, T. Chemical Sensors-Current State and Future Outlook: Chemical Sensor Technology; Kodansha & Elsevier: Amsterdam, The Netherlands, 1988. [Google Scholar]
- Arshak, K.; Gaidan, I. Development of a novel gas sensor based on oxide thick films. Mater. Sci. Eng. B 2005, 118, 44–49. [Google Scholar] [CrossRef]
- Wang, J.X.; Sun, X.W.; Yang, Y.; Huang, H.; Lee, Y.C.; Tan, O.K.; Vayssieres, L. Hydrothermally grown oriented ZnO nanorod arrays for gas sensing applications. Nanotechnology 2006, 17, 4995–4998. [Google Scholar] [CrossRef]
- Belchi, A.d.; Rothpfeffer, N.; Pelegrí-Sebastia, J.; Chilo, J.; Rodriguez, D.G.; Sogorb, T. Sensor characterization for multisensor odor discrimination system. Sens. Actuators B: Chem. 2013, 191, 68–72. [Google Scholar]
- Hirsch, A. Functionalization of single-walled carbon nanotubes. Angew. Chem. (Int. Ed.) 2002, 41, 1853–1859. [Google Scholar]
- Bahr, J.L.; Tour, J.M. Covalent chemistry of single-wall carbon nanotubes. J. Mater. Chem. 2002, 12, 1952–1958. [Google Scholar] [CrossRef]
- Kong, L.; Wang, J.; Fu, X.; Zhong, Y.; Meng, F.; Luo, T.; Liu, J. p-Hexafluoroisopropanol phenyl covalently functionalized single-walled carbon nanotubes for detection of nerve agents. Carbon 2010, 48, 1262–1270. [Google Scholar] [CrossRef]
- Castro, M.; Lu, J.; Bruzaud, S.; Kumar, B.; Feller, J.F. Carbon nanotubes/poly(e-caprolactone) composite vapour sensors. Carbon 2009, 47, 1930–1942. [Google Scholar] [CrossRef]
- Lou, X.; Daussin, R.; Cuenot, S.; Duwez, A.S.; Pagnoulle, C.; Detrembleur, C.; Bailly, C.; Jérôme, R. Synthesis of pyrene-containing polymers and noncovalent sidewall functionalization of multiwalled carbon nanotubes. Chem. Mater. 2004, 16, 4005–4011. [Google Scholar] [CrossRef]
- Zhao, Y.L.; Stoddart, J.F. Noncovalent functionalization of single-walled carbon nanotubes. Acc. Chem. Res. 2009, 42, 1161–1171. [Google Scholar] [CrossRef]
- Shim, M.; Kam, N.W.S.; Chen, R.J.; Li, Y.; Dai, H. Functionalization of carbon nanotubes for biocompatibility and biomolecular recognition. Nano Lett. 2002, 2, 285–288. [Google Scholar] [CrossRef]
- Feller, J.F.; Kumar, B.; Castro, M. Conductive Biopolymer Nanocomposites for Sensors. In Nanocomposites with Biodegradable Polymers: Synthesis, Properties & Future Perspectives, 1st ed.; Mital, V., Ed.; Oxford University Press: Oxford, UK, 2011; pp. 368–399. [Google Scholar]
- Kumar, B.; Park, Y.T.; Castro, M.; Grunlan, J.C.; Feller, J.F. Fine control of carbon nanotubes—Polyelectrolyte sensors sensitivity by electrostatic layer by layer assembly (eLbL) for the detection of volatile organic compounds (VOC). Talanta 2012, 88, 396–402. [Google Scholar] [CrossRef]
- Zanolli, Z.; Leghrib, R.; Felten, A.; Pireaux, J.J.; Llobet, E.; Charlier, J.C. Gas sensing with Au-decorated carbon nanotubes. ACS Nano 2011, 5, 4592–4599. [Google Scholar] [CrossRef]
- Yoon, H.; Xie, J.; Abraham, J.K.; Varadan, V.K.; Ruffin, P.B. Passive wireless sensors using electrical transition of carbon nanotube junctions in polymer matrix. Smart Mater. Struct. 2006, 15, S14–S20. [Google Scholar] [CrossRef]
- Mabrook, M.F.; Pearson, C.; Jombert, A.S.; Zeze, D.A.; Petty, M.C. The morphology, electrical conductivity and vapour sensing ability of inkjet printed thin films of single-wall carbon nanotubes. Carbon 2009, 47, 752–757. [Google Scholar] [CrossRef]
- Bondavalli, P.; Legagneux, P.; Pribat, D. Carbon nanotubes based transistors as gas sensors: State of the art and critical review. Sens. Actuators B: Chem. 2009, 140, 304–318. [Google Scholar] [CrossRef]
- Kumar, B.; Castro, M.; Feller, J.F. Tailoring the chemo-resistive response of self-assembled polysaccharide-CNT sensors by chain conformation at tunnel junction. Carbon 2012, 50, 3627–3634. [Google Scholar] [CrossRef]
- Kumar, B.; Castro, M.; Feller, J.F. Controlled conductive junction gap for chitosan—Carbon nanotubes quantum resistive vapour sensors. J. Mater. Chem. 2012, 22, 10656–10664. [Google Scholar] [CrossRef]
- Feller, J.F.; Grohens, Y. Electrical response of poly(styrene)/carbon black conductive polymer composites (CPC) to methanol, toluene, chloroform and styrene vapors as a function of filler nature and matrix tacticity. Synth. Metals 2005, 154, 193–196. [Google Scholar] [CrossRef]
- Robert, C.; Feller, J.F.; Castro, M. Sensing skin for strain monitoring made of PC-CNT Conductive Polymer Nanocomposite sprayed layer by layer. ACS Appl. Mater. Interfaces 2012, 4, 3508–3516. [Google Scholar] [CrossRef]
- Rein, M.D.; Breuer, O.; Wagner, H.D. Sensors and sensitivity: Carbon nanotube buckypaper films as strain sensing devices. Compos. Sci. Technol. 2011, 71, 373–381. [Google Scholar] [CrossRef]
- Feller, J.F.; Lu, J.; Zhang, K.; Kumar, B.; Castro, M.; Gatt, N.; Choi, H.J. Novel architecture of carbon nanotube decorated poly(methyl methacrylate) microbead vapour sensors assembled by spray layer by layer. J. Mater. Chem. 2011, 21, 4142–4149. [Google Scholar] [CrossRef]
- Hierlemann, A.; Gutierrez-Osuna, R. Higher-order chemical sensing. Chem. Rev. 2008, 108, 563–613. [Google Scholar] [CrossRef]
- Castro, M.; Kumar, B.; Feller, J.F.; Haddi, Z.; Amari, A.; Bouchikhi, B. Novel e-nose for the discrimination of volatile organic biomarkers with an array of carbon nanotube (CNT) conductive polymer nanocomposite (CPC) sensors. Sens. Actuators B: Chem. 2011, 159, 213–219. [Google Scholar] [CrossRef]
- Cole, M.; Covington, J.A.; Gardner, J.W. Combined electronic nose and tongue for a flavour sensing system. Sens. Actuators B: Chem. 2011, 156, 832–839. [Google Scholar] [CrossRef]
- D’Amico, A.; Pennazza, G.; Santonico, M.; Martinelli, E.; Roscioni, C.; Galluccio, G.; Paolesse, R.; Natale, C.D. An investigation on electronic nose diagnosis of lung cancer. Lung Cancer 2010, 68, 170–176. [Google Scholar] [CrossRef]
- Arasaradnam, R.P.; Quraishi, N.; Kyrou, I.; Nwokolo, C.U.; Joseph, M.; Kumar, S.; Bardhan, K.D.; Covington, J.A. Insights into “fermentonomics”: Evaluation of volatile organic compounds (VOC) in human disease using an electronic “e-nose”. J. Med. Eng. Technol. 2011, 35, 87–91. [Google Scholar] [CrossRef]
- Tisch, U.; Aluf, Y.; Ionescu, R.; Nakhleh, M.; Bassal, R.; Axelrod, N.; Robertman, D.; Tessler, Y.; Finberg, J.P.M.; Haick, H. Detection of asymptomatic nigrostriatal dopaminergic lesion in rats by exhaled air analysis using carbon nanotube sensors. ACS Chem. Neurosci. 2012, 3, 161–166. [Google Scholar] [CrossRef]
- Chatterjee, S.; Castro, M.; Feller, J.F. An e-nose made of carbon nanotube based quantum resistive sensors for the detection of eighteen polar/nonpolar VOC biomarkers of lung cancer. J. Mater. Chem. B: Biol. Med. 2013, 1, 4563–4575. [Google Scholar] [CrossRef]
- Rakotomalala, R. TANAGRA: Free software for teaching & Research. EGC’2005 Proc. 2005, 2, 697–702. [Google Scholar]
- Lu, J.; Kumar, B.; Castro, M.; Feller, J.F. Vapour sensing with conductive polymer nanocomposites (CPC): Polycarbonate-carbon nanotubes transducers with hierarchical structure processed by spray layer by layer. Sens. Actuators B: Chem. 2009, 140, 451–460. [Google Scholar] [CrossRef]
- Kumar, B.; Castro, M.; Feller, J.F. Quantum resistive vapour sensors made of polymer coated carbon nanotubes random networks for biomarkers detection. Chem. Sens. 2013, 3, 1–7. [Google Scholar]
- Nagle, H.T.; Gutierrez-Osuna, R.; Kermani, B.G.; Schiffman, S.S. Chapter 22: Environmental Monitoring, Handbook of Machine Olfaction: Electronic Nose Technology; Wiley VCH Verlag: Weinheim, Germany, 2002. [Google Scholar]
- Ragazzo-Sanchez, J.A.; Chalier, P.; Chevalier, D.; Ghommidh, C. Electronic nose discrimination of aroma compounds in alcoholised solutions. Sens. Actuators B: Chem. 2006, 114, 665–673. [Google Scholar]
- Peris, M.; Escuder-Gilabert, L. A 21st century technique for food control: Electronic noses. Anal. Chim. Acta 2009, 638, 1–15. [Google Scholar] [CrossRef]
© 2014 by the authors; licensee MDPI, Basel, Switzerland. This article is an open access article distributed under the terms and conditions of the Creative Commons Attribution license (http://creativecommons.org/licenses/by/3.0/).
Share and Cite
Feller, J.-F.; Gatt, N.; Kumar, B.; Castro, M. Selectivity of Chemoresistive Sensors Made of Chemically Functionalized Carbon Nanotube Random Networks for Volatile Organic Compounds (VOC). Chemosensors 2014, 2, 26-40. https://0-doi-org.brum.beds.ac.uk/10.3390/chemosensors2010026
Feller J-F, Gatt N, Kumar B, Castro M. Selectivity of Chemoresistive Sensors Made of Chemically Functionalized Carbon Nanotube Random Networks for Volatile Organic Compounds (VOC). Chemosensors. 2014; 2(1):26-40. https://0-doi-org.brum.beds.ac.uk/10.3390/chemosensors2010026
Chicago/Turabian StyleFeller, Jean-François, Nicolas Gatt, Bijandra Kumar, and Mickaël Castro. 2014. "Selectivity of Chemoresistive Sensors Made of Chemically Functionalized Carbon Nanotube Random Networks for Volatile Organic Compounds (VOC)" Chemosensors 2, no. 1: 26-40. https://0-doi-org.brum.beds.ac.uk/10.3390/chemosensors2010026