Article

Electrochemical Detection of H2O2 Released from Prostate Cancer Cells Using Pt Nanoparticle-Decorated rGO–CNT Nanocomposite-Modified Screen-Printed Carbon Electrodes

1
Department of Medicine, Kyung Hee University Graduate School, Seoul 02447, Korea
2
Department of Biomedical Engineering, College of Medicine, Kyung Hee University, Seoul 02447, Korea
*
Author to whom correspondence should be addressed.
Submission received: 18 June 2020 / Revised: 29 July 2020 / Accepted: 31 July 2020 / Published: 4 August 2020
(This article belongs to the Section Electrochemical Devices and Sensors)

Abstract

:
In this study, we fabricated platinum nanoparticles (PtNP)-decorated, porous reduced graphene oxide (rGO)–carbon nanotube (CNT) nanocomposites on a PtNP-deposited screen-printed carbon electrode (PtNP/rGO–CNT/PtNP/SPCE) for detection of hydrogen peroxide (H2O2), which is released from prostate cancer cells LNCaP. The PtNP/rGO–CNT/PtNP/SPCE was fabricated by a simple electrochemical deposition and co-reduction method. In addition, the amperometric response of the PtNP/rGO–CNT/PtNP/SPCE electrode was evaluated through consecutive additions of H2O2 at an applied potential of 0.2 V (vs. Ag pseudo-reference electrode). As a result, the prepared PtNP/rGO–CNT/PtNP/SPCE showed good electrocatalytic activity toward H2O2 compared to bare SPCE, rGO–CNT/SPCE, PtNP/SPCE, and rGO–CNT/PtNP/SPCE. In addition, the PtNP/rGO–CNT/PtNP/SPCE electrode exhibited a sensitivity of 206 μA mM−1·cm−2 to H2O2 in a linear range of 25 to 1000 μM (R2 = 0.99). Moreover, the PtNP/rGO–CNT/PtNP/SPCE electrode was less sensitive to common interfering substances, such as ascorbic acid, uric acid, and glucose than H2O2. Finally, real-time monitoring of H2O2 released from LNCaP cells was successfully performed by this electrode. Therefore, we expect that the PtNP/rGO–CNT/PtNP/SPCE can be utilized as a promising electrochemical sensor for practical nonenzymatic detection of H2O2 in live cells or clinical analysis.

1. Introduction

Prostate cancer is the most commonly diagnosed malignancy and a major cause of cancer-related death in men [1,2]. It can progress into a more advanced stage via generation of oxidative stress, which can cause the formation of reactive oxygen species (ROS), as well as activation of the androgen receptor [3]. ROS, including hydrogen peroxide (H2O2), superoxide (O2), and hydroxyl radical (•OH), have been involved in the mediation of apoptosis and other modes of programmed cell death [4,5]. In particular, overproduction or dysregulation of H2O2 in vivo can cause damage to the brain or other tissues, and it can trigger various diseases, such as cardiovascular disease, Alzheimer’s disease, and cancer [6,7,8,9]. Cancer cells produce an enhanced ROS level compared to normal cells [4], and the concentration of H2O2 in cancer cells increases as the tumor grows [10]. The H2O2 level is also related to the aggressive phenotype of prostate cancer cells [11]. Therefore, endogenous H2O2 can be utilized as a biomarker of cancer diagnosis. Furthermore, it is necessary to understand the changes in H2O2 concentration during apoptosis of cancer cells induced by drugs in order to chemically control cancer. H2O2 also has a wide range of applications in other fields, such as food industry, environmental science, and pharmaceuticals. Thus, a simple, cheap, and sensitive detection method of H2O2 is required.
During the past decade, various analytical methods, including spectrophotometry [12,13], fluorescence analysis [14,15], and electrochemical sensors [16,17], have been developed for detection of H2O2. Among them, electrochemical sensors received significant attention due to many practical advantages, including high sensitivity, rapid response time, portability, low cost, and ease of operation [17,18,19]. In particular, an amperometric sensor can be very useful in biological applications because of its ability to provide reliable responses in real time, even in complex biological systems. Hence, it can provide precise kinetic information on the exocytotic process [20]. However, most of the conventional electrochemical H2O2 sensors utilize natural enzymes with high sensitivity and selectivity, although enzyme-based sensors have drawbacks including their high cost, complicated immobilization process, and poor stability response to changes in environmental conditions, such as temperature, pH, humidity, and toxic materials, because of the intrinsic nature of enzymes [21]. In addition, hemoglobin (HB)-containing electrochemical biosensors for detecting H2O2 require appropriate immobilization biopolymers for HB such as chitosan, silk fibroin, and zein [22]. To solve this problem, non-enzymatic sensors based on noble metal nanoparticles (NPs), such as gold (Au), silver (Ag), platinum (Pt), and Pt/Au bimetallic nanostructure, have received much more attention due to their unique advantages, such as rapid response and high stability [22,23,24,25,26]. Among them, PtNPs exhibit good electrocatalytic property toward H2O2, as well as convenience of electron transfer and biocompatibility [27]. It has been demonstrated that they decrease the oxidation/reduction overvoltage in the determination of H2O2, which can easily avoid the interferents, like ascorbic acid (AA) and uric acid (UA) [28,29].
Recently, reduced graphene oxide (rGO) and its nanocomposites have been widely used in preparing electrochemical sensors to improve their performance [16,30,31,32]. In particular, the interconnected networks of rGO have several advantages, including greater surface area, faster charge transfer, and lower mass transport resistance [33]. In addition, metal NP-dispersed graphene networks show enhanced catalytic activity and faster electron transfer rate because they can allow various electroactive ions or target analytes to easily access and diffuse across individual graphene sheets [34,35]. Therefore, some electrochemical sensors utilizing NP-embedded rGO have been developed to catch the signal of cell-released H2O2. Yu et al. [36] reported an ITO electrode modified with electrodeposited graphene oxide (GO) and gold nanoclusters for the detecting the release of H2O2 from bupivacaine-injured neuroblastoma cells. The method was further applied to evaluate the cell toxicity of bupivacaine and the antibiotic effect of lipoic acid, but it did not show a wide linear dynamic range due to its 2D structure. Zhang et al. [37] reported a freestanding nanohybrid paper electrode assembled from 3D functionalized graphene frameworks for the real-time monitoring of H2O2 secreted from different breast cells. They can distinguish the normal breast cell from the cancer breast cells MDA-MB-231 and MCF-7 cells by comparing the relative responses of the secreted H2O2. Wang et al. [38] reported hierarchical NiCo2O4-CoNiO2 hybrids embedded in a partially rGO electrode for H2O2 released from human lung cancer H460 cells. Long et al. [39] suggested co-embedded N-doped hierarchical carbon arrays with boosting electrocatalytic activity for in situ electrochemical detection of H2O2 in human breast cancer MDA-MB-231 and human cervical cancer HeLa cells. Yang et al. [40] reported a 3D monolithic and metallic form (Ag-wire foam) electrode to detect H2O2 in three cancer cells such as human leukemia K562, HeLa, and MCF-7 cells. Although they showed a low limit of detection and broad linear detection range, these 3D materials required the complicated chemical processes or harsh experimental conditions such as high temperature during the synthesis process. Therefore, it is necessary to develop a simple, facile, and sensitive amperometric sensor for H2O2 detection.
Jiao et al. [41] utilized a one-pot and cost-effective method for preparing poly (diallyldimethylammonium chloride)-capped AuPtAg/rGO nanohybrids. Rasas et al. [42] proposed an enzyme-free carbon black–Prussian Blue-based electrochemical sensor for H2O2 sensing in neuroblastoma cells. In our previous study, we prepared an ultrasensitive and stable sensing platform based on AuNP-decorated three-dimensional rGO–carbon nanotube (CNT) nanocomposites by a one-pot electrochemical synthesis for detection of tryptase as a potential biomarker of allergic rhinitis [33].
In this study, we introduce a facile and sensitive non-enzymatic electrochemical sensor based on the PtNP-embedded rGO–CNT nanocomposite (PtNP/rGO–CNT) on a PtNP-modified screen-printed carbon electrode (SPCE) for detection of H2O2 released from live prostate cancer cells, LNCaP. To increase the effective area of the working electrode, PtNPs were electrodeposited onto the surface of SPCE (PtNP/SPCE). The rGO–CNT nanocomposite was then prepared on PtNP/SPCE by a simple electrochemical deposition and co-reduction method (rGO–CNT/PtNP/SPCE). Small amounts of CNTs were utilized as spacers to form interconnected rGO networks. Finally, PtNPs were decorated onto the surface of rGO–CNT nanocomposites (PtNP/rGO–CNT/PtNP/SPCE). We investigated the analytical performance of these PtNP/rGO–CNT/PtNP/SPCEs, including their sensitivity, selectivity, and reproducibility as a non-enzymatic H2O2 sensor. Moreover, the concentration of H2O2 released from LNCaP cells by phorbol 12-myristate 13-acetate (PMA) stimulation was successfully measured, indicating that this sensor might be promising for practical application in real-time monitoring of H2O2 in vitro and in vivo. A schematic illustration of the fabrication and sensing protocol of the PtNP/rGO–CNT/PtNP/SPCE sensor for detection of H2O2 released from live LNCaP cells is shown in Figure 1.

2. Materials and Methods

2.1. Reagents

GO (≥95.0%), multi-walled CNT (MWCNT, ≥98.0%), chloroplatinic acid hexahydrate (H2PtCl6·6H2O), potassium chloride (KCl), potassium hexacyanoferrate(III) (K3Fe(CN)6), potassium hexacyanoferrate(II) trihydrate (K4Fe(CN)6·3H2O), potassium phosphate monobasic (KH2PO4), potassium phosphate dibasic (K2HPO4), H2O2 (30 wt % in H2O), ascorbic acid (AA), uric acid (UA), glucose, PMA, and dimethyl sulfoxide (DMSO) were purchased from Sigma-Aldrich (St. Louis, MO, USA). RPMI 1640 supplemented with L-glutamine was obtained from Corning (Glendale, AZ, USA). Fetal bovine serum (FBS), penicillin, and streptomycin were purchased from Gibco (Grand Island, NY, USA). Whatman lens cleaning tissue 105 was purchased from GE Healthcare Life Sciences (Pittsburgh, PA, USA). All reagents were of analytical grade and were used without further purification. All aqueous solutions were freshly prepared using deionized water (DW) of 18.2 MΩ·cm resistivity.

2.2. Apparatus

The surface morphology of the modified working electrode was characterized using a field emission scanning electron microscope (FE-SEM; S-4700, Hitachi, Tokyo, Japan). All electrochemical experiments, including cyclic voltammetry (CV) and chronoamperometry (CA), were carried out with a Compactstat (Ivium Technology, Eindhoven, The Netherlands) at room temperature. The SPCE containing a carbon working electrode (4 mm in diameter) was purchased from DropSens (DRP-C110, Oviedo, Asturias, Spain). The electrodes consisted of a carbon counter electrode and an Ag pseudo-reference electrode.

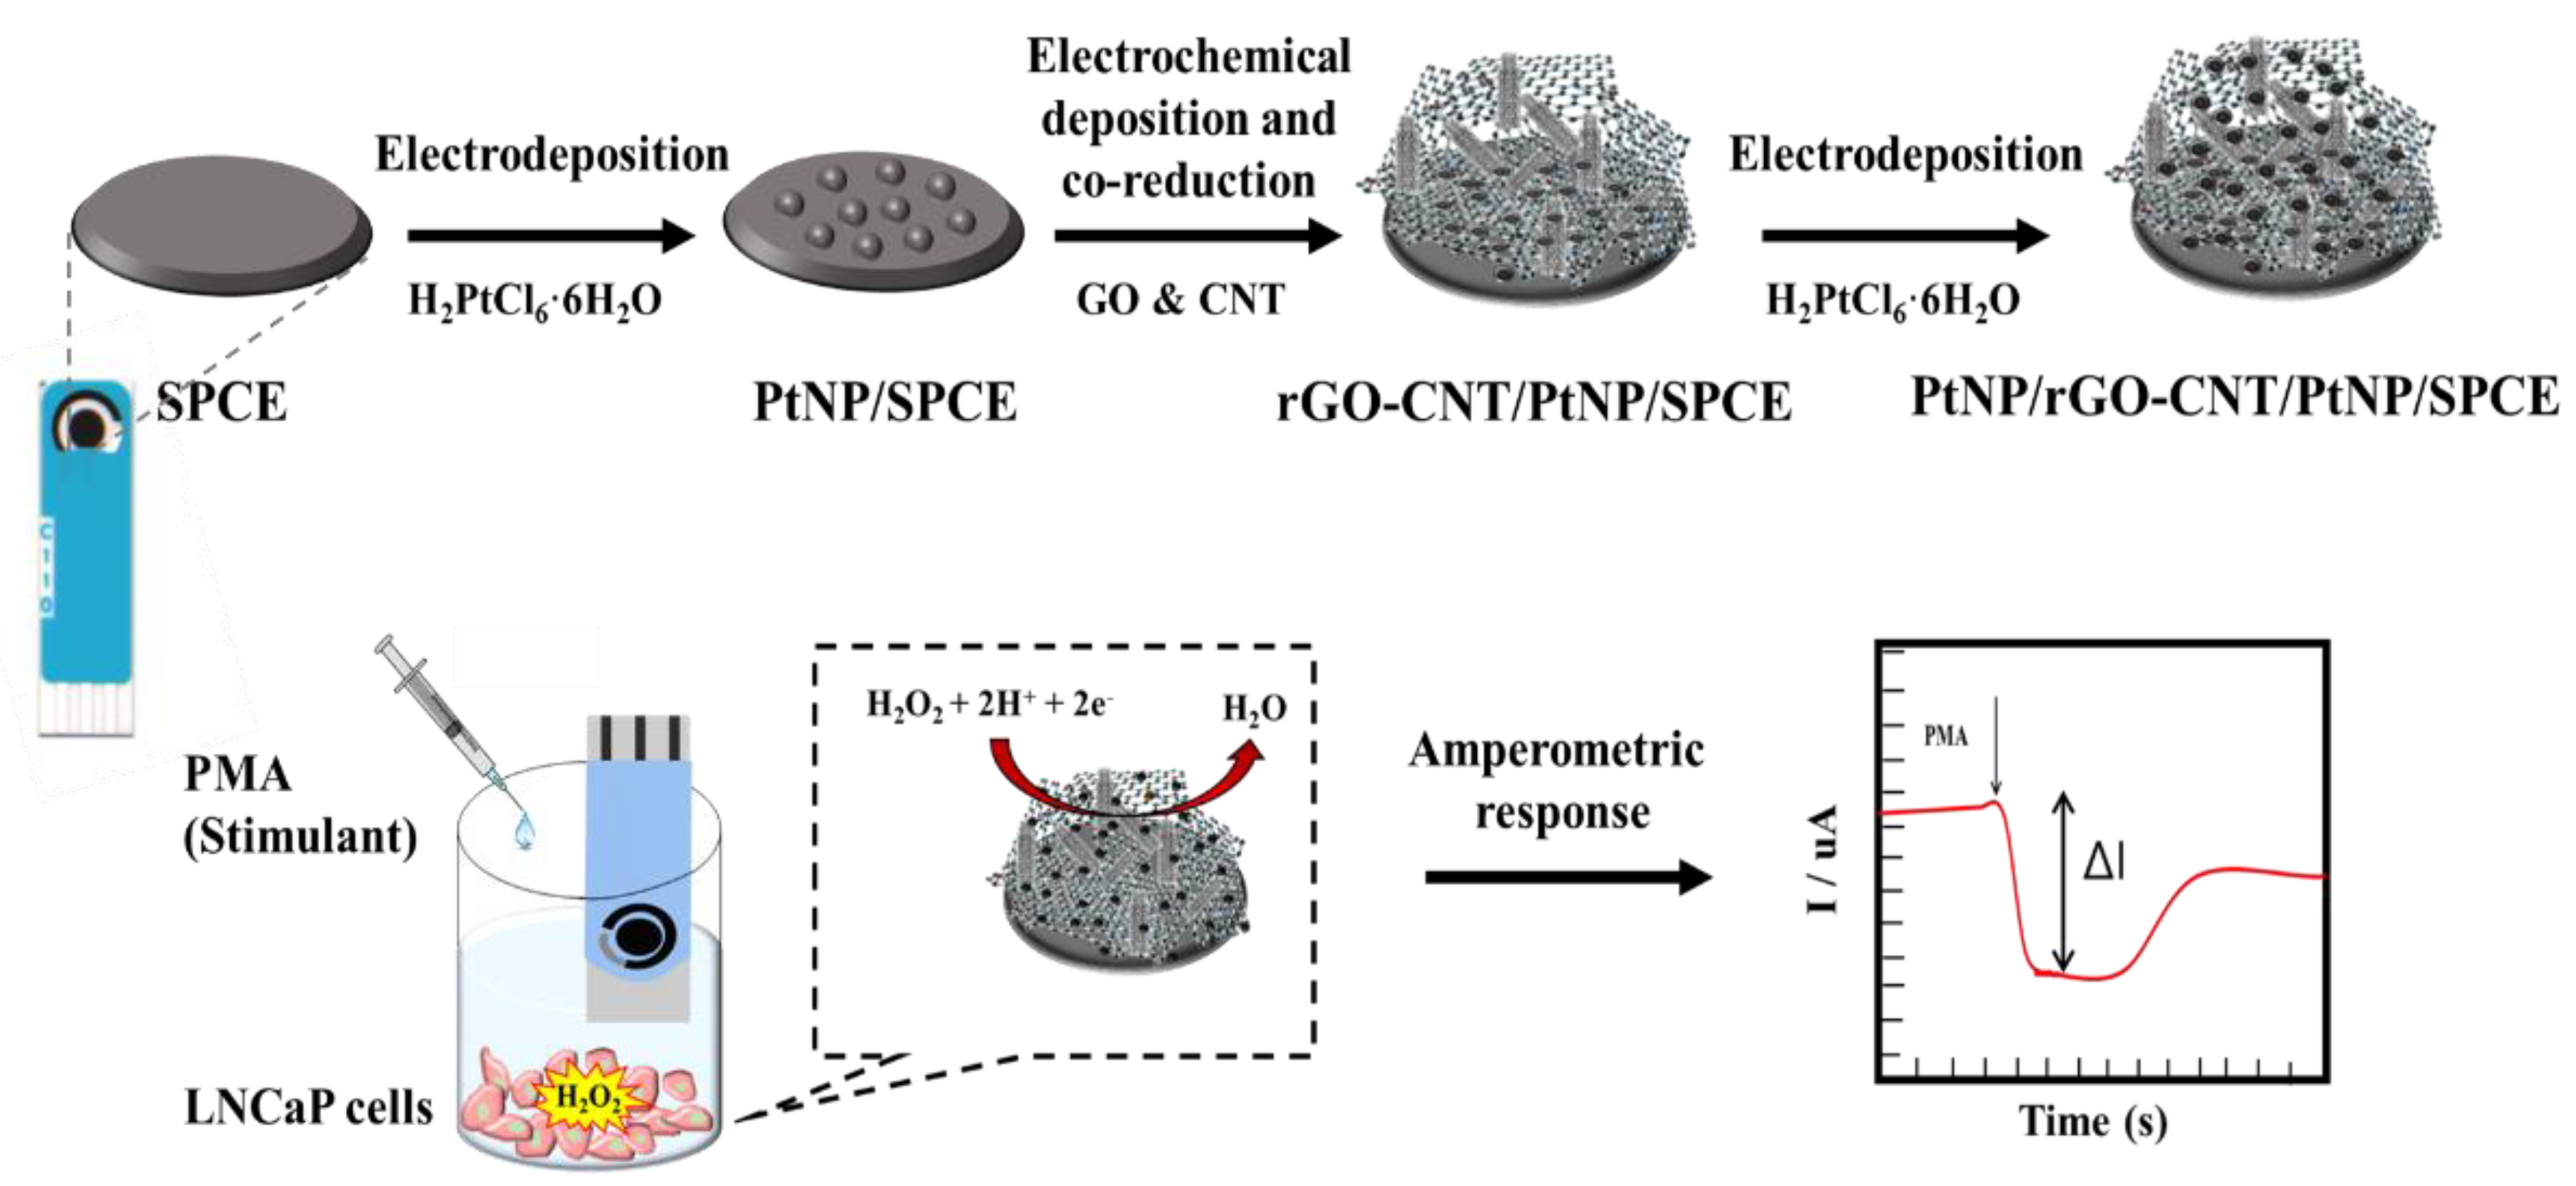
2.3. Preparation of PtNP/rGO–CNT on PtNP/SPCE

The bare SPCE was first activated by placing it in a 0.5 M H2SO4 solution and scanning by CV for 10 cycles with a scanning potential range from −0.2 to 1.0 V and a scanning rate of 100 mV/sec. Then, PtNPs were deposited onto the activated SPCE using 1 mM H2PtCl6·6H2O in 0.02 M phosphate buffered saline (PBS, pH 7.4) at a constant potential of −0.2 V for 600 s, after N2 gas purging for 600 s. The PtNP/SPCE was cleaned with DW and dried. The rGO–CNT nanocomposite was prepared using a previously described method [33]. Briefly, the MWCNT powder (0.15 mg/mL) was added in potassium phosphate buffer (PB, 0.067 M, pH 7.4) and dispersed in the solution for 10 min using an ultrasonic liquid processor (STH-500S; Sonictopia, Cheongju, Korea). After filtering the dispersed CNT solution using the lens cleaning tissue, GO solution in DW (final concentration 1.35 mg/mL) was mixed with the prepared solution (GO:MWCNT mixing ratio = 9:1, wt/wt) and then sonicated for 60 min to a homogeneous dispersion. Afterwards, the resultant mixture was saturated by bubbling with N2 gas for 10 min to remove the dissolved oxygen. Next, a single-step electrochemical deposition and co-reduction on the PtNP/SPCE was carried out using CV for six cycles in a potential range from 0.3 to −1.5 V (vs. Ag pseudo-reference electrode) and at a scan rate of 50 mV/sec under constant bubbling of N2. Subsequently, the resultant rGO–CNT on the PtNP/SPCE was washed repeatedly with DW to remove the physically adsorbed nanocomposites. Finally, PtNPs were re-deposited onto the rGO–CNT/PtNP/SPCE in 1 mM H2PtCl6·6H2O in 0.02M PBS solution at room temperature under a constant potential of −0.2 V for 600 s. The resulting PtNP/rGO–CNT/PtNP/SPCE was washed and stored in DW before use.

2.4. Electrochemical Detection of H2O2 Utilizing PtNP/rGO–CNT/PtNP/SPCE

The CV technique was used to evaluate the sensing capability of the PtNPs/rGO–CNT/PtNP/SPCE toward H2O2 and to compare it with that of bare SPCE, rGO–CNT/SPCE, and rGO–CNT/PtNP/SPCE. To demonstrate the importance of preformation of PtNPs on the electrode, the comparison was also made with PtNP/SPCE and PtNP/rGO–CNT/SPCE. CV measurements were performed using 2.5 mM H2O2 in 0.1 M PBS (pH 7.4) containing 0.1 M KCl with a scanning range from −0.7 to 0.3 V (vs. Ag pseudo-reference electrode) at a scan rate of 50 mV/sec. Detection for various concentrations of H2O2 was performed by the CA technique at an applied potential of −0.2 V with PtNP/rGO–CNT/PtNP/SPCE as the working electrode. Calibrations were performed by successive addition of H2O2 to attain final concentrations of 25, 50, 75, 100, 200, 300, 400, 500, 600, 700, 800, 900, and 1000 μM to 15 mL of 0.1 M PBS containing 0.1 M KCl under magnetic stirring and by measuring the current intensity after stabilization.

2.5. Detection of H2O2 in Live Prostate Cancer Cells

LNCaP cells were obtained from the Korea Cell Line Bank (Seoul, South Korea). LNCaP cells were routinely maintained in complete growth media consisting of RPMI 1640 supplemented with L-glutamine, 10% heat-inactivated FBS, and 1% penicillin/streptomycin in a 5% CO2 incubator at 37 °C under a humidified atmosphere. To measure the endogenous H2O2 level released from live LNCaP cells, cells (1 × 10⁶, 2 × 10⁶, and 5 × 10⁶ cells) were seeded in a 24-well plate and incubated for 24 h. After changing media into PBS within the plate, the PtNP/rGO–CNT/PtNP/SPCE was placed in the plate for amperometric detection. After a steady-state background was obtained, 0.2 mg/mL of PMA dissolved with DMSO was injected within the cell culture plate to stimulate the release of H2O2 in cells.

3. Results and Discussion

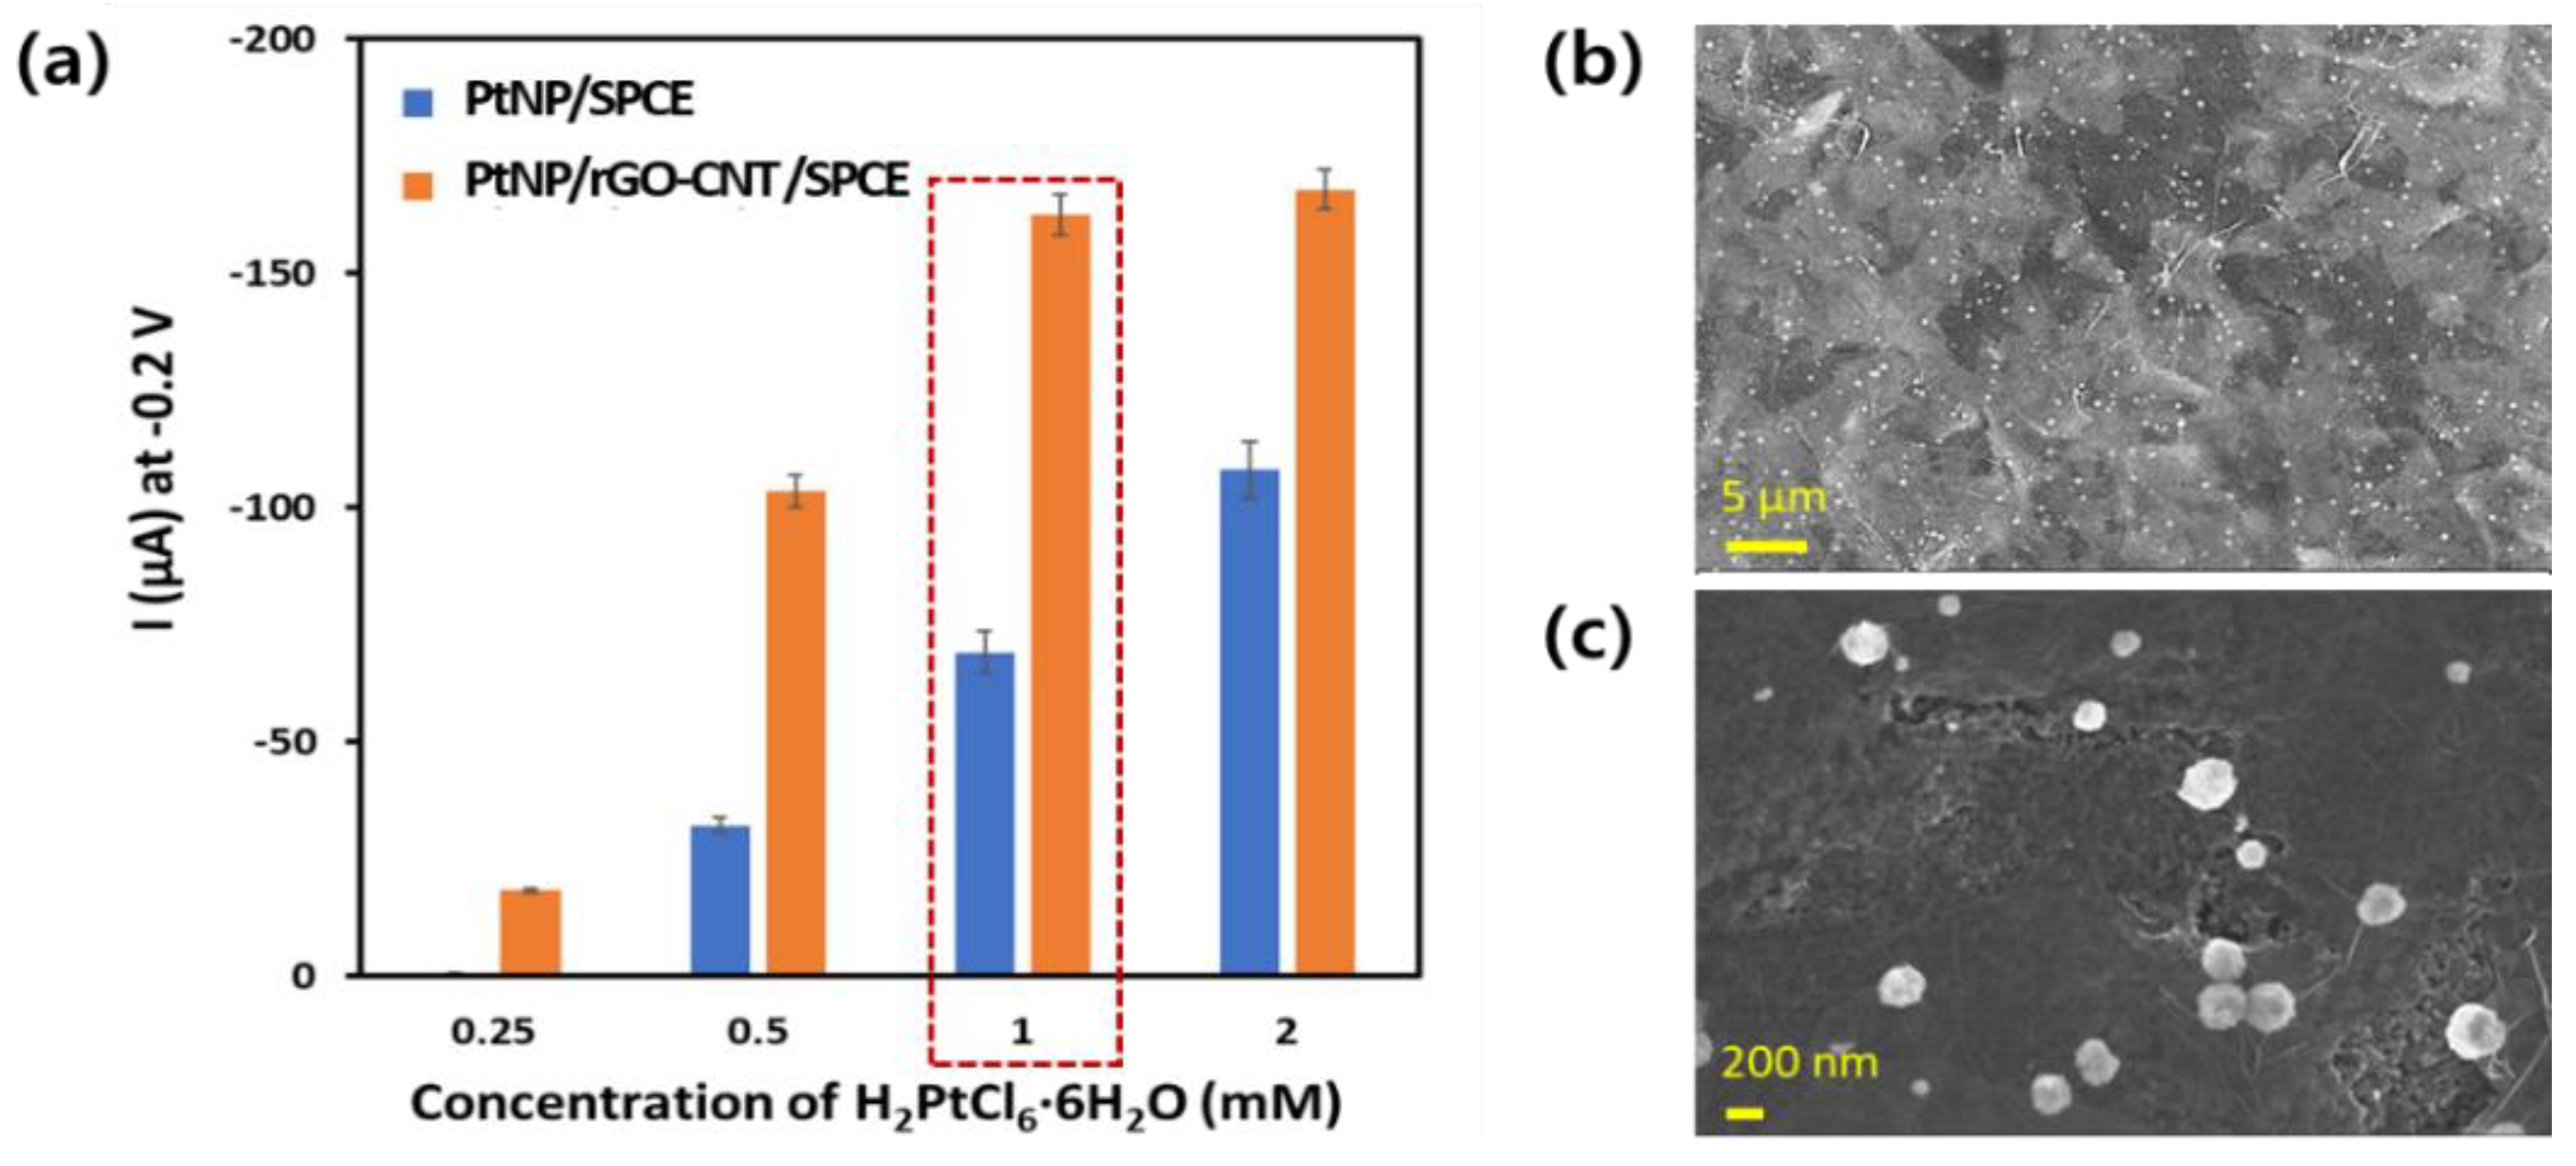
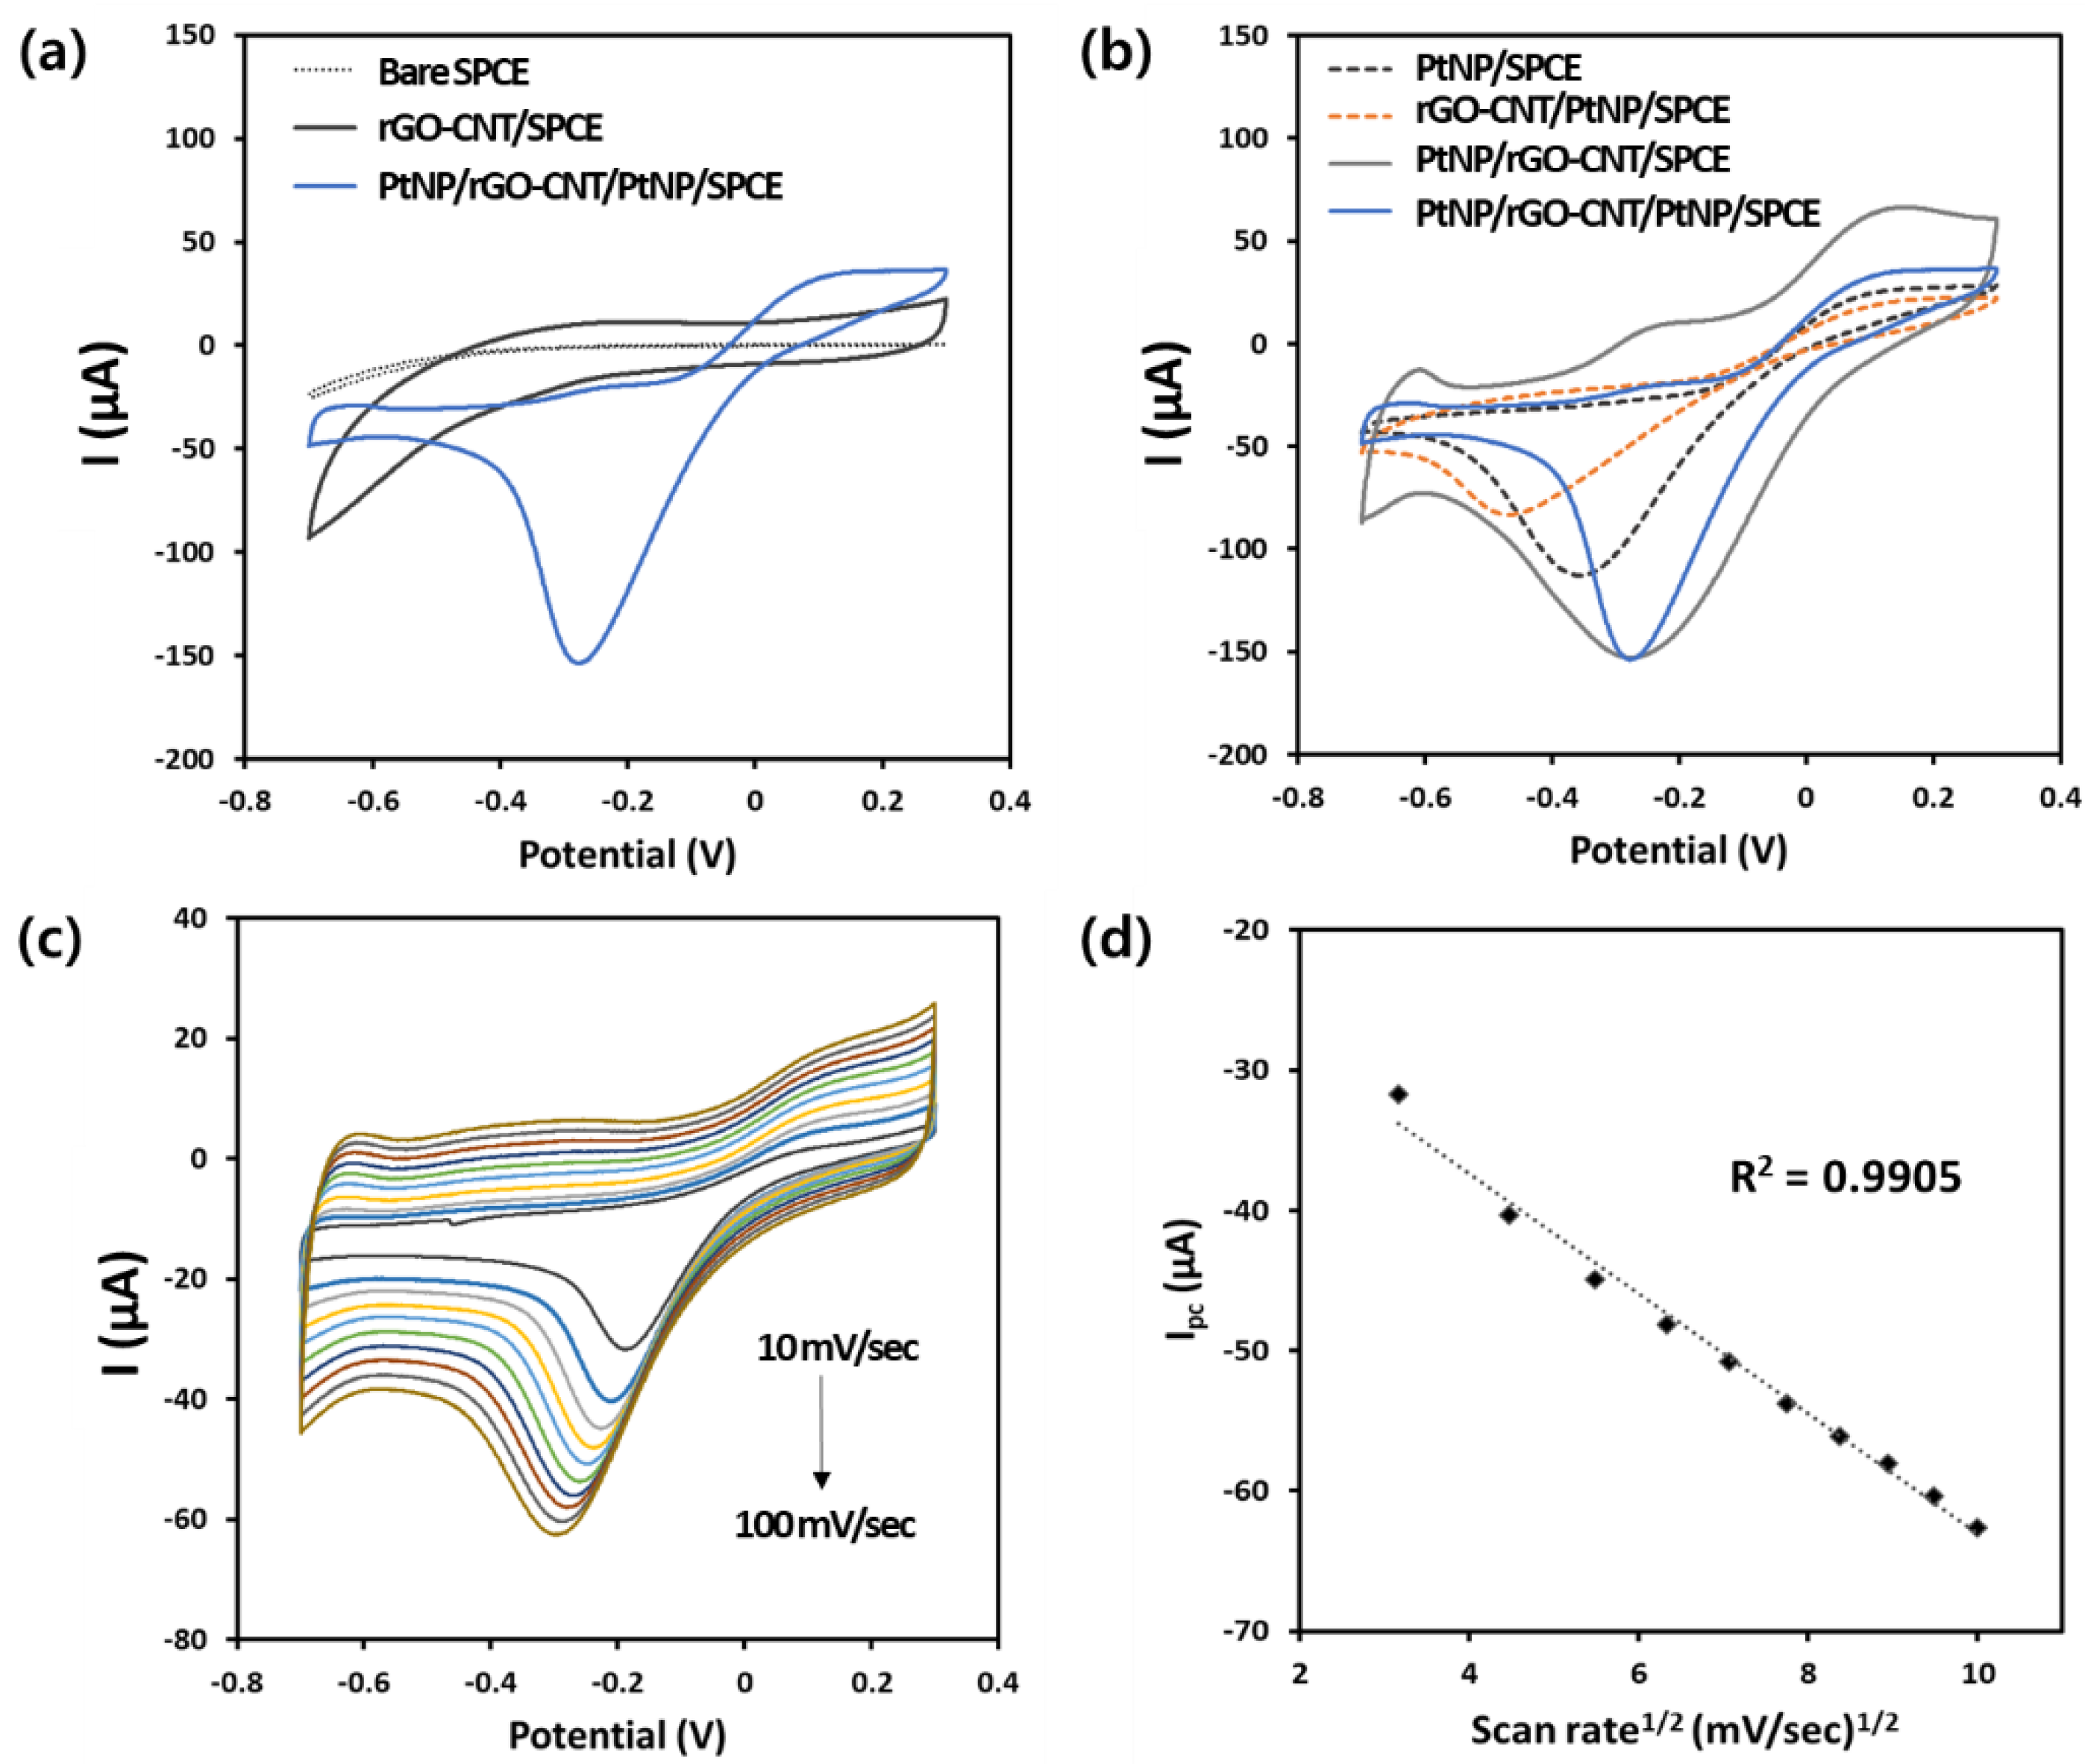
3.1. Preparation and Characterization of PtNP/rGO–CNT/PtNP/SPCE

The rGO has received significant attention in electrochemical sensors due to the high electrical conductivity, excellent physical and chemical properties, and good stability [30,33]. It can provide a lot of active defect sites with significant turbulence and enlarge layer spacing that can effectively trap active species [43]. Furthermore, rGO is an excellent carrier to assist other NPs to obtain rapid electrochemical kinetics during electrocatalytic reactions, resulting in a faster and more sensitive current response [31]. However, due to the strong π–π stacking interaction layer-by-layer of each rGO sheet, restacking and aggregation can easily occur in the rGO [44], thus reducing the effective surface area and diffusion of analytes or electrolytes [45]. Therefore, it is necessary to prepare interconnected rGO networks that allow various electroactive ions or target analytes to easily access and diffuse across individual graphene sheets. In the previous report, we introduced a simple and facile method for rGO nanocomposites by one-pot electrochemical synthesis (electrochemical deposition and co-reduction), using a small amount of CNTs as spacers. Therefore, in this study, interconnected rGO–CNT nanocomposites by electrochemical synthesis were utilized as a scaffold for PtNPs, showing good electrocatalytic property toward H2O2 because they have large active surface area, high conductivity and stability, and unhindered substance diffusion. Figure S1 shows the effect of the mixing ratio between GO and CNT on the current response of the electrode to H2O2. From the CV results of the rGO–CNT electrode in PBS solution (0.1 M, pH 7.4) containing 2.5 mM H2O2, the 9:1 ratio between GO and CNT exhibited the highest ΔIpc to H2O2.
To obtain better electrocatalytic performance of the electrode, we optimized the concentration of H2PtCl6·6H2O for PtNP/rGO–CNT on the SPCE. Figure 2a indicates the change in the cathodic current response of PtNP/rGO–CNT/SPCE and PtNP/SPCE at −0.2 V according to the concentration of H2PtCl6·6H2O (0.25, 0.5, 1 and 2 mM) solution, using 2.5 mM H2O2 in PBS containing 0.1 M KCl. As shown in Figure 2a, the maximum current of the PtNP/rGO–CNT/SPCE was observed with 1 mM H2PtCl6·6H2O. Although the current of PtNP/SPCE increased with an increase in the H2PtCl6·6H2O concentration, the current difference between PtNP/rGO–CNT/SPCE and PtNP/SPCE showed a maximum value at 1 mM H2PtCl6·6H2O. Therefore, 1 mM H2PtCl6·6H2O was selected as the optimal concentration for PtNP/rGO–CNT on SPCE. The surface morphology of the PtNP/rGO–CNT/PtNP/SPCE was characterized by SEM. As shown in Figure 2b, PtNPs were well-dispersed on the surface of the rGO–CNT nanocomposite and SPCE. It was possible to distinguish the spherical nanostructure of PtNPs on rGO–CNT/SPCE from a highly magnified SEM image (Figure 2c).
The electrochemical characterization of differently modified SPCEs was investigated by CV. Figure 3a shows the CV curves of bare SPCE, rGO–CNT/SPCE, and PtNP/rGO–CNT/PtNP/SPCE electrodes in N2-saturated PBS (0.1 M, pH 7.4) solution containing 2.5 mM H2O2 and 0.1 M KCl. To investigate if the active sites for detection of H2O2 were mainly from PtNPs, the CV curves of bare SPCE and rGO–CNT/SPCE toward H2O2 were recorded. As a result, the cathodic current response of the bare SPCE or rGO–CNT/SPCE to H2O2 was negligible. Compared to the bare SPCE and rGO–CNT/SPCE, a remarkable reduction current of −153.7 μA peak was observed at −0.28 V for the PtNP/rGO–CNT/PtNP/SPCE.
We compared the reduction current response of PtNP/rGO–CNT/PtNP/SPCE toward H2O2 with that of PtNP/SPCE, rGO–CNT/SPCE, and PtNP/rGO–CNT/SPCE, in order to investigate the effect of the rGO–CNT nanocomposite scaffold for PtNPs. As shown in Figure 3b, the cathodic peak current (Ipc) and peak potential (Epc) of PtNP/SPCE were −112.9 μA and −0.36 V, respectively. After deposition of rGO–CNT on PtNP/SPCE, the Ipc decreased to −83.2 μA and the Epc increased to −0.47 V. Because PtNPs possessed better electrocatalytic property toward H2O2 [27], the Ipc of rGO–CNT/PtNP/SPCE was lower than that of PtNP/SPCE, and the Epc of rGO–CNT/PtNP/SPCE was shifted to a more negative potential due to slow electron transfer kinetics between rGO–CNT nanocomposite and H2O2, compared to PtNP/SPCE. This result indicates that the rGO–CNT nanocomposite was successfully deposited onto the surface of PtNP/SPCE. The Ipc and Epc of PtNP/rGO–CNT/SPCE were −152.8 μA and −0.28 V, respectively. Although the Ipc and Epc of PtNP/rGO–CNT/SPCE were very similar to those of PtNP/rGO–CNT/PtNP/SPCE (−153.7 μA and −0.28 V), the peak width of PtNP/rGO–CNT/PtNP/SPCE was narrower than that of PtNP/rGO–CNT/SPCE. This might be attributed to the fact that PtNPs electrodeposited onto the surface of SPCE would increase the effective area of the working electrode, resulting in fast electron transfer. In general, the peak potentials, peak widths, and relative peak height enables the characterization of the electrode kinetics. The peaks become smaller and broader (larger half-peak width) as the electrode reaction is irreversible [46]. In addition, the differences of Ipc between PtNP/rGO–CNT/PtNP/SPCEs were smaller than those of PtNP/rGO–CNT/SPCEs (Figure S2), so we thought that PtNPs on SPCE might help rGO–CNT nanocomposites form on the working electrode homogeneously. Consequently, PtNP/rGO–CNT/PtNP/SPCE showed the highest Ipc with the lowest standard deviation and the lowest Epc. This result indicates that PtNP/rGO–CNT/PtNP/SPCE possessed excellent catalytic activity toward H2O2. In addition, different electrochemical behavior of PtNP/SPCE and PtNP/rGO–CNT/PtNP/SPCE can be explained by the PtNP dispersion and surface properties. The interconnected structure of the rGO–CNT nanocomposite can facilitate the dispersion of PtNPs on their surface, increasing the specific area of these materials, and it can improve the catalytic efficiency [27,47]. Furthermore, owing to the high electronic conductivity of the rGO–CNT nanocomposite, charge might be easily transmitted along the rGO–CNT networks toward the dispersed PtNPs where the electrocatalytic reaction occurs [27].
In addition, the effect of the scan rates on the sensitivity of the PtNP/rGO–CNT/PtNP/SPCE was investigated; thus, the CVs of the PtNP/rGO–CNT/PtNP/SPCE response to H2O2 at different scan rates from 10 to 100 mV/sec were recorded. As shown in Figure 3c and d, the Ipc showed a linear relationship with the square root of scan rate in the range of 10~100 mV/sec (R2 = 0.9905). The result indicates that a diffusion-controlled electron process occurred for H2O2 reduction, which is the ideal situation for the quantitative determination.

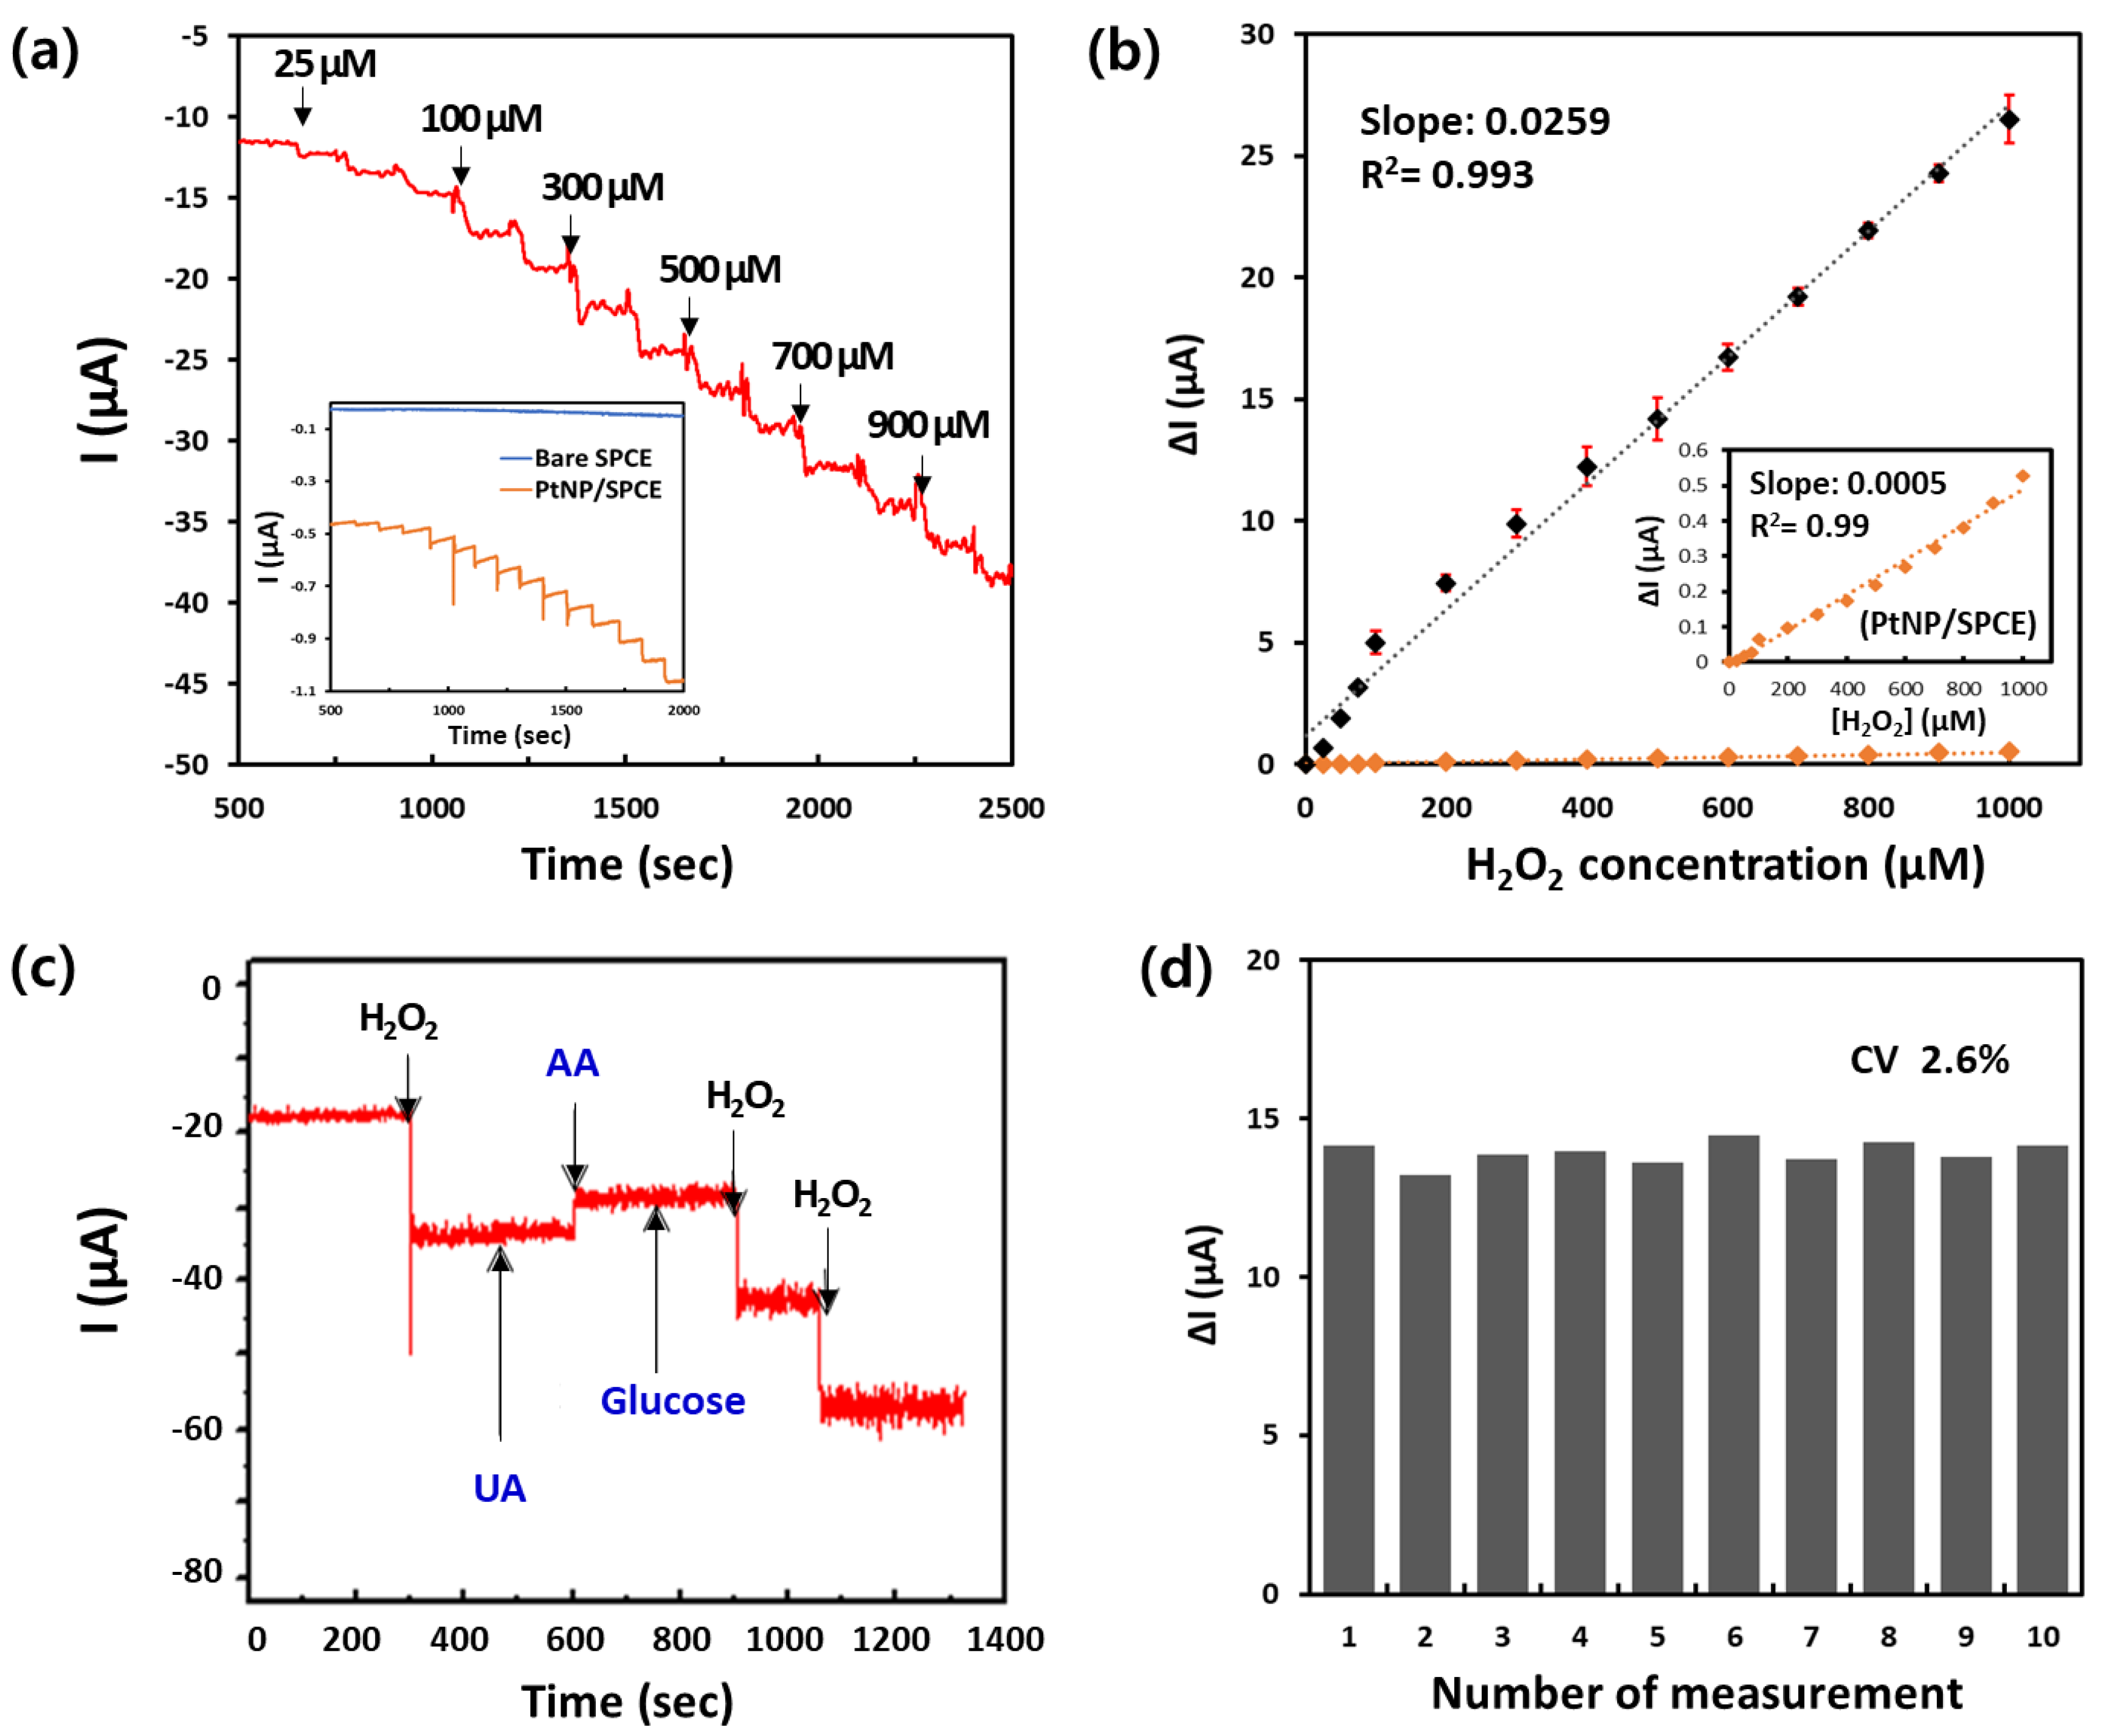
3.2. Analytical Performance of PtNP/rGO–CNT/PtNP/SPCE toward H2O2

Prior to the evaluation of the analytical performance, we optimized the potential applied on the PtNP/rGO–CNT/PtNP/SPCE for the detection of H2O2 from the CA experiments. As shown in Figure S3, the potential of −0.2 V showed the maximum slope (0.0259) and R2 (0.990). Consequently, an applied potential of −0.2 V was chosen as the working potential in subsequent experiments.
We investigated the performance of the PtNP/rGO–CNT/PtNP/SPCE for detection of H2O2. The sensitivity and detection limit of PtNP/rGO–CNT/PtNP/SPCE for H2O2 were estimated by amperometric measurements. Under optimized conditions, the current response of the prepared PtNP/rGO–CNT/PtNP/SPCE was recorded for successive addition of H2O2 with different concentrations in PBS (0.1 M, pH 7.4) at an applied potential of −0.2 V. As shown in Figure 4a, the cathodic current of PtNP/rGO–CNT/PtNP/SPCE increased with an increasing H2O2 concentration. PtNP/rGO–CNT/PtNP/SPCE responded very rapidly to the addition of H2O2, producing steady-state current within 10 s. However, bare SPCE did not respond to the addition of H2O2 and PtNP/SPCE showed very small changes in cathodic current with an increasing H2O2 concentration. Figure 4b shows the calibration curve of the PtNP/rGO–CNT/PtNP/SPCE for detection of different concentrations of H2O2. The response of the PtNP/rGO–CNT/PtNP/SPCE was linear with respect to H2O2 concentration up to 1000 μM (R2 = 0.993), with a detection limit of 4.3 μM based on the signal-to-noise ratio of three (S/N = 3, according to the ICH Q2B guidelines) [48] and a detection sensitivity of 206 μA·mM−1·cm−2. Even so, the slope of the calibration curve of the PtNP/rGO–CNT/PtNP/SPCE was about 52 times greater than that of PtNP/SPCE. Actually, it seemed that there were two linear ranges, 0~100 μM and 100~1000 μM. The response of the PtNP/rGO–CNT/PtNP/SPCE was very linear with respect to H2O2 concentration from 100 to 1000 μM (R2 = 0.999), but the linearity in the concentration range from 0 to 100 μM decreased to R2 = 0.973. It might be attributed to the difference of diffusion at the low concentration of H2O2.
Table 1 compares the sensing performance of our PtNP/rGO–CNT/PtNP/SPCE non-enzymatic biosensor with that of other PtNPs or GO-modified electrodes for detection of H2O2. Our sensor demonstrated good performance in terms of applied potential and wide linear range, together with a proper sensitivity. This might be attributed to good electrocatalytic activity by well-dispersed PtNPs and rapid electron transfer of the interconnected rGO–CNT nanocomposite.
Selectivity is a major important challenge of a non-enzymatic electrochemical biosensor [21,52]. Hence, the selectivity of the PtNP/rGO–CNT/PtNP/SPCE non-enzymatic biosensor was investigated by comparing the current responses of 500 μM H2O2 with that of other potential interfering substances (1 mM), including AA, UA, and glucose. As shown in Figure 4c, the current response obviously increased after the addition of H2O2. However, the interference currents caused by AA, UA, and glucose were negligible, in particular because the physiological level of AA is no more than 0.1 mM [21], it seems that the small interference current caused by AA (1 mM) is not significant in physiological conditions such as live cells or body fluid. The current obviously increased again after H2O2 was added for the second time. These results indicate that the PtNP/rGO–CNT/PtNP/SPCE non-enzymatic biosensor has good selectivity for detection of H2O2 without any effect caused by possible interferents.
The reproducibility of the PtNP/rGO–CNT/PtNP/SPCE biosensor was also assessed by detecting the amperometric responses to 500 μM H2O2 utilizing ten electrodes on different fabrication dates. Because the relative standard deviation of our biosensor was 2.6% (Figure 4d), the PtNP/rGO–CNT/PtNP/SPCE biosensor was highly reproducible. Furthermore, the short-term stability of our PtNP/rGO–CNT/PtNP/SPCE biosensor was examined by current responses to 500 μM H2O2 once a day after eight days of storage in DW at 4 °C. A 6.13% decrease in the current response was observed after eight days, and the prepared sensor exhibited an acceptable stability.

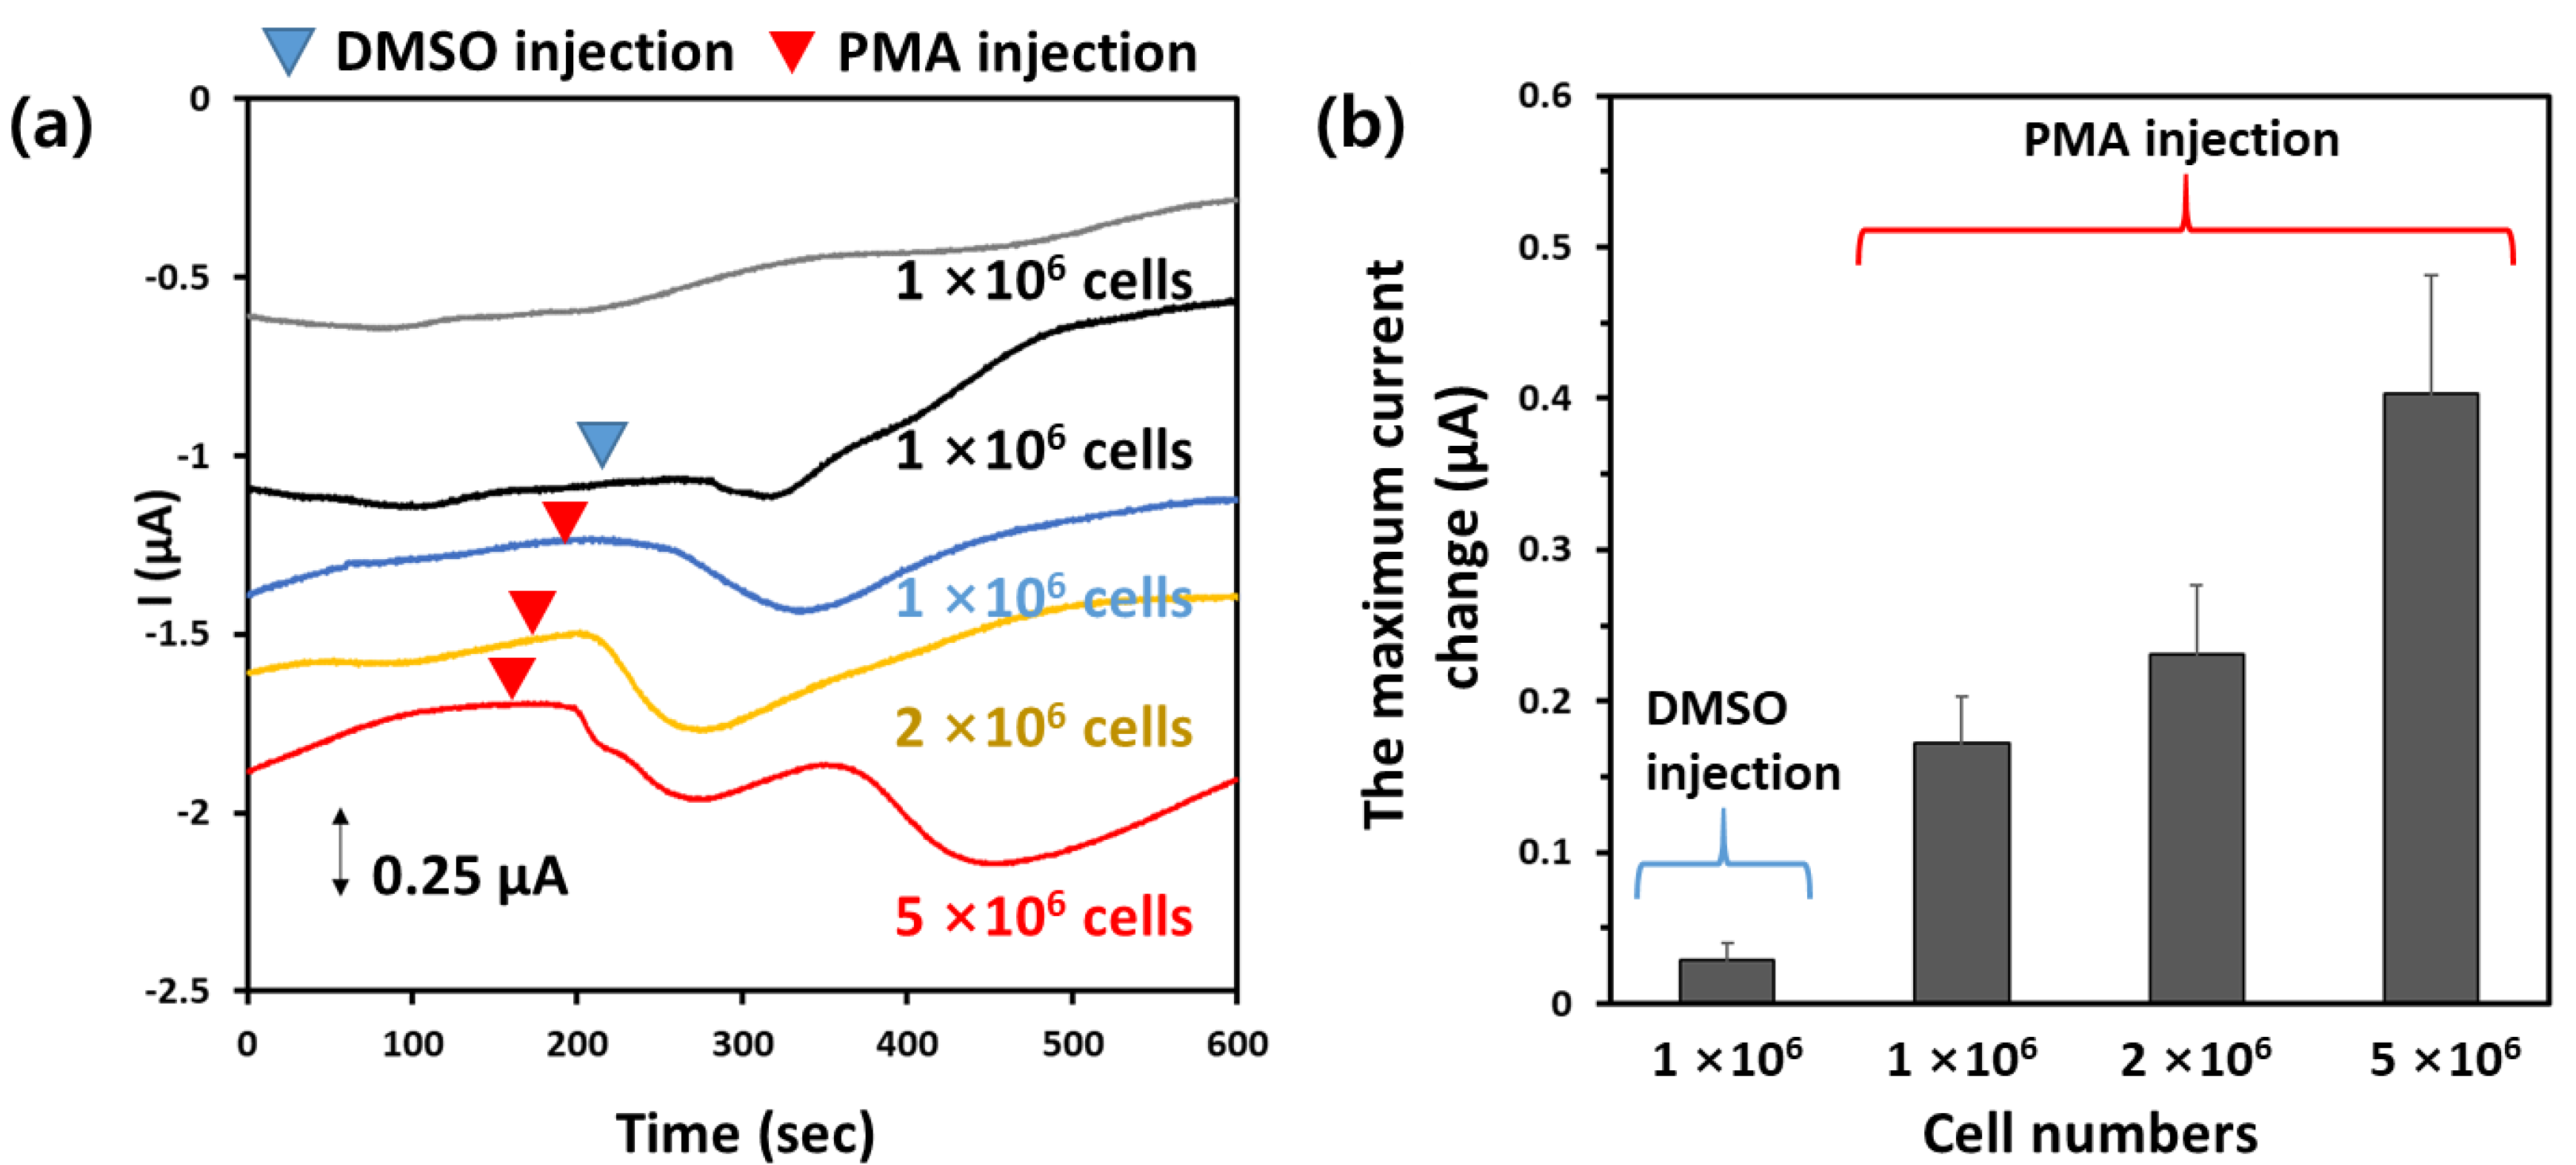
3.3. The Electrochemical Detection of H2O2 in Prostate Cancer Cells LNCaP

The PtNP/rGO–CNT/PtNP/SPCE was applied to detect H2O2 released from prostate cancer cells LNCaP, in order to verify the feasibility of PtNP/rGO–CNT/PtNP/SPCE for cell-based analysis. Real-time monitoring of H2O2 release was investigated using PMA, which is known to trigger H2O2 production from human cells [53]. As shown in Figure 5a, the LNCaP cells without any stimulation generated no significant change in current (gray line), but the current decreased gradually. The reason might be that H2O2 naturally released from cells was either consumed or diffused away from the electrode surface [54], and no significant current response was observed from the electrode with cells under DMSO injection as a solvent for PMA (black line). There was almost no change in the current from the sensor without cells (data not shown), but the current significantly increased after PMA injection according to the cell number. The maximum change in current was 0.18 ± 0.02 μA at 1 × 10⁶ cells, 0.24 ± 0.03 μA at 2 × 10⁶ cells, and 0.45 ± 0.05 μA at 5 × 10⁶ cells, respectively (Figure 5b). Although the data in this study provided the relative change of cellular H2O2 under PMA stress, not the absolute cellular H2O2 content, this electrode might be useful for further physiological and pathological applications, for instance, cancer and inflammatory processes, which release H2O2. In the future, we will plan to use the PtNP/rGO–CNT on PtNP/SPCE as both a scaffold for cell culture and electrode for real-time monitoring of H2O2. We expect that they can be utilized for the real-time monitoring of cellular behaviors under 3D in vivo-like microenvironments to reflect in vivo cell functions.

4. Conclusions

In summary, we introduced a facile and sensitive non-enzymatic H2O2 sensor based on PtNP-embedded rGO–CNT nanocomposites on the PtNP/SPCE electrode. The rGO–CNT nanocomposites were simply fabricated by one-pot electrochemical synthesis (electrochemical deposition and co-reduction). They provided not only efficient charge transport pathways, but also rapid diffusion and mass transport of the analytes. Therefore, they facilitated the dispersion of PtNPs on their surface, increasing the specific area of PtNPs, and they improved catalytic efficiency. Thus, the prepared PtNP/rGO–CNT/PtNP/SPCE showed good sensing performance for H2O2, including good sensitivity, wide linear range, high selectivity, and good reproducibility. Furthermore, our sensor could successfully detect H2O2 released from live LNCaP cells, showing potential for application in physiological and pathological H2O2 detection in vitro.

Supplementary Materials

The following are available online at https://www.mdpi.com/2227-9040/8/3/63/s1, Figure S1: Changes in cathodic peak current (Ipc) of CNT/rGO on GCE according to the mixing ratio between GO and CNT (wt/wt) in PBS solution (0.1 M, pH 7.4) containing 2.5 mM H2O2 and 0.1 M KCl, Figure S2: The cathodic peak current (Ipc) of PtNP/rGO–CNT/SPCE and PtNP/rGO–CNT/PtNP electrodes (n = 4, respectively) from the CV curves in N2-saturated PBS solution (0.1 M, pH 7.4) containing 2.5 mM H2O2 and 0.1 M KCl at a potential range from −0.7 to 0.3 V (Ag pseudo-reference electrode) and at a scan rate of 50 mV/sec, Figure S3: Effect of the applied potentials on the current response according to the H2O2 concentration.

Author Contributions

Conceptualization, G.-J.L.; methodology, S.L. and Y.J.L.; validation, J.H.K. and G.-J.L.; formal analysis, S.L. and Y.J.L.; investigation, S.L.; writing—original draft preparation, S.L. and G.-J.L.; writing—review and editing, J.H.K. and G.-J.L.; visualization, S.L.; supervision, G.-J.L.; project administration, G.-J.L.; funding acquisition, G.-J.L. All authors have read and agreed to the published version of the manuscript.

Funding

This study was supported by National Research Foundation grants funded by the Korean government (MSIP) (No. NRF-2018R1A2B6007635).

Conflicts of Interest

The authors declare no conflict of interest.

References

  1. Rahman, A.; Pallichankandy, S.; Thayyullathil, F.; Galadari, S. Critical role of H2O2 in mediating sanguinarine-induced apoptosis in prostate cancer cells via facilitating ceramide generation, ERK1/2 phosphorylation, and Par-4 cleavage. Free Radic. Biol. Med. 2019, 134, 527–544. [Google Scholar] [CrossRef] [PubMed]
  2. Lee, J.; Lee, Y.J.; Ahn, Y.J.; Choi, S.; Lee, G.J. A simple and facile paper-based colorimetric assay for detection of free hydrogen sulfide in prostate cancer cells. Sens. Actuators B Chem. 2018, 256, 828–834. [Google Scholar] [CrossRef]
  3. Kim, J.; Mizokami, A.; Shin, M.; Izumi, K.; Konaka, H.; Kadono, Y.; Kitagawa, Y.; Keller, E.T.; Zhang, J.; Namiki, M. SOD3 acts as a tumor suppressor in PC-3 prostate cancer cells via hydrogen peroxide accumulation. Anticancer Res. 2014, 34, 2821–2832. [Google Scholar] [PubMed]
  4. Galadari, S.; Rahman, A.; Pallichankandy, S.; Thayyullathil, F. Reactive oxygen species and cancer paradox: To promote or to suppress? Free Radic. Biol. Med. 2017, 104, 144–164. [Google Scholar] [CrossRef] [PubMed]
  5. Schumacker, P.T. Reactive oxygen species in cancer: A dance with the devil. Cancer Cell 2015, 27, 156–157. [Google Scholar] [CrossRef] [Green Version]
  6. Lin, M.T.; Beal, M.F. Mitochondrial dysfunction and oxidative stress in neurodegenerative diseases. Nature 2006, 443, 787–795. [Google Scholar] [CrossRef]
  7. Pramanik, D.; Dey, S.G. Active site environment of heme-bound amyloid β peptide associated with Alzheimer’s disease. J. Am. Chem. Soc. 2011, 133, 81–87. [Google Scholar] [CrossRef]
  8. Galaris, D.; Skiada, V.; Barbouti, A. Redox signaling and cancer: The role of “labile” iron. Cancer Lett. 2008, 266, 21–29. [Google Scholar] [CrossRef]
  9. Li, Z.; Xin, Y.; Wu, W.; Fu, B.; Zhang, Z. Topotactic conversion of copper(I) phosphide nanowires for sensitive electrochemical detection of H2O2 release from living cell. Anal. Chem. 2016, 88, 7724–7729. [Google Scholar] [CrossRef]
  10. Bai, Z.; Li, G.; Liang, J.; Su, J.; Zhang, Y.; Chen, H.; Huang, Y.; Sui, W.; Zhao, Y. Non-enzymatic electrochemical biosensor based on Pt NPs/RGO-CS-Fc nano-hybrids for the detection of hydrogen peroxide in living cells. Biosens. Bioelectron. 2016, 82, 185–194. [Google Scholar] [CrossRef]
  11. Kumar, B.; Koul, S.; Khandrika, L.; Meacham, R.B.; Koul, H.K. Oxidative stress is inherent in prostate cancer cells and is required for aggressive phenotype. Cancer Res. 2008, 68, 1777–1785. [Google Scholar] [CrossRef] [PubMed] [Green Version]
  12. Nagaraja, P.; Prakash, J.S.; Asha, S.C.; Bhaskara, B.L.; Kumar, S.A. Dibenzazepin hydrochloride as a new spectrophotometric reagent for determination of hydrogen peroxide in plant extracts. Environ. Monit. Assess. 2012, 184, 5983–5988. [Google Scholar] [CrossRef] [PubMed]
  13. Hoshino, M.; Kamino, S.; Doi, M.; Takada, S.; Mitani, S.; Yanagihara, R.; Asano, M.; Yamaguchi, T.; Fujita, Y. Spectrophotometric determination of hydrogen peroxide with osmium(VIII) and m-carboxyphenylfluorone. Spectrochim. Acta Part A 2014, 117, 814–816. [Google Scholar] [CrossRef] [PubMed]
  14. Abo, M.; Urano, Y.; Hanaoka, K.; Terai, T.; Komatsu, T.; Nagano, T. Development of a highly sensitive fluorescence probe for hydrogen peroxide. J. Am. Chem. Soc. 2011, 133, 10629–10637. [Google Scholar] [CrossRef] [PubMed]
  15. Jiafu, C.; Haiyin, L.; Ting, H.; Wenna, D.; Feng, L. Paper-based fluorescent sensor via aggregation induced emission fluorogen for facile and sensitive visual detection of hydrogen peroxide and glucose. Biosens. Bioelectron. 2018, 104, 152–157. [Google Scholar]
  16. Yu, G.; Wu, W.; Pan, X.; Zhao, Q.; Wei, X.; Lu, Q. High sensitive and selective sensing of hydrogen peroxide released from pheochromocytoma cells based on Pt-Au bimetallic nanoparticles electrodeposited on reduced graphene sheets. Sensors 2015, 15, 2709–2722. [Google Scholar] [CrossRef]
  17. He, G.; Gao, F.; Li, W.; Li, P.; Zhang, X.; Yin, H.; Yang, B.; Liu, Y.; Zhang, S. Electrochemical sensing of H2O2 released from living cells based on AuPd alloy-modified PDA nanotubes. Anal. Methods 2019, 11, 1651–1656. [Google Scholar] [CrossRef]
  18. Dai, H.; Lü, W.; Zuo, X.; Zhu, Q.; Pan, C.; Niu, X.; Liu, J.; Chen, H.; Chen, X. A novel biosensor based on boronic acid functionalized metal-organic frameworks for the determination of hydrogen peroxide released from living cells. Biosens. Bioelectron. 2017, 95, 131–137. [Google Scholar] [CrossRef]
  19. Xi, J.; Xie, C.; Zhang, Y.; Wang, L.; Xiao, J.; Duan, X.; Ren, J.; Xiao, F.; Wang, S. Pd Nanoparticles decorated N-doped graphene quantum dots@N-doped carbon hollow nanospheres with high electrochemical sensing performance in cancer detection. ACS Appl. Mater. Interfaces 2016, 8, 22563–22573. [Google Scholar] [CrossRef]
  20. Wu, P.; Cai, Z.; Gao, Y.; Zhang, H.; Cai, C. Enhancing the electrochemical reduction of hydrogen peroxide based on nitrogen-doped graphene for measurement of its releasing process from living cells. Chem. Commun. 2011, 47, 11327–11329. [Google Scholar] [CrossRef]
  21. Kim, W.S.; Lee, G.J.; Ryu, J.H.; Park, K.C.; Park, H.K. A flexible, nonenzymatic glucose biosensor based on Ni-coordinated, vertically aligned carbon nanotube arrays. RSC Adv. 2014, 4, 48310–48316. [Google Scholar] [CrossRef]
  22. Dos Santos Pereira, T.; Mauruto de Oliveira, G.C.; Santos, F.A.; Raymundo-Pereira, P.A.; Oliveira, O.N., Jr.; Janegitz, B.C. Use of zein microspheres to anchor carbon black and hemoglobin in electrochemical biosensors to detect hydrogen peroxide in cosmetic products, food and biological fluids. Talanta 2019, 194, 737–744. [Google Scholar] [CrossRef] [PubMed]
  23. Thirumalraj, B.; Rajkumar, C.; Chen, S.M.; Barathi, P. Highly stable biomolecule supported by gold nanoparticles/graphene nanocomposite as a sensing platform for H2O2 biosensor application. J. Mater. Chem. B 2016, 4, 6335–6343. [Google Scholar] [CrossRef] [PubMed]
  24. Yusoff, N.; Rameshkumar, P.; Mehmood, M.S.; Pandikumar, A.; Lee, H.W.; Huang, N.M. Ternary nanohybrid of reduced graphene oxide-nafion@silver nanoparticles for boosting the sensor performance in non-enzymatic amperometric detection of hydrogen peroxide. Biosens. Bioelectron. 2017, 87, 1020–1028. [Google Scholar] [CrossRef]
  25. Rupali, G.; Priya, S.; Vellaichamy, G.; Biplob, K.; Pankaj Kumar, R.; Dharmendra Kumar, Y.; Piyush Kumar, S. Palladium nanoparticles supported on mesoporous silica microspheres for enzyme-free amperometric detection of H2O2 released from living cells. Sens. Actuators B Chem. 2018, 276, 517–525. [Google Scholar]
  26. Raymundo-Pereira, P.A.; Shimizu, F.M.; Coelho, D.; Piazzeta, M.H.O.; Gobbi, A.L.; Machado, S.A.S.; Oliveira, O.N., Jr. A nanostructured bifunctional platform for sensing of glucose biomarker in artificial saliva: Synergy in hybrid Pt/Au surfaces. Biosens. Bioelectron. 2016, 86, 369–376. [Google Scholar] [CrossRef]
  27. Jiménez-Pérez, R.; González-Rodríguez, J.; González-Sánchez, M.I.; Gómez-Monedero, B.; Valero, E. Highly sensitive H2O2 sensor based on poly(azure A)-platinum nanoparticles deposited on activated screen printed carbon electrodes. Sens. Actuators B Chem. 2019, 298, 126878. [Google Scholar] [CrossRef] [Green Version]
  28. You, J.-M.; Kim, D.; Jeon, S. Electrocatalytic reduction of H2O2 by Pt nanoparticles covalently bonded to thiolated carbon nanostructures. Electrochim. Acta 2012, 65, 288–293. [Google Scholar] [CrossRef]
  29. Ravi Shankaran, D.; Uehara, N.; Kato, T. A metal dispersed sol-gel biocomposite amperometric glucose biosensor. Biosens. Bioelecton. 2003, 18, 721–728. [Google Scholar] [CrossRef]
  30. Shamkhalichenar, H.; Choi, J.W. Review-Non-enzymatic hydrogen peroxide electrochemical sensors based on reduced graphene oxide. J. Electrochem. Soc. 2020, 167, 037531. [Google Scholar] [CrossRef]
  31. Huang, Y.; Xue, Y.; Zeng, J.; Li, S.; Wang, Z.; Dong, C.; Li, G.; Kiang, J.; Zhou, Z. Non-enzymatic electrochemical hydrogen peroxide biosensor based on reduction graphene oxide-persimmon tannin-platinum nanocomposite. Mater. Sci. Eng. C 2018, 92, 590–598. [Google Scholar] [CrossRef] [PubMed]
  32. Raymundo-Pereira, P.A.; Baccarin, M.; Oliveira, O.N., Jr.; Janegitz, B.C. Thin films and composites based on graphene for electrochemical detection of biologically-relevant molecules. Electroanalysis 2018, 30, 1888–1896. [Google Scholar] [CrossRef]
  33. Lee, J.; Lee, Y.J.; Eun, Y.G.; Lee, G.J. An ultrasensitive electrochemical detection of tryptase using 3D macroporous reduced graphene oxide nanocomposites by one-pot electrochemical synthesis. Anal. Chim. Acta 2019, 1069, 47–56. [Google Scholar] [CrossRef] [PubMed]
  34. Hong, Q.; Yang, K.; Ge, K.L.; Liua, Z.; Li, F. Direct-laser-writing of three dimensional porous graphene frameworks on indium-tin oxide for sensitive electrochemical biosensing. Analyst 2018, 143, 3327–3334. [Google Scholar] [CrossRef]
  35. Govindhan, M.; Chen, A. Simultaneous synthesis of gold nanoparticle/graphene nanocomposite for enhanced oxygen reduction reaction. J. Power Sources 2015, 274, 928–936. [Google Scholar] [CrossRef]
  36. Yu, C.; Wang, Q.; Qian, D.; Li, W.; Huang, Y.; Chen, F.; Bao, N.; Gu, H. An ITO electrode modified with electrodeposited graphene oxide and gold nanoclusters for detecting the release of H2O2 from bupivacaine-injured neuroblastoma cells. Microchim. Acta 2016, 183, 3167–3175. [Google Scholar] [CrossRef]
  37. Zhang, Y.; Xiao, J.; Lv, Q.; Wang, L.; Dong, X.; Asif, M.; Ren, J.; He, W.; Sun, Y.; Xiao, F.; et al. In situ electrochemical sensing and real-time monitoring live cells based on freestanding nanohybrid paper electrode assembled from 3D functionalized graphene framework. ACS Appl. Mater. Interfaces 2017, 9, 38201–38210. [Google Scholar] [CrossRef]
  38. Wang, M.; Wang, C.; Liu, Y.; Hu, B.; He, L.; Ma, Y.; Zhang, Z.; Cui, B.; Du, M. Nonenzymatic amperometric sensor for hydrogen peroxide released from living cancer cells based on hierarchical NiCo2O4-CoNiO2 hybrids embedded in partially reduced graphene oxide. Microchim. Acta 2020, 187, 436. [Google Scholar] [CrossRef]
  39. Long, L.; Liu, H.; Liu, X.; Chen, L.; Wang, S.; Liu, C.; Dong, S.; Jia, J. Co-embedded N-doped hierarchical carbon arrays with boosting electrocatalytic activity for in situ electrochemical detection of H2O2. Sens. Actuators B Chem. 2020, 318, 128242. [Google Scholar] [CrossRef]
  40. Yang, Y.; Zhang, H.; Wang, Z.; Li, X.; Abdelsamie Abdelrahim Abdelsamie, A.; Yuan, X.; Fan, X.; Zhang, R.; Chang, H. Highly sensitive electrochemical detection of reactive oxygen species in living cancer cells using monolithic metallic foam electrodes. ChemElectroChem 2020, 7, 2485–2492. [Google Scholar] [CrossRef]
  41. Jiao, J.; Pan, M.; Liu, X.; Li, B.; Liu, J.; Chen, Q. A non-enzymatic sensor based on trimetallic nanoalloy with poly (diallydimethylammonium chloride)-capped reduced graphene oxide for dynamic monitoring hydrogen peroxide production by cancerous cells. Sensors 2020, 20, 71. [Google Scholar] [CrossRef] [PubMed] [Green Version]
  42. Rajas, D.; Della Pelle, F.; Del Carlo, M.; d’Angelo, M.; Dominguez-Benot, R.; Cimini, A.; Escarpa, A. Electrodeposited Prussian Blue on carbon black modified disposable electrodes for direct enzyme-free H2O2 sensing in a Parkinson’s disease in vitro model. Sens. Actuators B Chem. 2018, 275, 402–408. [Google Scholar] [CrossRef]
  43. Gnana Jumar, G.; Amala, G.; Gowtham, S.M. Recent advancements, key challenges and solutions in non-enzymatic electrochemical glucose sensors based on graphene platforms. RSC Adv. 2017, 7, 36949–36976. [Google Scholar] [CrossRef] [Green Version]
  44. Mo, S.; Peng, L.; Yuan, C.; Zhao, C.; Tang, W.; Ma, C.; Shen, J.; Yang, W.; Yu, Y.; Min, Y.; et al. Enhanced properties of poly(vinyl alcohol) composite films with functionalized graphene. RSC Adv. 2015, 5, 97738–97745. [Google Scholar] [CrossRef]
  45. Lee, K.H.; Lee, Y.W.; Lee, S.W.; Ha, J.S.; Lee, S.S.; Son, J.G. Ice-templated self-assembly of VOPO-rfis1-graphene nanocomposites for vertically porous 3D supercapacitor electrodes. Sci. Rep. 2015, 5, 13696. [Google Scholar] [CrossRef]
  46. Batchelor-McAuley, C.; Kätelhön, E.; Barnes, E.O.; Compton, R.G.; Laborda, E.; Molina, A. Recent advances in voltammetry. ChemistryOpen 2015, 4, 224–260. [Google Scholar] [CrossRef] [Green Version]
  47. Zhai, D.; Liu, B.; Shi, Y.; Pan, L.; Wang, Y.; Li, W.; Zhang, R.; Yu, G. Highly sensitive glucose sensor based on pt nanoparticle/polyaniline hydrogel heterostructures. ACS Nano 2013, 7, 3540–3546. [Google Scholar] [CrossRef]
  48. ICH Q2B. Guideline on validation of analytical procedures: Methodology. Fed. Regist. 1997, 62, 27464–27467. [Google Scholar]
  49. González-Sánchez, M.I.; Gómez-Monedero, B.; Agrisuelas, J.; Iniesta, J.; Valero, E. Highly activated screen-printed carbon electrodes by electrochemical treatment with hydrogen peroxide. Electrochem. Commum. 2018, 91, 36–40. [Google Scholar] [CrossRef]
  50. Fu, L.; Wu, K.; Ji, J.; Zhang, J.; Guo, X. A highly sensitive disposable glucose biosensor based on platinum nanoflowers decorated screen printed carbon electrode. In Proceedings of the 2017 IEEE Sensors, Glasgow, UK, 29 October–1 November 2017. [Google Scholar]
  51. Xue, C.; Kung, C.C.; Gao, M.; Liu, C.C.; Dai, L.; Urbas, A.; Li, Q. Facile fabrication of 3D layer-by-layer graphene-gold nanorod hybrid architecture for hydrogen peroxide based electrochemical biosensor. Sens. Biosens. Res. 2015, 3, 7–11. [Google Scholar] [CrossRef] [Green Version]
  52. Lee, S.H.; Kang, S.W.; Park, H.K.; Lee, G.J. String-based sensing platform for hydrogen peroxide detection. J. Nanosci. Nanotechnol. 2016, 16, 10182–10186. [Google Scholar] [CrossRef]
  53. Yu, L.; Tial, Y.; Gao, A.; Shi, Z.; Liu, Y.; Li, C. Bi-module sensing device to in situ quantitatively detect hydrogen peroxide released from migrating tumor cells. PLoS ONE 2015, 10, e0127610. [Google Scholar] [CrossRef] [PubMed]
  54. Xiao, C.; Liu, Y.L.; Xu, J.Q.; Lv, S.W.; Guo, S.; Huang, W.H. Real-time monitoring of H2O2 release from single cells using nanoporous gold microelectrodes decorated with platinum nanoparticles. Analyst 2015, 140, 3753–3758. [Google Scholar] [CrossRef] [PubMed]
Figure 1. Schematic illustration of the fabrication process and sensing protocol of the PtNP/rGO–CNT/PtNP/SPCE sensor for detection of H2O2 released from live LNCaP cells.
Chemosensors 08 00063 g001
Figure 2. (a) Changes in cathodic current of PtNP/rGO–CNT/SPCE and PtNP/SPCE at −0.2 V (vs. Ag pseudo-reference electrode) according to the concentration of H2PtCl6·6H2O in N2-saturated PBS (0.1 M, pH 7.4) solution containing 2.5 mM H2O2 and 0.1 M KCl. (b) SEM images of PtNP/rGO–CNT/PtNP/SPCE and (c) higher magnification image of (b).
Chemosensors 08 00063 g002
Figure 3. (a) CV curves of bare SPCE, rGO–CNT/SPCE, and PtNP/rGO–CNT/PtNP/SPCE in N2-saturated PBS solution (0.1 M, pH 7.4) containing 2.5 mM H2O2 and 0.1 M KCl at a potential range from −0.7 to 0.3 V (Ag pseudo-reference electrode) and at a scan rate of 50 mV/sec. (b) CV curves of PtNP/SPCE, rGO–CNT/PtNP/SPCE, PtNP/rGO–CNT/SPCE, and PtNP/rGO–CNT/PtNP/SPCE in N2-saturated PBS solution (0.1 M, pH 7.4) containing 2.5 mM H2O2 and 0.1 M KCl at a potential range from −0.7 to 0.3 V (Ag pseudo-reference electrode) and at a scan rate of 50 mV/sec. (c) CV curves of PtNP/rGO–CNT/PtNP/SPCE at different scan rates (10–100 mV/sec) in N2-saturated PBS solution (0.1 M, pH 7.4) containing 2.5 mM H2O2 and 0.1 M KCl at a potential range from −0.7 to 0.3 V (Ag pseudo-reference electrode). (d) The corresponding plot of cathodic peak current (Ipc) versus the square root of scan rate (v1/2).
Chemosensors 08 00063 g003
Figure 4. (a) Amperometric response of the PtNP/rGO–CNT/PtNP/SPCE with successive addition of H2O2 in 0.1 M PBS containing 0.1 M KCl at −0.2 V (vs. Ag pseudo-reference electrode). Inset shows the amperometric responses of bare SPCE (blue line) and PtNP/SPCE (orange line) at the same conditions. (b) The corresponding calibration curve of the current change (ΔI) vs. the concentration of H2O2 for the PtNP/rGO–CNT/PtNP/SPCE. Inset shows the resulting calibration curve for the PtNP/SPCE (orange line). (c) Current response of the PtNP/rGO–CNT/PtNP/SPCE with successive addition of 500 μM H2O2 and 1 mM AA, UA, and glucose in 0.1 M PBS containing 0.1 M KCl at −0.2 V (vs. Ag pseudo-reference electrode). (d) Reproducibility test result of PtNP/rGO–CNT/PtNP/SPCE electrodes with different fabrication dates, using a current response to 500 μM H2O2 in 0.1 M PBS containing 0.1 M KCl at −0.2 V (vs. Ag pseudo-reference electrode).
Chemosensors 08 00063 g004
Figure 5. (a) Amperometric responses of the PtNP/rGO–CNT/PtNP/SPCE electrode for H2O2 released from LNCaP cells (1 × 10⁶ cells) without any treatment (gray line) and after addition of DMSO (black line), as well as different cell numbers such as 1 × 10⁶ cells (blue line), 2 × 10⁶ cells (yellow line), and 5 × 10⁶ cells (red line) after the addition of PMA at −0.2 V. (b) The maximum current change by H2O2 release in LNCaP cells according to the cell number.
Chemosensors 08 00063 g005
Table 1. Comparison of the analytical performance of our non-enzymatic biosensor with that of other PtNPs or GO-modified SPCEs for detection of H2O2.
Electrode 1Applied Potential (V)Sensitivity 5
(μA·μM−1·cm−2)
Linear Range
(μM)
LOD (μM)Ref.
aSPCE 10.723010–120_[49]
Pt NFs 2/SPCE−0.764100–20,00015.8[50]
Poly(azure A)-PtNPs/SPCE0.1204.70–3000.052[27]
rGO-PT 3-Pt/SPCE−0.47801–1000.26[31]
GO-Cys-GNR 4/SPCE0.356480–402.9[51]
PtNP/rGO–CNT/PtNP/SPCE−0.220625–10004.3This work
1 aSPCE: highly activated SPCE; 2 NFs: nanoflowers; 3 PT: persimmon tannin; 4 GO-Cys-GNR: 3D layer-by-layer graphene-gold nanorods; 5 sensitivity was calculated using the geometrical electrode area.

