Communication

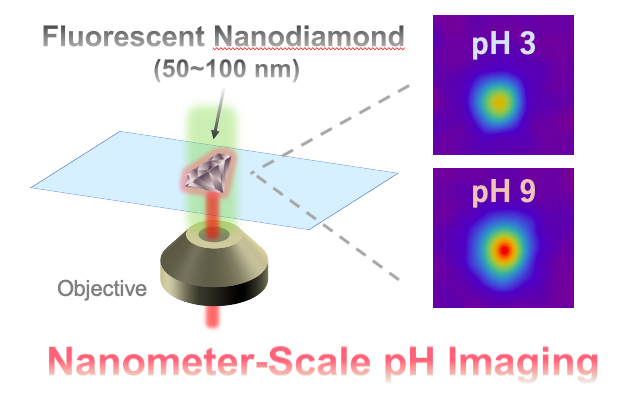
Nanometre-Scale Visualization of Chemical Parameter Changes by T1-Weighted ODMR Imaging Using a Fluorescent Nanodiamond

by
Takahiro Fujisaku
1,
Ryuji Igarashi
2,3,4,* and
Masahiro Shirakawa
1,*
1
Department of Molecular Engineering, Graduate School of Engineering, Kyoto University, Nishikyo-Ku, Kyoto 615-8510, Japan
2
Institute for Quantum Life Science, National Institutes for Quantum and Radiological Science and Technology, Anagawa 4-9-1, Inage-ku, Chiba 263-8555, Japan
3
National Institute for Radiological Sciences, National Institute for Quantum and Radiological Science and Technology, Anagawa 4-9-1, Inage-ku, Chiba 263-8555, Japan
4
JST, PRESTO, 4-1-8 Honcho, Kawaguchi, Saitama 332-0012, Japan
*
Authors to whom correspondence should be addressed.
Submission received: 8 July 2020 / Revised: 30 July 2020 / Accepted: 6 August 2020 / Published: 11 August 2020

Abstract

:
The dynamics of physical parameters in cells is strongly related to life phenomena; thus, a method to monitor and visualize them on a single-organelle scale would be useful to reveal unknown biological processes. We demonstrate real-time nanometre-scale T1-weighted imaging using a fluorescent nanodiamond. We explored optically detected magnetic resonance (ODMR) contrast at various values of interval laser pulse (τ), showing that sufficient contrast is obtained by appropriate selection of τ. By this method, we visualized nanometre-scale pH changes using a functionalized nanodiamond whose T1 has a dependence on pH conditions.

Graphical Abstract

1. Introduction

Physical parameters in cells have a heterogeneous distribution in space and time. For example, temperature near the mitochondria is considered to be comparatively higher than that in the cytosol due to the heat generation by mitochondrial respiration [1,2]. In addition, an intracellular pH gradient is thought to regulate signal transduction during actin polymerization, which plays an important role in protoplasmic flow, cell division and cell migration [3,4]. Changes in local protein concentration and viscosity to form membrane-less organelles are thought to regulate RNA transcription and enable the cell to endure temporal stresses [5,6]. As described herein, the dynamics of these parameters is strongly related to several cell events; thus, a method to monitor and visualize them on a single-organelle scale, with a spatial resolution on the order of nanometres, would be useful to reveal unknown biological processes [7].
Magnetic resonance imaging (MRI) is one of the best-known methods to visualize simultaneously both physical and locational changes in various parameters. In particular, longitudinal relaxation time (T1)-weighted imaging is a powerful method to visualize tissue structure, molecular composition and protein dynamics inside a living body [8,9,10,11]. However, the general coil detection mechanism restricts its spatial resolution to the milli- to micrometre order, and thus it cannot provide insight about sub-micrometre events that are involved in many biological processes.
In recent years, nitrogen-vacancy (NV) centres in diamond have been attracting much attention as atomic-size MR detectors [12,13,14]. Fluorescence from an NV centre does not show any photo-bleaching, making it possible to obtain an optically detected magnetic resonance (ODMR) spectrum from only one NV centre [15,16,17]. In addition, the T1 value obtained from the ODMR experiment reflects the nanometre-scale environment around the diamond surface. Previous studies have shown that T1 reflects physical parameters such as redox potential [18], protein concentration [19], and pH [18,20]. Therefore, if a T1-weighted imaging technique based on NV centres can be established, it would be possible to achieve real-time monitoring of physical parameters in nano-space. Although many studies have described methodologies to measure T1 from the fluorescence of NV centres, as well as the experimental results of numerical measurements, a procedure to carry out T1-weighted imaging to visualize simultaneously both the dynamics and location of a parameter has not been reported.
Here we describe a method to construct T1-weighted ODMR images reflecting the nano-spatial environment around a nanodiamond containing NV centres. First, we optimized the measurement parameters used for T1-weighted imaging to obtain an adequate contrast. To conduct this, the contrasts of T1-weighted imaging were calculated for various values of laser pulse interval (τ) by simulation. As a result, it was suggested that an appropriately fixed value of τ can give an enough contrast in the T1 range typical of changes in a 100-nm nanodiamond previously reported [20]. Next, we applied the method to experimentally obtained fluorescence images of a nanodiamond whose T1 has a dependence on nano-spatial pH. This showed that the reconstructed T1-weighted images can visualize nano-spatial pH conditions at sufficient contrast, in agreement with the results from simulation. By extending this method to other parameters, we expect that previously unknown sub-micrometre biological processes will be revealed.

2. Materials and Methods

2.1. Preparation of Carboxylated Nanodiamond

We followed the protocol reported previously [20]. Nanodiamond powder was purchased from Element Six (Micron + MDA 0–0.10 μm). First, the nanodiamond powder was electron-irradiated (2 MeV, 1.0 × 10¹⁸ e/cm2) and thermally annealed at 800 °C for 2 h under vacuum. Next, the nanodiamonds were oxidized at 550 °C for 2 h. The residue was heat-treated with a mixture of H2SO4/HNO3 (9:1 v/v) at 70 °C for 3 days, followed by 0.1 M NaOH at 90 °C for 2 h and 0.1 M HCl at 90 °C for 2 h. The residue was washed with Milli-Q to give carboxylated nanodiamonds, which were characterized by FT-IR, XPS and zeta potential measurements.

2.2. T1 Measuremnt

To measure T1 of a nanodiamond, we used an EMCCD (electron-multiplying CCD) camera (Andor iXon DU897, Andor Technology, Belfast, United Kingdom), a green solid-state laser (100 mW, 532 nm; Sapphire 532 LP, Coherent, Santa Clara, CA, United States), an oil-immersion 60× objective (CFI Apochromat TIRF 60×/1.49, Nikon, Tokyo, Japan), an acousto-optic modulator (1250C-974, Isomet), a dichroic mirror centred at 575 nm and a 650 nm long-wave pass filter. The polarization and readout laser pulse widths were both 4.0 μs, EMCCD exposure time was 1.1 × 10² ms/frame. We used 10 mM standard buffer solutions (citric acid pH 3.0, sodium acetate pH 4.0, trisodium citrate pH 5.0, sodium cacodylate pH 6.0, sodium HEPES pH 7.0, tris hydrochloride pH 8.0, CHES pH 9.0) to change the pH conditions. As previously reported, the differences in buffer molecules do not affect T1 [20].
Functionalized nanodiamonds dispersed in water were injected into a flow chamber assembled from glass slides (Matsunami micro cover glass). A single-crystal nanodiamond nonspecifically adsorbed on the bottom of the chamber was used for T1 measurements. Each pH condition was achieved by injecting 200 μL (20-fold larger than the chamber volume) of standard buffer solution. To replace the buffer solution inside the flow chamber, we injected 500 μL of Milli-Q water into the chamber to wash out the old solution, followed by 200 μL of the appropriate standard buffer solution to achieve the next target pH condition.

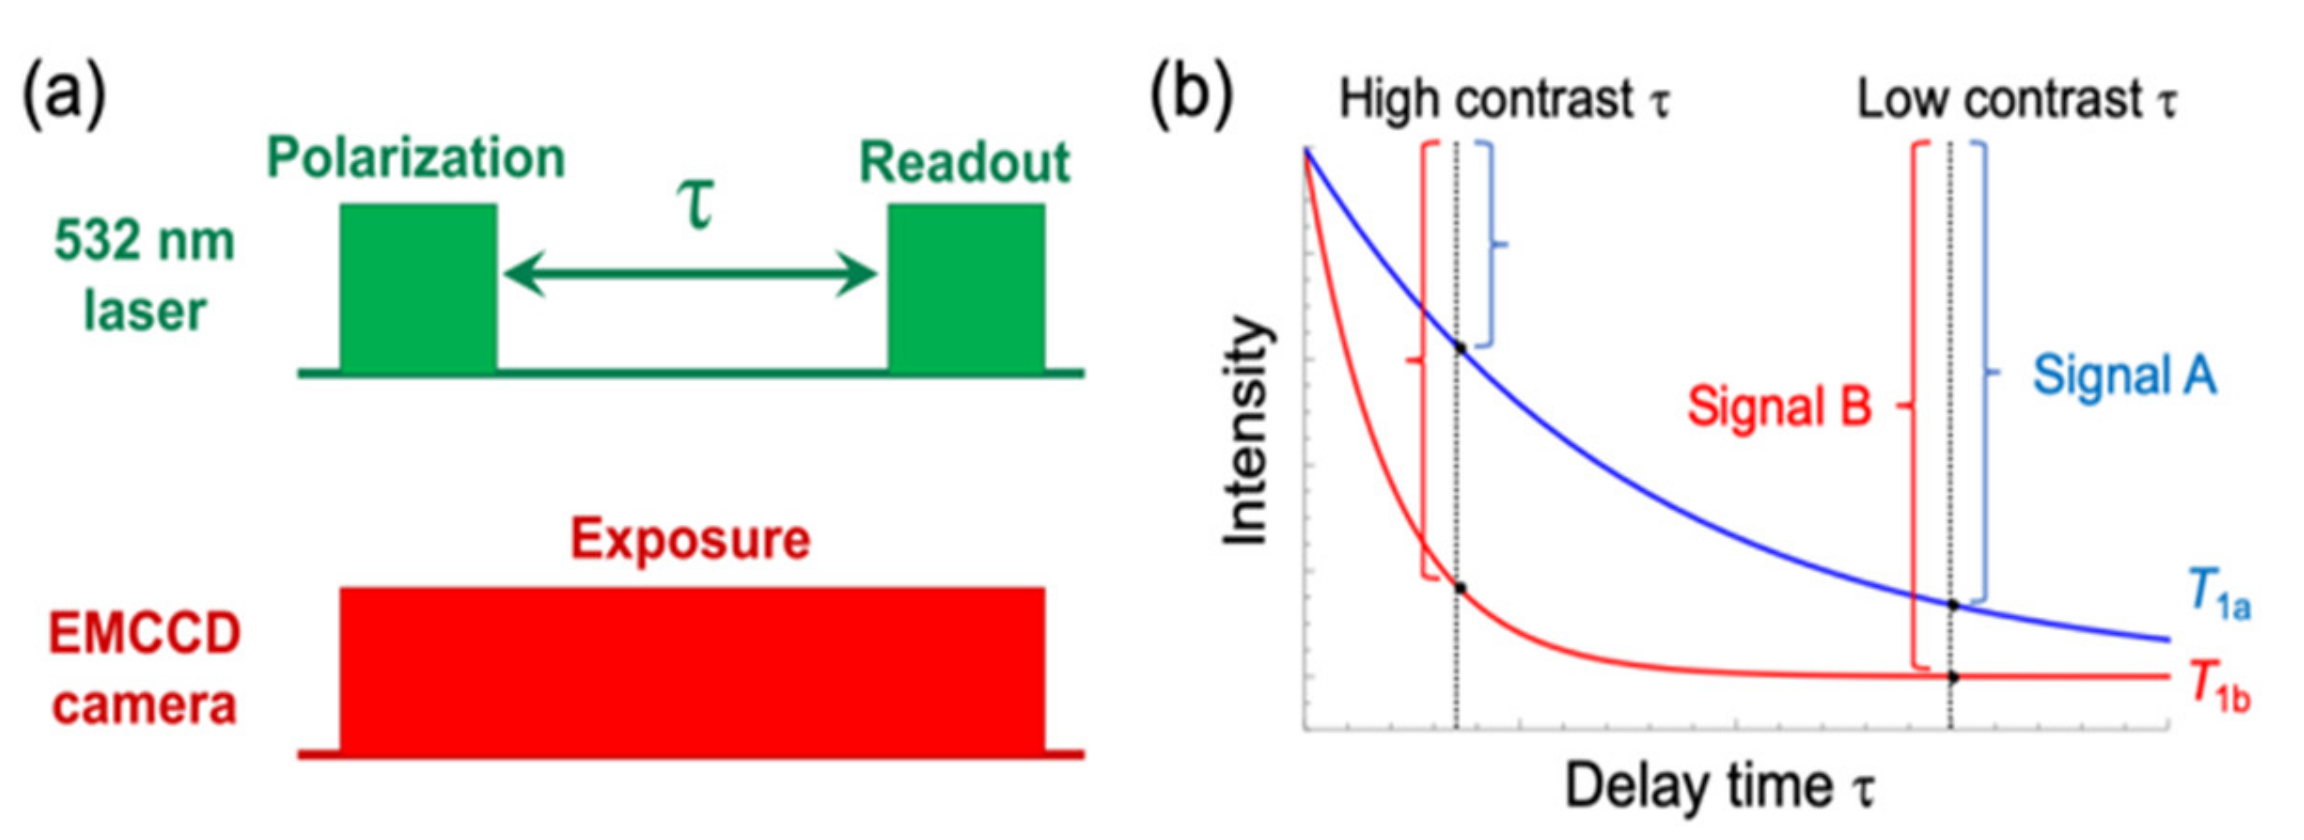
2.3. T1-Weighted Imaging

Following the protocols described in Section 2.2., data sets of fluorescence images and T1 values in various pH conditions were obtained. From these T1 values, the delay time τ that gives the highest contrast (τmax; see also Figure 1a) was estimated. To construct T1-weighted images, fluorescence intensity changes from τ = 0 to τ = τmax were obtained pixel by pixel and these were plotted as a colour map. Simulations and experimental data analysis were performed by Wolfram Mathematica.

3. Results

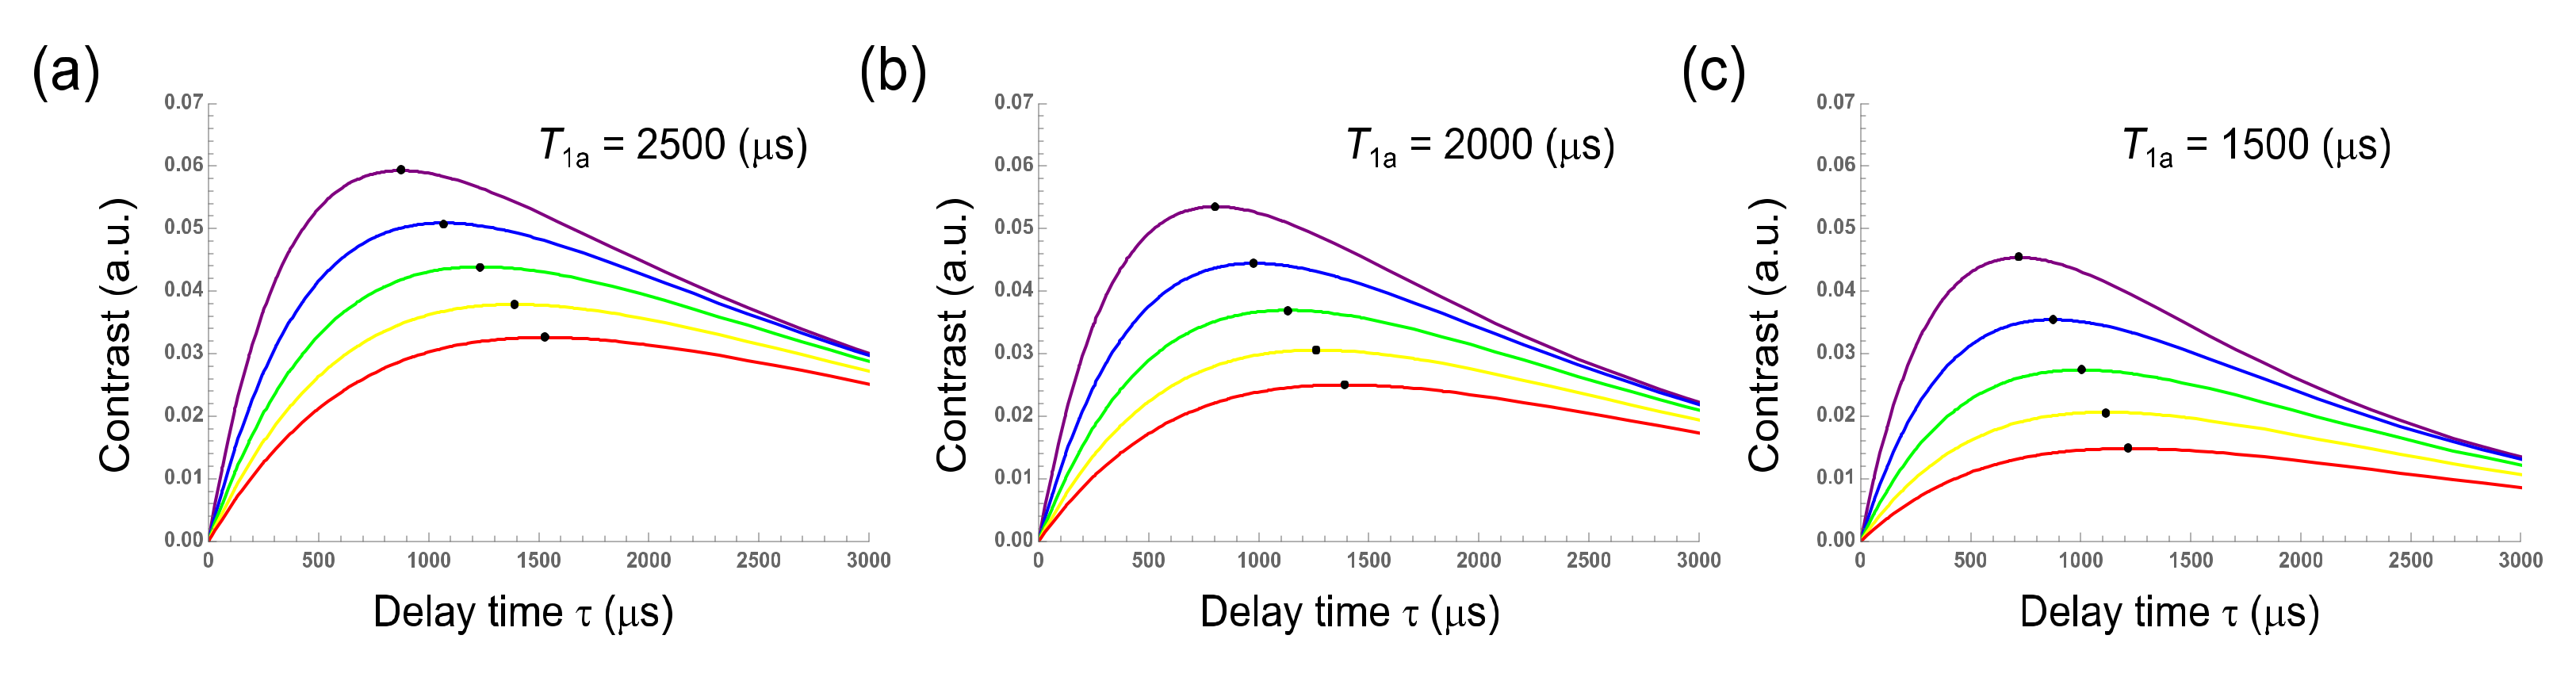
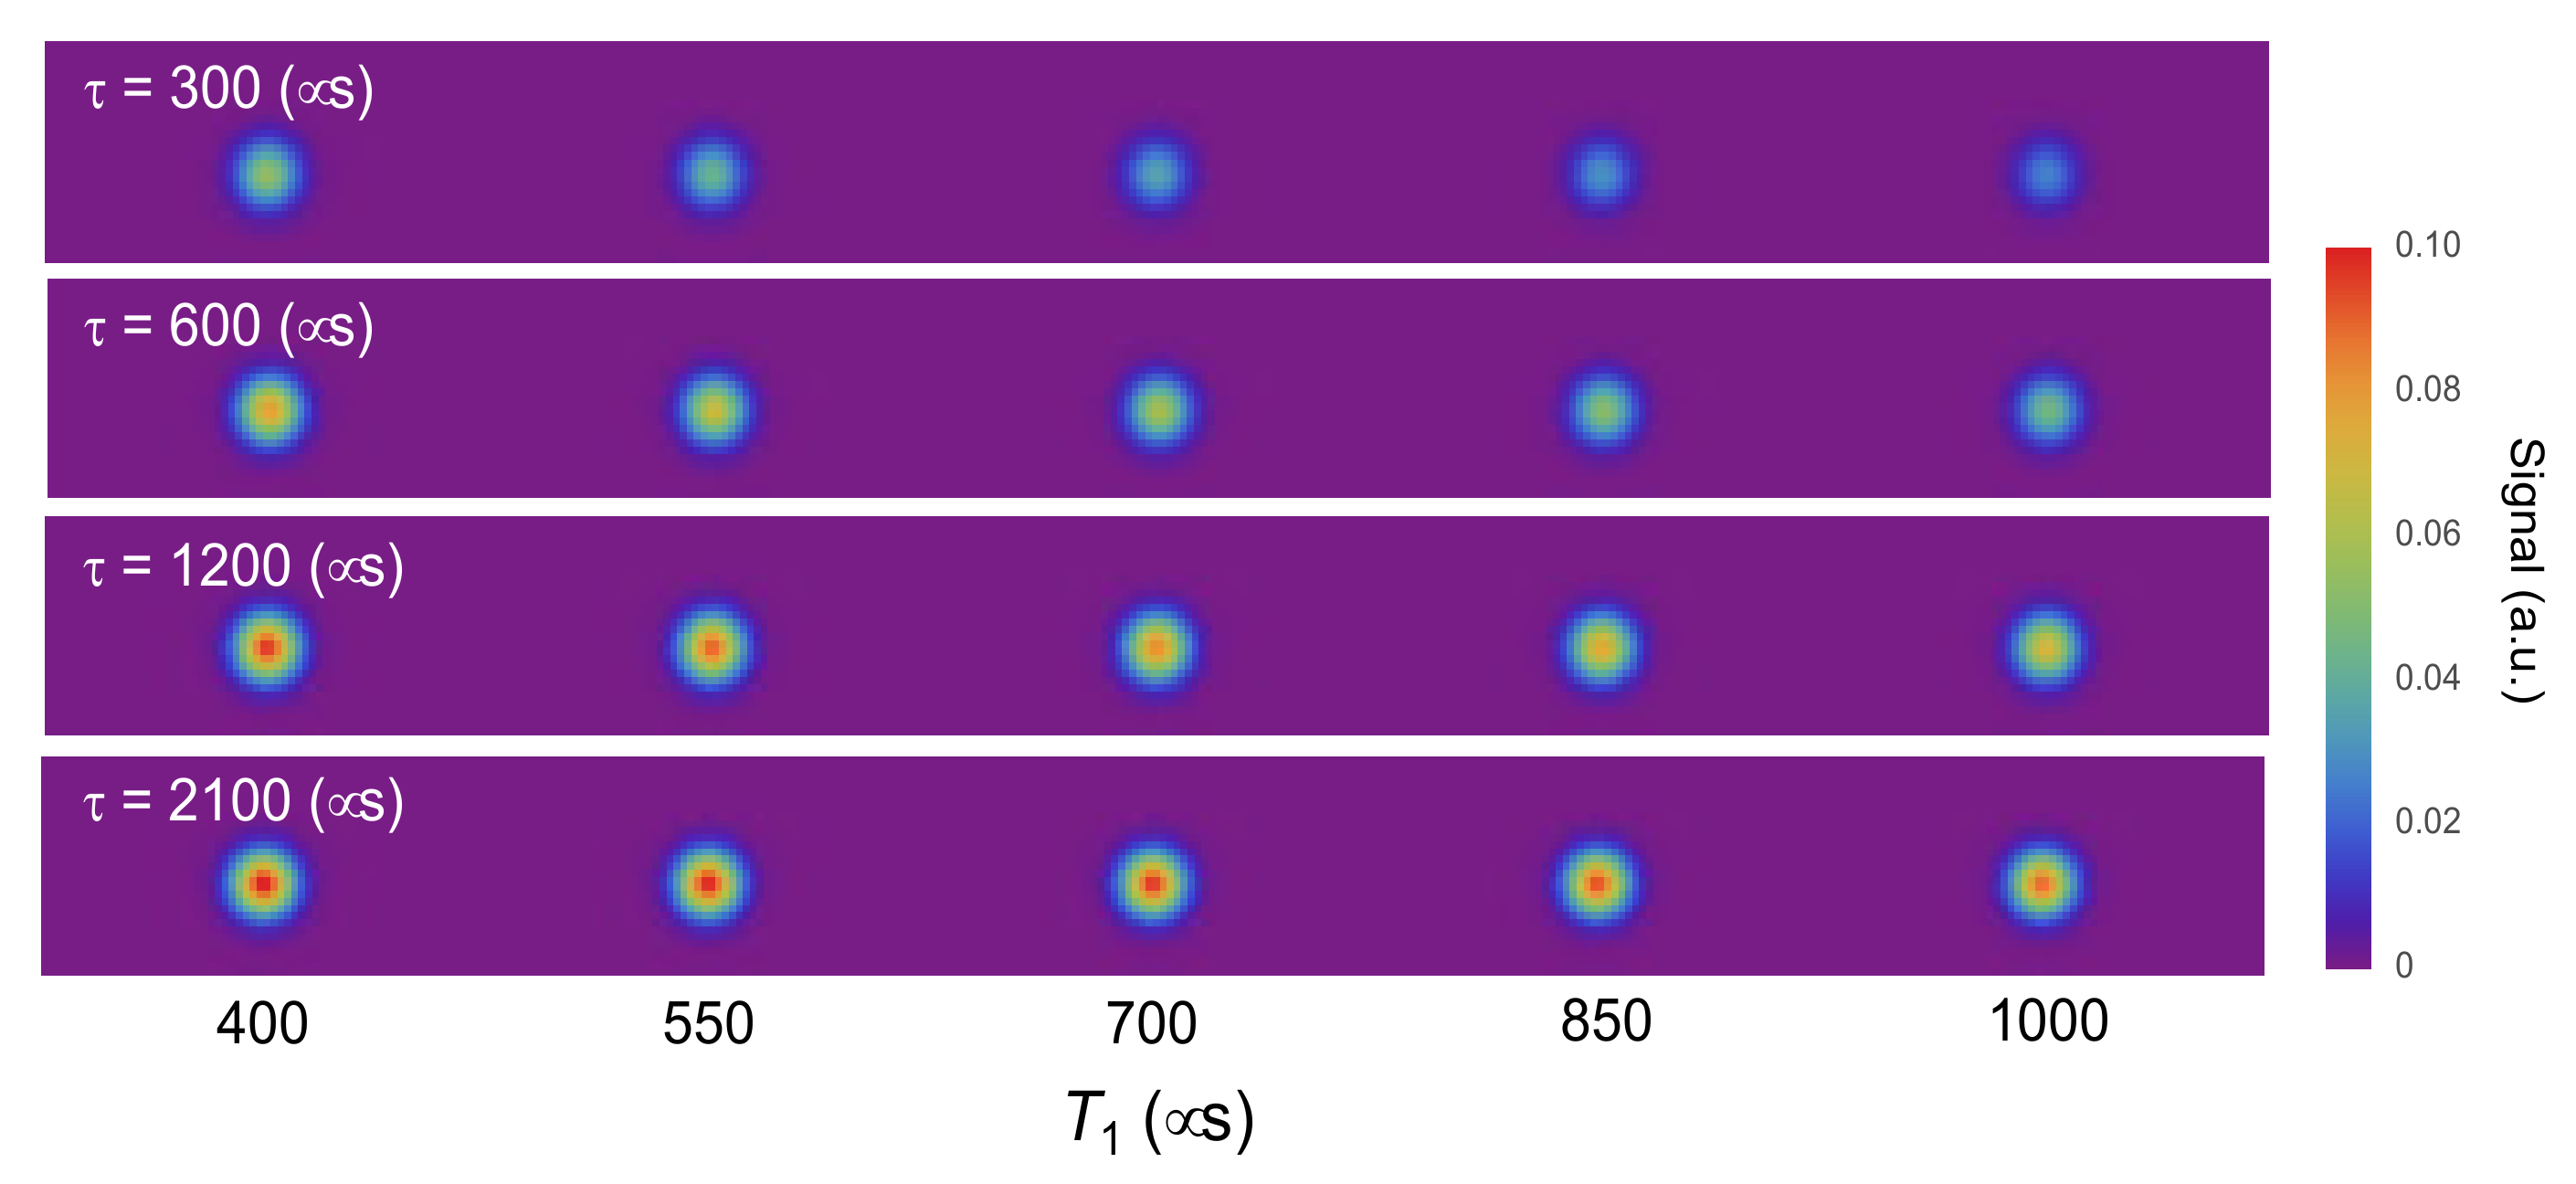
3.1. Simulation of T1-Weighted Images

In our method, polarization and readout laser pulses are applied to nanodiamonds with an interval time τ to perform T1-weighted imaging (Figure 1a). The fluorescence intensity, which decreases exponentially with τ, can be recorded by a highly sensitive photodetector such as an EMCCD camera. Here, we define a signal at τ as the difference between fluorescence intensity at interval time = 0 and that at interval time = τ (Figure 1b). Pixel signals are mapped with false colours to obtain T1-weighted images of a nanodiamond. However, T1 can take several values depending on the microenvironment surrounding the nanodiamond. Therefore, external stimulation can alter the T1 value—for instance, from T1a to T1a, as shown in Figure 2b—resulting in a contrast between T1-weighted image changes before and after stimulation. However, this contrast also depends on τ (Figure 1b), which means that an appropriate τ needs to be selected.
To search for the optimal τ, we simulated a simplified model in which T1 changes between two values, T1a and T1b, within a typical range of T1 for NV centres in a 100-nm nanodiamond(400–2500 μs). We then plotted the value of τ giving the highest contrast between each pair of T1a and T1b values (Figure 2, black dot). As shown, the highest contrast shifted, depending on both T1a and T1b, indicating that τ must be selected in accordance with the T1 range of most interest.
Next, we considered more detailed conditions in which T1 takes several values. Simulated T1-weighted images were constructed for the 400–1000 μs range, within which T1 of a carboxylated 100 nm nanodiamond changes depending on pH (Figure 3) [20]. As a result, comparatively short τ (300 μs) gave relatively high contrast within a narrow T1 range (400–550 μs). By contrast, comparatively long τ (2100 μs) gave relatively high contrast within a wide T1 range (850–1000 μs). Intermediate values of τ (600 or 1200 μs) were found to give good contrast over a wider range of T1. This shows that, by selecting an appropriate value of τ, we contain obtain T1-weighted images with sufficient contrast.

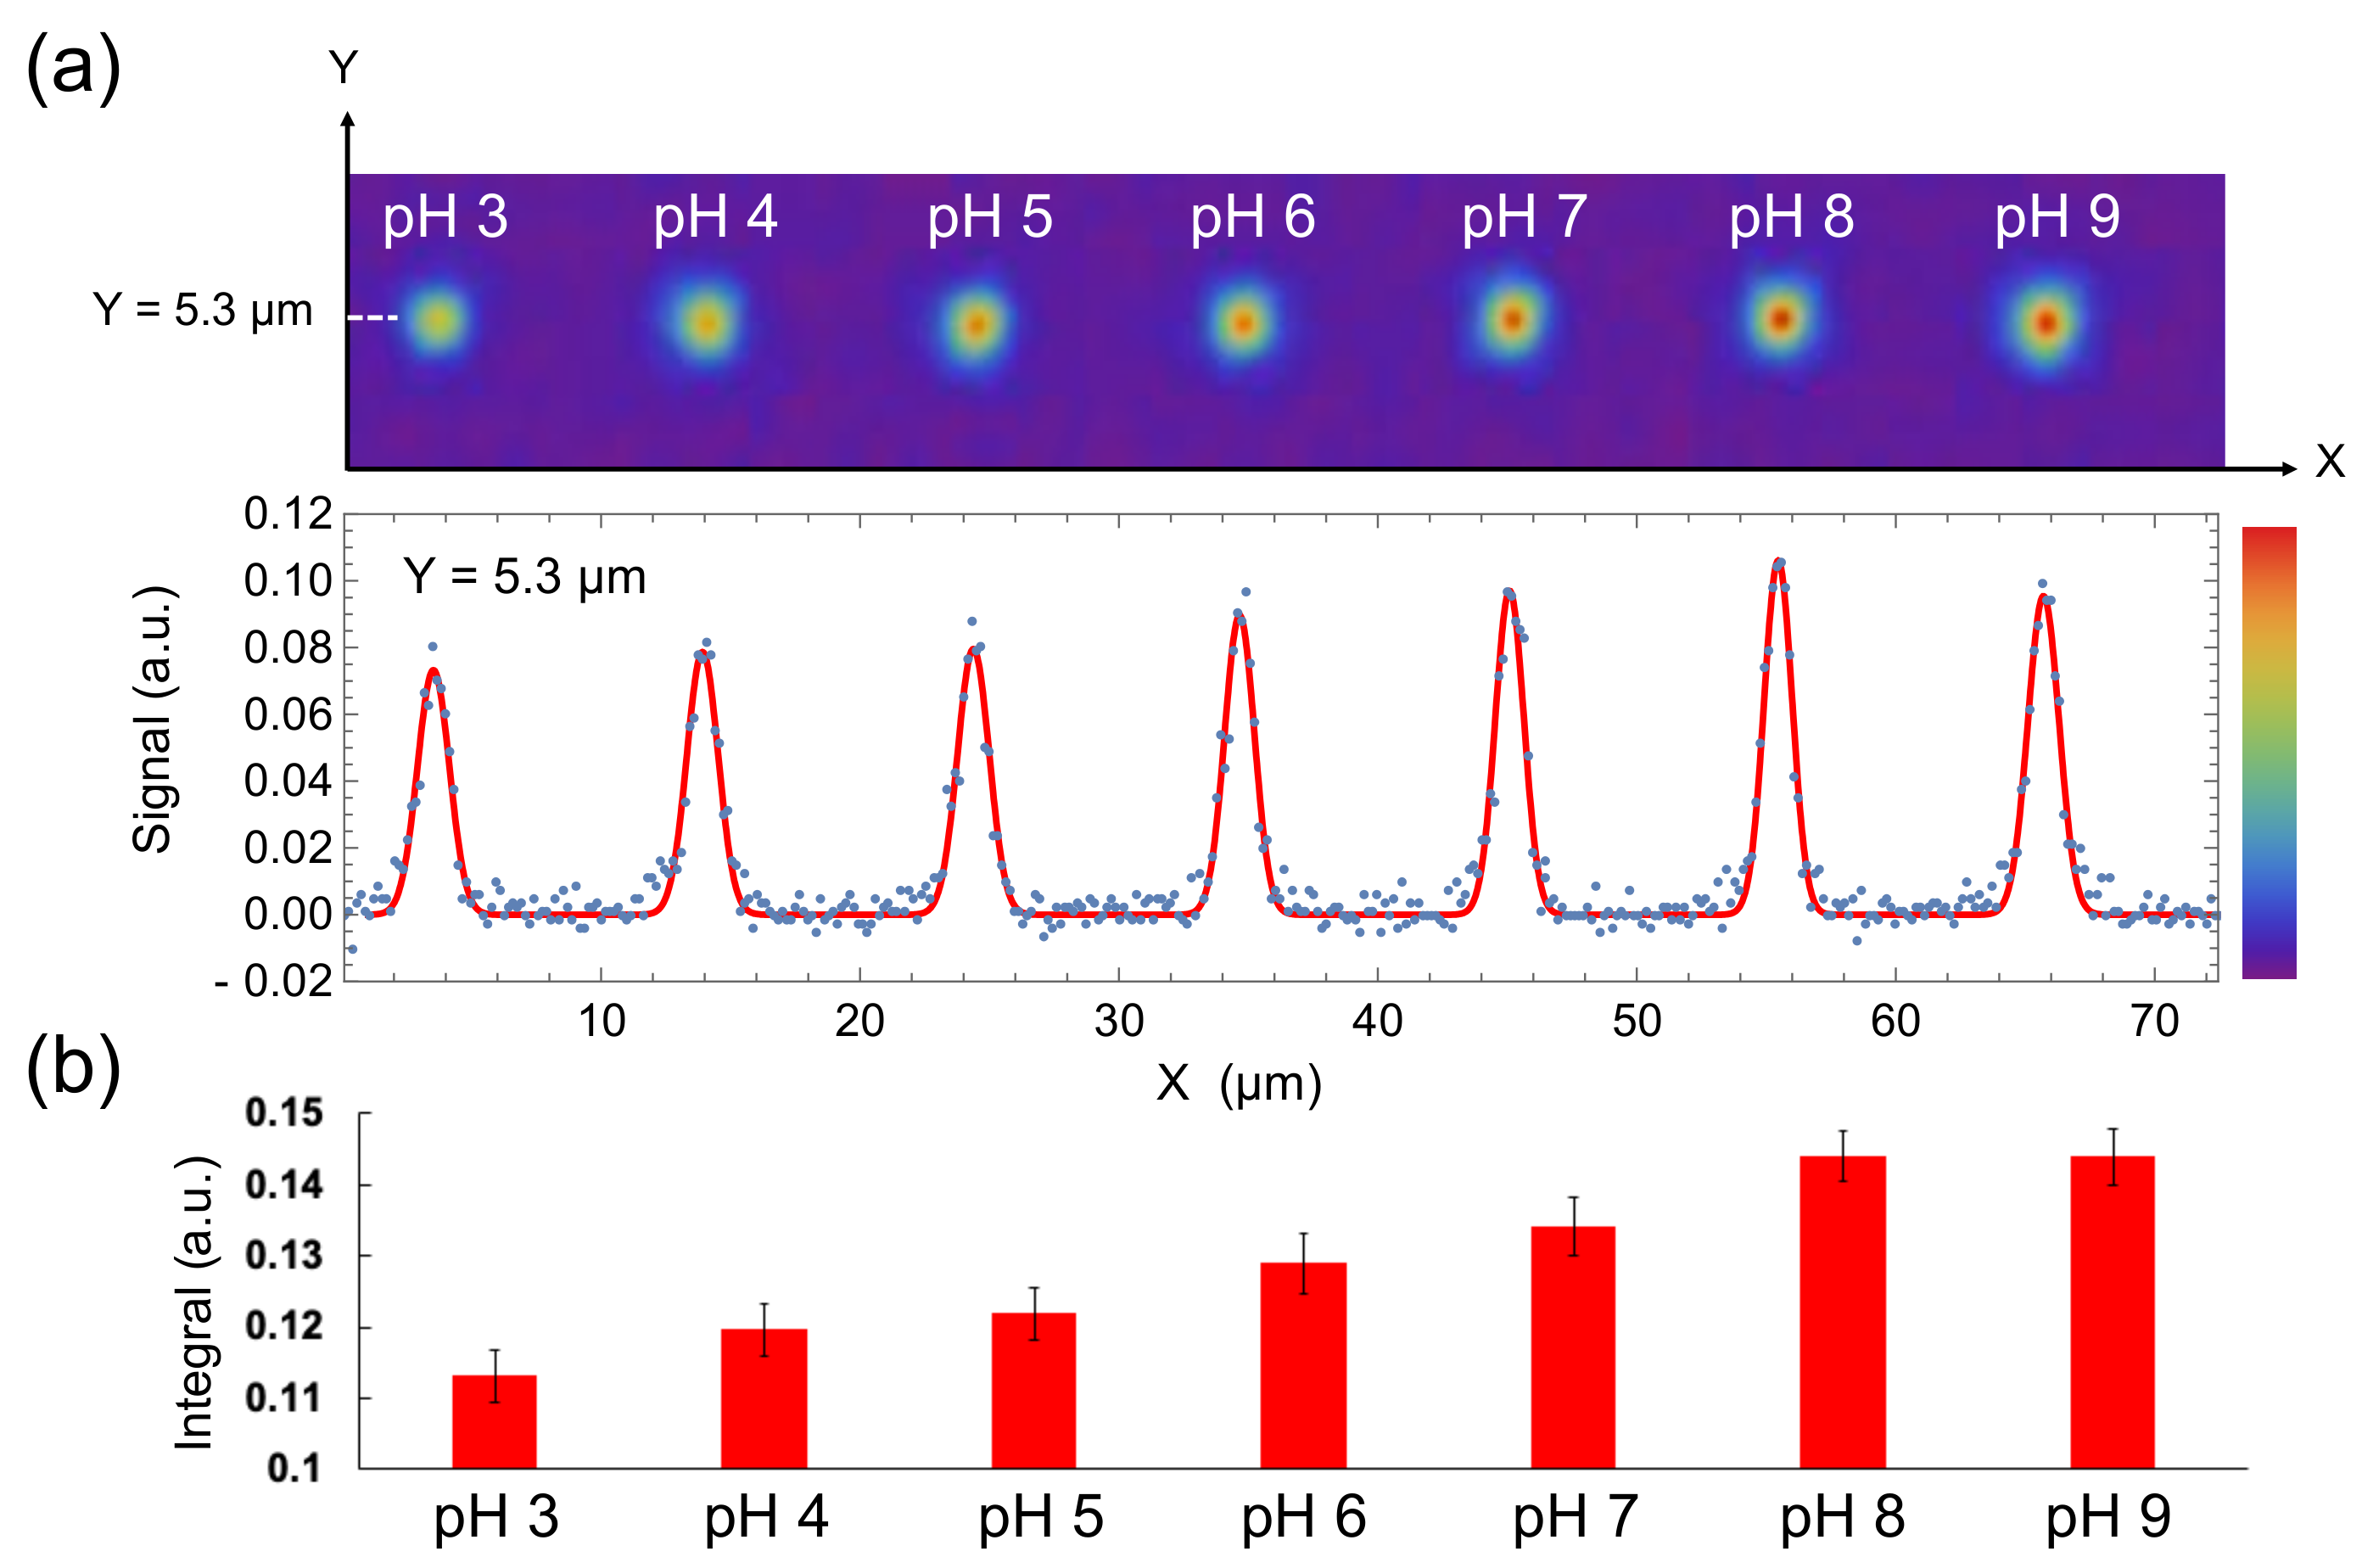
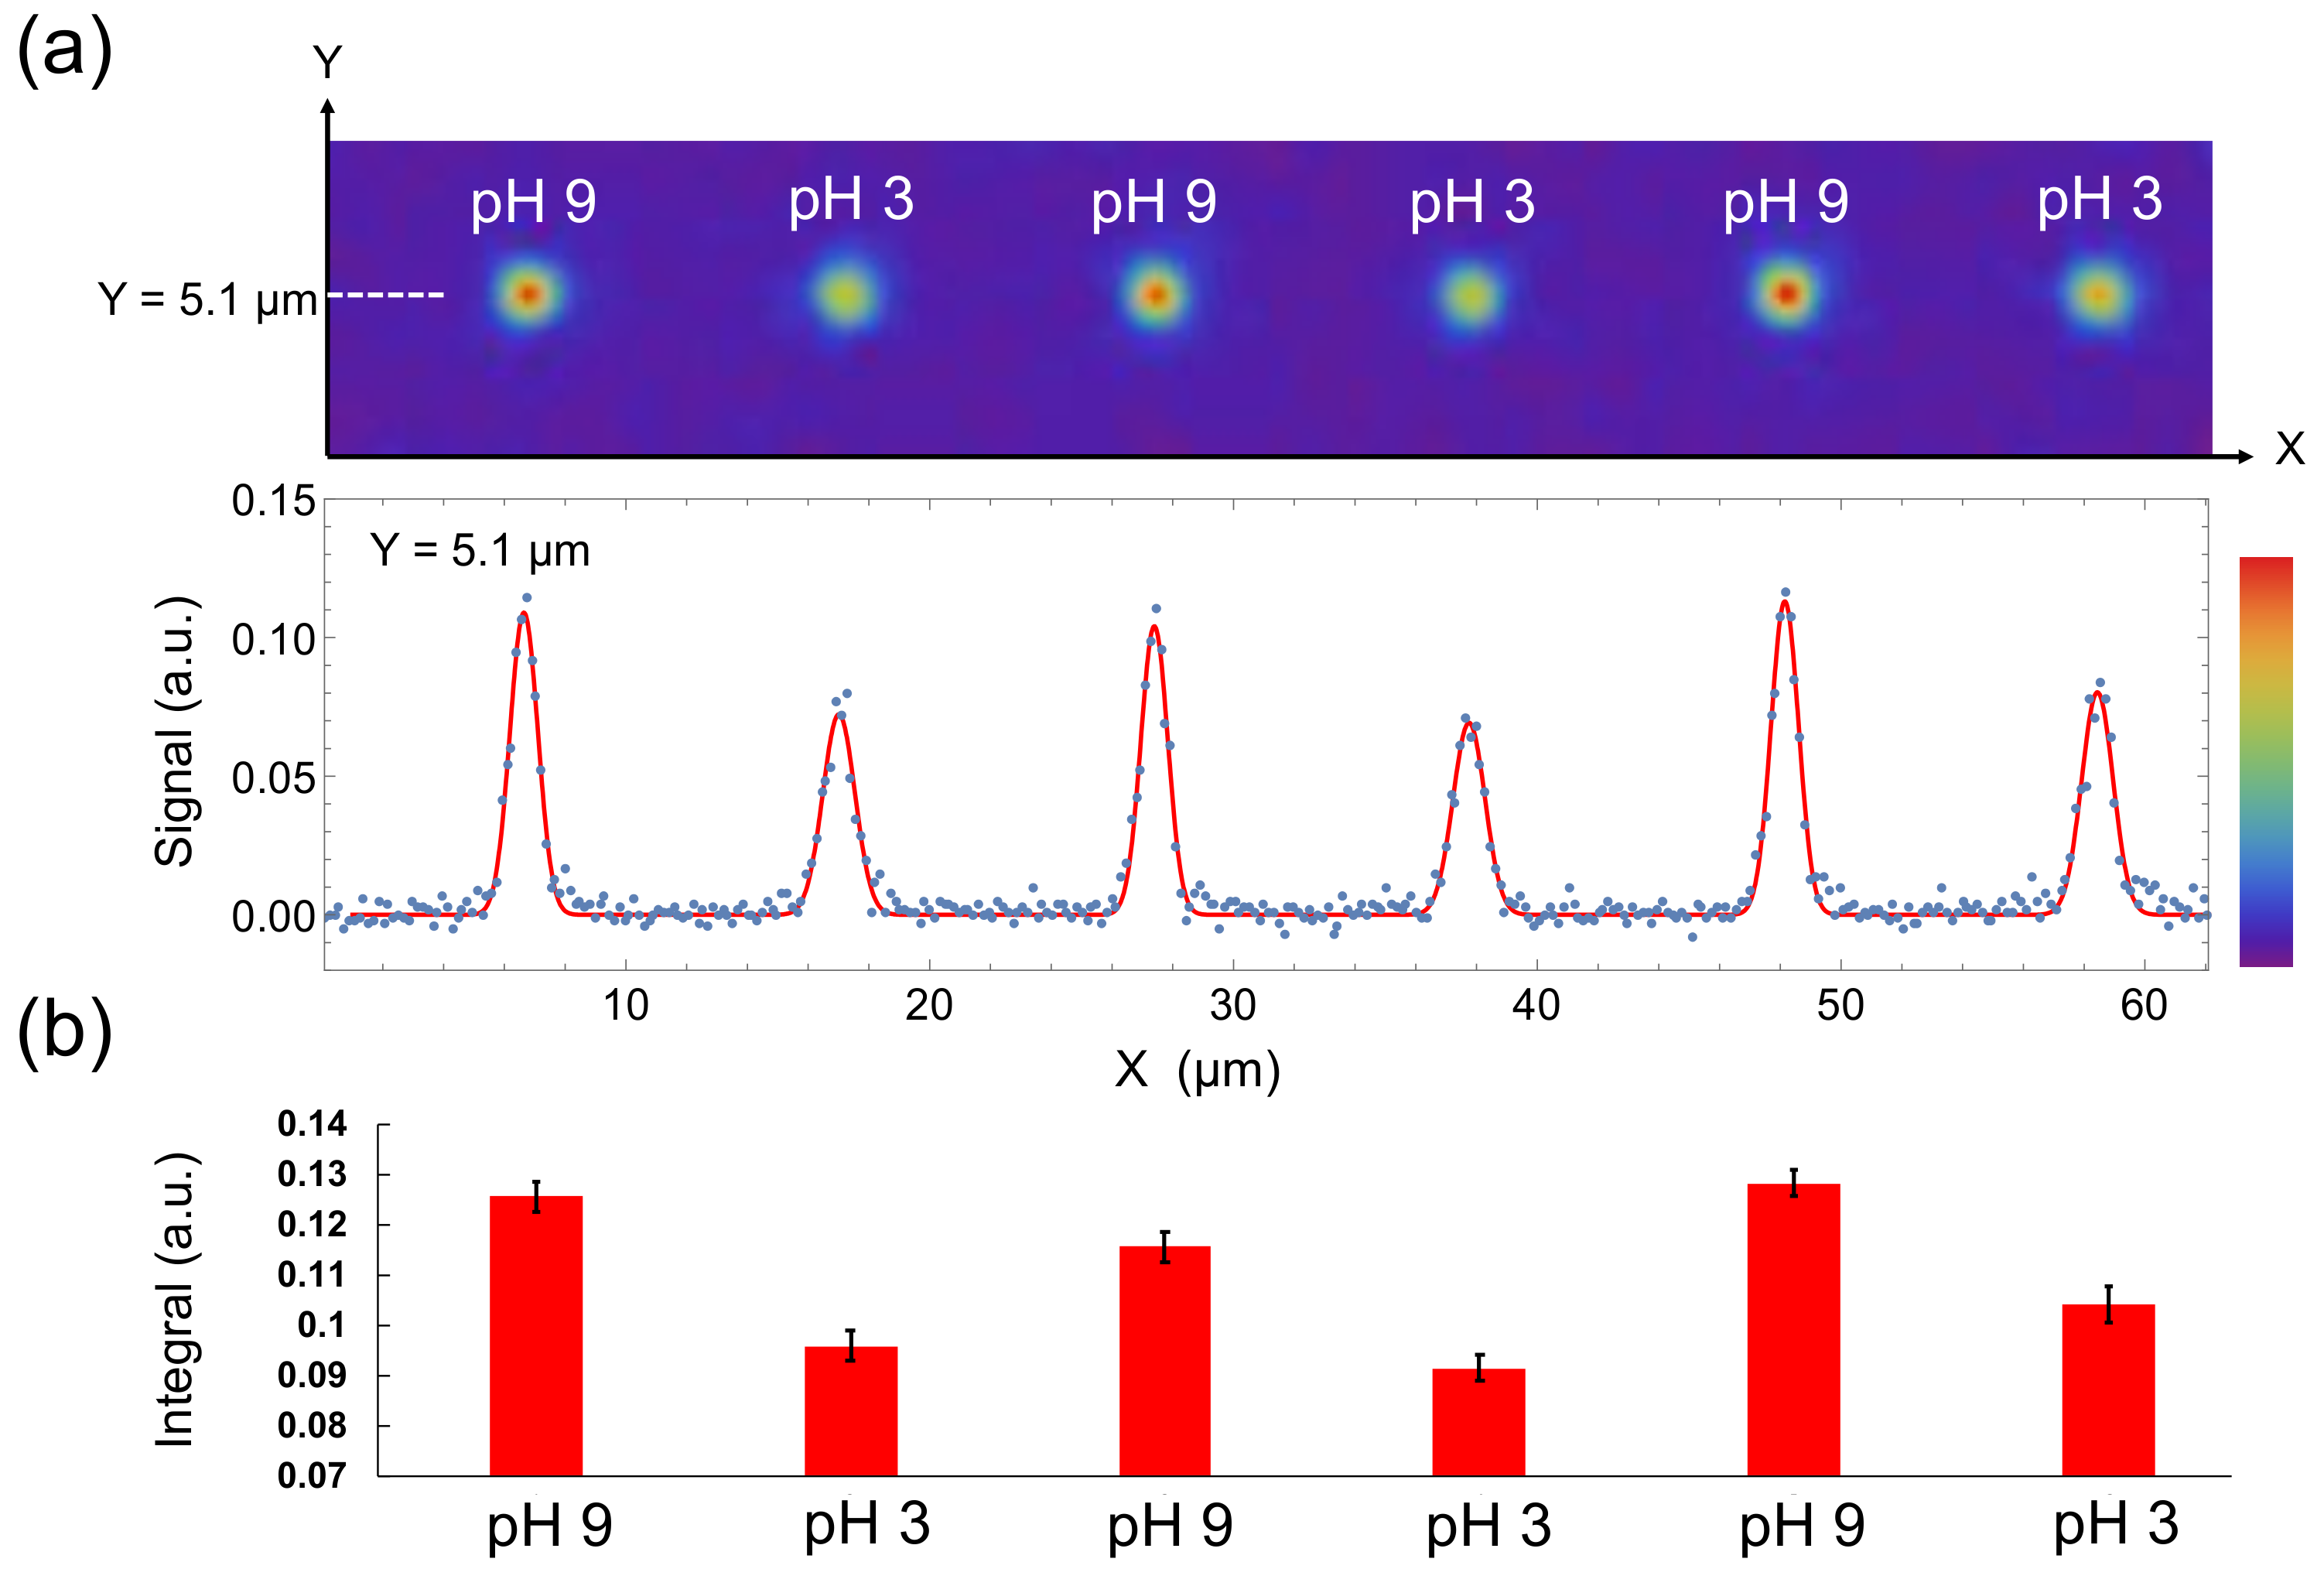
3.2. T1-Weighted Images from a Nanodiamond under Various pH Conditions

To demonstrate the method, we constructed T1-weighted images obtained from a 100-nm nanodiamond under different pH conditions. As reported previously, T1 of a carboxylated nanodiamond changes depending on the local pH conditions [20]. The surface of a carboxylated nanodiamond becomes negatively charged in alkaline conditions due to ionization of the carboxyl groups. These charges act as electrical noise to shorten T1. In acidic conditions, by contrast, the surface becomes neutral and T1 gets longer. Thus, T1-weighted images are considered to visualize the nanometric spatial pH condition around a nanodiamond.
Here, carboxylated nanodiamonds were placed in buffers of various pH, and fluorescence intensities in each of pixels were recorded during irradiation with laser pulse trains (Figure 1a). T1-weighted images were constructed by using τ = 525 µs when the pH was changed from pH 3 (T1 = 738 μs) to pH 9 (T1 = 412 μs), resulting in the T1-weighted images changing in accordance with pH (Figure 4a, top). The imaging contrasts were sufficient to recognize the difference visually, as predicted in the simulation. The height of a gaussian function fitted to the signal intensities on a Y cross-section increased with increasing pH (Figure 4a, bottom). The value for the definite integral of the fitting function also increased with increasing pH (Figure 4b). These results show that our method can visualize nanometric spatial pH conditions with sufficient contrast. To quantify the pH dependence of the contrast obtained from the carboxylated nanodiamond statistically, we calculated the correlation coefficient and compared it with one obtained from a non-carboxylated nanodiamond whose T1 has no dependence on pH. The maximal information coefficient (MIC) was used to measure the strength of the non-linear correlations. As a result, MIC from the carboxylated nanodiamond (0.99) was much higher than that from the non-carboxylated nanodiamond (0.52) (Figure S1).
Lastly, we evaluated the reversibility of the method. pH is a parameter that changes in both directions. Therefore, reversibility is critically required for pH probes. T1-weighted images were constructed by using τ = 875 µs when the pH was alternated between pH 3 (average T1 = 1139 µs) and pH 9 (average T1 = 656 μs), with the result that the T1-weighted images and their signal intensities on a cross-section Y changed reversibly depending on the pH conditions (Figure 5a,b). Therefore, these results suggest that repeatedly changing pH can be visualized in nanometric space by our method.

4. Discussion

It is known that nanodiamonds work as a nanometre-sized quantum sensor inside a living cell and have low toxicity to cells [15]. So, through the development of our method, pH conditions in organelles (3-10 μm) such as lysosomes (pH 4.5–4.7) and mitochondria (pH ~8) may be visualized [4] (see also Supplementary Materials Section S2). It should be noted, however, that T1 may be sensitive not only to pH but also to other biological parameters such as temperature, electric field, and magnetic field. Thus, further optimizations and improvements will be needed before bio-application. In the future, time resolution, sensitivity, and selectivity are likely to be improved by peripheral technology, such as nanodiamond manufacturing methods, mechanical device performance, and decoupling methods, among others. In addition, the possibility of measuring other physical parameters will be explored by examining various surface modifications of nanodiamond. These studies will increase our understanding of global life phenomena by characterizing local physical quantities in cells, providing important insight into disease diagnosis, pathological mechanisms, and drug discovery.

5. Conclusions

In summary, we have developed a T1-weighted imaging technique based on nanodiamond detection that can visualize nano-spatial pH conditions. First, we investigated the relationship between τ and its contrast in the T1 range typical of 100-nm nanodiamonds. Our simulations showed that pH could be visualized with sufficient contrast by selecting an appropriate τ. We then showed that T1-weighted images constructed from a 100-nm diamond could indeed visualize nano-spatial pH with sufficient contrast within 3 minutes. The reversibility was investigated, which showed that our method can be used even when the pH changes repeatedly.

Supplementary Materials

The following are available online at https://0-www-mdpi-com.brum.beds.ac.uk/2227-9040/8/3/68/s1, Figure S1: (a) T1-weighted images of a non-carboxylated 100-nm nanodiamond in various pH conditions (top) and its signal intensity on a cross section Y = 5.1 mm plotted against X (bottom). The red line represents the best fit function consisting of seven Gaussian curves. (b) Definite integrals of the best fit Gaussian curves of each pH condition. Error bars represent the standard error for the fitting.

Author Contributions

Conceptualization, R.I. and M.S.; methodology, R.I.; data curation, T.F.; writing—original draft preparation, T.F.; supervision, M.S. All authors have read and agreed to the published version of the manuscript.

Funding

This research was funded by a Grant-in-Aid for JSPS Fellows (JSPS KAKENHI Grant Number JP19J12787), a Grant-in-Aid for Scientific Research on Innovative Areas “New measurement techniques for visualizing live protein molecules at work” (JSPS KAKENHI Grant Number JP26119004) and Challenging Research (JSPS KAKENHI Grant Number JP18K19297), JSPS KAKENHI Grant Numbers JP20H00453, JP20H02952, JP20H02587, the Japan Science and Technology Agency under Precursory Research for Embryonic Science and Technology (PRESTO, grant numbers JPMJPR14F1 and JPMJPR18G1) and MEXT Quantum Leap Flagship Program (MEXT Q-LEAP, grant number JPMXS0120330644).

Acknowledgments

We thank Shinobu Onoda and Takeshi Ohshima (National Institutes for Quantum and Radiological Science and Technology) for irradiated nanodiamonds.

Conflicts of Interest

The authors declare no conflict of interest.

References

  1. Chretien, D.; Bénit, P.; Ha, H.H.; Keipert, S.; El-Khoury, R.; Chang, Y.T.; Jastroch, M.; Jacobs, H.T.; Rustin, P.; Rak, M. Mitochondria are physiologically maintained at close to 50 °C. PLoS Biol. 2018, 16, e2003992. [Google Scholar] [CrossRef] [PubMed] [Green Version]
  2. Kiyonaka, S.; Kajimoto, T.; Sakaguchi, R.; Shinmi, D.; Omatsu-Kanbe, M.; Matsuura, H.; Imamura, H.; Yoshizaki, T.; Hamachi, I.; Morii, T.; et al. Genetically encoded fluorescent thermosensors visualize subcellular thermoregulation in living cells. Nat. Methods 2013, 10, 1232–1238. [Google Scholar] [CrossRef] [PubMed]
  3. Tarbashevich, K.; Reichman-Fried, M.; Grimaldi, C.; Raz, E. Chemokine-dependent ph elevation at the cell front sustains polarity in directionally migrating zebrafish germ cells. Curr. Biol. 2015, 25, 1096–1103. [Google Scholar] [CrossRef] [PubMed] [Green Version]
  4. Casey, J.R.; Grinstein, S.; Orlowski, J. Sensors and regulators of intracellular pH. Nat. Rev. Mol. Cell Biol. 2009, 11, 50–61. [Google Scholar] [CrossRef] [PubMed]
  5. Elbaum-Garfinkle, S.; Kim, Y.; Szczepaniak, K.; Chen, C.C.-H.; Eckmann, C.R.; Myong, S.; Brangwynne, C.P. The disordered P granule protein LAF-1 drives phase separation into droplets with tunable viscosity and dynamics. Proc. Natl. Acad. Sci. USA 2015, 112, 7189–7194. [Google Scholar] [CrossRef] [PubMed] [Green Version]
  6. Boeynaems, S.; Alberti, S.; Fawzi, N.L.; Mittag, T.; Polymenidou, M.; Rousseau, F.; Schymkowitz, J.; Shorter, J.; Wolozin, B.; Bosch, L.V.D.; et al. Protein phase separation: A new phase in cell biology. Trends Cell Biol. 2018, 28, 420–435. [Google Scholar] [CrossRef] [PubMed] [Green Version]
  7. Guo, Y.; Li, D.; Zhang, S.; Yang, Y.; Liu, J.J.; Wang, X.; Liu, C.; Milkie, D.E.; Moore, R.P.; Tulu, U.S.; et al. Visualizing intracellular organelle and cytoskeletal interactions at nanoscale resolution on millisecond timescales. Cell 2018, 175, 1430–1442. [Google Scholar] [CrossRef] [PubMed] [Green Version]
  8. Tofts, P.S.; Brix, G.; Buckley, D.L.; Evelhoch, J.L.; Henderson, E.; Knopp, M.V.; Larsson, H.B.; Lee, T.Y.; Mayr, N.A.; Parker, G.J.; et al. Estimating kinetic parameters from dynamic contrast-enhanced t1-weighted MRI of a diffusable tracer: Standardized quantities and symbols. J. Magn. Reson. Imaging 1999, 10, 223–232. [Google Scholar] [CrossRef]
  9. Ukaji, M.; Ebara, M.; Tsuchiya, Y.; Kato, H.; Fukuda, H.; Sugiura, N.; Saisho, H. Diagnosis of gallstone composition in magnetic resonance imaging: In vitro analysis. Eur. J. Radiol. 2002, 41, 49–56. [Google Scholar] [CrossRef]
  10. Jung, S.C.; Yeom, J.A.; Kim, J.H.; Ryoo, I.; Kim, S.C.; Shin, H.; Lee, A.L.; Yun, T.J.; Park, C.K.; Sohn, C.H.; et al. Glioma: Application of histogram analysis of pharmacokinetic parameters from t1-weighted dynamic contrast-enhanced mr imaging to tumor grading. Am. J. Neuroradiol. 2014, 35, 1103–1110. [Google Scholar] [CrossRef] [PubMed] [Green Version]
  11. Wen, Z.; Hu, S.; Huang, F.; Wang, X.; Guo, L.; Quan, X.; Wang, S.; Zhou, J. MR imaging of high-grade brain tumors using endogenous protein and peptide-based contrast. NeuroImage 2010, 51, 616–622. [Google Scholar] [CrossRef] [PubMed] [Green Version]
  12. Boretti, A.; Rosa, L.; Blackledge, J.; Castelletto, S. Nitrogen-vacancy centers in diamond for nanoscale magnetic resonance imaging applications. Beilstein J. Nanotechnol. 2019, 10, 2128–2151. [Google Scholar] [CrossRef] [PubMed]
  13. Bucher, D.B.; Craik, D.P.L.A.; Backlund, M.P.; Turner, M.J.; Ben Dor, O.; Glenn, D.R.; Walsworth, R.L. Quantum diamond spectrometer for nanoscale NMR and ESR spectroscopy. Nat. Protoc. 2019, 14, 2707–2747. [Google Scholar] [CrossRef] [PubMed]
  14. Glenn, D.R.; Bucher, D.B.; Lee, J.; Lukin, M.D.; Park, H.; Walsworth, R.L. High-resolution magnetic resonance spectroscopy using a solid-state spin sensor. Nature 2018, 555, 351–354. [Google Scholar] [CrossRef] [PubMed] [Green Version]
  15. Yu, S.J.; Kang, M.W.; Chang, H.C.; Chen, K.M.; Yu, Y.C. Bright Fluorescent nanodiamonds: No photobleaching and low cytotoxicity. J. Am. Chem. Soc. 2005, 127, 17604–17605. [Google Scholar] [CrossRef] [PubMed]
  16. Gruber, A. Scanning confocal optical microscopy and magnetic resonance on single defect centers. Science 1997, 276, 2012–2014. [Google Scholar] [CrossRef] [Green Version]
  17. Hanson, R.; Mendoza, F.M.; Epstein, R.J.; Awschalom, D.D. Polarization and readout of coupled single spins in diamond. Phys. Rev. Lett. 2006, 97, 087601. [Google Scholar] [CrossRef] [PubMed] [Green Version]
  18. Rendler, T.; Neburkova, J.; Zemek, O.; Kotek, J.; Zappe, A.; Chu, Z.; Cígler, P.; Wrachtrup, J. Optical imaging of localized chemical events using programmable diamond quantum nanosensors. Nat. Commun. 2017, 8, 14701. [Google Scholar] [CrossRef] [PubMed]
  19. Ermakova, A.; Pramanik, G.; Cai, J.M.; Algara-Siller, G.; Kaiser, U.; Weil, T.; Tzeng, Y.K.; Chang, H.C.; McGuinness, L.P.; Plenio, M.B.; et al. Detection of a few metallo-protein molecules using color centers in nanodiamonds. Nano Lett. 2013, 13, 3305–3309. [Google Scholar] [CrossRef] [PubMed]
  20. Fujisaku, T.; Tanabe, R.; Onoda, S.; Kubota, R.; Segawa, T.F.; So, F.T.-K.; Ohshima, T.; Hamachi, I.; Shirakawa, M.; Igarashi, R. pH Nanosensor using electronic spins in Diamond. ACS Nano 2019, 13, 11726–11732. [Google Scholar] [CrossRef] [PubMed]
Figure 1. (a) Pulse sequence of T1 measurement. The first laser pulse (“Polarization”) polarizes the spin configuration of nitrogen-vacancy (NV) centres into ms = 0. During the interval time τ, the spins relax into ms = ± 1. Note that the “Readout” fluorescence intensity of NV centres in the state of ms = 0 is stronger than ms = ± 1. Therefore, the fluorescence decreases in accordance to the relaxation asshown in (b). (b) Schematic plots of T1 relaxation of the fluorescence intensity. Different two cases (T1 = T1a and T1b) were shown. A signal at τ was defined as difference between fluorescence intensities at the interval time = 0 and τ. To obtain T1-weighted images, pixel signals are mapped with false colour. The magnitude of the contrast defined as signal B—signal A have dependence on τ.
Chemosensors 08 00068 g001
Figure 2. Simulation of T1 change from T1a (2500 (a), 2000 (b) and 1500 (c) (μs) to T1b (1000 (red), 850 (yellow), 700 (green), 550 (blue) and 400 (purple)) which are typical values of 100-nm nanodiamonds. Graphs shows the contrasts of T1-weighted images between T1a and T1b using interval time τ. Black dots represent maximum points of the contrast. These points shift depending on both T1a and T1b.
Chemosensors 08 00068 g002
Figure 3. Simulation of T1-weighted images constructed from each τ value. T1 is simulated in the range typically observed for changes in 100-nm nanodiamond fluorescence.
Chemosensors 08 00068 g003
Figure 4. (a) T1-weighted images of a 100-nm nanodiamond in various pH condition (top) and its signal intensity in Y = 5.3 µm plotted against X (bottom). Red line represents the fitting function, which contains seven gaussian functions. (b) Definite integrals of the fitted gaussians in each pH condition. Error bars represent the standard error of the gaussian fitting.
Chemosensors 08 00068 g004
Figure 5. (a) T1-weighted images of a 100-nm nanodiamond in alternately changing pH conditions (top) and its signal intensity in Y = 5.1 µm plotted against X (bottom). Red line represents the fitting function, which contains six gaussian functions. (b) Definite integrals of the fitted gaussian functions. Error bars represent the standard error of the gaussian fitting.
Chemosensors 08 00068 g005

