Article

Peroxides and Bisphenols Detection in Extra Virgin Olive Oil (EVOO) by Plasmonic Nanodomes Transducers

by
Adriano Colombelli
1,
Daniela Lospinoso
1,2,
Maria Grazia Manera
1 and
Roberto Rella
1,*
1
Institute for Microelectronics and Microsystems IMM-CNR, Campus Ecotekne, 73100 Lecce, Italy
2
Deparmento of Mathematics and Physics “Ennio De Giorgi”, University of Salento, Campus Ecotekne, via Monteroni, 73100 Lecce, Italy
*
Author to whom correspondence should be addressed.
Submission received: 30 July 2020 / Revised: 25 August 2020 / Accepted: 2 September 2020 / Published: 7 September 2020
(This article belongs to the Section Applied Chemical Sensors)

Abstract

:
Large-area nanostructured transducer for absorption opto-plasmonic measurements in the ultraviolet visible UV-VIS spectral range have been realized by colloidal lithography. The design and simulation performed guarantee the optical behaviour of the nanostructured transducers. Morphological characterization by AFM microscopy evidences the nanodome structure of the object realized in array configuration. A microfluidic device was optimized to perform measurements in real time. Qualitative evaluation of the peroxides’ and bisphenols’ concentration in extra virgin olive oil (EVOO) have been obtained by following the variation in the plasmonic resonance monitoring of a suitable array nanodome structure deposited onto a glass substrate. Comparison of the obtained results with laboratory-standard methodologies gives us guaranteed support of the potential of the realized technology.

1. Introduction

Like all natural fatty substances, virgin olive oils undergo unavoidable and irreversible oxidative changes over time, accelerated by unsuitable conservation [1,2,3,4,5,6,7]. The consequences of these phenomena concern both the nutritional aspects (loss of antioxidants, reduction of unsaturated fatty acids, increase in the content in radicals and other harmful molecules), and the sensory properties (loss of fruitiness, bitter and spicy, defect of rancid). It often happens that there are oils that, well before the minimum storage term (TMC), have exceeded the tolerable limits of oxidation and should be downgraded, causing damage in economic and image terms to the entire sector [8,9]. The present work is placed in this panorama with results that offer operators in the sector an innovative tool for quality control and decision support, through constant and timely monitoring of the oxidative state of the oils. The ability to monitor the evolution of the oxidative state of an oil quickly and on-site can allow intervention in the critical points of the supply chain (from storage, transport, bottling) and control of the main decay factors in the quality of the oil [10,11,12,13]. Nonetheless, it can allow those who manage and distribute the product to correctly place each batch of oil within its oxidative history and thus have real control over its residual commercial life to optimize its marketing. Scientific research has made innovative methods available for the analysis of lipid oxidation products, characterized by simplicity of execution, rapidity, use of reduced or zero solvents, and high potential for miniaturization. These analytical techniques require adaptation to the specificities of the “virgin olive oil” matrix (characterized by the presence of numerous minor compounds that can interfere with the analysis) and a miniaturization process in order to allow a rapid, timely and on-site analysis of some basic parameters (compounds): peroxides, which are the primary oxidation index normally used to determine the oxidative state of virgin olive oils; conjugated dienes, closely linked to the formation of oxidized polyunsaturated fatty acids; the phenols, which, in addition to having a high impact on the sensory and nutritional properties of the oils, hinder their oxidation [14]; volatile compounds, responsible for the perception of rancidity, for which it is possible to carry out continuous analysis as an alternative to liquid matrix monitoring techniques; the reverse micelles, which are formed in oils due to the presence of oxidation products, and which, during the induction time, undergo a progressive growth and therefore an implosion, which marks the end of the induction time itself. An important support, in this sense, in the determination of the oxidative state, limited in this case by an evaluation of the peroxides present, can come from microelectronics and nanotechnologies, applied to new-generation semiconductors and an advanced optical and microfluidic device [15,16,17,18]. In this work, nanostructured plasmonic optical transducers have been realized as optical monitoring systems for the qualitative evaluation of the oxidative state of EVOO oils. Recently, a very large effort has been invested in nanofabrication approaches, allowing fast, reproducible and parallel surface patterning at the large-area nanoscale. Here, a simple and reproducible approach for the fabrication of a large-area (about 25 mm2), highly ordered array of plasmonic metal nanostructured surfaces, obtained by the nano-sphere lithography (NSL) technique, is presented and used for optical sensing application (Colombelli et al. [19]). Based on the self-assembling of close-packed polystyrene (PS) particles, at air/water interface, this cost-effective approach enables the fabrication of a large-area and transferrable colloidal mask with a high-quality, crystal-like structure. Related optical properties of the transducers are monitored by UV-VIS spectroscopy, and application in the quality control of extra virgin olive oil (EVOO) is performed. In particular, analysis of peroxides concentration is evaluated using standard methodologies. Peroxides are products generated from the oxidative degradation of polyunsaturated fatty acids in the oil. They build up slowly over time, contributing to oil rancidity, resulting in undesirable flavours and odours. Their identification provides useful information about oil conservation and rancidity. In particular, a general overview of the relative level of Peroxide Values (PV) in EVOO and its likely condition is: <7 meqO2/kg = excellent quality; 7–15 meqO2/kg = good quality; 15–20 meqO2/kg = poor quality; >20 meqO2/kg = rancid oil.
In this paper, a very preliminary qualitative correlation between peroxides and bisphenols concentration and optical absorption measurements in the UV-VIS spectral range was performed by monitoring the variation in the localised plasmonic resonance (LSPR) of a suitable nanodomes structure and the results are compared with laboratory-standard methodologies.

2. Materials and Methods

2.1. Materials

Glass substrates (25 × 25 mm2) were obtained from EOT Electro Optical Technologies. Polystyrene nanospheres with a nominal diameter of 500 nm, suitable for ordered long-range organization, were purchased from Sigma-Aldrich in aqueous suspensions with a concentration of 10 wt%; the coefficient of variation (CV) was specified to be 2.4%, while the density of the PS particles is 1.05 g/cm. These were used as lithographic masks to fabricate a planar distribution of highly ordered gold nanodomes.

2.2. Fabrication

An ordered nano-domes array was obtained by a very simple and reproducible bottom-up approach based on a modified Nano-Sphere Lithography (NSL) fabrication technique. NSL enables the fabrication of nanostructured materials on a desired substrate by depositing metals through the small apertures of an extremely cheap lithographic mask composed of a compact array of polystyrene (PS) nano-spheres. In this work, self-assembled monolayers of PS particles of 500 nm in size have been realized on a liquid surface, exploiting the self-assembly at the air–water interface [19,20,21,22]. This method allows the creation of highly ordered colloidal crystals at the air–water interface over macroscopic areas, in the range of several square centimetres (Figure 1).
Once realized, the colloidal arrangement can be used as a mask for the subsequent realization of planar distributions of plasmonic nanostructures with tailored optical functionalities. In fact, periodic arrays of particles can show extended plasmons depending on the distance between the particles, then coupling between localised surface plasmon resonance (LSPR) and extended surface plasmon resonance (ESPR) can occur causing ultra-high field enhancement, which is very useful for surface-enhanced spectroscopy [23,24,25,26,27]. A directional metal deposition with an angle θ = 0° (angle between the direction of the deposition flux and substrate normal) is necessary to realize triangular nanostructures. Therefore, a physical deposition technique based on Electron Beam Evaporation (EBE) was adopted for the nanostructures’ fabrication. In particular, a layer of gold with a nominal thickness of 40 nm was deposited on the mask, allowing the formation of an ordered array of gold nano-prisms with a lateral edge of few hundred nanometers. A two-nanometers-thick Titanium layer was used to improve the adhesion of gold structures on the substrate. After the metal deposition, the colloidal mask can be removed with a lift-off process that reveals the fabricated nano-structures. Lift-off consists of the mechanical stripping of the PS nanospheres by an adhesive tape. The samples were rinsed several times with ethanol and Mill-Q water, and dried in a stream of nitrogen.
A valuable ability is to couple the versatility offered by the NSL technique with a post-processing tool for a proper engineering of plasmonic NPs arrays. To this purpose, a thermal annealing process was carried out in a controlled atmosphere, generating a morphology modification to the nanostructures. The annealing process was performed into a tube furnace heated to the target temperature before the loading of the sample. The annealing cycle was conducted for 1 h at the temperature of 500 °C. Before and after the annealing, the morphological and optical properties of the samples were investigated, in order to confirm the effect of the thermal treatment.

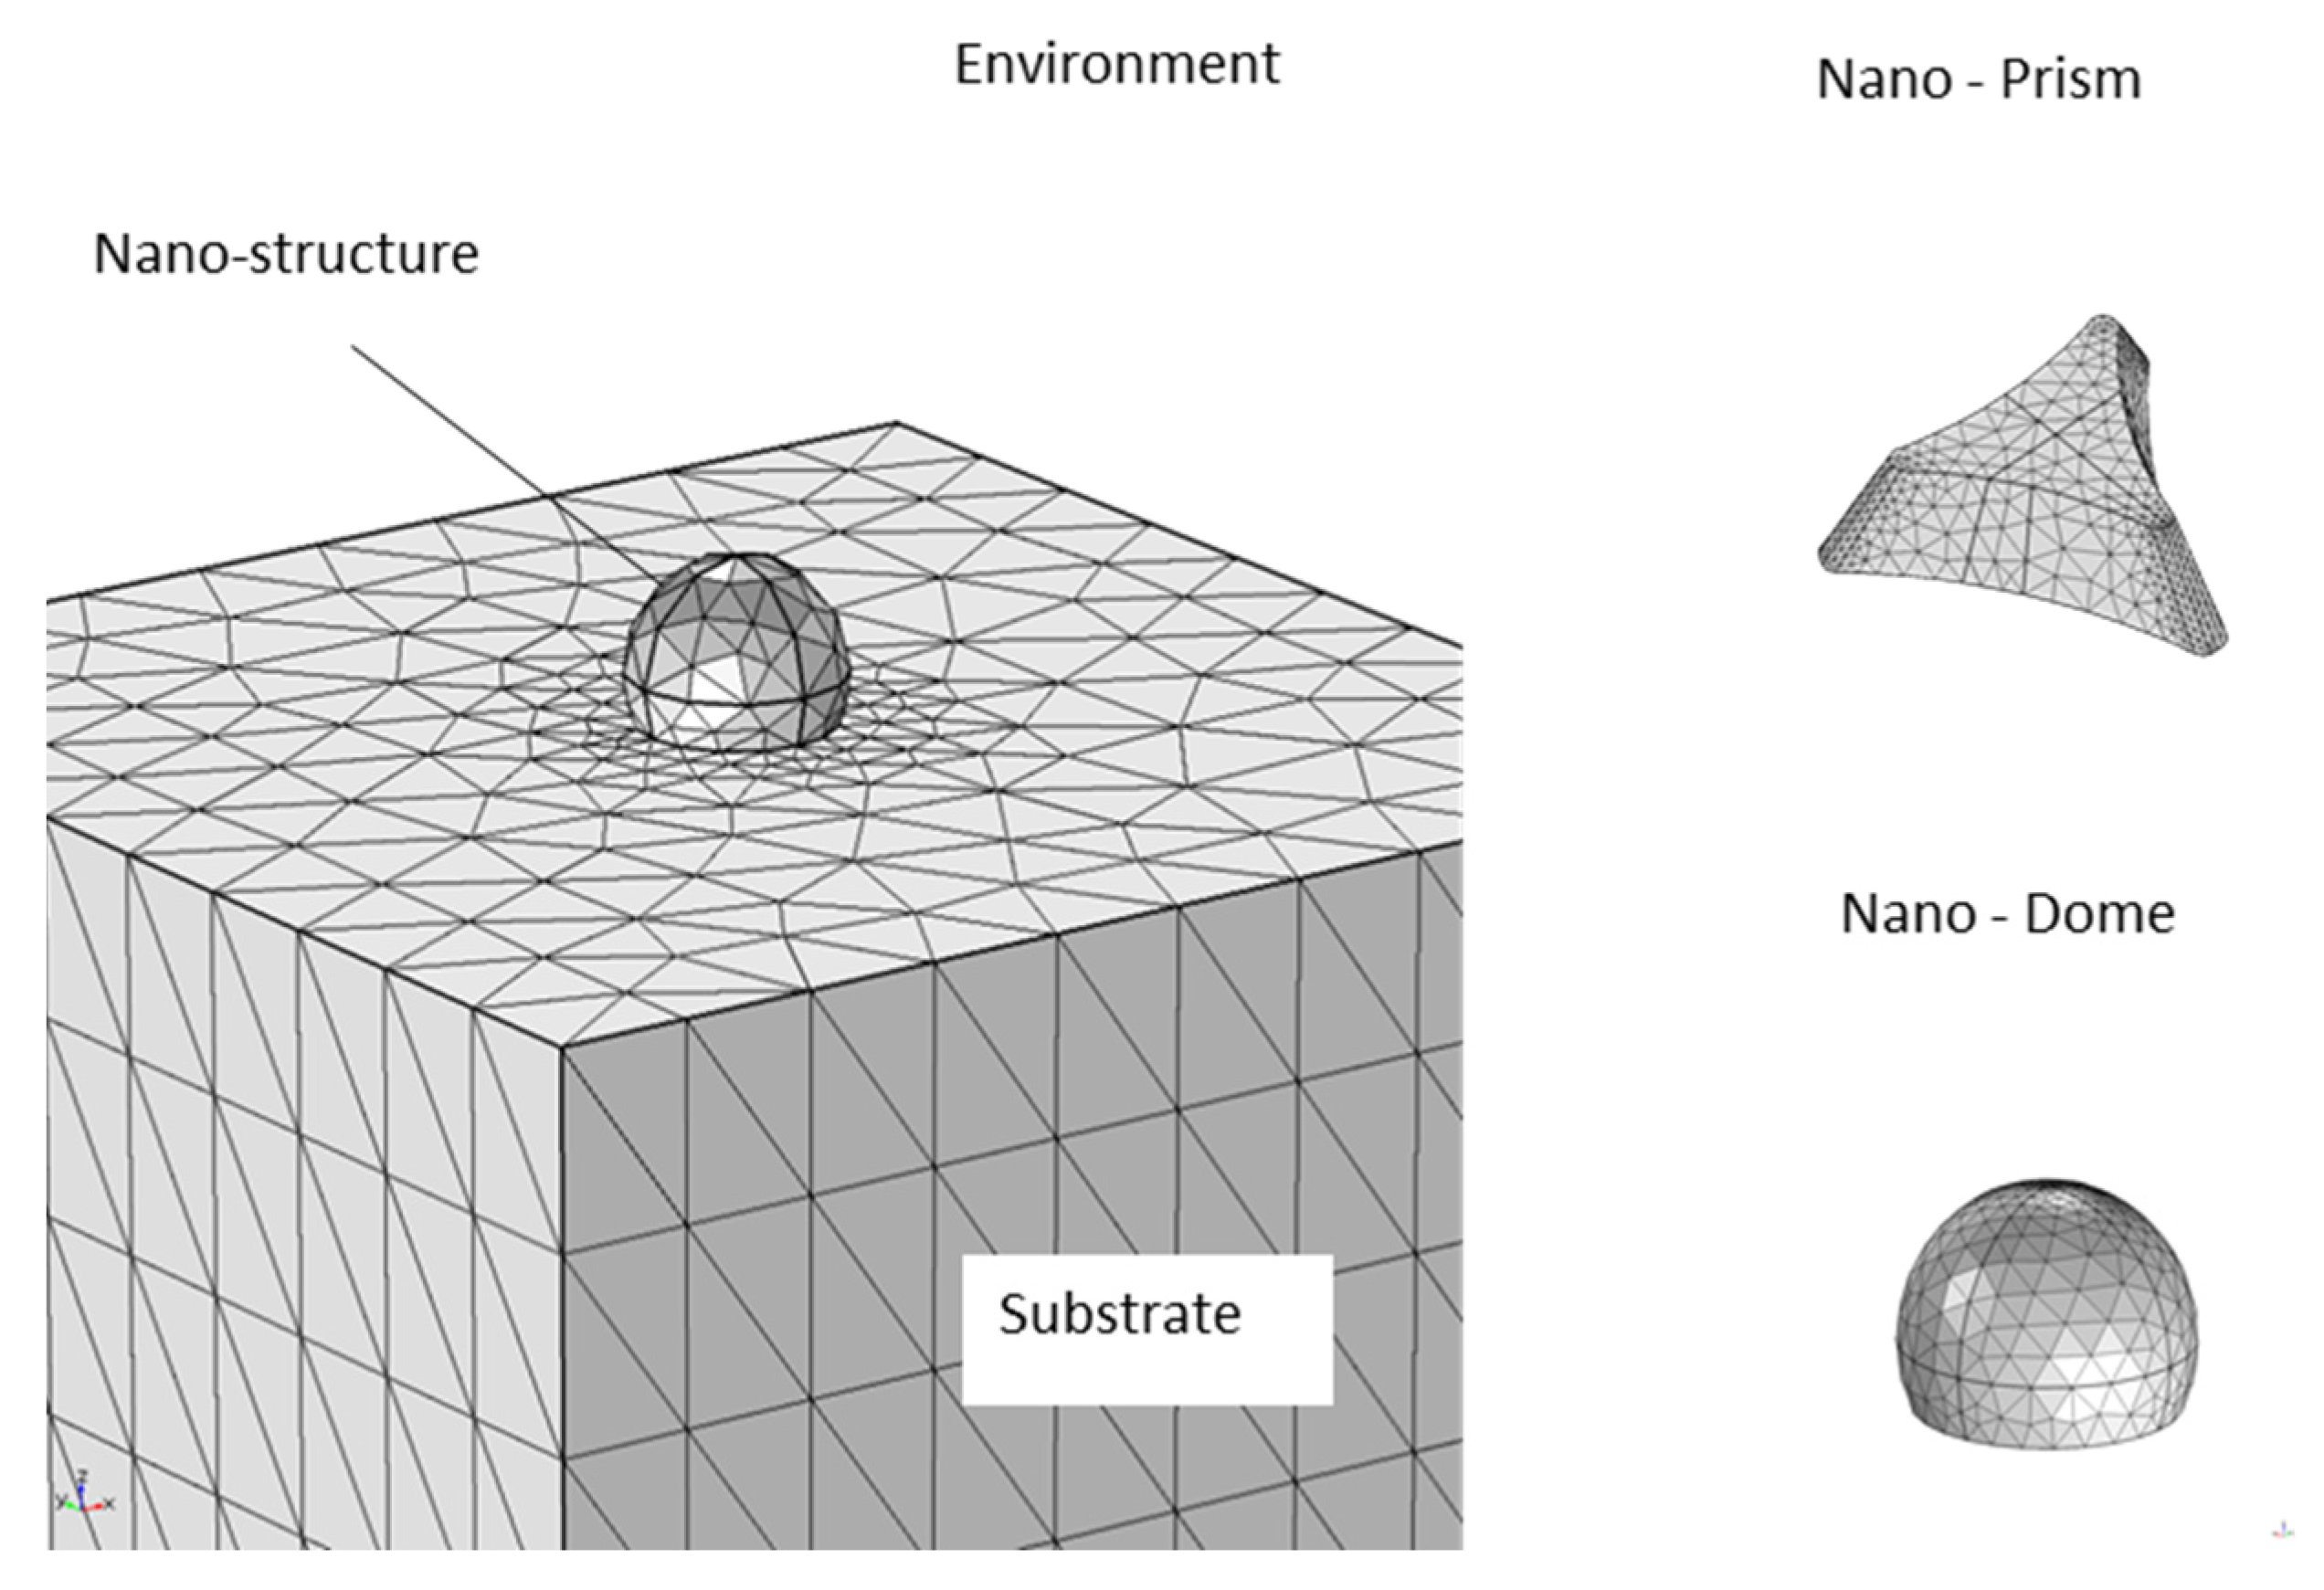
2.3. Numerical Method

In order to investigate the optical response of the fabricated nanostructures in the visible near-infrared (Vis-NIR) spectral range, we developed different numerical models based on Finite Element Method (FEM), by using the RF Module of COMSOL Multiphysics. In particular, planar distributions of gold nano-domes on glass substrates were considered. Different geometrical parameters like shapes, diameters and metal thickness of the simulated nanostructures were optimized by considering the results obtained from morphological characterization. Considering the average inter-dome distance of 500 nm of the fabricated nanostructures, the hexagonal distribution of gold nano-domes can be approximated to a linear array of interacting structures. A 2D simulation characterized by the geometry reported in Figure 2 can be developed to significantly reduce the computational cost of the problem.
With the use of appropriate boundary conditions, the simulation domain reported in Figure 2 represents the unit cell of the analysed system. Starting from the bottom of the computational domain, the first region represents the glass substrate, on which the gold nano-dome has been realized. A hemispherical geometry characterized by a diameter of 100 nm and a thickness of 64 nm was chosen to simulate the metal nano-dome, while the last domain at the top represents the external environment. A free triangular mesh with a local refinement near the particle regions was used for all computational domains. In the visible spectral range, the optical properties of gold nanostructures can be simulated by considering a complex and frequency-dependent dielectric constant, with real and imaginary components. In the model, an interpolated version of the experimental data from Johnson and Christy [28] was used to describe these components. The optical response of these nanostructures was investigated by using the wavelength modulation technique. In particular, the plasmonic activation was performed, simulating a polychromatic light beam coming from the top of the geometry. Port boundary conditions were set for both the upper and lower edges of the simulation domain, in order to calculate the reflection and transmission coefficients of the system. Periodic boundary conditions were used on the sides of the unit cell to simulate an infinite array of interacting plasmonic nanostructures. The developed model enables to predict the optical absorbance of single and periodic distributions of different metal nanostructures, providing theoretical support to our experimental findings.

2.4. Morphology and Optical Characterization

The morphology of the fabricated close packed array (CPA) of PS nanospheres deposited onto different kind of substrates (glass, silicon, PDMS) was investigated by Atomic Force Microscopy (AFM NT-MDT Spectralight) in order to confirm the formation of a crystal-like structure characterized by hexagonal geometry.
The optical absorption measurements were performed by a Cary500 UV-visible spectrophotometer in the UV-VIS spectral range. On the other hand, a compact fiber optical system equipped by a tungsten halogen light source (LS-1, wavelength range 360–2000 nm), and an AvaSpec-High-resolution spectrometer, with a wavelength ranging between 250–1100 nm, 0.3 nm resolution grating of 600 lines/mm and a slit of 10 µm and a couple of optical fiber probes (R-400-7 UV-Vis, fiber core diameter = 400 nm, wavelength range = 250–850 nm), were used to characterize the plasmonic transducer in liquid phase and transmission configuration. A polychromatic radiation emerging from the optical fiber was perpendicularly focused onto the sample surface. Coupled to the detection fiber probe, the transmitted light was analysed by using the UV-VIS spectrophotometer. All spectra were taken from 400 to 1000 nm at room temperature. The sensing response of the plasmonic transducers was investigated by following the spectral shift characterized by a variation in the refractive indices of the typical plasmonic absorption peak in the presence of EVOO.

3. Results and Discussion
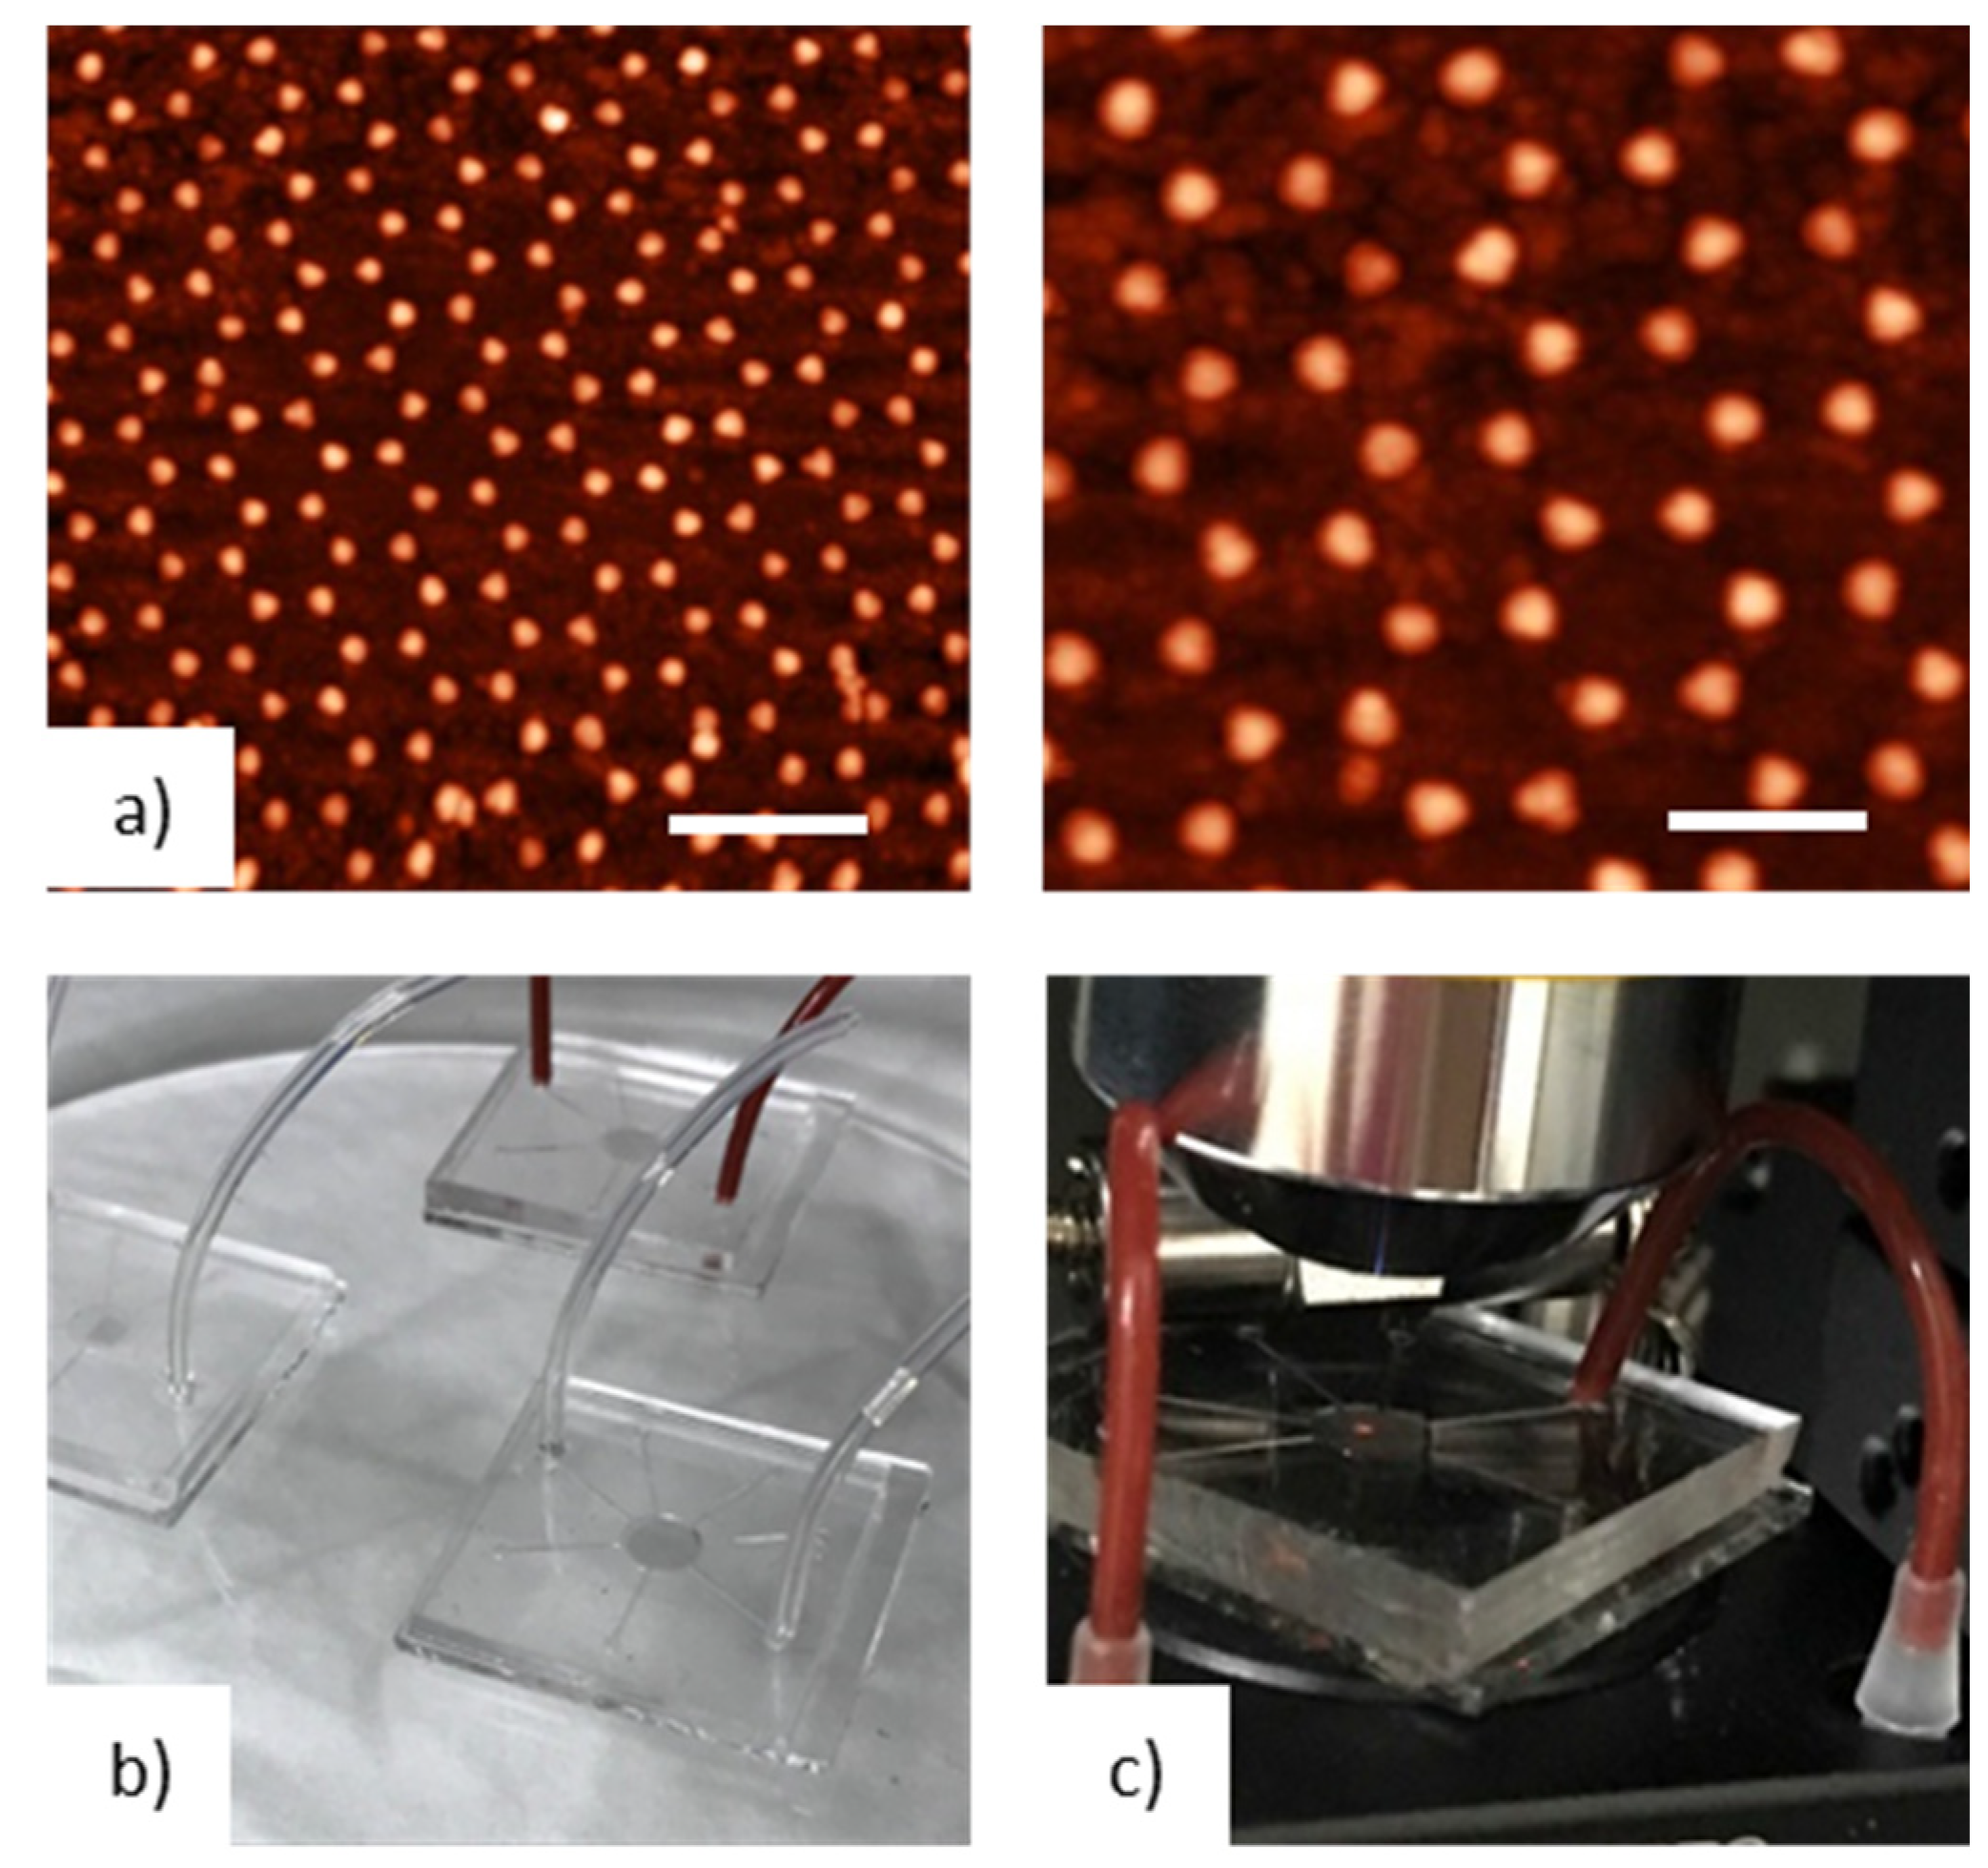
3.1. Morphology

Figure 1b,c displays the typical AFM images of the assembled monolayer of PS particles, with a diameter of 500 nm. As can be clearly observed from Figure 1a, the developed deposition technique can realize a uniform monolayer of PS nanospheres arranged with a long-range order and few lattice defects. In addition, the higher resolution images reported in Figure 1 clearly display the formation of a closely packed hexagonal ordered arrangement of PS nanospheres. After the preparation of the colloidal masks, a two-step thermal evaporation was adopted. A first deposition of 2 nm of Titanium, as an adhesion layer on glass, and, successively, a thickness of 40 nm of gold, were performed. After the colloidal-mask removal by mechanical stripping, the transducers were rinsed in ethanol and dried in nitrogen flow. In order to obtain a nanodome array that was optically tuned at a suitable wavelength, the plasmonic transducers underwent a thermal annealing cycle [22]. Finally, an array of gold nano-domes characterized by a hemi-spherical shape were revealed on the substrate, as can be seen by the typical AFM characterization evidenced in Figure 3a.
As reported in detail by Colombelli et al. [22], the transformation of the Au nano-prisms in nano-domes is attributed to a high-temperature de-wetting process that induces the formation of a highly ordered array of Au nano-domes distributed into a hexagonal periodic lattice. The average height and size of the nanostructures were determined with AFM measurements; an average diameter of 100 nm, a height of 65 nm and a periodicity of 500 nm were found for the realized optical transducers. The annealing time chosen (500 °C) for the experiments was long enough to ensure a remarkable thermal stability of gold nanostructures, providing tuned and stable plasmonic transducers suitable for EVOO LSPR sensing applications, described below, in the visible spectral range.

3.2. Optical Characterization

As evidenced by the AFM morphological measurements, the thermal annealing of the as-prepared transducers, carried out at 500 °C for 1 h, generated rounded nanoparticles characterized by hemi-spherical geometry. This significant variation in the nanoparticles’ morphology deeply affected their optical properties, as can be easily detected by monitoring the colour changes of the plasmonic transducers. Optical absorption measurements in the UV-VIS spectral range of a typical as-nanostructured and thermally treated transducer realized on glass substrate are reported in Figure 4, where the corresponding absorbance spectrum in the 400–1100 nm spectral range is shown and compared with theoretical results obtained through previously described numerical modelling.
As one can see, the excitation of the localized SPR (LSPR) peak is evidenced by the presence of a pronounced absorbance of the fabricated nanostructures in the visible spectral range around λ = 560 nm, which is suitable for our EVOO analysis due to the presence of ordered nanostructures on a large area and higher electrical near field. The annealing process induces an evident blue shift in the spectrum, accompanied by a clear narrowing of the band, underling the close relation between morphology and optical properties.

3.3. Numerical Modelling

In order to have a better insight into the optical properties of these systems, the optical properties of periodic array of Au nano-domes were theoretically analysed (Figure 2). The LSPR activation was simulated using the wavelength modulation technique in transmission configuration, with an incident angle θ = 0° and multiple wavelength in UV-Vis-NIR spectral range (λ = 400–1100 nm). Owing to the excitation of the localized surface plasmon resonance, the Extinction Cross-Section (ECS) reported in Figure 4 exhibits a pronounced peak around λ = 810 nm, a spectral position very similar to the one experimentally found in the absorbance spectra. The differences between numerical and experimental spectra may be attributed to the geometrical approximation adopted in the simulation model but also to the scattering effect of the nanostructure. However, the reported numerical results present optical features very similar to those experimentally found, thus confirming the validity of the numerical model.

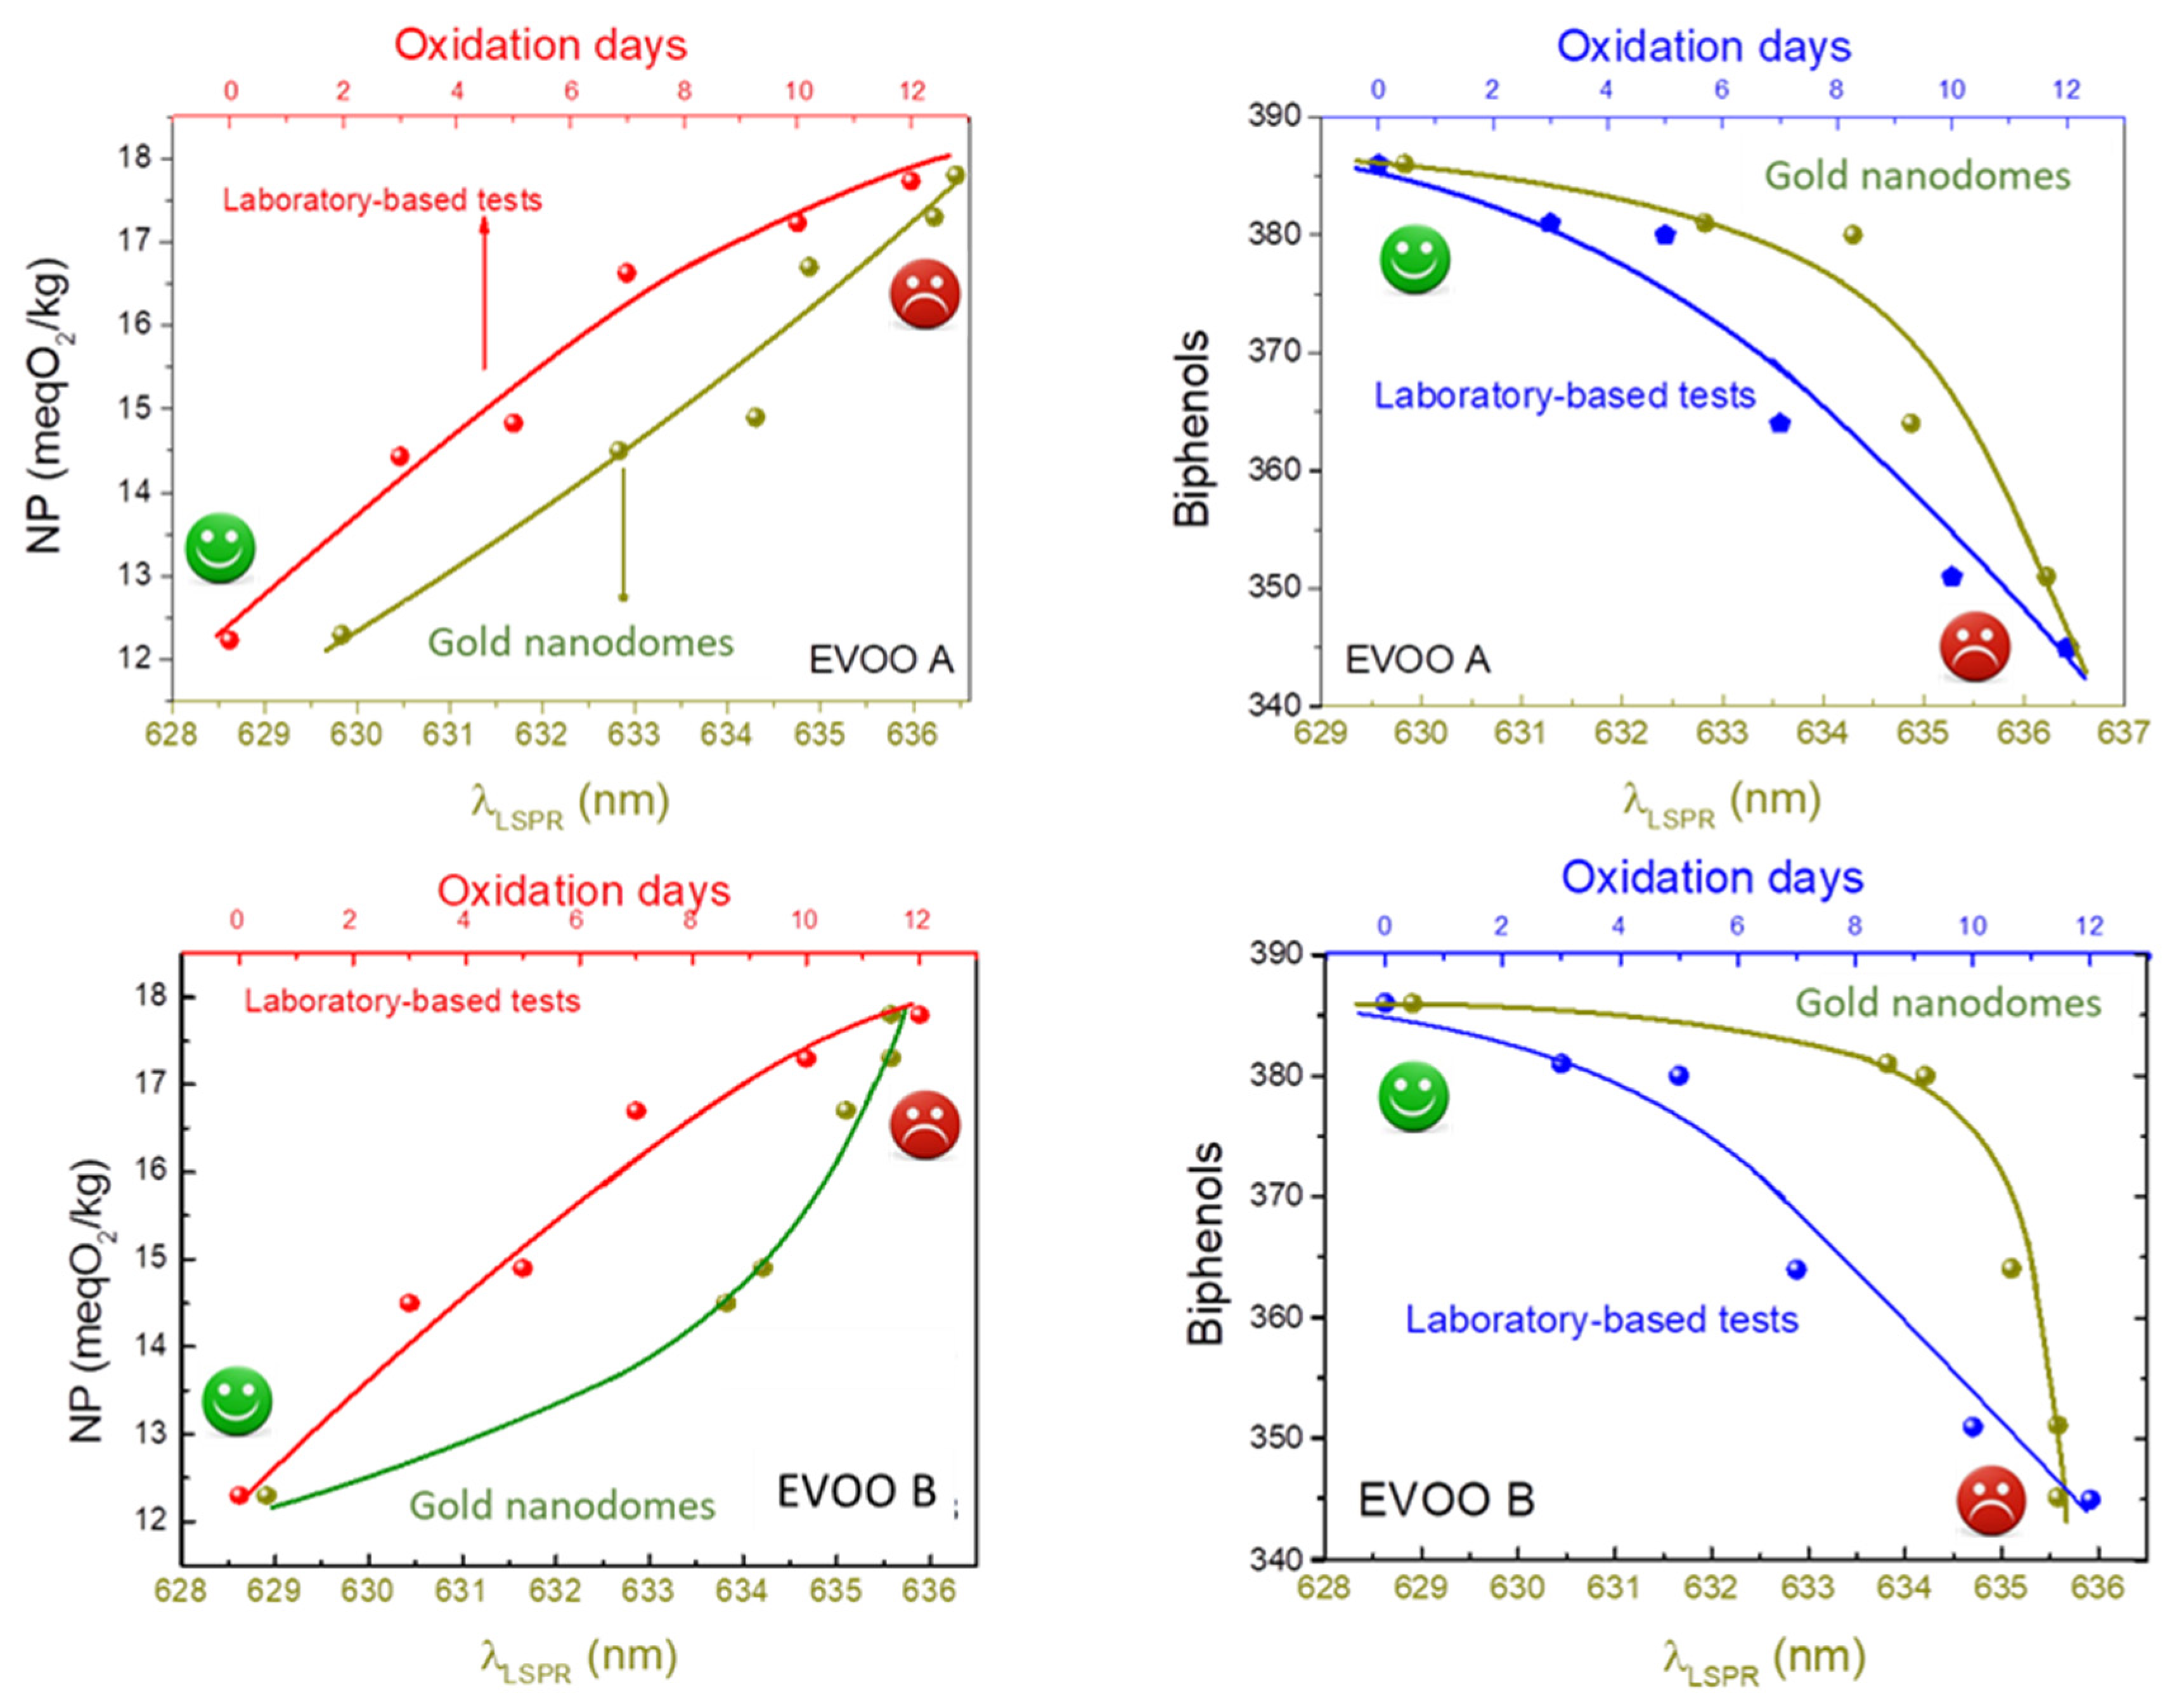
3.4. EVOO Oils Quality Sensing Test

Figure 5 shows the typical absorption measurements obtained by using the nanostructured transducers integrated into a polydimethylsiloxane (PDMS) microfluidic channel suitably realised to the flow of EVOO oil in contact with the nanodomes.
Each EVOO oil sample under investigation was sent into the microchannel by using an automatic micro-syringe device and the optical absorption curves registered in the spectral range between 550 and 850 nm. The optical data were registered by monitoring oils samples treated at different oxidation days (from zero to twelve days 0DayOx–12DayOx). As one can see, the typical localised plasmon resonance peak in the nanostructured transducer underwent a red shift due to the different chemical environment around the nanostructures. In the figure, a typical optical absorption spectrum of the Au nanodomes’ transducer in dry-air and a typical absorption curve of the pure EVOO oil at zero oxidation days are also reported. The behaviour of the LSPR peak in the nanostructures in contact with the EVOO oil can be stressed as an envelope between the LSPR plasmonic peak and EVOO oil optical absorption. A red shift in these optical envelopes is monitored by changing EVOO oil quality in contact with the nanodomes, thus demonstrating the potentiality of his new sensing probe. A comparison between the position of the typical LSPR peak as a function of the peroxide number and oxidation days compared with the measurements of the number of peroxides and biphenols, carried out in a classical analysis laboratory, are reported in Figure 6. To this purpose, as concerns the tests in a certified laboratory of analysis for biophenols, an NGD C89-10 (by HPLC) method was used, whereas, as concerns the spectrophotometric constants (Delta K, K232, K268): Reg. CEE 2568/1191 11/07/1991 GU CEE L248 05/09/1991 All. IX Reg. UE 1833/2015 12/10/2015 GU UE L266/29 13/10/2015 All III), the values were obtained by spectrophotometer analysis. On the contrary, as regards peroxide number, we used the titration methodology, following the rules CEE 2568/1991 11/07/1991 GU CEE L248 05/09/1991 All III Reg UE 1784/2016 30/09/2016 GU UE L273 08/10/2016.
As one can see, a qualitative correlation between the conventional and novel adopted methodologies is evidenced. The plasmonic transducer is potentially able to discriminate the quality of the investigated EVOO oil, depending on the content in terms of peroxide and bisphenol number, and in a very short time. This demonstrates the potentiality of plasmonic transducers to also detect very small variations in the refractive index due to the different oxidation states of the EVOO oil. This strategy can help move towards a realisation of a very preliminary prototype for in situ fast measurements to detect EVOO oil quality. In the figure, smiling or sad faces indicate, to a not necessary specialised operator, the quality of the investigated EVOO oil. Further analysis will be needed to optimize the adopted methodology, but the potentiality of the technique is demonstrated.

4. Conclusions

In summary, we developed a simple and cost-effective approach for the fabrication of highly ordered array of metal nanodomes by NSL in a simple microfluidic device. Based on the self-assembling of close-packed polystyrene particles at the air/water interface, this method enables the fabrication of a large-area and transferrable colloidal mask with a high-quality crystal structure. The LSPR transducers thus realized find application in the quality monitoring of EVO oils by an indirect detection of the olive oil’s oxidation state related to the presence of peroxide and bisphenol’s concentration. A preliminary correlation with measurements obtained in normal analysis laboratory demonstrates the potentiality of this LSPR optical transducers as a small optical sensing device for qualitative analysis of the EVO oils.

Author Contributions

This manuscript was written through contributions of all authors. A.C. designed and performed the NSL experiments, discussed the long-ordered structures, performed sensing measurements; D.L. performed AFM analyses and relative discussion; R.R. and M.G.M. contributed to the discussion of data and supervised the activities. All authors have revised and given their approval to the final version of the manuscript.

Funding

This research was funded by Italian MIUR through Regione Puglia—AVVISO “INNONETWORK—Aiuti a sostegno alle Attività di R&S” in the project M3O3—“Microsistemi multifunzionali per il monitoraggio dei processi ossidativi di oli da olive” (Cod XMPYXR1).

Acknowledgments

The authors want to acknowledge G. Montagna and E. Melissano for technical support.

Conflicts of Interest

The authors declare no conflict of interest. The funders had no role in the design of the study; in the collection, analyses, or interpretation of data; in the writing of the manuscript, or in the decision to publish the results.

References

  1. Pristouri, G.; Badeka, A.; Kontominas, M.G. Effect of packaging material headspace, oxygen and light transmission, temperature and storage time on quality characteristics of extra virgin olive oil. Food Control 2010, 21, 412–418. [Google Scholar] [CrossRef]
  2. Wang, S.; Li, X.; Rodrigues, R.; Flynn, D. Packaging Influences on Olive Oil Quality: A Review of the Literature; UC Davis Olive Center, UC Regents Davis Campus: Davis, CA, USA, August 2014. [Google Scholar]
  3. Li, X.; Zhu, H.; Shoemaker, C.F.; Wang, S.C. The effect of different cold storage conditions on the compositions of extra virgin olive oil. J. Am. Oil Chem. Soc. 2014, 91, 1559–1570. [Google Scholar] [CrossRef]
  4. Calligaris, S.; Manzocco, L.; Anese, M.; Nicoli, M.C. Shelf-life assessment of food undergoing oxidation—A review. Crit. Rev. Food Sci. Nutr. 2015, 56, 1903–1912. [Google Scholar] [CrossRef] [PubMed]
  5. Nicoli, M.C. The shelf-life assessment process. In Shelf-Life Assessment of Food; Nicoli, M.C., Ed.; CRC Press: Boca Raton, FL, USA, 2012. [Google Scholar]
  6. Calligaris, S.; Manzocco, L.; Anese, M.; Nicoli, M.C. Accelerated Shelf-Life Testing. In Food Quality and Shelf-Life; Galanakis, C.M., Ed.; Academic Press: Cambridge, MA, USA, 2019. [Google Scholar]
  7. Conte, L.; Milani, A.; Calligaris, S.; Rovellini, P.; Lucci, P.; Nicoli, M.C. Temperature Dependence of Oxidation Kinetics of Extra Virgin Olive Oil (EVOO) and Shelf-Life Prediction. Foods 2020, 9, 295. [Google Scholar] [CrossRef] [PubMed] [Green Version]
  8. Sinelli, N.; Cosio, M.S.; Gigliotti, C.; Casiraghi, E. Preliminary study on application of mid infrared spectroscopy for the evaluation of the virgin olive oil “freshness”. Anal. Chim. Acta 2007, 598, 128–134. [Google Scholar] [CrossRef] [PubMed]
  9. Fadda, C.; Del Caro, A.; Sanguinetti, A.M.; Urgeghe, P.P.; Vacca, V.; Arca, P.P.; Piga, A. Changes during storage of quality parameters and in vitro antioxidant activity of extra virgin monovarietal oils obtained with two extraction technologies. Food Chem. 2012, 134, 1542–1548. [Google Scholar] [CrossRef] [PubMed]
  10. Guillaume, C.; Ravetti, L. Shelf-Life Prediction of Extra Virgin Olive Oils Using an Empirical Model Based on Standard Quality Tests. J. Chem. 2016, 2016, 6393962. [Google Scholar] [CrossRef] [Green Version]
  11. Psomiadou, E.; Karakostas, K.X.; Blekas, G.; Tsimidou, M.Z.; Boskou, D. Proposed parameters for monitoring quality of virgin olive oil (Koroneiki cv). Eur. J. Lipid Sci. Technol. 2003, 105, 403–409. [Google Scholar] [CrossRef]
  12. Gomes-Alonso, S.; Mancebo-Campos, V.M.; Salvador, M.D.; Fregapane, G. Evolution of major and minor components and oxidation indices of virgin olive oil during 21 months storage at room temperature. Food Chem. 2007, 1, 36–42. [Google Scholar] [CrossRef]
  13. Kotsiou, K.; Tasioula-Margari, M. Monitoring the phenolic compounds of Greek extra-virgin olive oils during storage. Food Chem. 2016, 200, 255–262. [Google Scholar] [CrossRef]
  14. Gertz, C.; Fiebig, H.J. Pyropheophytin a: Determination of thermal degradation products of cholorohyll a in virgin olive oil. Eur. J. Lipid Sci. Technol. 2006, 108, 1062–1065. [Google Scholar] [CrossRef]
  15. Rodrigues, N.; Dias, L.G.; Veloso, A.C.; Pereira, J.A.; Peres, A.M. Evaluation of extra-virgin olive oils shelf life using an electronic tongue—Chemometric approach. Eur. Food Res. Technol. 2016, 243, 597–607. [Google Scholar] [CrossRef] [Green Version]
  16. Shan, H.; Yuan, Y.; Nag, A.; Feng, S.; Afsarimanesh, N.; Han, T.; Mukhopadhyay, S.; Organ, D.R. A Review on the Use of Impedimetric Sensors for the Inspection of Food Quality. Int. J. Environ. Res. Public Health 2020, 17, 5220. [Google Scholar]
  17. Canning, J.; Yu, Z. Fluorescence-Based Determination of Olive Oil Quality Using an Endoscopic Smart Mobile Spectrofluorimeter. IEEE Sens. J. 2020, 20, 8. [Google Scholar]
  18. Kongbonga, G.Y.M.; Ghalila, H.; Onana, M.B.; Majdi, Y.; Ben, L.Z.; Mezlini, H.; Sevestre-Ghalila, S.; Mbesse, K.Y.G.; Hassen, G.; Boyomo, O.M.; et al. Characterization of Vegetable Oils by Fluorescence Spectroscopy. Food Nutr. Sci. 2011, 2, 692–699. [Google Scholar] [CrossRef] [Green Version]
  19. Zhang, J.-T.; Wang, L.; Lamont, D.N.; Velankar, S.S.; Asher, S.A. Fabrication of large-area two-dimensional colloidal crystals. Angew. Chem. Int. Ed. 2012, 51, 6117–6120. [Google Scholar] [CrossRef]
  20. Patoka, P.; Giersig, M. Self-assembly of latex particles for the creation of nanostructures with tunable plasmonic properties. J. Mater. Chem. 2011, 21, 16783–16796. [Google Scholar] [CrossRef] [Green Version]
  21. Yu, J.; Geng, C.; Zheng, L.; Ma, Z.; Tan, T.; Wang, X.; Yan, Q.; Shen, D. Preparation of high-quality colloidal mask for nanosphere lithography by a combination of air/water interface self-assembly and solvent vapor annealing. Langmuir 2012, 28, 12681–12689. [Google Scholar] [CrossRef]
  22. Colombelli, A.; Lospinoso, D.; Taurino, A.; Manera, M.G. Tailoring a periodic metal nanoantenna array using low cost template-assisted lithography. J. Mater. Chem. C 2019, 7, 13818–13828. [Google Scholar] [CrossRef]
  23. Chan, G.H.; Zhao, J.; Hicks, E.M.; Schatz, G.C.; Van Duyne, R.P. Plasmonic Properties of Copper Nanoparticles Fabricated by Nanosphere Lithography. Nano Lett. 2007, 7, 1947–1952. [Google Scholar] [CrossRef]
  24. Hicks, E.M.; Lyandres, O.; Hall, W.P.; Zou, S.; Glucksberg, M.R.; Van Duyne, R.P. Plasmonic Properties of Anchored Nanoparticles Fabricated by Reactive Ion Etching and Nanosphere Lithography. J. Phys. Chem. C 2007, 111, 4116–4124. [Google Scholar] [CrossRef]
  25. Zhang, X.; Whitney, A.V.; Zhao, J.; Hicks, E.M.; Van Duyne, R.P. Advances in contemporary nanosphere lithographic techniques. J. Nanosci. Nanotechnol. 2006, 6, 1920–1934. [Google Scholar] [CrossRef]
  26. Zhang, X.; Yonzon, C.R.; Van Duyne, R.P. Nanosphere lithography fabricated plasmonic materials and their applications. J. Mater. Res. 2006, 21, 1083–1092. [Google Scholar] [CrossRef] [Green Version]
  27. Abdulhalim, I. Coupling configurations between extended surface electromagnetic waves and localized surface plasmons for ultrahigh field enhancement. Nanophotonics 2018, 7, 1891–1916. [Google Scholar] [CrossRef]
  28. Johnson, P.B.; Christy, R.W. Optical Constants of the Noble Metals. Phys. Rev. B 1972, 6, 4370–4379. [Google Scholar] [CrossRef]
Figure 1. (a) Example of a colloidal mask deposited onto a solid substrate like glass and silicon or onto a flexible substrate like polydimethylsiloxane (PDMS); (b) atomic force microscopy (AFM) images at low (b) and high (c) magnification of a close packed array (CPA) of polystyrene (PS) particles with diameter of 500 nm; The scale bars are 4 and 1 μm, respectively.
Chemosensors 08 00083 g001
Figure 2. Schematic illustration of the geometry and the mesh elements distribution used for the simulation of Au nano-prism and nano-domes.
Chemosensors 08 00083 g002
Figure 3. (a) AFM images at low and high magnification of Au Nano-Domes realized on glass substrates; The scale bars are 1 μm and 500 nm, respectively. (b) Example of Lab on Chip (LOC) devices realized by integrating plasmonic nano-structures into PDMS microfluidic channels; LOC devices have been exploited for real-time sensing measurements using the setup reported in (c).
Chemosensors 08 00083 g003
Figure 4. (a) Comparison of the calculated and the experimental normalized absorbance of a highly ordered array of gold nano-prisms and nano-domes; high-magnification AFM images of these structures are reported in Figure (b,c), respectively. The scale bar is 250 nm.
Chemosensors 08 00083 g004
Figure 5. (a) Experimental set-up and microfluidic chips used during the experimental optical measurements (b) Optical absorption measurements in the UV-VIS spectral range performed on EVO oil at different oxidation states. Optical absorption of the nanodomes’ array in dry air and of the EVO oil are reported.
Chemosensors 08 00083 g005
Figure 6. The wavelength position of the typical LSPR peaks (λLSPR) as a function of the peroxide number and oxidation days compared with the measurements of the number of peroxides and biphenols carried out in a classical analysis laboratory.
Chemosensors 08 00083 g006

