Article

Capacitance Electrochemical pH Sensor Based on Different Hafnium Dioxide (HfO2) Thicknesses

1
NANOMISENE Lab, LR16CRMN01, Centre for Research on Microelectronics and Nanotechnology of Sousse, Technopole of Sousse B.P. 334, Sahloul, Sousse 4034, Tunisia
2
Higher Institute of Applied Sciences and Technology of Sousse, University of Sousse, 4003 Tunisia of Sousse, GREENS-ISSAT, Cité Ettafala, Ibn Khaldoun, Sousse 4003, Tunisia
3
Institut des Sciences Analytiques, University Claude Bernard Lyon 1, 5 rue de la Doua, F-69100 Villeurbanne, France
4
Instituto de Microelectronica de Barcelona, IMB-CNM (CSIC), Campus UAB, 08193 Bellaterra, Barcelona, Spain
5
Department of Chemistry, Covenant University, Ota KM. 10 Idiroko Road, Ota, Nigeria
*
Author to whom correspondence should be addressed.
Submission received: 3 December 2020 / Revised: 4 January 2021 / Accepted: 6 January 2021 / Published: 10 January 2021
(This article belongs to the Special Issue Feature Papers- Electrochemical Devices and Sensors)

Abstract

:
Over the past years, to achieve better sensing performance, hafnium dioxide (HfO2) has been studied as an ion-sensitive layer. In this work, thin layers of hafnium dioxide (HfO2) were used as pH-sensitive membranes and were deposited by atomic layer deposition (ALD) process onto an electrolytic-insulating-semiconductor structure Al/Si/SiO2/HfO2 for the realization of a pH sensor. The thicknesses of the layer of the HfO2 studied in this work was 15, 19.5 and 39.9 nm. HfO2 thickness was controlled by ALD during the fabrication process. The sensitivity toward H+ was clearly higher when compared to other interfering ions such as potassium K+, lithium Li+, and sodium Na+ ions. Mott−Schottky and electrochemical impedance spectroscopy (EIS) analyses were used to characterise and to investigate the pH sensitivity. This was recorded by Mott–Schottky at 54.5, 51.1 and 49.2 mV/pH and by EIS at 5.86 p[H−1], 10.63 p[H−1], 12.72 p[H−1] for 15, 19.5 and 30 nm thickness of HfO2 ions sensitive layer, respectively. The developed pH sensor was highly sensitive and selective for H+ ions for the three thicknesses, 15, 19.5 and 39.9 nm, of HfO2-sensitive layer when compared to the other previously mentioned interferences. However, the pH sensor performances were better with 15 nm HfO2 thickness for the Mott–Schottky technique, whilst for EIS analyses, the pH sensors were more sensitive at 39.9 nm HfO2 thickness.

1. Introduction

The detection and control of pH are challenging for many environmental, biological and chemical processes that impact human lives [1]. One of the methods for controlling water and food quality is through the change in the pH value. Then, if the measured pH is not in the normal pH range, the quality of used water and food is questionable and should be discarded from normal use. In the case of water, for instance, leaching and nitrifying are indicated by low pH values as seen in the case of the presence of the proliferation of microorganisms in water [2]. The conventional analytical process for water quality monitoring consists of multiple steps: water sampling, sample transportation to laboratories and laboratory analysis. This approach is time-consuming, expensive and laboratory-dependent. In addition, the results are easily affected by anthropogenic interference as well as long-term storage of the water samples. For example, conventional glass pH electrodes are brittle, large in dimensions, slow in response and costly, and they need regular maintenance such as calibration and refilling of the reference buffer solution [3]. Therefore, a challenge is the development of new miniaturized sensors that promise higher-quality sensing with lower costs. For this, a number of methods for measuring pH have been reported such as potentiometric [4,5], capacitive [6], conductometric [7], luminescence [8], optical [9] and shape/mass [10,11]. However, the sensors in these emerging applications should be sensitive, fast, and compatible. In this regard, a range of materials and designs have been explored, but the semiconducting are particularly attractive as they allow fabricating miniaturized sensors with very fast response and excellent sensitivity on the variety of substrates and production can be scaled up.
In this context, the first selective ion field chemical sensor or ISFETs (Ion-Sensitive Field Effect Transistor) was developed in 1970 by P. Bergveld with silicon dioxide (SiO2) as the sensing membrane [12]. These devices have been very successful in their applications in the medical field to monitor certain parameters in blood and urine samples because of their advantages, such as the low cost, fast response and the small sample volumes necessary to perform the analysis. However, this material quickly showed its limitations for pH measurement and its short lifetime. In recent years, to achieve better sensing performance, many materials, such as silicon nitride (Si3N4) [13], aluminium oxide (Al2O3) [14], Si nanowire/SiO2/Al2O3 [15], Erbium oxide Er2O3, Tantalum oxide (Ta2O5) [16], Tin Oxide (SnO2) [17], and Titanium oxide (TiO2) [18] have been used as ion-sensitive layers or pH sensors. Among numerous proposed high dielectric constant K (high-k) of metal oxides reported in the literature, hafnium dioxide (HfO2) has a high pH sensitivity, low drift voltage, low hysteresis and low body effect and is promising as a pH sensing material [19,20,21] in electrolyte–insulator–semiconductor structures. In particular, HfO2 was studied as a pH-sensing membrane in ion-sensitive field-effect transistors (ISFETs) and showed good sensitivity [22]. HfO2 has a medium permittivity (ε ~ 16–19 for the monoclinic phase) and a reasonably high bandgap (5.7 eV) with a suitable band offsets on silicon and exhibits good chemical stability in contact with Si and SiO2. It is also a promising dielectric oxide for advanced applications, such as metal–insulator–metal (MIM) capacitors, which are present in the upper level of integrated circuits (ICs). In the numerous publications reported so far on HfO2 for microelectronic applications, atomic layer deposition (ALD) and CVD have been widely used for films preparation. These chemical routes offer the advantage of possible planar and non-planar surface functionalization at industrial scale [23]. ALD is a very attractive technique for growing a high-quality thin layer onto various substrates. The key benefit of ALD is related to its ability to control the deposition on an atomic scale, while the growth of the ALD film is self-limited and based on surface reaction [24]. For this reason, this method has recently become the decision-making process of the semiconductor company’s components to treat conformally very thin insulating layers. [25].
In the present work, the pH sensing properties of HfO2 thin films with various thicknesses induced by atomic layer deposition were investigated using an electrolyte–insulator–semiconductor structure. The pH sensing properties of a dielectric material should not depend on the thickness of the dielectric layer. These properties should depend on surface charge-exchange sites. However, the devices are used in an aqueous medium, and therefore hydration of the initial layers can affect the sensing properties. HfO2 layers used in transistors are typically very thin and in the range of 10 to 20 nm. Consequently, the investigation of their pH sensitivity as a function of layer thickness will be of great interest.
The electrolyte–insulator–semiconductor structure is a capacitive sensor based on the changes of the surface potential between the electrolyte and the detection insulator, which could be measured as a function of the offset of the capacitance-voltage curves (C(V)). This structure is ranked among the simplest platforms as a replacement of ISFET for the preliminary investigation of the properties of new detection materials. Electrochemical impedance spectroscopy was used to investigate the pH sensitivity for the various HfO2 thicknesses. The relationship between the impedance behaviour and the solution pH for such an electrolyte–insulator–semiconductor has been rarely studied, which stimulates this study and also the effect of interfering ions via electrochemical technique for a potential pH-sensitive material.

2. Materials and Methods

2.1. Chemical and Reagent

All chemicals were commercial products, including Tris(hydroxymethyl)aminomethane (TRIS), magnesium nitrate (Mg(NO3)2), potassium hydroxide (KOH), lithium perchlorate (ClLiO4) and sodium nitrate (NaNO3) and were purchased from Fluka analytical grade reagents. The pH of the solution was adjusted via the addition of 1.0 M hydrochloric acid (HCl, 37%) obtained from Sigma-Aldrich. All reagent solutions were prepared in double-distilled water.

2.2. Substrates Fabrication

The hafnium dioxide (HfO2) substrate was fabricated by the atomic layer deposition (ALD) technique. This technique allows the deposition of very thin layers by sequential self-terminating gas–solid reactions [26,27]. The hafnium dioxide pH sensor was fabricated from a p-type silicon wafer with 100 mm diameter, <100> orientation and 4–40 W·cm−1 resistivity. Here, a thin layer of 78 nm thickness of silicon dioxide (SiO2) was grown thermally on the silicon surface followed by a deposition of HfO2. The principle of the ALD consists of successive and sequential surface treatment to obtain ultra-thin layers. Typically, the precursors of the deposition cycle are in fact introduced sequentially into the reaction chamber, and each injection of precursor is separated by a purging of the reactor using a neutral gas. The first precursor is introduced under gas state, and some molecules are adsorbed on the surface of the substrate. The adsorption process continues until the surface is completely saturated with a precursor monolayer. Thereafter, a neutral gas is introduced into the reaction chamber in order to clean the surface of the substrate and also the chamber. The precursor molecules remaining in the gas phase are then removed. Then, the second precursor is injected and reacts with the monolayer of the first adsorbed precursor, leading to the growth of the film. Finally, a second purge is carried out, in order to eliminate the reaction products as well as the molecules of the second precursor present in the gas phase. The thickness of the deposited HfO2 layer is proportional to the number of ALD cycles performed. With these process conditions, 100 cycles typically result in a thickness of 10.5 nm [26]. Finally, the electrical contact on the silicon backside was obtained by deposition of 500 nm-thick Al (99.5%)/Cu (0.5%) layers on the back of the silicon wafers [28]. The wafers were then diced into chips of 10 mm × 10 mm and were ready for electrochemical characterization.
Prior to any pH measurements, the hafnium dioxide substrates were cleaned with acetone for 15 min in an ultrasonic bath, dried with a nitrogen stream and finally treated by UV irradiation for 30 min using UV-Ozone cleaner (equipment ProCleaner TM Plus from Bioforce). This cleaning process was necessary to eliminate all organic contamination provided for residual resins of the HfO2 fabrication process.
Standard surface characterisations of HfO2 layers deposited by the same ALD process have been thoroughly reported in the literature. Gemma Martín et al. [29] have reported the characterization of the ALD-HfO2 structure by Transmission Electron Microscopy (TEM) and by using electron energy loss spectroscopy (EELS). The TEM images have shown successful growth of HfO2 thin films on silicon substrates. Further, the developed HfO2 structures have been characterized through their electrical properties by Hector Garcıa et al. [30]. The measurement of C(V) and current–voltage (I–V) characteristics have been carried out in order to study the dielectric reliability of the developed HfO2 layers. The authors concluded that the structure realised at 150 °C exhibits both the greatest breakdown voltage and the greatest equivalent oxide thickness (EOT) values, making it the most advantageous condition studied for the reliability of the layer.

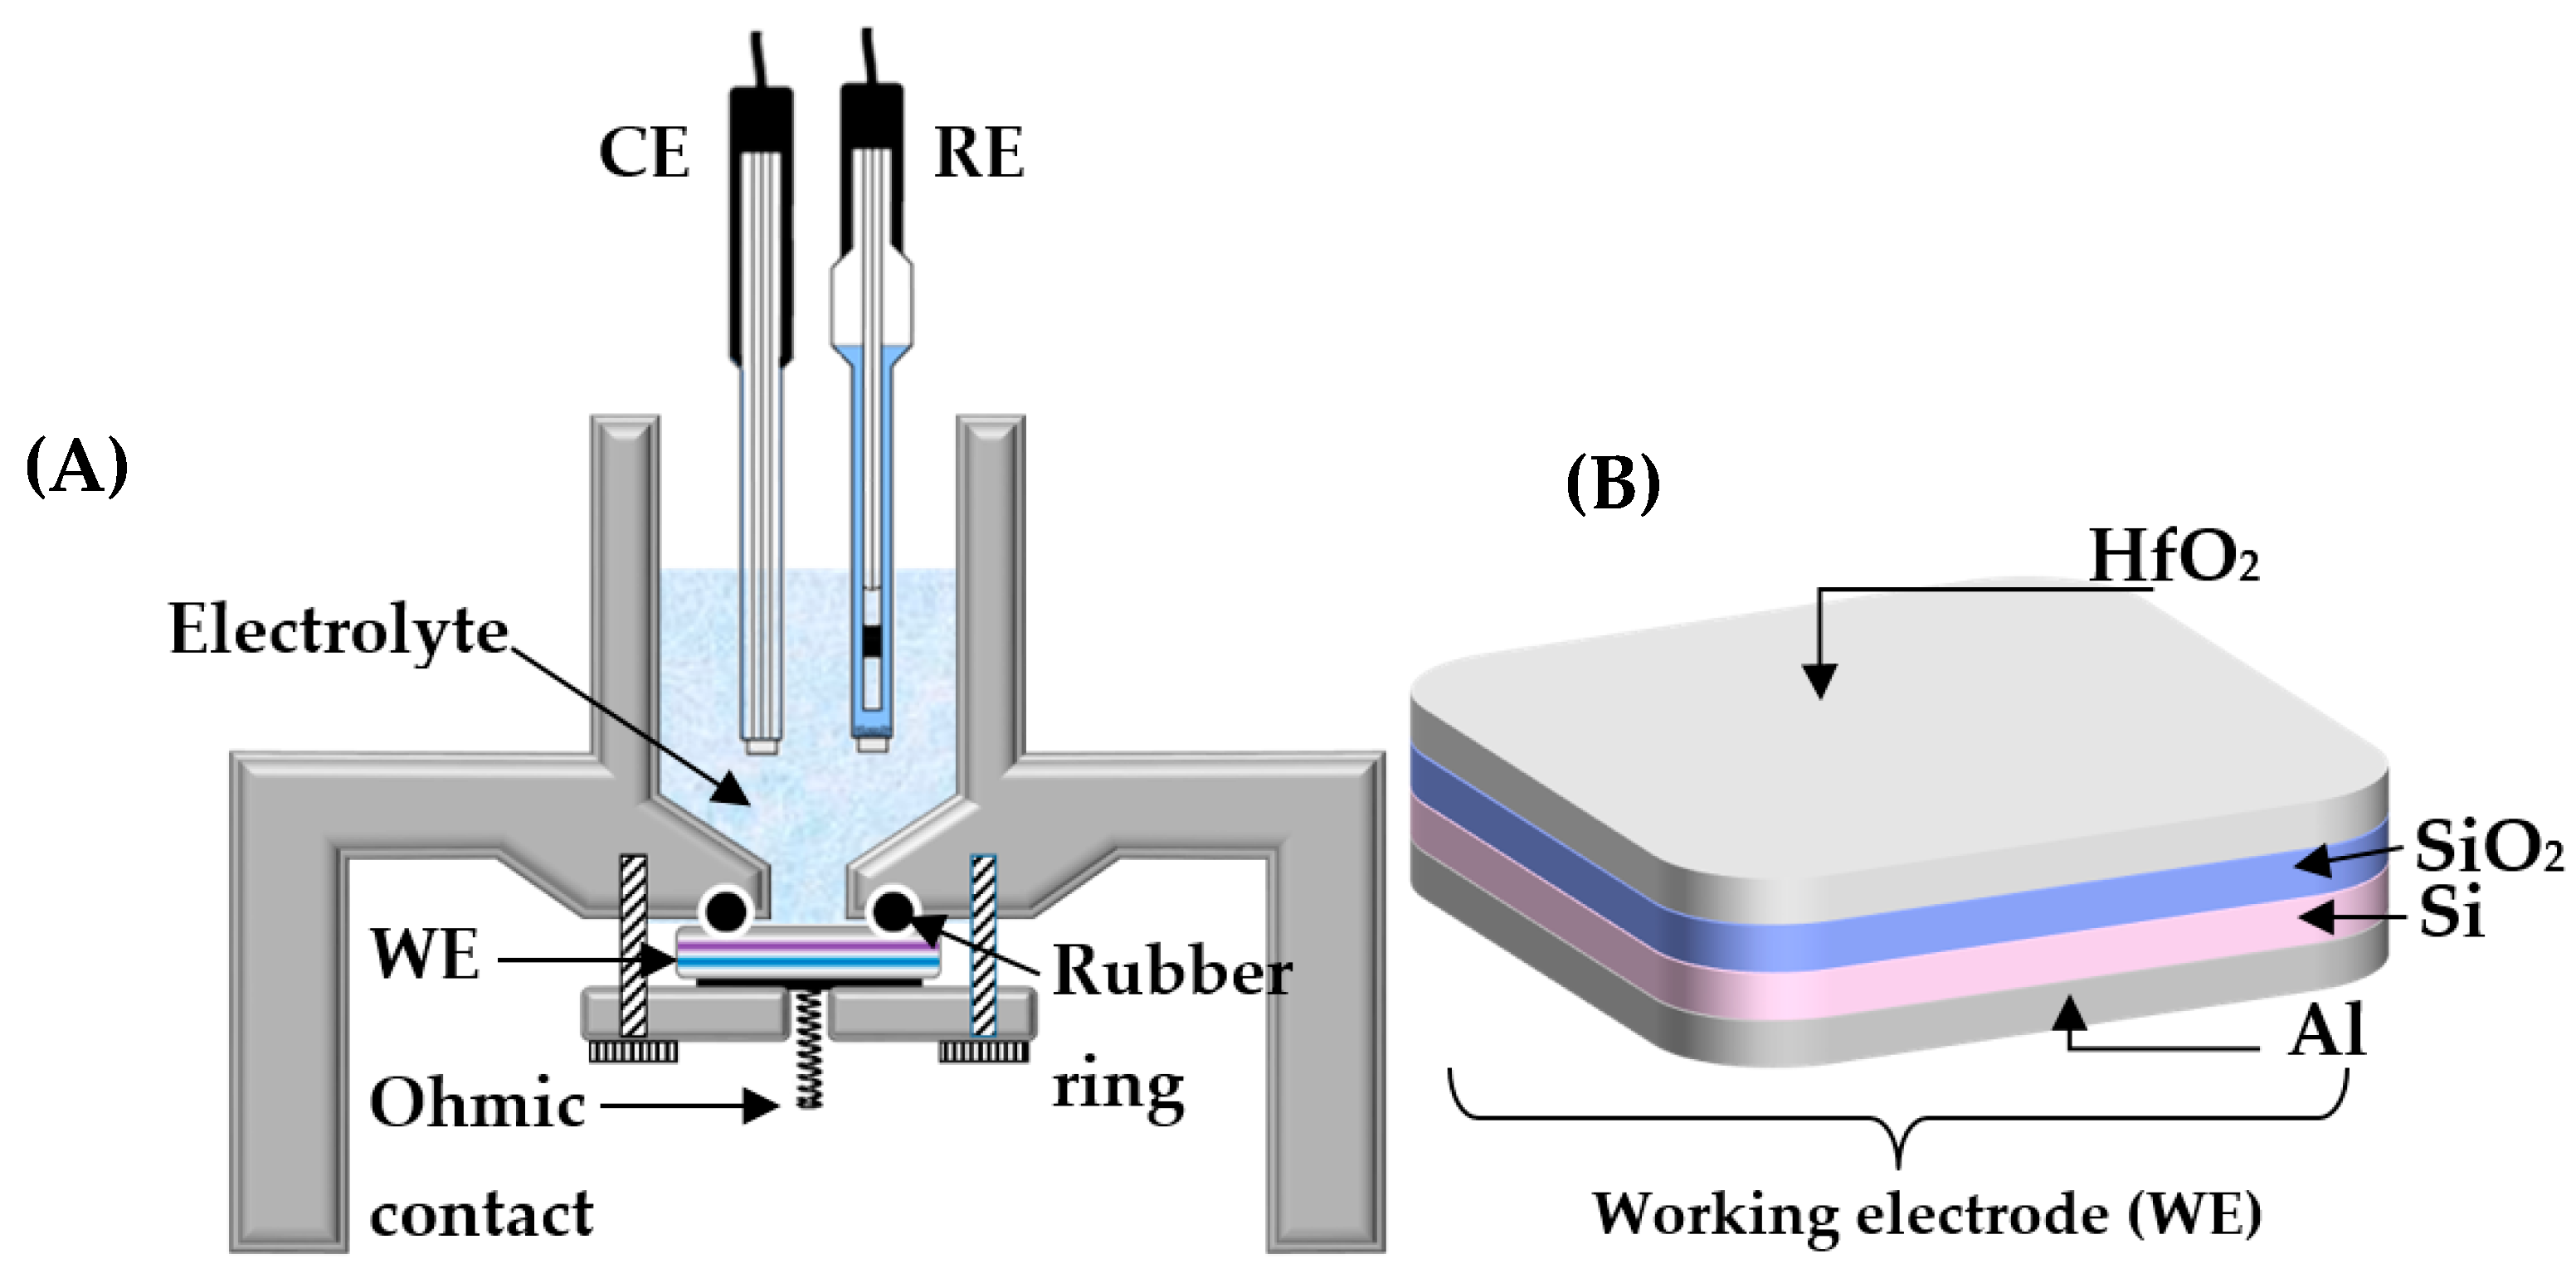
2.3. Electrochemical Measuring Set-Up

Mott–Schottky and electrochemical impedance spectroscopy (EIS) analyses electrochemical analyses were performed by using potentiostat (VMP3 instruments 16 channels BioLogic France). The experiments were performed at room temperature in a dark and grounded metal box to avoid photo-induction charges in the semiconductor structure.
Figure 1 shows the electrochemical cell used for both capacitance and EIS measurements for the pH variation. The electrolyte insulator semiconductor was used with external auxiliary platinum counter electrode (CE) and saturated calomel electrode (SCE) as reference electrode (RE) from (Radiometer Analytical, France). The Al/Si/SiO2/HfO2 structure used as working electrode (WE) and was fixed at the bottom of the electrochemical cell. The electrical contact was realised from the back side of the WE. Mott–Schottky analyses were carried out for pH study following the capacitance (C) variation versus the measured potential (V). C(V) measurements were performed at the optimized frequency of 100 Hz and with a signal amplitude of 25 mV.
The electrolyte used for both electrochemical characterizations of pH study was made from 0.4 M (Mg (NO3)2) in 5 mM Tris(hydroxymethyl)aminomethane, TRIS). The pH was adjusted using 1M HCl solution. The pH values were controlled before and after the C(V) measurements by a pH meter (HI 98130, HANNA).
The electrochemical impedance spectroscopy (EIS) measurements were recorded by applying a sinusoidal potential amplitude of 25 mV and an optimized polarization potential fixed at −0.3 V within the frequency range of 100 mHz to 100 kHz using a VMP3 Bio-Logic Science Instrument, France. The pH variation was quantified by the variation of transfer charge resistance Rtc. This parameter was extracted from Nyquist plots of the impedance data using EC-Lab V11.36 modelling software (Bio-Logic Science Instrument, France). EIS data were fitted using Z-fit with Randomize + Simplex method. Randomize was stopped on 100,000 iterations, and the fit stopped on 5000 iterations.

3. Results

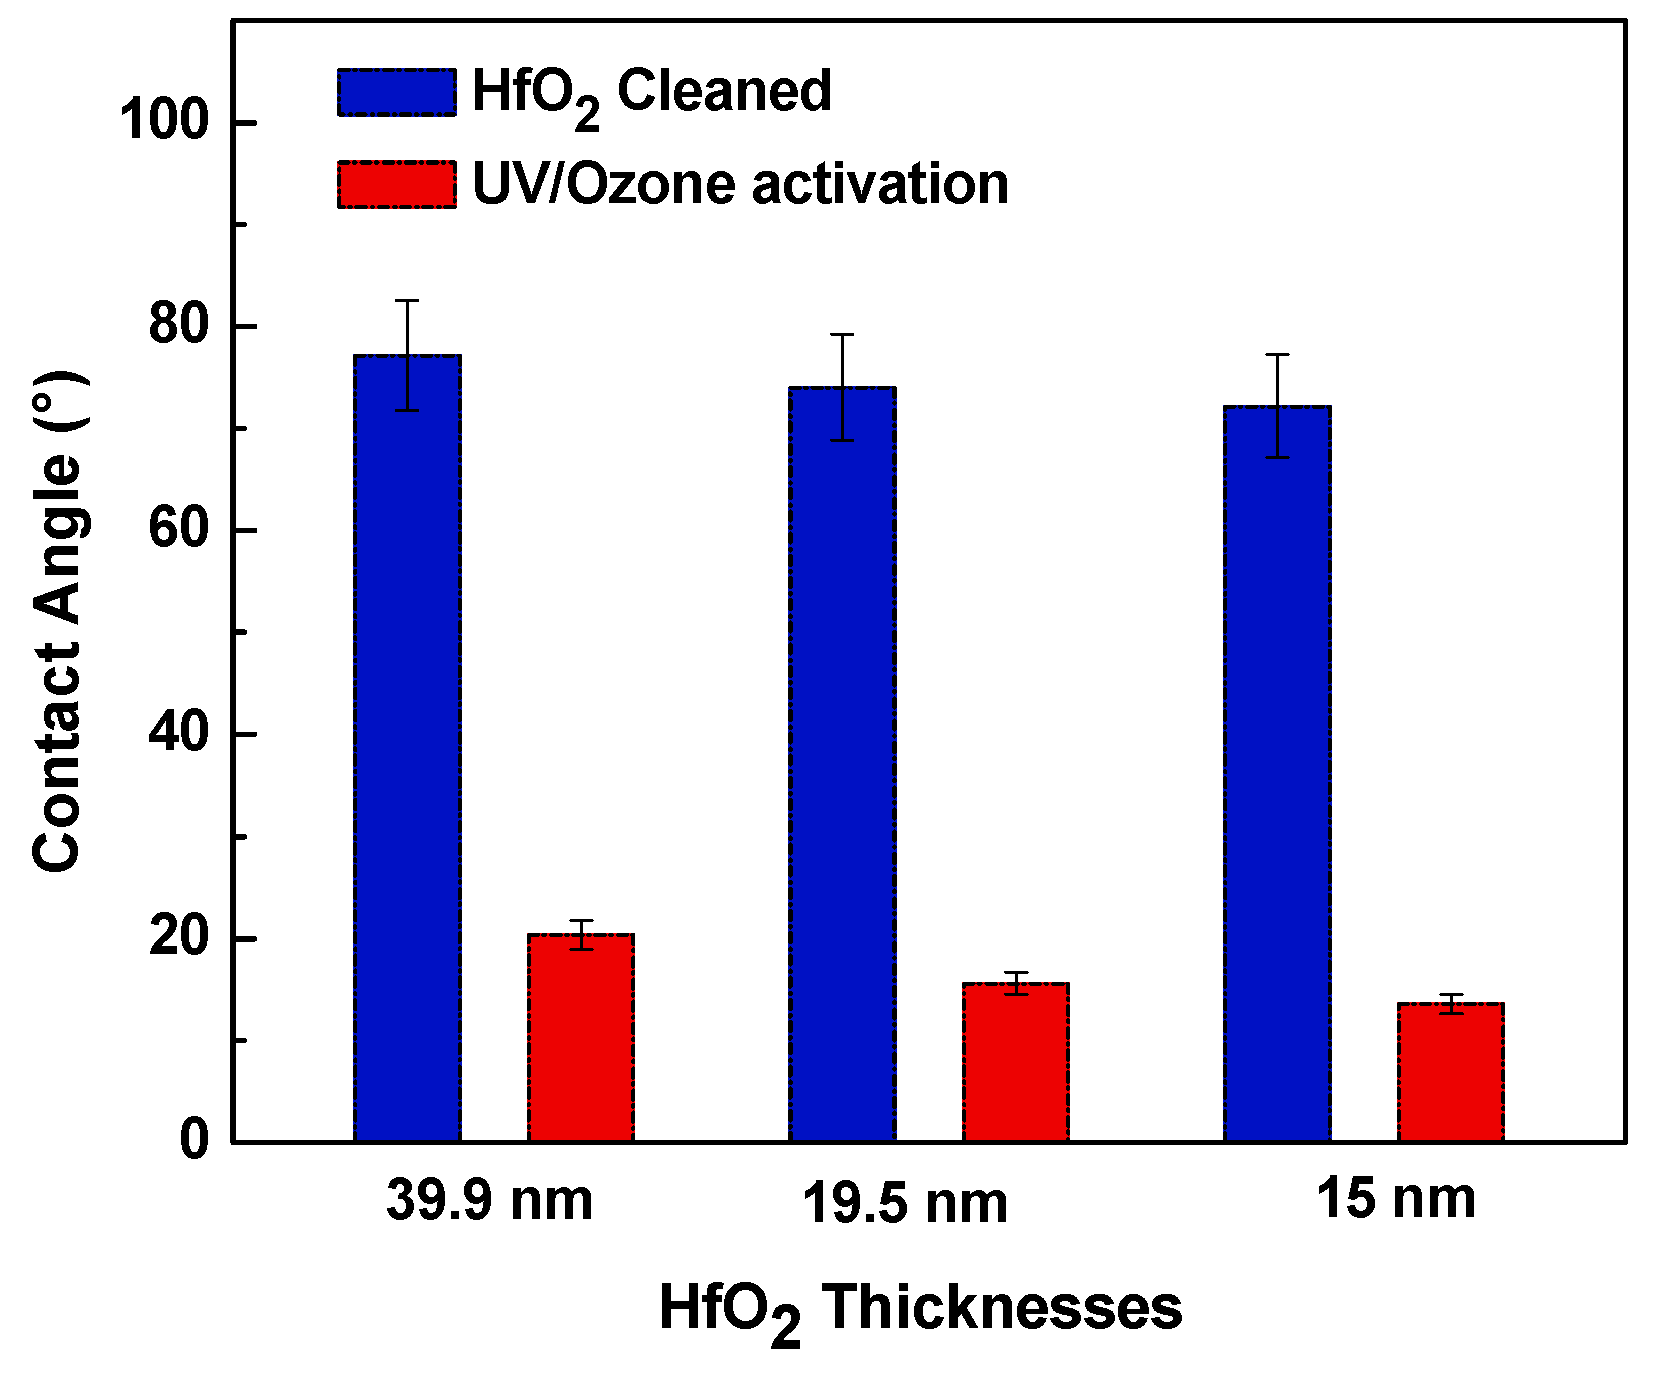
3.1. Hafnium Dioxide Surface Characterization

Wettability study was used to characterize the HfO2 surface before and after activation by measuring the water contact angle. Figure 2 shows the evolution of the water contact angle as a function of the treatments achieved on the surfaces of transducers based on HfO2. Contact angles of 77.16°, 74.06°, 72.19° ± 1° were measured, showing the slightly hydrophobic character of the HfO2 for the thicknesses of 15.0, 19.5 and 39.9 nm, respectively. After activation of HfO2 surface with UV/ozone, the contact angles were sharply decreased to 20.34°, 15.56°, 13.48° ± 1°. HfO2 became highly hydrophilic as already reported by Braik et al. [31].

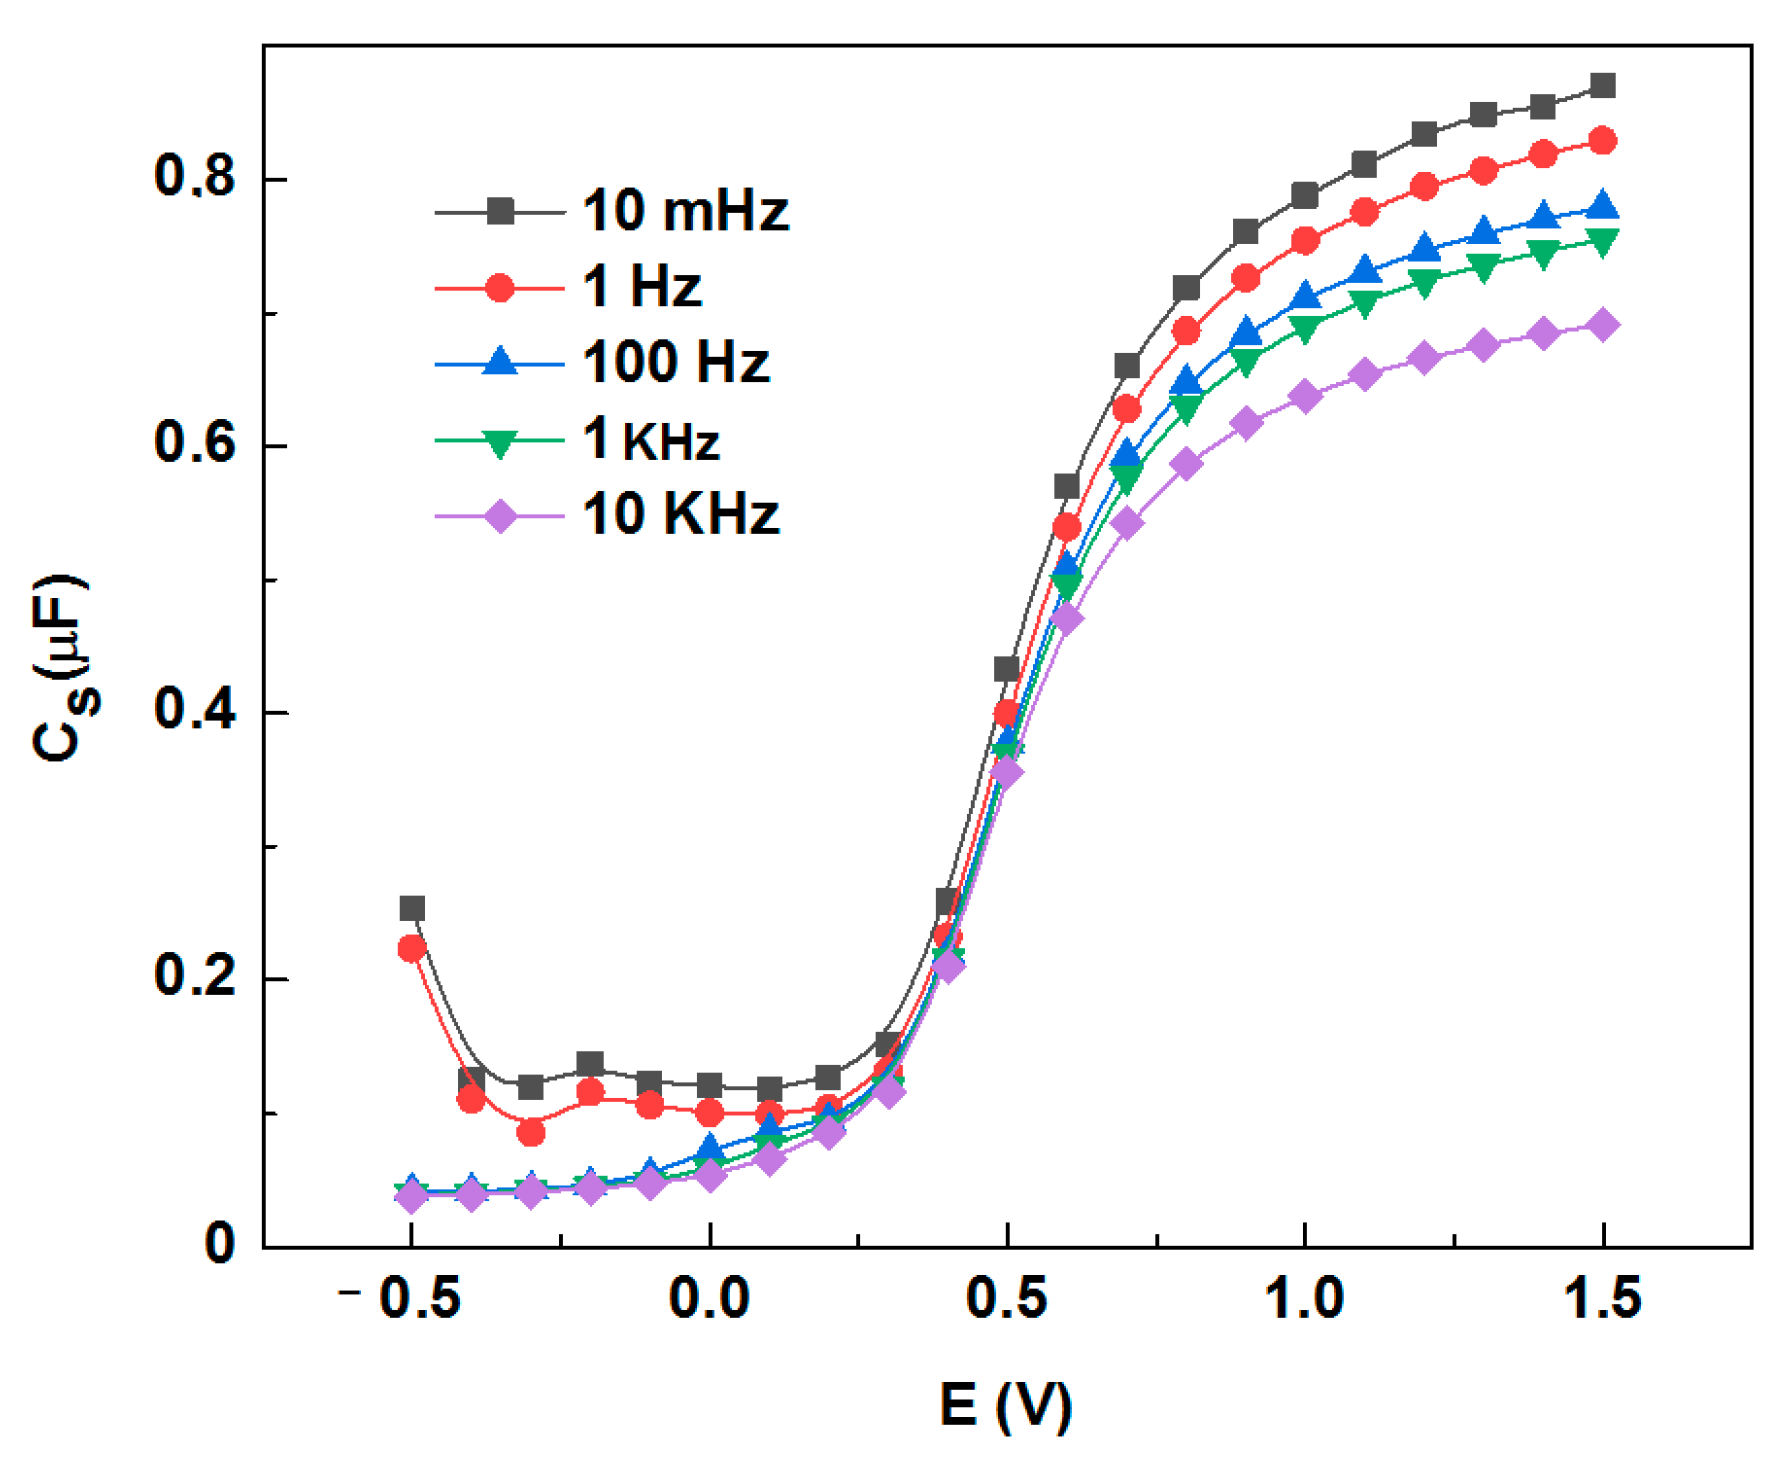
3.2. Frequency Optimization

The capacitance as a function of the potential (C(V) curves) was measured within a wide frequency range from 10 mHz to 10 kHz to characterise the frequency effect on the pH sensor. C(V) curves in Figure 3 were recorded by using the capacitive chemical sensor in a solution of 0.4 M (Mg(NO3)2) at pH 7.4 (adjusted with Tris).
C(V) analyses show a normal behaviour of the capacitance chemical sensor as recently reported in the literature [32]. However, the pH sensor shows at low frequency (10 mHz and 1 Hz) a background noise at 0.5 V. For high frequencies at 10 KHz, the pH sensor shows low capacitance at 1.5 V. The optimized frequency was 100 Hz, since it provides a good flat band and symmetric capacitance variation within the potential range of −0.5 V to 1.5 V.

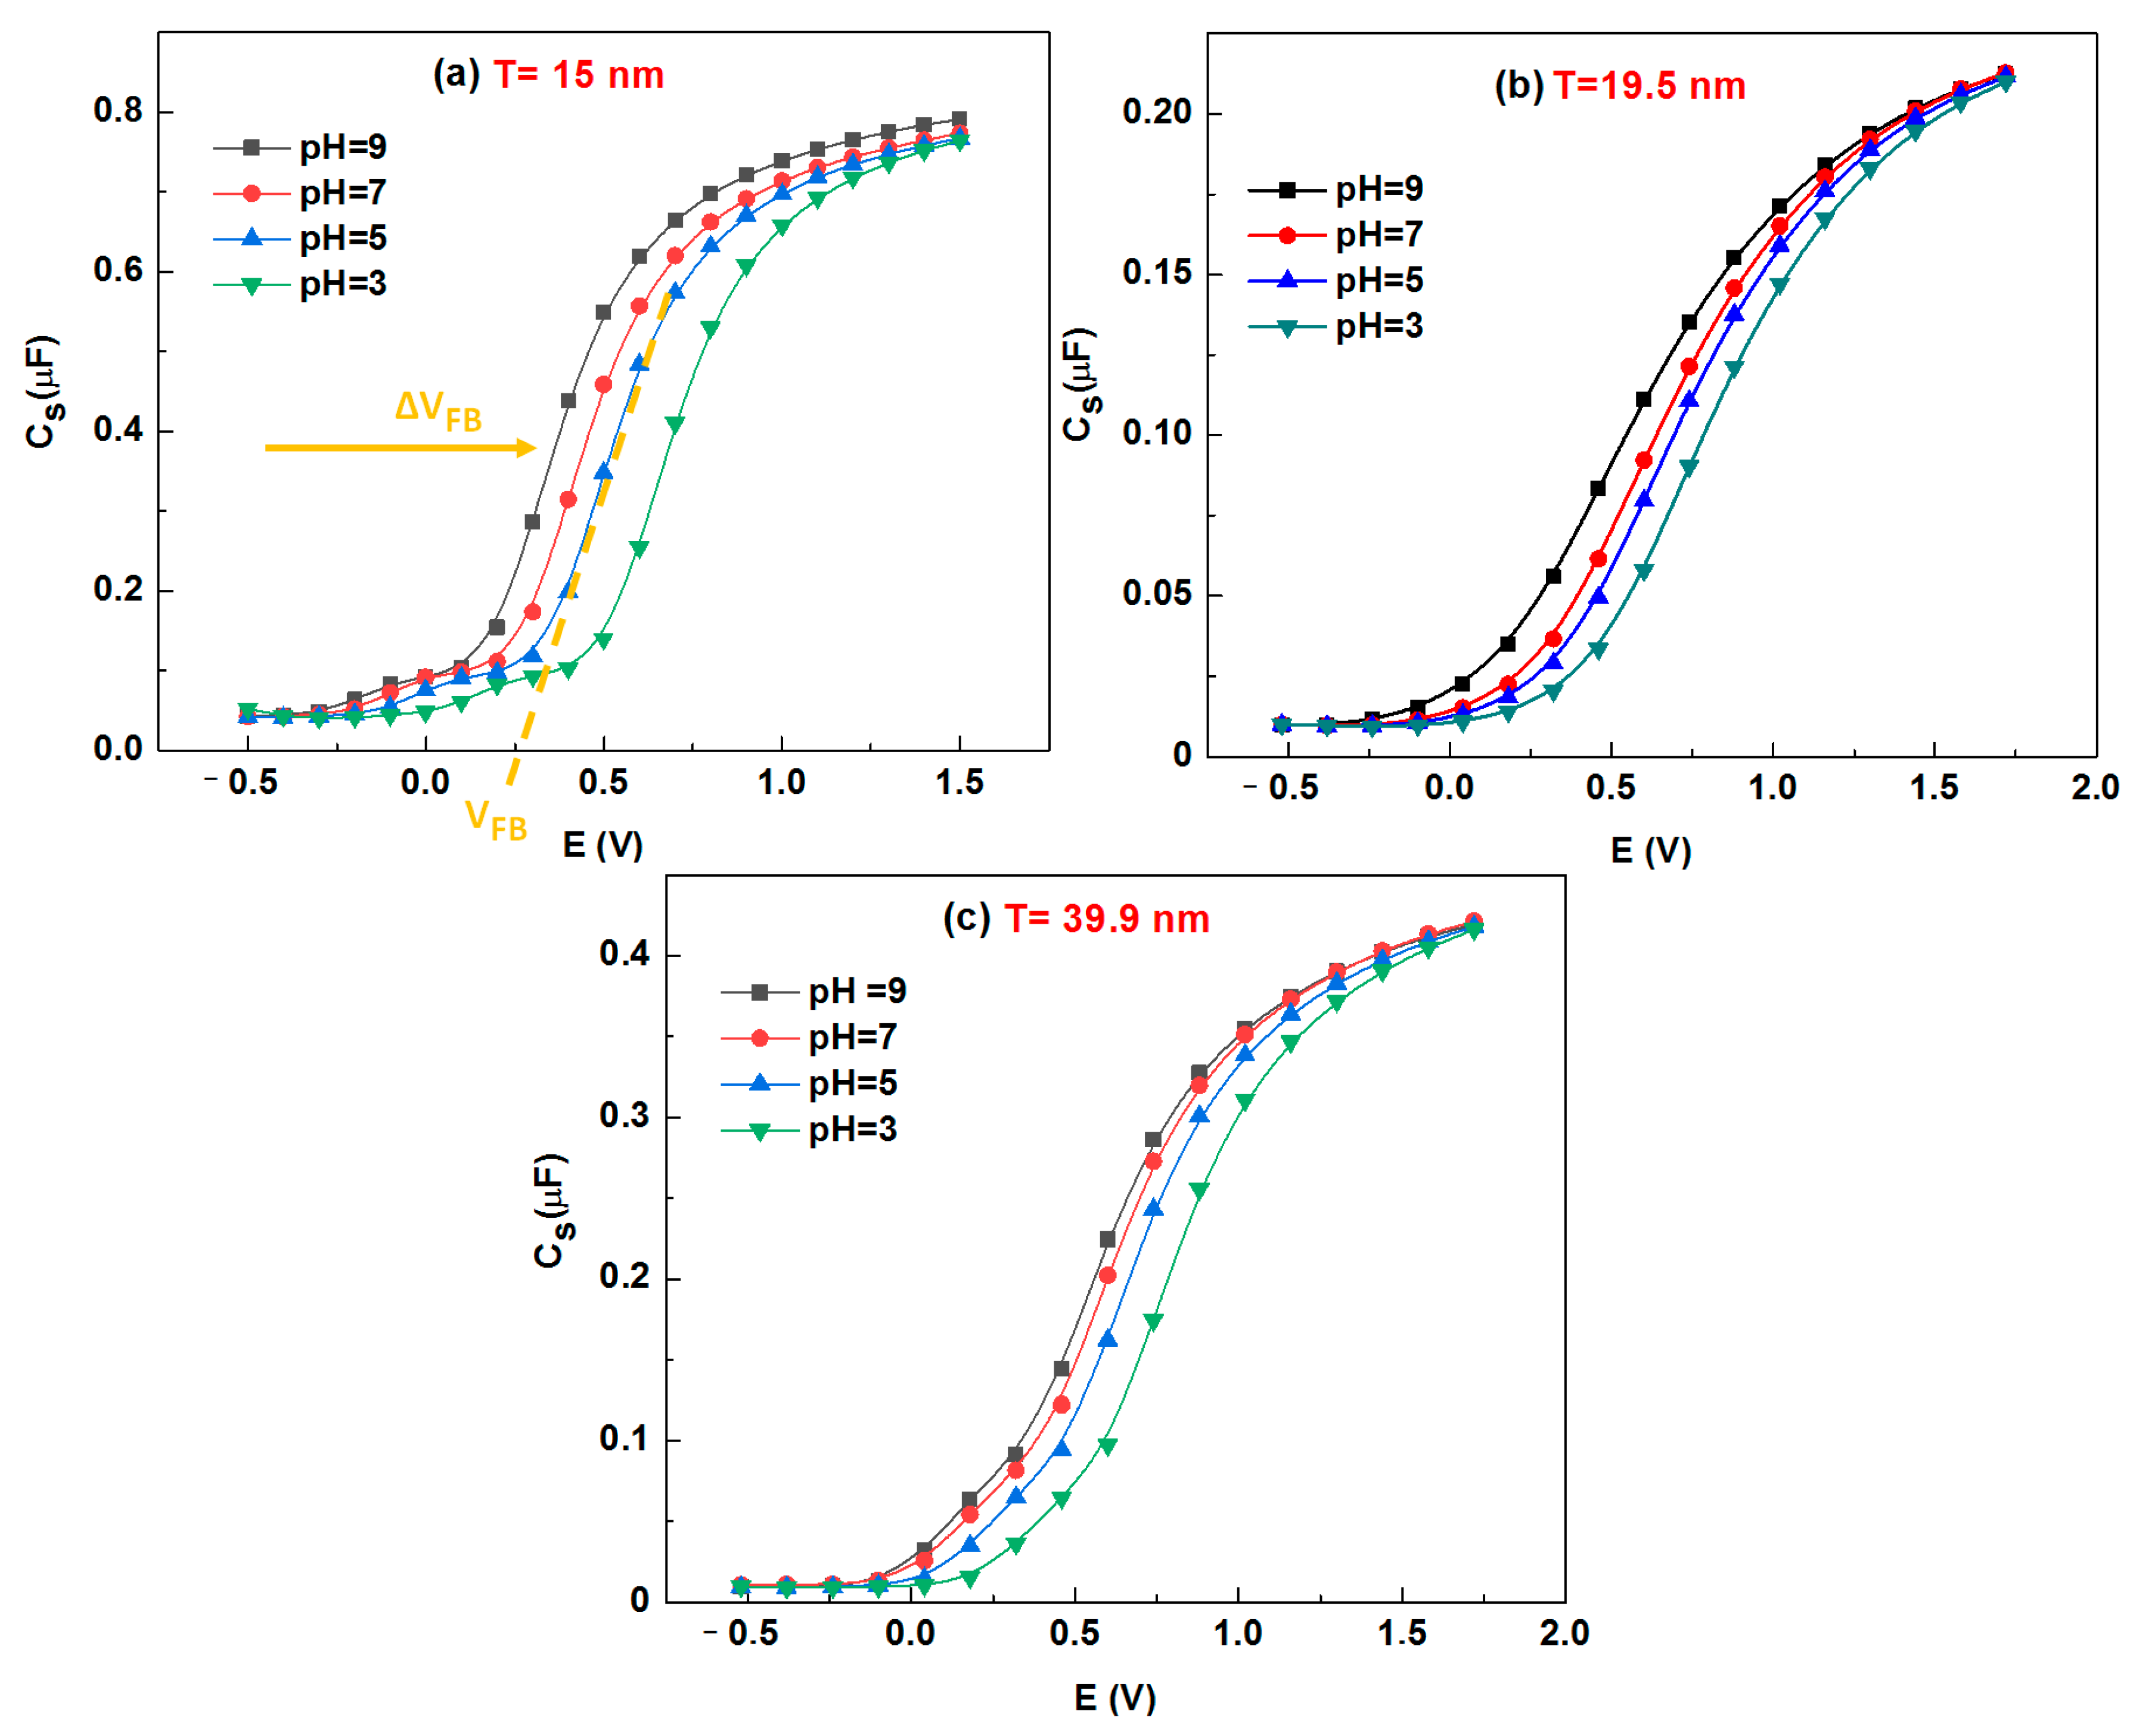
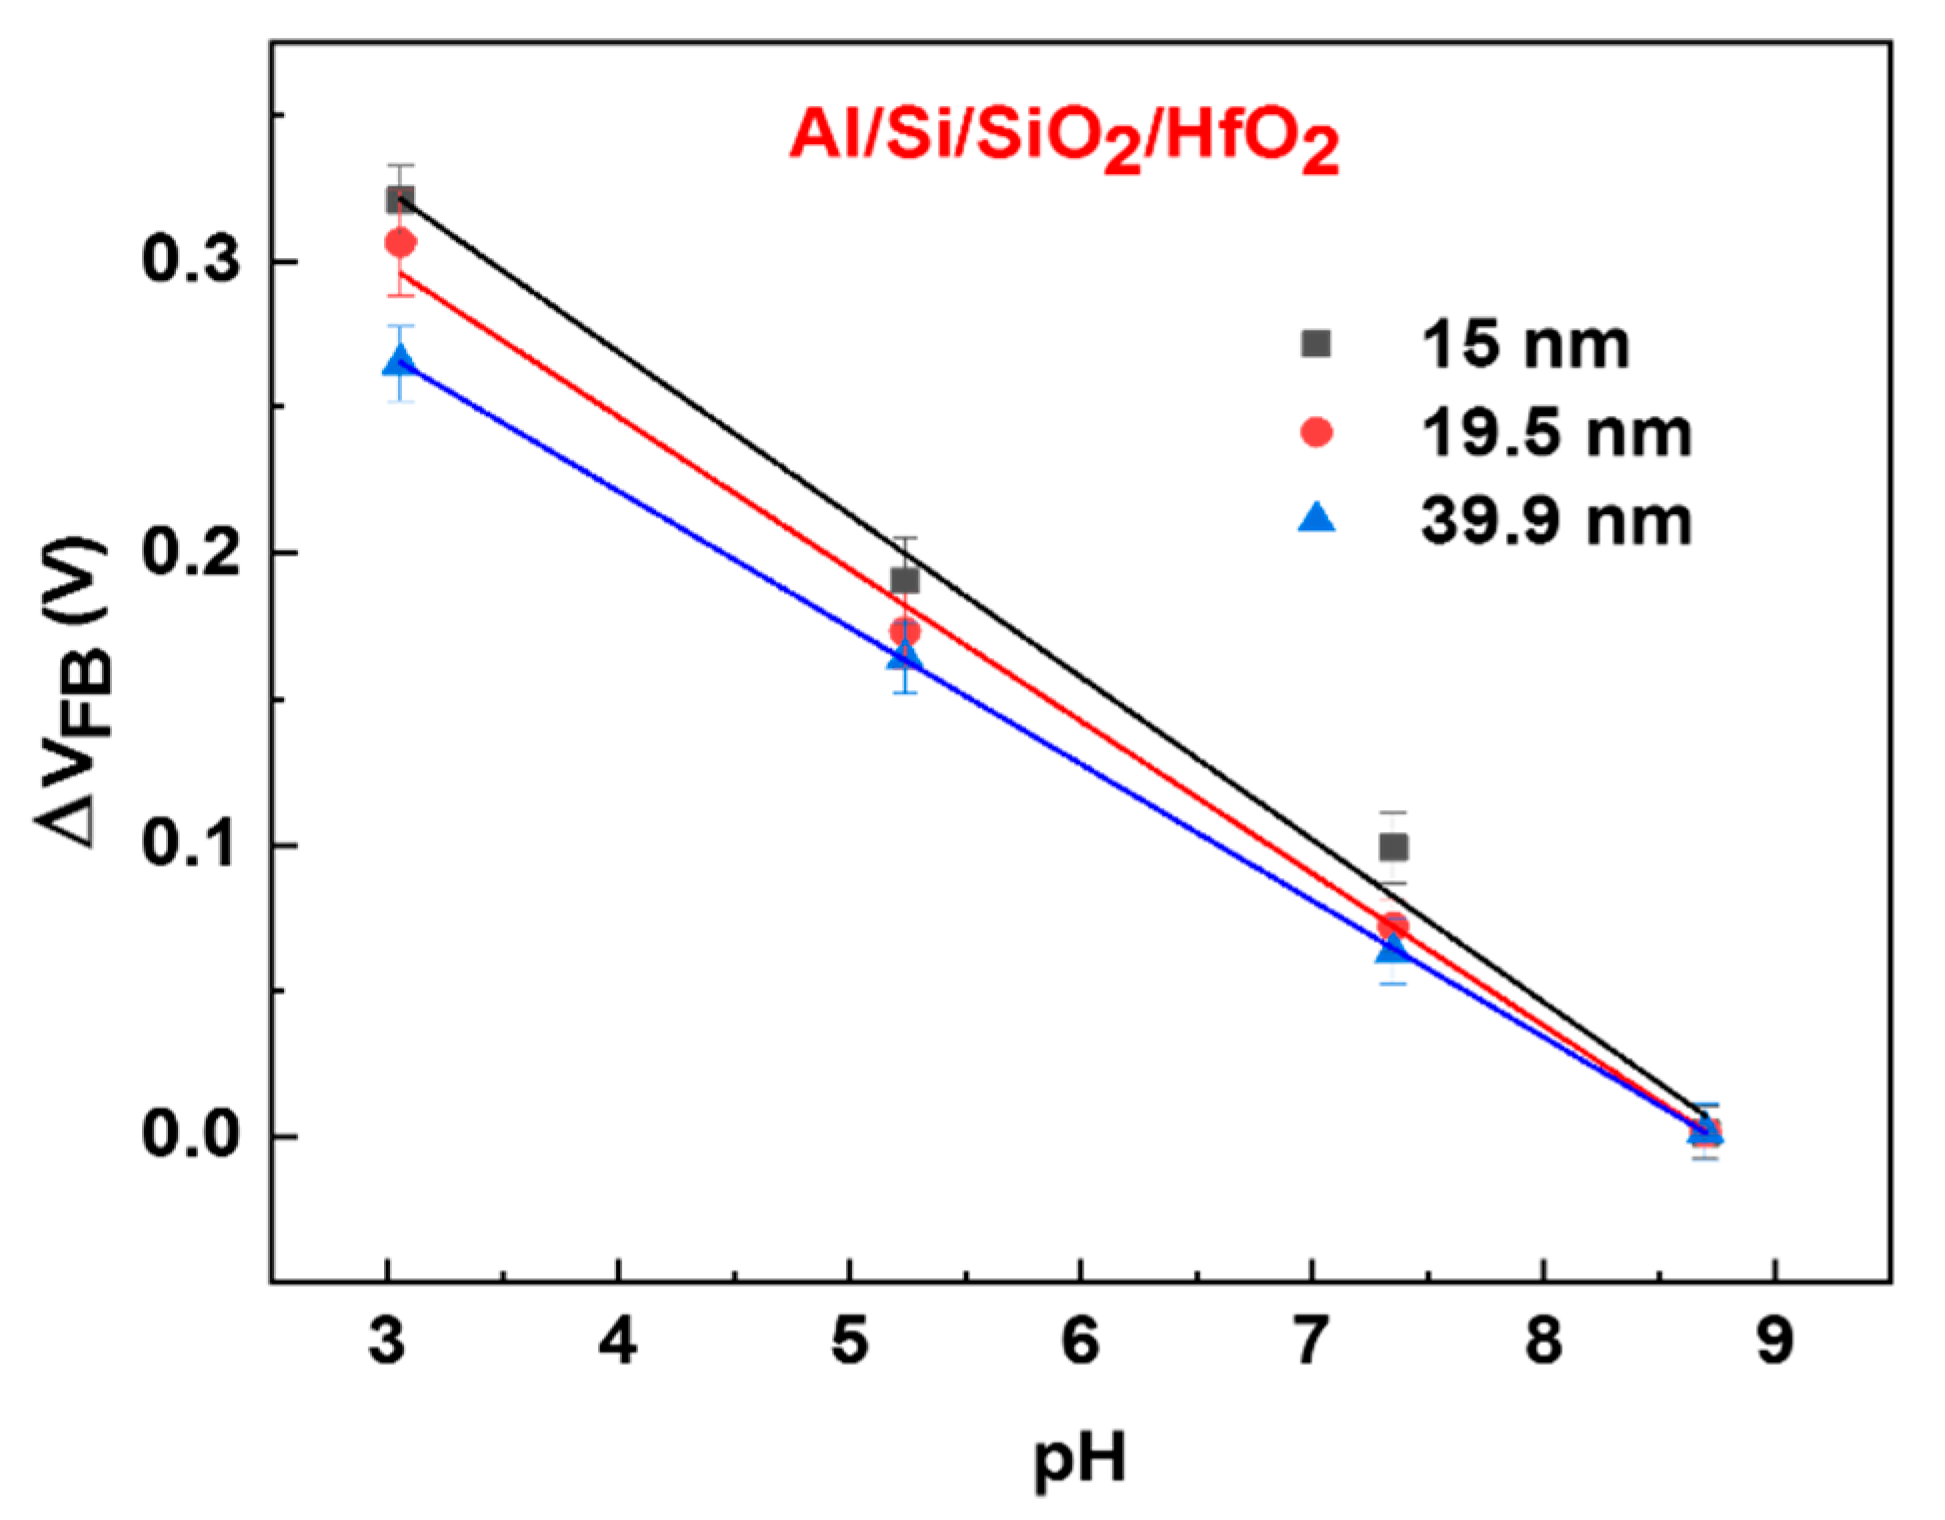
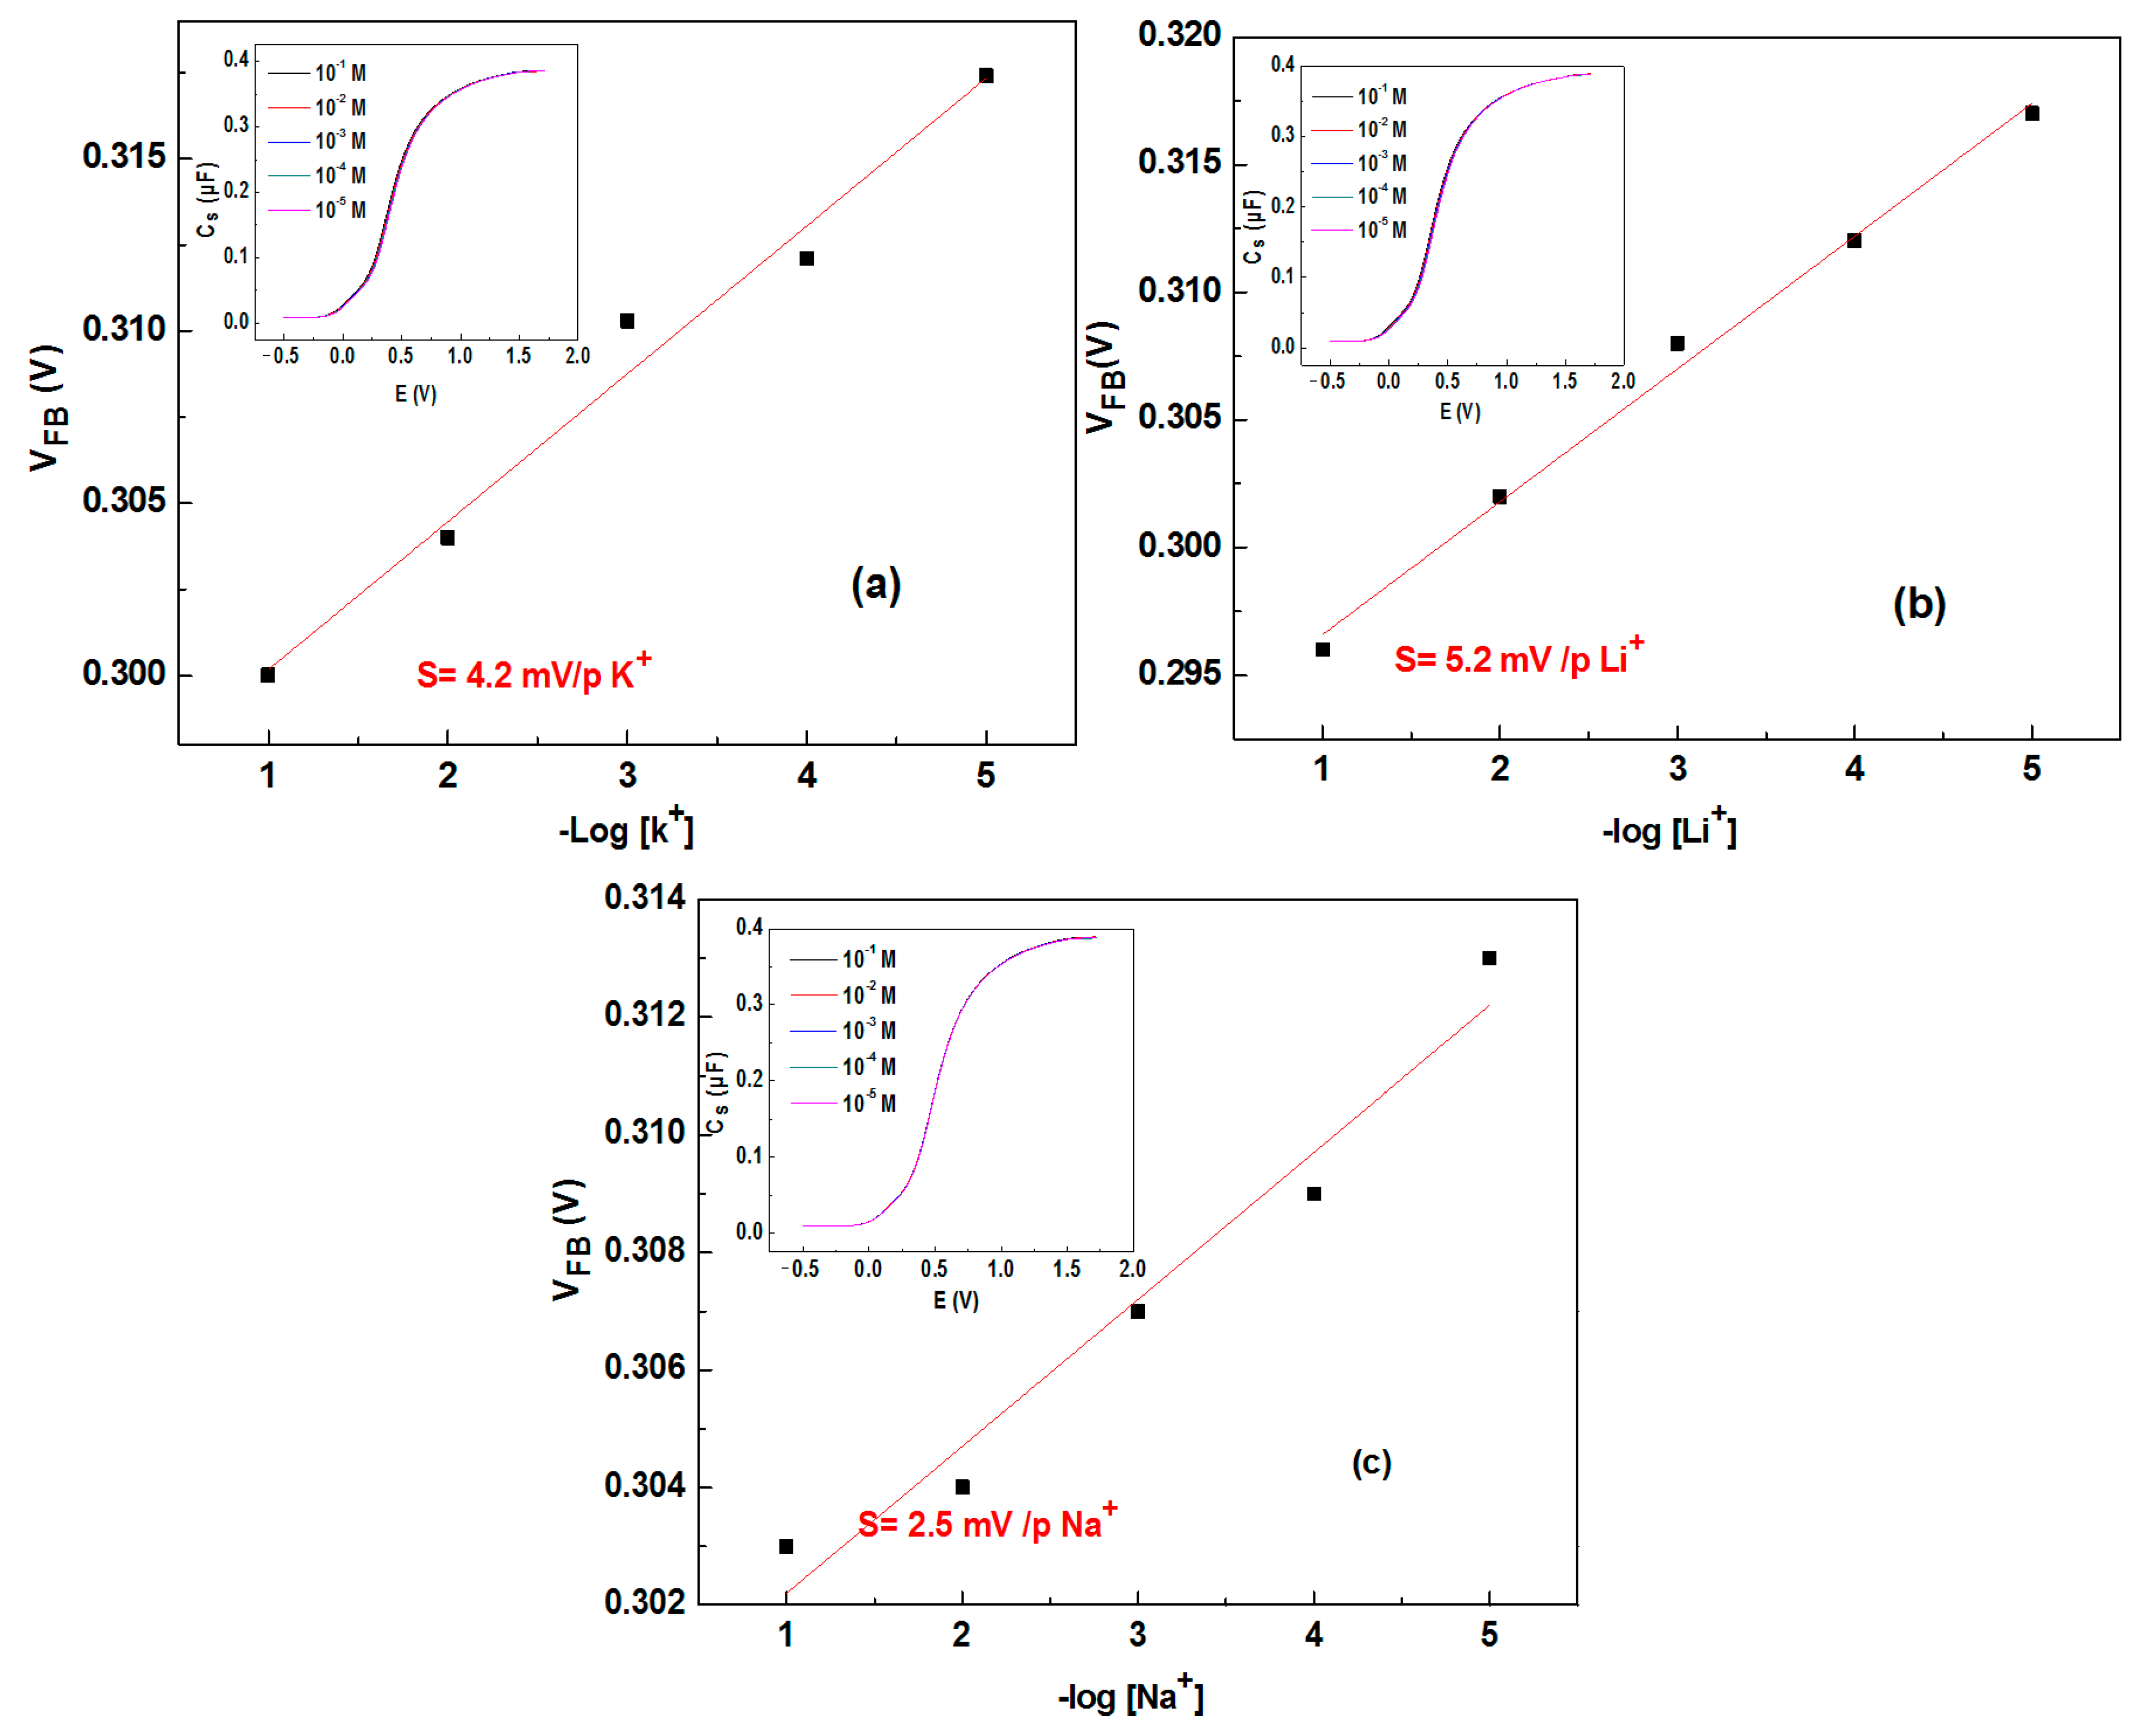
3.3. Mott–Schottky Analyses for pH Sensibility and Selectivity

The pH-sensitive sensor based on HfO2 was characterized by the Mott–Schottky technique through C(V) curves variation for the three HfO2 thicknesses (15.0, 19.5 and 39.9 nm) as shown in Figure 4. C(V) curves were recorded at 100 Hz for each thickness at pH 9, 7, 5 and 3 as shown in Figure 4. A shift was observed of the flat band of C(V) curves to positive potential ΔVFB as the concentration of hydrogen ions was increased (pH decrease) for the three thicknesses.
Therefore, the ΔVFB variation was due to the H+ ions exchange at the electrode–electrolyte interface between HfO2 surface and the conductive aqueous solution (0.4 mol·L−1 Mg (NO3)2 prepared in TRIS buffer). Due to the hydrogen ion interactions with the hafnium dioxide surface, how has specific sites that can bind hydrogen ions from the solution, this gave rise to pH-dependent surface charge density [33]. This distribution of protons (H+) on the HfO2 surface results in the formation of a dipole layer at the electrode–electrolyte interface, which affects the flat band potential VFB of the ion-sensitive capacitance sensor as a function of the pH variation.
A high sensitivity to pH as the HfO2 surface decrease (Figure 5) was observed. The values of VFB potential in solution at each thickness were extracted from the C(V) curves. The pH sensitivity (S) is defined in Equation (1).
S = Δ V FB Δ pH  
Therefore, the pH sensitivity can be calculated by linear fitting ΔVFB and the corresponding pH of the buffer solution in the pH range from 3 to 9. The corresponding values are shown in Table 1.
As previously mentioned, the sensitivity of the hafnium structures versus the pH variation increased as the thickness decreased. The highest pH sensitivity of the hafnium electrolytic-insulating-semiconductor structure of 54.5 mV/pH was observed for 15 nm HfO2 thickness. The thicker the HfO2 layer, the further the H+ proton layer is from the Al/Si/SiO2/HfO2 capacitance structure which makes the ion sensor less sensitive.
The capacitance-ion-sensitive pH sensor is more sensitive for thin layers of HfO2. However, at less than 5 nm HfO2 thickness, it is possible to have background noise and less sensitivity using C(V) analyses. This has been reported by Wang et al. [34] using thin HfO2 layers with different thicknesses (3.5, 5, 7.5 and 10 nm) deposited on p-type silicon wafers to measure the pH within the range of 2 to 12 through the capacitance-voltage C(V) measurements. By using the HfO2 film with a thickness of 10 nm, the authors found a sensitivity around 40–45 mV/pH. However, when a layer of 3.5 nm thickness was used, the C(V) curves were unstable in the acidic range (low pH) and were discussed in terms of the leakage current of the thin layer of HfO2. In the present work, we have a quasi-Nernstian pH response (54.5 mV/pH) of the pH sensor based on HfO2 with 15 nm thickness. Owing to general requirements concerning the reduction of the sensor’s size and the increase in its reliability, the thin HfO2 film is a potential candidate as a sensing layer for pH sensor applications.
The selectivity of the developed pH sensor was studied by using other potential interfering ions like K+, Li+ and Na+ prepared in 10 mM TRIS-HCl buffer pH = 7.4 (Figure 6). Indeed, we can clearly observe a negligible response of the pH sensor for the interfering ions as the flat band potential variation ΔVFB of C(V) curves was too weak (Table 2, Figure 6 Inset and Figure S1 in Supplementary Material).

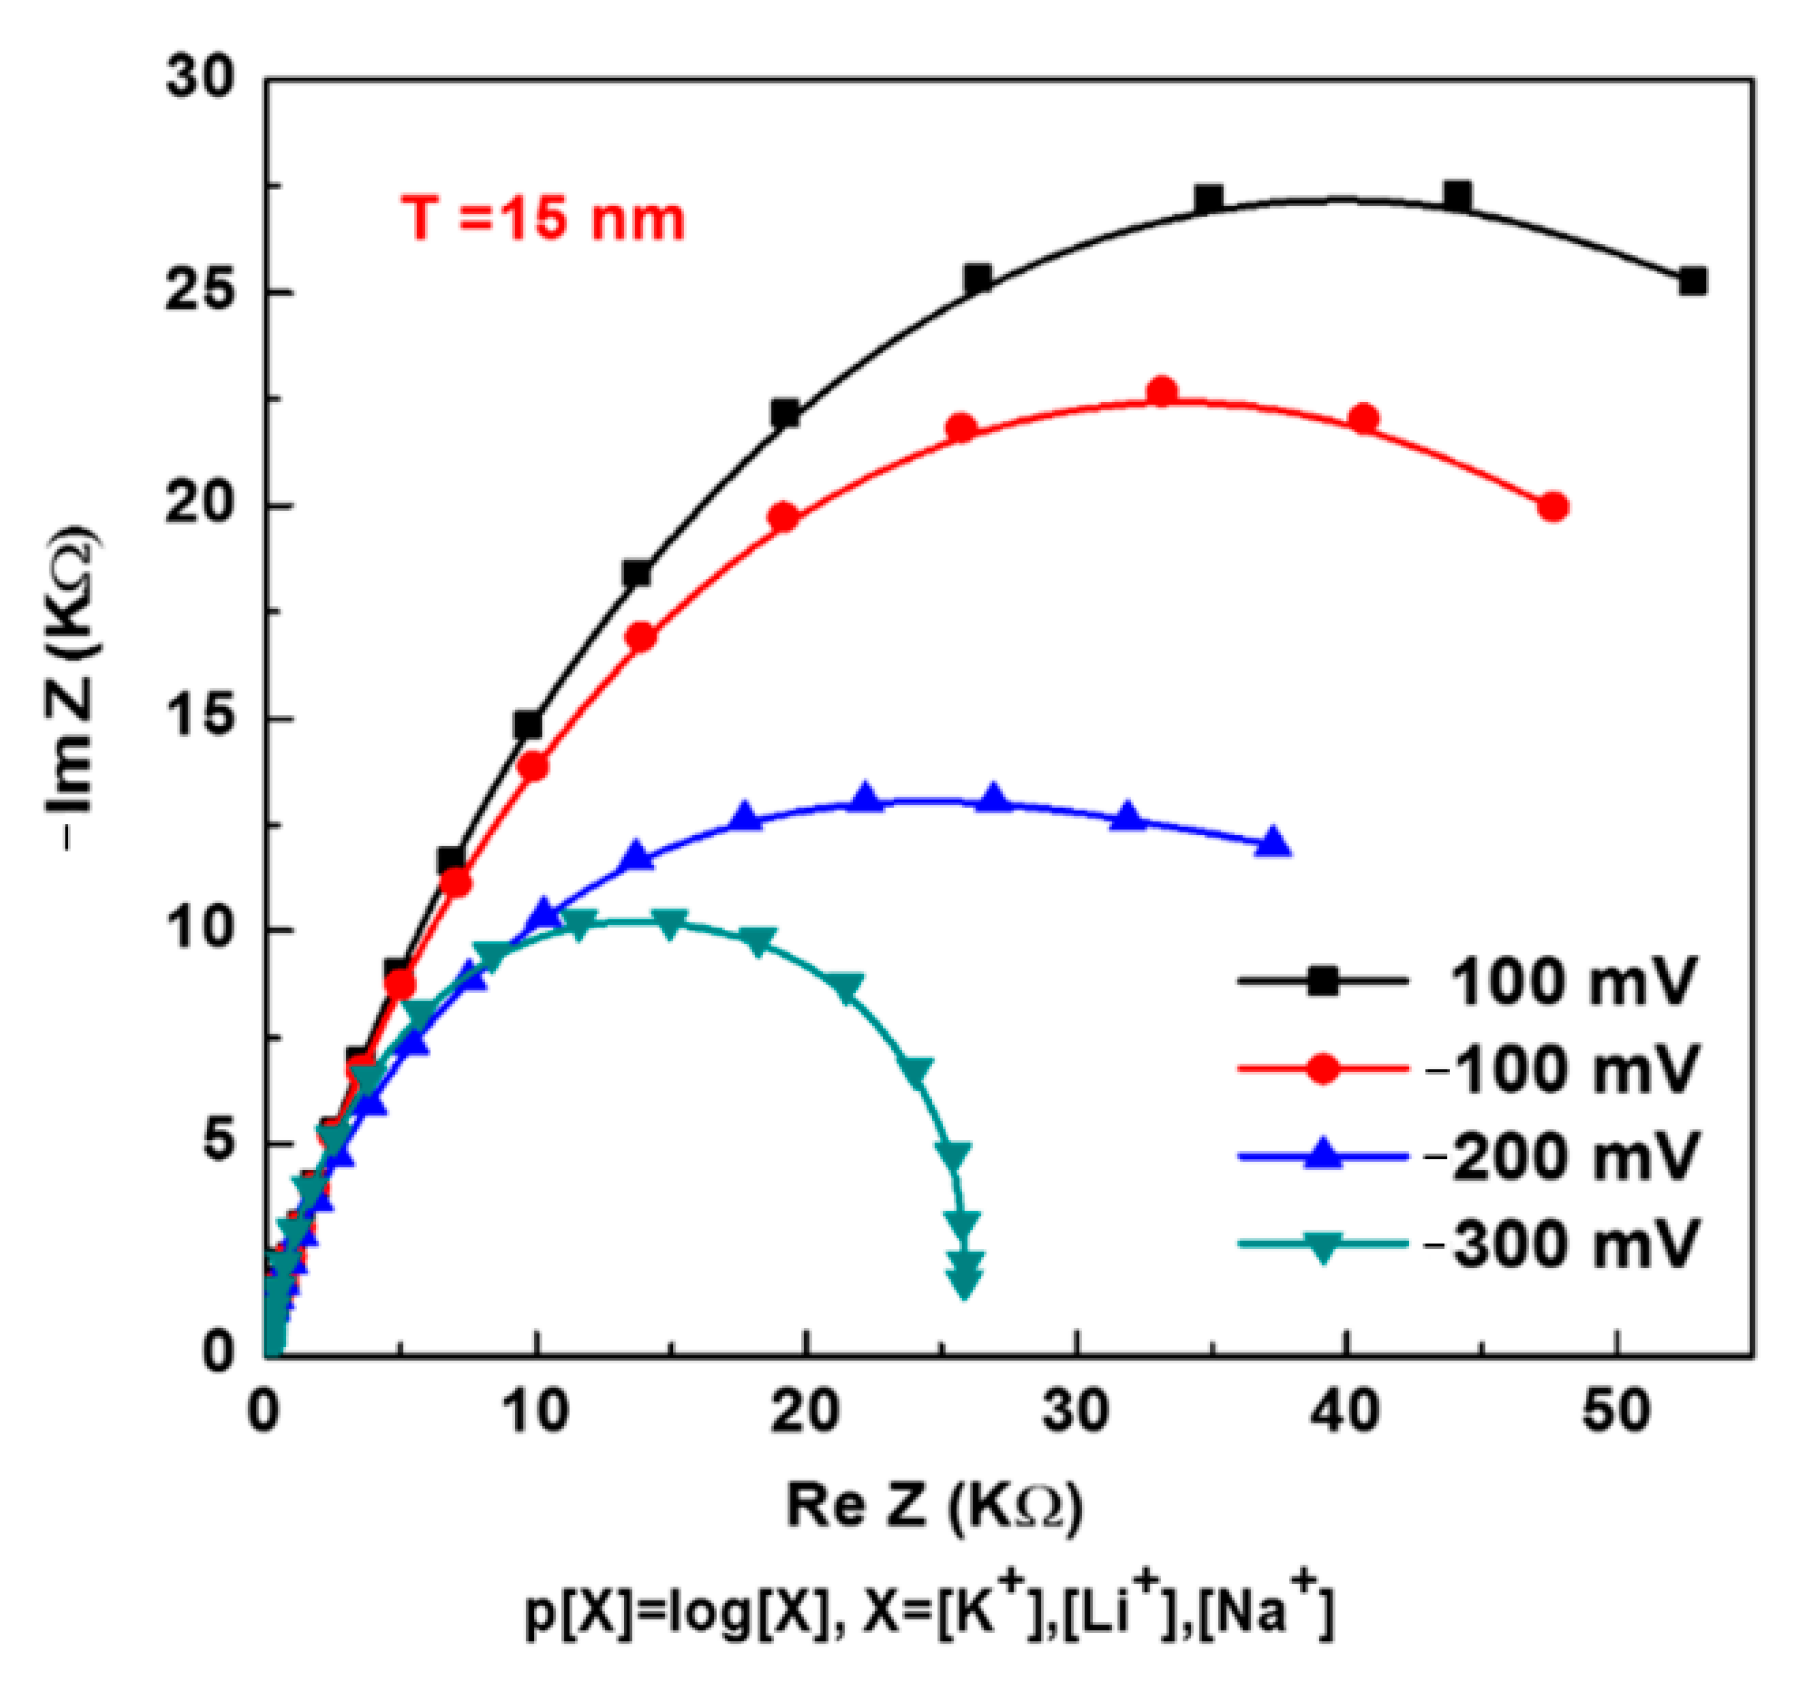
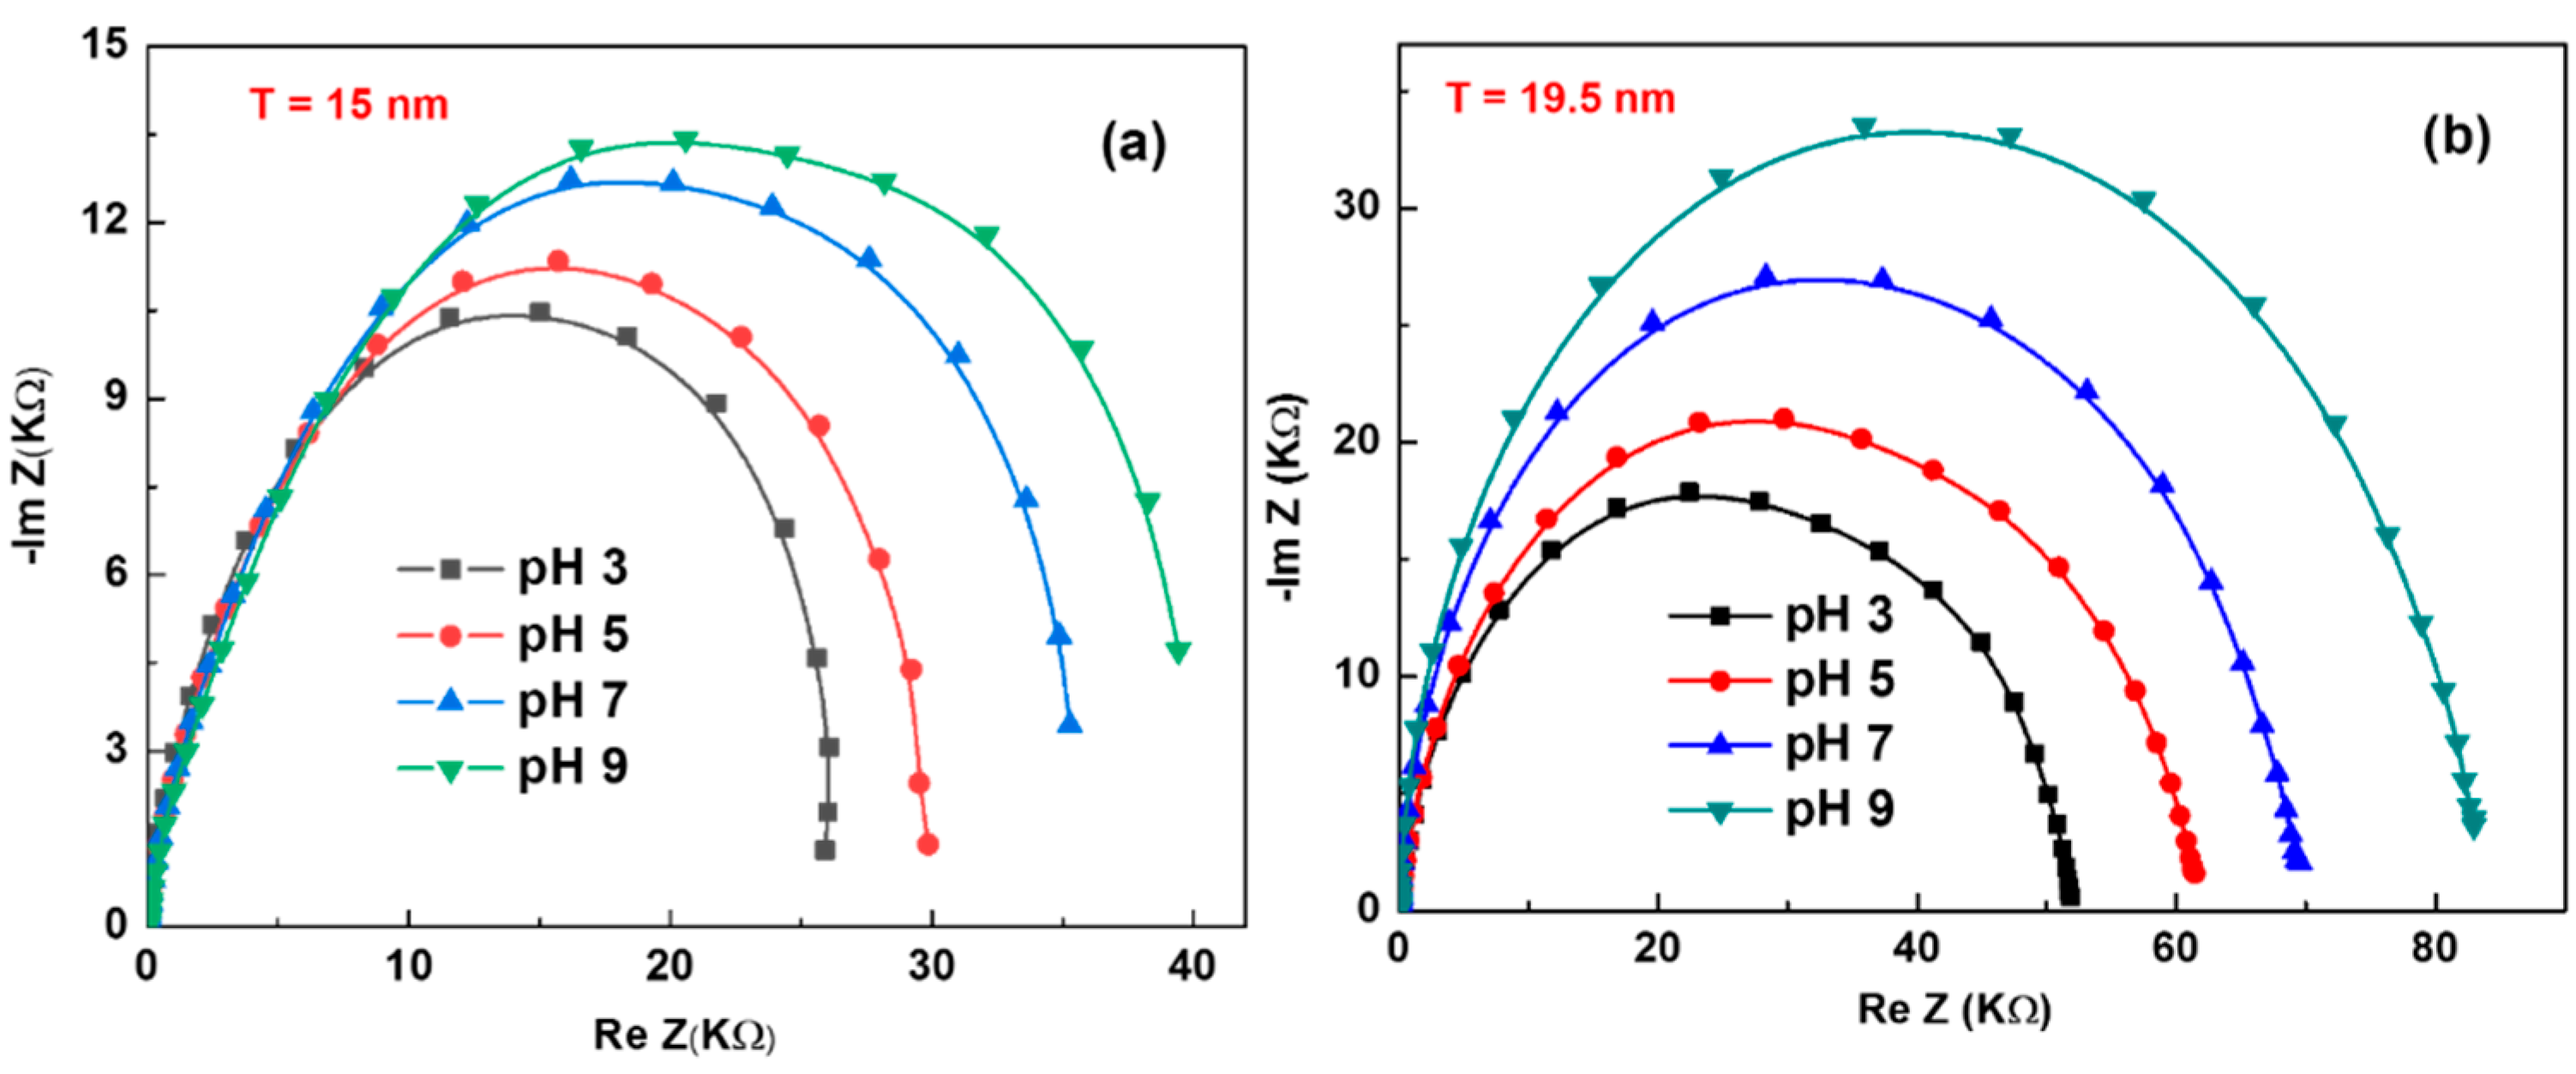
3.4. Electrochemical Impedance Spectroscopy Measurements for pH Variation

3.4.1. Electrochemical Parameter Optimization

Electrochemical impedance spectroscopy (EIS) was used to study the pH variation. The HfO2 pH sensor was used as a working electrode in a conventional three-electrode electrochemical cell to optimise the measurement conditions in terms of frequency and potential. As the EIS optimization parameter, we used the 15 nm HfO2 thickness as it gave high sensitivity in the Mott–Schottky study. At the frequency range from 0.1 Hz to 100 kHz, different potentials were applied to choose the appropriate potential to minimize the Warburg impedance result of the diffusion process (Figure 7). Under voltages +0.1, −0.1, −0.2 and −0.3 V of the hafnium working electrode versus the SCE reference electrode, the total impedance decreased sharply under negative polarization as a result of a decrease in the Warburg impedance.
The optimum conditions selected for further measurements were 100 mHz to 100 kHz frequency range, AC amplitude voltage of 25 mV, and DC amplitude voltage of –300 mV. These parameters were also applied to the other HfO2 thicknesses of 19.5 and 39.9 nm.

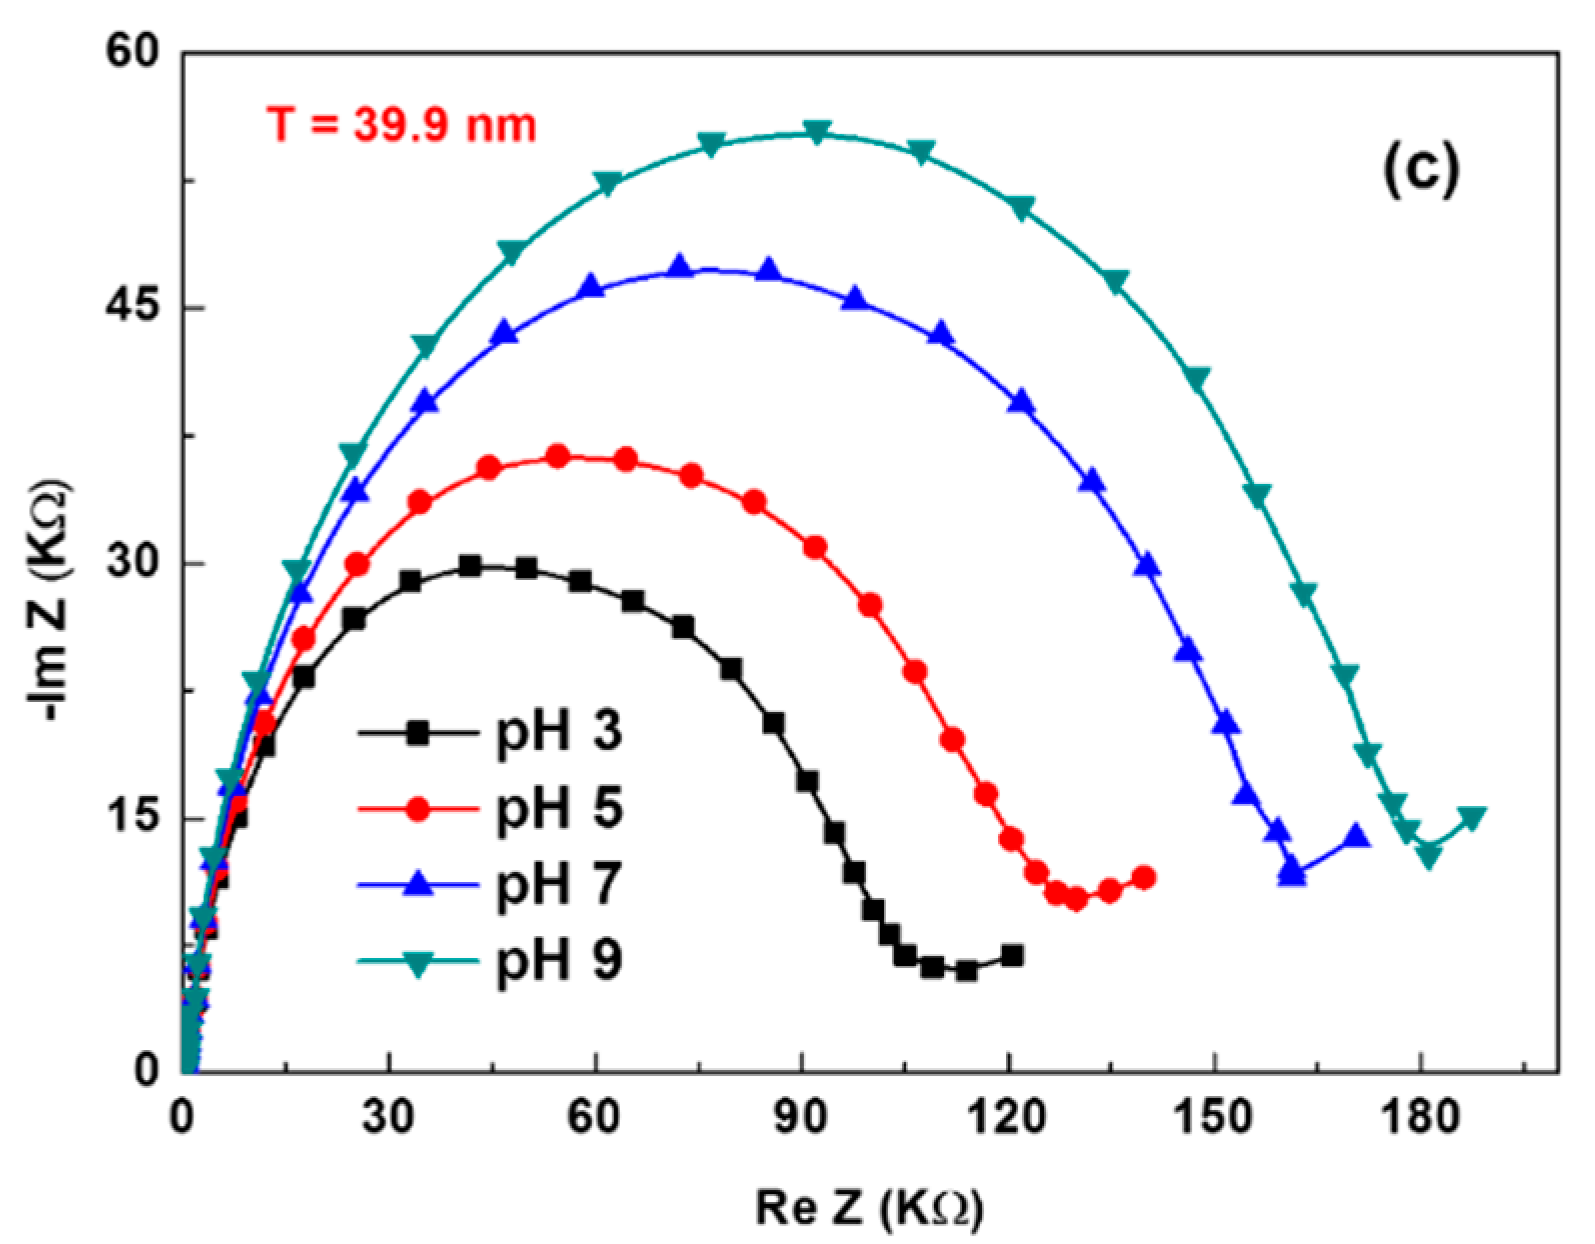
3.4.2. Impedance Analysis of the pH Sensor

As we mentioned previously, HfO2 have specific sites that can bind hydrogen ions from the solution. The interactions of hydrogen ions with the HfO2 surface create a distribution of H+ protons on the HfO2 surface results in the formation of a dipole layer at the electrode–electrolyte interface. For EIS measurements, the electron charge transfer resistance (Rtc) at this interface increases or decreases depending on how these ions are charged. Figure 8 illustrates Nyquist plots of the electrochemical impedance response of the HfO2 pH sensor at different H+ concentrations (different pH).
We can clearly observe that at a low frequency, the impedance of the electrochemical system increases significantly with increasing pH value (decrease in H+ ion concentrations). This variation is attributed to the increased charge transfer resistance Rtc at the hafnium/electrolyte interface. Therefore, the high H+ concentration favours the electron transfer charge, which generates a low impedance. In the same context, Michael Lee et al. demonstrated a high clear shift of the Rtc as a function of pH variation using an HfO2 ion-sensitive sensor. This response was due to the change in either the dielectric or the conductive properties on the metal oxide surface [35].
The electrode–electrolyte interface can be modelled from an impedimetric point of view by the equivalent Randles circuit [36]. In this model, generally, the Rs represents the resistance of the electrolyte solution in series with the parallel combination of the double-layer capacitance CPE (constant phase element) and the charge transfer resistance Rtc in series with the Warburg impedance Zω. (Figure 9 Inset). This equivalent electrical circuit was used for fitting analyses to extract the Rtc variation of Nyquist plot semicircles of each pH. Fitting parameters are summarized in Tables S1–S3 in supplementary data for each HfO2 thicknesses.
The variation of the normalized ∆Rtc as a function of the hydrogen concentrations is presented in Figure 9 for different HfO2 thicknesses. A linear relationship was observed in the pH range from 3 to 9. The corresponding sensitivities are 5.86 pH−1, 10.63 pH−1 and 12.72 pH−1 for 15.0 nm, 19.5 nm and 39.9 nm, respectively.
Unlike the Mott–Schottky mode, the EIS measurement shows that 39.9 thickness was highly sensitive to H+ protons when compared to 15 nm for C(V) measurement. This difference is surely due to the difference of the electrochemical parameters, which makes the HfO2 react differently with each technique.

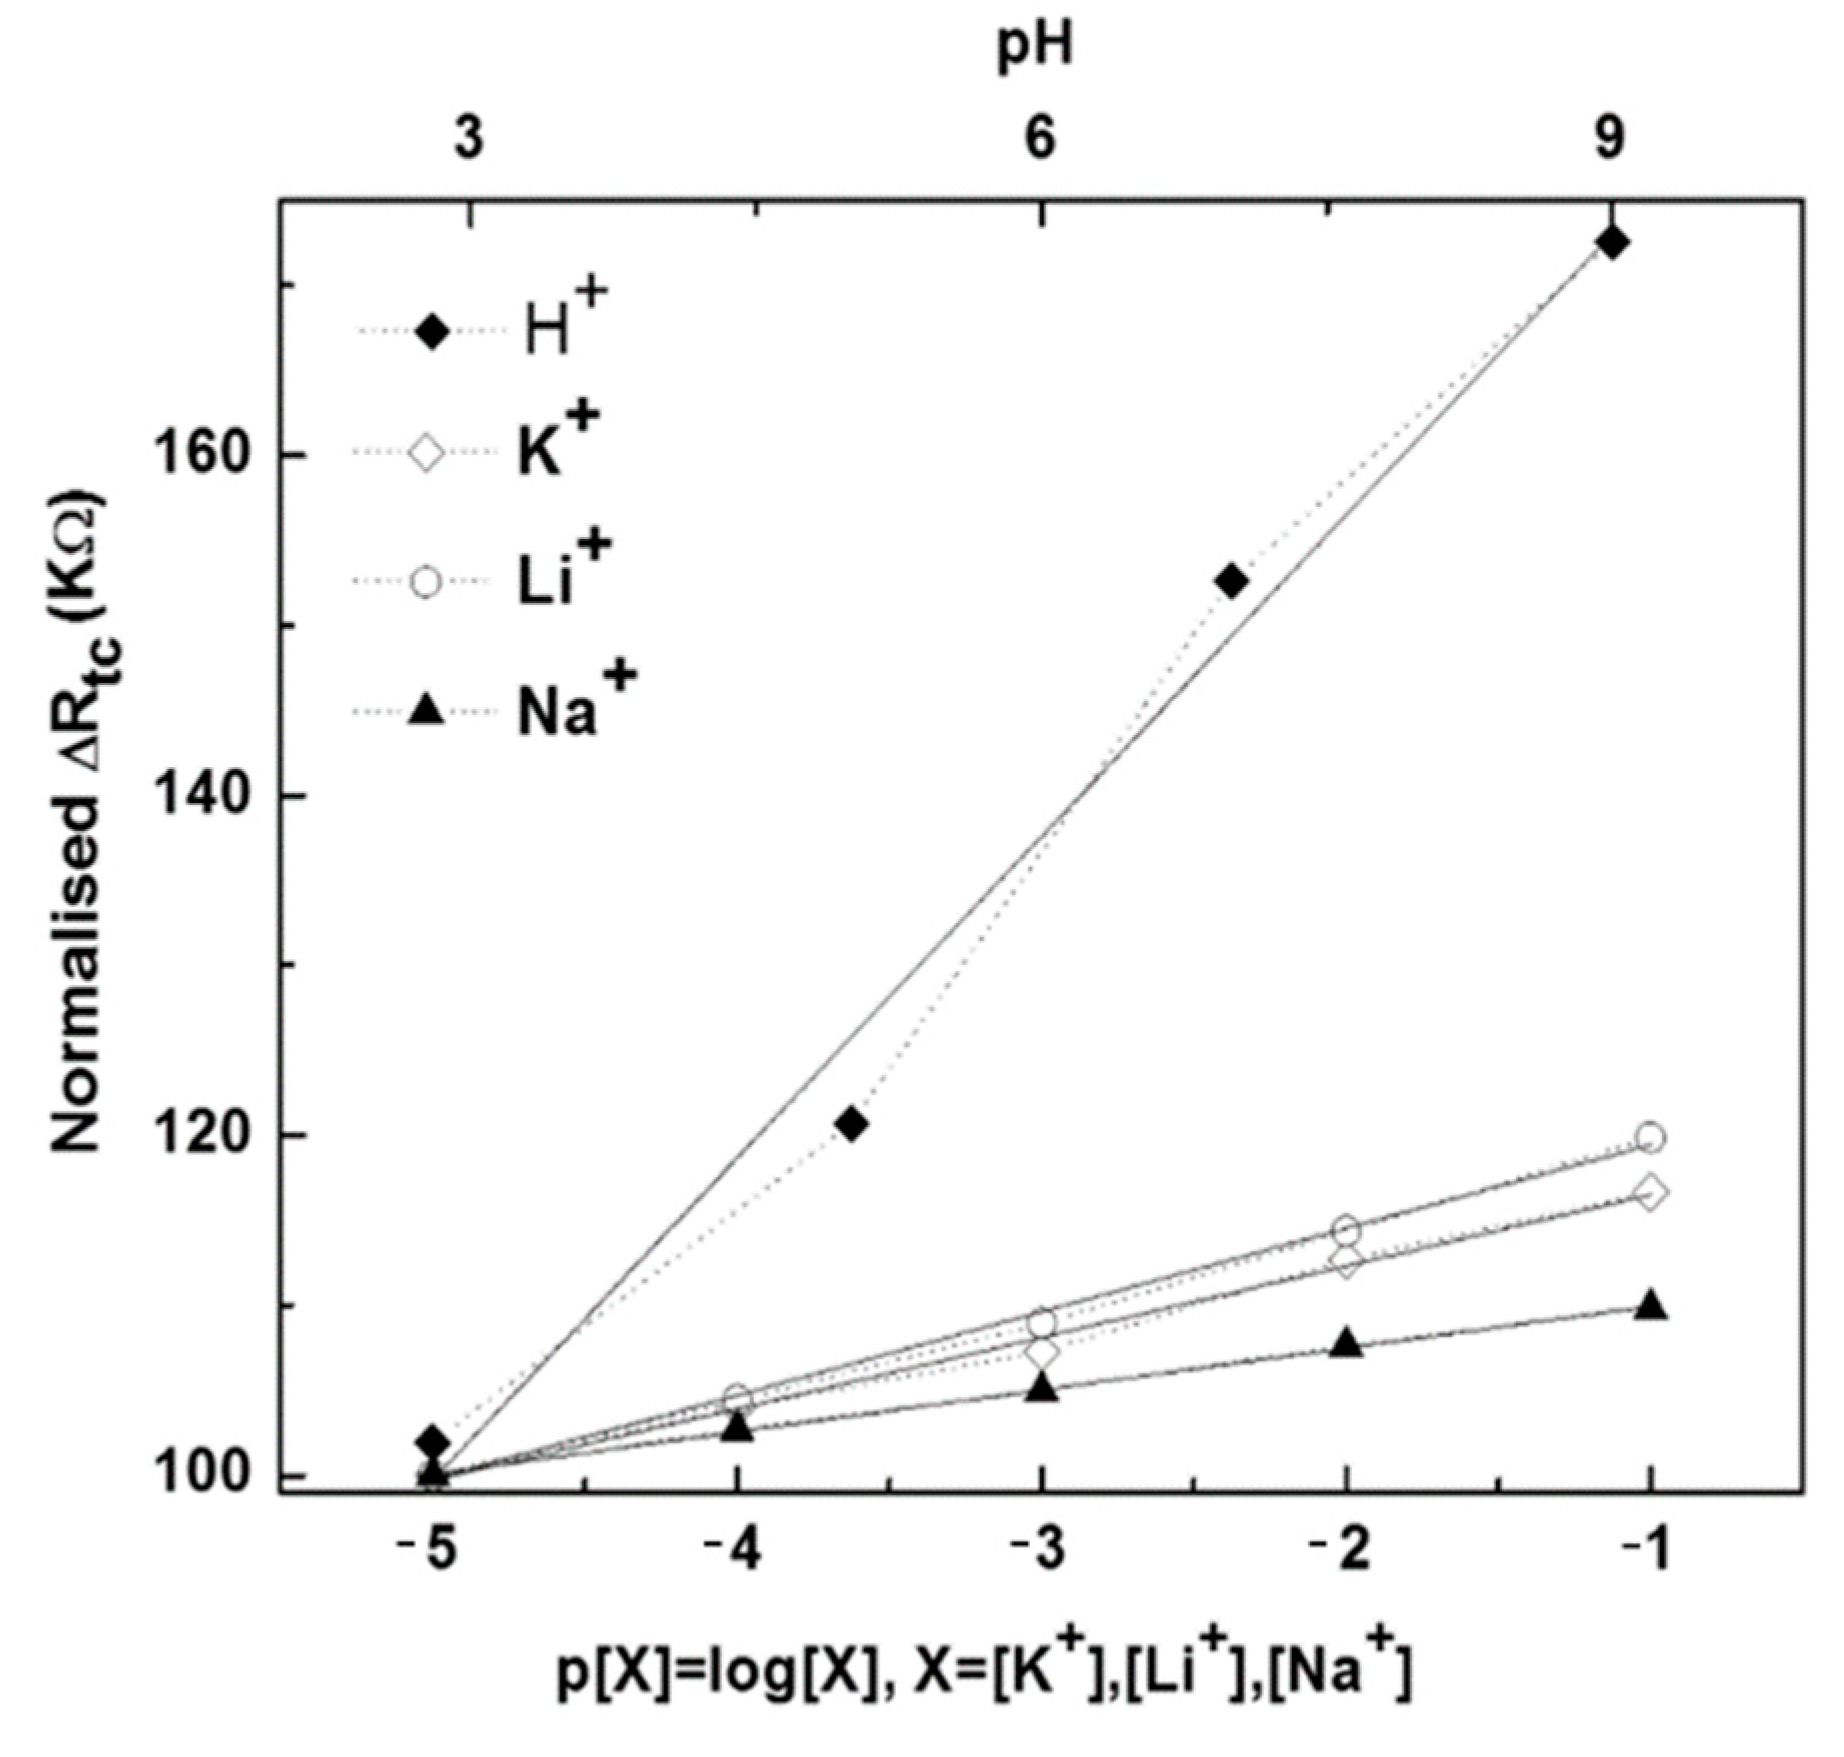
3.4.3. The Selectivity of the Electrolyte Insulator Semiconductor Structure

In order to confirm the sensitivity of HfO2 toward H+ protons, other interferences for the quantitative determination of pH on the hafnium electrode (39.9 nm) were investigated using the same EIS measurements. The response of HfO2 with potassium, perchlorate and nitrate ions within the range between 10−5 to 10−1 M prepared in TRIS-HCl Buffer [37] was investigated, and no significant changes of impedance spectroscopy spectra were found (Figure S2 in supplementary materials).
The same Randles equivalent circuit (Figure 9 Inset) was used to fit EIS analyses of the interferences in order to extract Rtc variation. As can be observed in Figure 10, the pH sensor based on Al/Si/SiO2/HfO2 structures (thickness 39.9 nm) was highly sensitive to H+ protons with a sensitivity of 12.72 p[H+] when compared to the other interferences, which were found at 1.76 p[K−1], 2.32 p[Li−1] and 1.52 p[Na−1].

4. Conclusions

In this work, we have studied the ability of the HfO2 non-functionalised transducer to detect the pH variation based on capacitive and impedimetric measurements. Furthermore, the effect of the thickness of the hafnium dioxide on the pH sensing properties was demonstrated. Both techniques EIS and Mott–Schottky for all thicknesses present a good sensitivity and selectivity against the interfering ions. Due to the uniform, smooth, conformal film deposition using ALD, the thickness of the HfO2 film can be reduced to 15 nm with good pH sensitivity (54.5 mV/pH) using Mott-Schottky, whilst for the EIS measurements, the HfO2 showed better sensitivity for 39.9 thickness.

Supplementary Materials

The following are available online at https://0-www-mdpi-com.brum.beds.ac.uk/2227-9040/9/1/13/s1, Figure S1: Typical C(V) for capacitance measurements of Si/SiO2/HfO2 structure 15 nm using interfering ions (a) K+, (b) Li+, and (c) Na+ with concentrations from 10–5 M to 10–1 M. The flat band potential VFB variation was too weak when compared with Figure 1a, Figure S2: The impedimetric response of Si/SiO2/HfO2 structure (thickness 15 nm), versus (a) K+, (b) Li+, and (c) Na+ concentrations from 10–5 M to 10–1 M, Table S1: Fitting data for HfO2 sensing substrate with a thickness of 15.0 nm for pH response, Table S2: Fitting data for HfO2 sensing substrate with a thickness of 19.5 nm for pH response, Table S3: Fitting data for HfO2 sensing substrate with a thickness of 39.9 nm for pH response.

Author Contributions

A.E. (Abdelhamid Errachid), N.J.-R., A.E. (Abdelhamid Elaissari) and N.U.B. conceived and planned the experiments. M.B.A. and A.E. (Abdelhamid Errachid) supervised the findings of this work. Z.F. and A.B. carried out the experiments. M.Z. and J.B. contributed to the capacitance transducer fabrication and preparation. Z.F., N.Z. and A.E. (Abdelhamid Errachid) contributed to the interpretation of the results. Z.F. took the lead in writing the manuscript. A.B. and A.E. (Abdelhamid Errachid) supervised Z.F. for the manuscript writing. All authors provided critical feedback and helped shape the research, analysis and manuscript. All authors have read and agreed to the published version of the manuscript.

Funding

Funding through the European Union’s Horizon 2020 research and innovation program entitled “An integrated POC solution for non-invasive diagnosis and therapy monitoring of Heart Failure patients, KardiaTool” under grant agreement No 768686. This work has made use of the Spanish ICTS Network MICRONANOFABS partially supported by MCIU.

Institutional Review Board Statement

Not applicable.

Informed Consent Statement

Not applicable.

Data Availability Statement

Raw data is available from the corresponding author.

Conflicts of Interest

We, the undersigned, Abdelhamid Errachid, Head of Department Micro and Nano BioTechnology at Institut des Sciences Analytiques, Université Claude Bernard Lyon 1, attest that we have no conflict of interest to declare for the present article entitled “The effects of Hafnium dioxide (HfO2) thickness induced via atomic layer deposition on the pH sensing properties”, which we are submitting to Analytical and Bioanalytical Chemistry for consideration and publication as a regular research paper. The submission is authored by Zina Fredj, Abdoullatif Baraket, Mounir Ben Ali, Nadia Zine, Miguel Zabala, Joan Bausells, Abdelhamid Elaissari, Nsikak U. Benson, Nicole Jaffrezic-Renault and Abdelhamid Errachidc. The authors’ names mentioned above certify that they have NO affiliations with or involvement in any organization or entity with any financial or non-financial interest in the subject matter or materials discussed in this manuscript.

References

  1. Qin, Y.; Kwon, H.-J.; Howlader, M.M.R.; Deen, M.J. Microfabricated electrochemical pH and free chlorine sensors for water quality monitoring: Recent advances and research challenges. RSC Adv. 2015, 5, 69086–69109. [Google Scholar] [CrossRef]
  2. Eldridge, D.J.; Tozer, M.E. Environmental Factors Relating to the Distribution of Terricolous Bryophytes and Lichens in Semi-Arid Eastern Australia. Bryologist 1997, 100, 28–39. [Google Scholar] [CrossRef]
  3. Yuqing, M.; Jianrong, C.; Keming, F. New technology for the detection of pH. J. Biochem. Biophys. Methods 2005, 63, 1–9. [Google Scholar] [CrossRef] [PubMed]
  4. Ruan, C.; Ong, K.G.; Mungle, C.; Paulose, M.; Nickl, N.J.; Grimes, C.A. A wireless pH sensor based on the use of salt-independent micro-scale polymer spheres. Sens. Actuators B Chem. 2003, 96, 61–69. [Google Scholar] [CrossRef]
  5. Bratov, A.; Abramova, N.; Ipatov, A. Recent trends in potentiometric sensor arrays—A review. Anal. Chim. Acta 2010, 678, 149–159. [Google Scholar] [CrossRef] [PubMed]
  6. Ang, P.K.; Chen, W.; Wee, A.T.S.; Loh, K.P. Solution-Gated Epitaxial Graphene as pH Sensor. J. Am. Chem. Soc. 2008, 130, 14392–14393. [Google Scholar] [CrossRef] [PubMed]
  7. Lesho, M.J.; Sheppard, N.F. Adhesion of polymer films to oxidized silicon and its effect on performance of a conductometric pH sensor. Sens. Actuators B Chem. 1996, 37, 61–66. [Google Scholar] [CrossRef]
  8. Snee, P.T.; Somers, R.C.; Nair, G.; Zimmer, J.P.; Bawendi, M.G.; Nocera, D.G. A Ratiometric CdSe/ZnS Nanocrystal pH Sensor. J. Am. Chem. Soc. 2006, 128, 13320–13321. [Google Scholar] [CrossRef]
  9. Kaval, N.; Seitz, W.R. Aminated poly(vinylbenzylchloride-co-2,4,5-trichlorophenyl acrylate) microspheres for optical pH sensing. In Proceedings of the SPIE, Boston, MA, USA, 9 December 1999; Volume 3860, pp. 224–231. [Google Scholar]
  10. Cai, Q.Y.; Grimes, C.A. A remote query magnetoelastic pH sensor. Sens. Actuators B Chem. 2000, 71, 112–117. [Google Scholar] [CrossRef]
  11. Cai, Q.Y.; Grimes, C.A. A salt-independent pH sensor. Sens. Actuators B Chem. 2001, 79, 144–149. [Google Scholar] [CrossRef]
  12. Bergveld, P. Development of an Ion-Sensitive Solid-State Device for Neurophysiological Measurements. IEEE Trans. Biomed. Eng. 1970, 17, 70–71. [Google Scholar] [CrossRef] [PubMed]
  13. Yin, L.T.; Chou, J.C.; Chung, W.Y.; Sun, T.P.; Hsiung, S.K. Characteristics of silicon nitride after O2 plasma surface treatment for pH-ISFET applications. IEEE Trans. Biomed. Eng. 2001, 48, 340–344. [Google Scholar] [PubMed]
  14. Jakobson, C.G.; Dinnar, U.; Feinsod, M.; Nemirovsky, Y. Ion-sensitive field-effect transistors in standard CMOS fabricated by post processing. IEEE Sens. J. 2002, 2, 279–287. [Google Scholar] [CrossRef]
  15. Knopfmacher, O.; Tarasov, A.; Fu, W.; Wipf, M.; Niesen, B.; Calame, M.; Schönenberger, C. Nernst limit in dual-gated Si-nanowire FET sensors. Nano Lett. 2010, 10, 2268–2274. [Google Scholar] [CrossRef]
  16. Mikolajick, T.; Kühnhold, R.; Ryssel, H. The pH-sensing properties of tantalum pentoxide films fabricated by metal organic low pressure chemical vapor deposition. Sens. Actuators B Chem. 1997, 44, 262–267. [Google Scholar] [CrossRef]
  17. Chin, Y.-L.; Chou, J.-C.; Sun, T.-P.; Liao, H.-K.; Chung, W.-Y.; Hsiunga, S.-K. A novel SnO2/Al discrete gate ISFET pH sensor with CMOS standard process. Sens. Actuators B Chem. 2001, 75, 36–42. [Google Scholar] [CrossRef]
  18. Shin, P.-K. The pH-sensing and light-induced drift properties of titanium dioxide thin films deposited by MOCVD. Appl. Surf. Sci. 2003, 214, 214–221. [Google Scholar] [CrossRef]
  19. Lai, C.-S.; Yang, C.-M.; Lu, T.-F. Thickness Effects on pH Response of HfO2 Sensing Dielectric Improved by Rapid Thermal Annealing. Jpn. J. Appl. Phys. 2006, 45, 3807. [Google Scholar] [CrossRef]
  20. Lai, C.-S.; Yang, C.-M.; Lu, T.-F. pH Sensitivity Improvement on 8 nm Thick Hafnium Oxide by Post Deposition Annealing. Electrochem. Solid-State Lett. 2006, 9, G90–G92. [Google Scholar] [CrossRef]
  21. Lai, C.-S.; Lu, T.-F.; Yang, C.-M.; Lin, Y.-C.; Pijanowska, D.-G.; Jaroszewicz, B. Body effect minimization using single layer structure for pH-ISFET applications. Sens. Actuators B Chem. 2010, 143, 494–499. [Google Scholar] [CrossRef]
  22. Wal, P.D.; Briand, D.; Mondin, G.; Jenny, S.; Jeanneret, S.; Millon, C.; Roussel, H.; Dubourdieu, C.; de Rooij, N.F. High-k dielectrics for use as ISFET gate oxides. IEEE Sens. 2004, 2, 677–680. [Google Scholar]
  23. Rauwel, E.; Rochat, N. Growth by Liquid-Injection MOCVD and Properties of HfO2 Films for Microelectronic Applications. Chem. Vap. Depos. 2006, 12, 187–192. [Google Scholar]
  24. Alnuaimi, A.; Almansouri, I.; Saadat, I.; Nayfeh, A. High performance graphene-silicon Schottky junction solar cells with HfO2 interfacial layer grown by atomic layer deposition. Sol. Energy 2018, 164, 174–179. [Google Scholar] [CrossRef]
  25. Knez, M.; Nielsch, K.; Niinistö, L. Synthesis and Surface Engineering of Complex Nanostructures by Atomic Layer Deposition. Adv. Mater. 2007, 19, 3425–3438. [Google Scholar] [CrossRef]
  26. Rafí, J.M.; Campabadal, F.; Ohyama, H.; Takakura, K.; Tsunoda, I.; Zabala, M.; Beldarrain, O.; González, M.B.; García, H.; Castán, H.; et al. 2 MeV Electron Irradiation Effects on the Electrical Characteristics of Metal–Oxide–Silicon Capacitors with Atomic Layer Deposited Al2O3, HfO2 and Nanolaminated Dielectrics. Solid-State Electron. 2013, 79, 65–74. [Google Scholar] [CrossRef]
  27. Hausmann, D.-M.; Gordon, R.-G. Surface morphology and crystallinity control in the atomic layer deposition (ALD) of hafnium and zirconium oxide thin films. J. Cryst. Growth 2003, 249, 251–261. [Google Scholar] [CrossRef]
  28. Campabadal, F.; Rafí, J.M.; Zabala, M.; Beldarrain, O.; Faigón, A.; Castán, H.; Gómez, A.; García, H.; Dueñas, S. Electrical Characteristics of Metal-Insulator-Semiconductor Structures with Atomic Layer Deposited Al2O3, HfO2, and Nanolaminates on Different Silicon Substrates. J. Vac. Sci. Technol. B 2011, 29, 01AA07. [Google Scholar] [CrossRef]
  29. Martín, G.; González, M.B.; Campabadal, F.; Peiró, F.; Cornet, A.; Estradé, S. Transmission electron microscopy assessment of conductive-filament formation in Ni–HfO2–Si resistive-switching operational devices. Appl. Phys. Express 2017, 11, 14101. [Google Scholar] [CrossRef]
  30. García, H.; Castán, H.; Dueñas, S.; Bailón, L.; Campabadal, F.; Beldarrain, O.; Zabala, M.; González, M.B.; Rafí, J.M. Electrical characterization of atomic-layer-deposited hafnium oxide films from hafnium tetrakis(dimethylamide) and water/ozone: Effects of growth temperature, oxygen source, and postdeposition annealing. J. Vac. Sci. Technol. Vac. Surf. Films 2012, 31, 01A127. [Google Scholar] [CrossRef] [Green Version]
  31. Braik, M.; Dridi, C.; Ben Ali, M.; Ali, M.; Abbas, M.; Zabala, M.; Bausells, J.; Zine, N.; Jaffrezic-Renault, N.; Errachid, A. Development of a capacitive chemical sensor based on Co(II)-phthalocyanine acrylate-polymer/HfO2/SiO2/Si for detection of perchlorate. J. Sens. Sens. Syst. 2015, 4, 17–23. [Google Scholar] [CrossRef] [Green Version]
  32. Barhoumi, L.; Baraket, A.; Nooredeen, N.M.; Ali, M.B.; Abbas, M.N.; Bausells, J.; Errachid, A. Silicon Nitride Capacitive Chemical Sensor for Phosphate Ion Detection Based on Copper Phthalocyanine—Acrylate-polymer. Electroanalysis 2017, 29, 1586–1595. [Google Scholar] [CrossRef] [Green Version]
  33. Zafar, S.; D’Emic, C.; Afzali, A.; Fletcher, B.; Zhu, Y.; Ning, T. Optimization of PH Sensing Using Silicon Nanowire Field Effect Transistors with HfO2as the Sensing Surface. Nanotechnology 2011, 22, 405501. [Google Scholar] [CrossRef] [PubMed]
  34. Wang, I.-S.; Lin, Y.-T.; Huang, C.-H.; Lu, T.-F.; Lue, C.-E.; Yang, P.; Pijanswska, D.G.; Yang, C.-M.; Wang, J.-C.; Yu, J.-S.; et al. Immobilization of enzyme and antibody on ALD-HfO2-EIS structure by NH3 plasma treatment. Nanoscale Res. Lett. 2012, 7, 179. [Google Scholar] [CrossRef] [PubMed] [Green Version]
  35. Lee, M.; Baraket, A.; Zine, N.; Zabala, M.; Campabadal, F.; Renault, N.-J.; Errachid, A. Impedance Characterization of the Capacitive Field-Effect PH-Sensor Based on a Thin-Layer Hafnium Oxide Formed by Atomic Layer Deposition. Sens. Trans. 2014, 27, 233–238. [Google Scholar]
  36. Ameur, S.; Maupas, H.; Martelet, C.; Jaffrezic-Renault, N.; Ben Ouada, H.; Cosnier, S.; Labbe, P. Impedimetric measurements on polarized functionalized platinum electrodes: Application to direct immunosensing. Mater. Sci. Eng. C 1997, 5, 111–119. [Google Scholar] [CrossRef]
  37. Barhoumi, H.; Haddad, R.; Maaref, A.; Bausells, J.; Bessueille, F.; Léonard, D.; Jaffrezic-Renault, N.; Martelet, C.; Zine, N.; Errachid, A. Na+-implanted membrane for a capacitive sodium electrolyte-Insulator-Semiconductor microsensors. Sens. Lett. 2008, 6, 204–208. [Google Scholar] [CrossRef]
Figure 1. (A) Electrochemical cell used for pH measurement with Calomel-Saturated Reference electrode (RE), counter electrode (CE), and Ohmic contact behind the WE; (B) working electrode with electrolytic-insulating-semiconductor structure based on Al/Si/SiO2/HfO2.
Chemosensors 09 00013 g001
Figure 2. Contact angle measurements of the HfO2 surface for the three thicknesses of 15.0, 19.5 and 39.9 nm used for the pH sensor based on Al/Si/SiO2/HfO2.
Chemosensors 09 00013 g002
Figure 3. Typical C(V) response to frequency changes from 100 mHz to 100 kHz.
Chemosensors 09 00013 g003
Figure 4. Typical C(V) curves for different hafnium thicknesses (a) 15.0 nm, (b) 19.5 nm and (c) 39.9 nm stacked HfO2 structures for various pH buffer solutions using 0.4 M Mg (NO3)2 prepared in TRIS buffer. The pH was adjusted by the HCl solution (C = 1 M).
Chemosensors 09 00013 g004
Figure 5. The pH sensitivity for three HfO2 thicknesses (15.0, 19.5 and 39.9 nm): ΔVFB as a function of pH (from 3 to 9).
Chemosensors 09 00013 g005
Figure 6. The flat band potential VFB variation versus (a) K+, (b) Li+ and (c) Na+ concentrations from 10−5 M to 10−1 M. Inset: the capacitive responses of Si/SiO2/HfO2 structure with 15 nm HfO2 thickness for interfering ions (Figure S1 in Supplementary Material).
Chemosensors 09 00013 g006
Figure 7. Impedance spectra (in Nyquist presentation) of the HfO2 structures for different polarizations vs. saturated calomel reference electrode (SCE). Electrochemical impedance spectroscopy (EIS) measurements were carried out in 0.4 mol·L−1 Mg (NO3)2 prepared in TRIS buffer using the following conditions: frequency range from 100 mHz to 100 kHz, AC amplitude voltage at 25 mV.
Chemosensors 09 00013 g007
Figure 8. Nyquist plots at different pH for different hafnium thicknesses (a) 15.0 nm, (b) 19.5 nm and (c) 39.9 nm.
Chemosensors 09 00013 g008aChemosensors 09 00013 g008b
Figure 9. Calibration curve variation of normalized ∆Rct as a function of the pH for different hafnium oxide thickness of 15.0 nm, 19.5 nm and 39.9 nm.
Chemosensors 09 00013 g009
Figure 10. Calibration curve variation of normalized ∆Rct as a function of the pH versus (a) K+, (b) Li+ and (c) Na+ concentrations from 10−5 M to 10−1 M at the Si/SiO2/HfO2 structure (thickness 39.9 nm).
Chemosensors 09 00013 g010
Table 1. Comparison of the sensitivity of various HfO2 thicknesses.
Thicknesses (nm)1519.539.9
Sensitivity (mV/pH)54.551.149.2
R20.99660.99570.9926
Table 2. Sensitivities and dynamic ranges obtained with the implanted structure for K+, Li+ and Na+ detection (10−5 M to 10−1 M).
IonK+Li+Na+
Sensibility (mV/p[X])4.25.22.5
R20.9740.9920.952
Publisher’s Note: MDPI stays neutral with regard to jurisdictional claims in published maps and institutional affiliations.

