Article

Electrochemical Detection of a Local Anesthetic Dibucaine at Arrays of Liquid|Liquid MicroInterfaces

by
Eissa Mohamed Almbrok
1,
Nor Azah Yusof
1,2,
Jaafar Abdullah
1 and
Ruzniza Mohd Zawawi
1,*
1
Department of Chemistry, Faculty of Science, University Putra Malaysia, Serdang 43400, Selangor, Malaysia
2
Institute of Advanced Technology, University Putra Malaysia, Serdang 43400, Selangor, Malaysia
*
Author to whom correspondence should be addressed.
Submission received: 8 December 2020 / Revised: 7 January 2021 / Accepted: 12 January 2021 / Published: 15 January 2021
(This article belongs to the Section Electrochemical Devices and Sensors)

Abstract

:
Electrochemical characterization and detection of protonated dibucaine ( DIC + ) at microinterface array across water|1,6-dichlorohexane were performed using cyclic voltammetry (CV) and differential pulse voltammetry (DPV). Some thermodynamic parameters of dibucaine, such as the standard transfer potential, the Gibbs energy of transfer and the partition coefficient, were estimated by CV. In addition to the analytical parameters, the impact of bovine serum albumin (BSA) on dibucaine detection (in artificial serum matrices) was also investigated. DPV was applied to detect a lower concentration of DIC + , resulting in a detection limit of 0.9 ± 0.06 µM. While the presence of BSA affected CV, demonstrated as reduced current responses, DPV was confirmed to be an efficient method for lowering concentrations of the dibucaine detection in the artificial serum matrix in the presence of BSA, with a limit of detection (LOD) of 1.9 ± 0.12 µM.

1. Introduction

Ion transfer via the liquid|liquid interface or the interface between two immiscible electrolyte solutions (ITIES) has captured researchers’ interest in several chemical and biological applications, such as drug behavior, membrane transport and electrochemical liquid|liquid extraction [1,2,3,4]. Electrochemistry of the liquid|liquid interface has progressed from the transfer of small molecules such as model ions (tetraalkylammonium ions) to detecting various bioactive interest substances, including amino acids, peptides, proteins, neurotransmitters, drugs, DNA and food additives [5]. Hence, it plays a potentially crucial role in the development of new biosensor techniques [5].
Dibucaine hydrochloride (DIC) [2-butoxy-N-(2-diethylaminoethyl)quinoline-4-carboxamide hydrochloride] (Figure 1) has evinced immense clinical interest as a local anesthetic and was first synthesized by Miescher [6]. This compound is among the most effective and potent of the long-acting local anesthetics [7]. DIC is commonly utilized as hydrochloride or a free base in diluting penetrable solutions to produce spinal or surface anesthesia or ophthalmic ointments to initiate conjunctival anesthesia.
To date, many methods have been used to determine DIC, including high performance liquid chromatography (HPLC) [8,9,10,11], gas chromatography (GC) [12,13,14], column liquid chromatography (LC), thin-layer chromatography (TLC) [15], fluorimetry [16], spectrophotometry [17,18,19] and electrochemical methods [20,21,22,23]. However, most of the previous methods are associated with disadvantages such as being time-intensive, the requirement of sample pre-treatment, intensive solvent usage, the requirement of extraction and the use of expensive devices. Electrochemical methods are characterized by low cost, portability and fast laboratory analysis, rendering them the preferred dibucaine detection techniques [12]. However, most studies involving various electrochemical approaches have focused on electrode|electrolyte interfaces, primarily using cyclic voltammetry (CV), differential pulse voltammetry (DPV) and square wave (SWV) [21,22,23].
At physiological pH, most drug molecules are commonly ionizable and exist in both forms (ionic and neutral) or one of them. Thus, these drugs are suitable for voltammetric studies via the water|organic interface, which provide essential information about their physicochemical properties of biological interest, such as standard potential, Gibbs energy transfer and the partition coefficients. Electrochemical transfer of local anesthetics, including dibucaine, has been studied across the nitrobenzene (NB) water (W) interface using polarography [24] and CV [25]. In these studies, the relationship between the pharmacological activity and the half-wave potential of the voltammogram has been explicated. Samec et al. studied the influence of ion structure on the pharmacological activity and the transfer kinetics of these drugs across the water|o-nitrophenyl octyl ether interface [26].
However, no studies have been conducted on the electrochemical detection of ionized dibucaine in biological samples based on the ion transfer across the water|1,6-dichlorohexane interface. Consequently, this study presents dibucaine detection opportunities based on ion transfer across the liquid|liquid microinterface. Nevertheless, the detection of ionizable drugs at the liquid|liquid interface through numerous electrochemical approaches has been previously studied, including the daunorubicin drug via a microporous polyethylene terephthalate (PET) membrane-modified ITIES [27], ion transfer of catamphiphilic drugs across a polymeric membrane [28], the β-blocker propranolol drug [29] and protonated ractopamine [30] via a microporous silicon membrane-modified liquid–liquid interface. Recently, we studied the electrochemical behavior and detection of diclofenac across a microporous silicon nitride membrane modified microinterface. Both radial and linear diffusion contributed to the membrane by producing a combination of steady-state and peak behavior in the forward scan. In contrast, the linear diffusion produced peak behavior on the reverse scan [31].
Voltammetry at the ITIES is more suitable for determining thermodynamic parameters, such as the transfer standard potential difference, the Gibbs energy and partition coefficient of the ionized species [30]. In addition to analytical studies, the ITIES could mimic the drug transfer via biological membranes and offers important insight into drug action mechanisms [27].
Direct detection of drugs in biological samples, for example, blood or serum tests, is significant as it provides data on circulation level. Nonetheless, this cycle can be impeded due to drug–protein binding [32]. Blood protein functions in drug transportation, distribution, metabolism, absorption and excretion [33,34,35]. Serum albumin is found in abundance (ca.60 % of proteins) in blood and exhibits a great deal of drug affinity [36,37]. A few novel label-free approaches have been developed to measure drug–protein interactions [38]. Bovine serum albumin (BSA) was chosen in this study due to its homology to human serum albumins [39,40,41].
This study is focused on the electrochemical behavior of protonated dibucaine ( DIC + ) at the micro-ITIES array. Quantitative methods that include the detection of DIC + by simple ion transfer at the water|1,6-DCH microinterface array are reported, using CV and DPV, which are examined in this study. The analytical parameters for the transfer of ionizable dibucaine are discussed. Apart from the analytical parameters, the influence of serum protein on DIC + detection is also presented.

2. Materials and Methods

2.1. Reagents

All chemicals used in this study were obtained from Sigma-Aldrich, Malaysia, unless stated otherwise. Potassium phosphate monobasic ( KH 2 PO 4 ), D-glucose and potassium chloride (KCl), calcium chloride ( CaCl 2 ) and magnesium chloride ( MgCl 2 ) were obtained from HmbG. Urea was obtained from BDH Laboratory Supplies, Malaysia. In addition, sodium phosphate monobasic ( NaH 2 PO 4 ) was purchased from Fisher Scientific, Malaysia. Similarly, 1,6-dichlorohexane (1,6-DCH) solvent (98%) was purchased from Sigma, Malaysia, and it was purified as previously reported [42]. The aqueous phase was prepared by dissolving 10 mM lithium chloride (LiCl) in ultrapure water (resistivity of 18 MΩ cm) from Sartorius, Malaysia). The supporting electrolyte of the organic phase was prepared by the metathesis of bis(triphenylphosphoranylidene)ammonium chloride (BTPPACl) with potassium tetrakis(4-chlorophenyl) borate (KTPBCl) and 10 mM BTPPATPBCl dissolved in 1,6-DCH. Both the aqueous and organic phase solvents were reciprocally pre-saturated before conducting the experiments.
The organic reference solution was prepared from 1.0 mM BTPPACl dissolved in 10 mM LiCl (aqueous). Tetramethylammonium chloride (TMACl) and dibucaine hydrochloride, which acted as the model ion and drug analyst, respectively, along with their stock solutions, were prepared in10 mM LiCl. The artificial serum matrix [43,44] used comprised 5.0 mM calcium chloride ( CaCl 2 ), 1.5 mM potassium chloride (KCl), 1.6 mM magnesium chloride ( MgCl 2 ), 1.0 mM sodium phosphate monobasic ( NaH 2 PO 4 ), 4.7 mM D-glucose, 2.5 mM urea, 1.0 mM KH 2 PO 4 and 0.6 mM bovine serum albumin (BSA), before being prepared in ultrapure water.

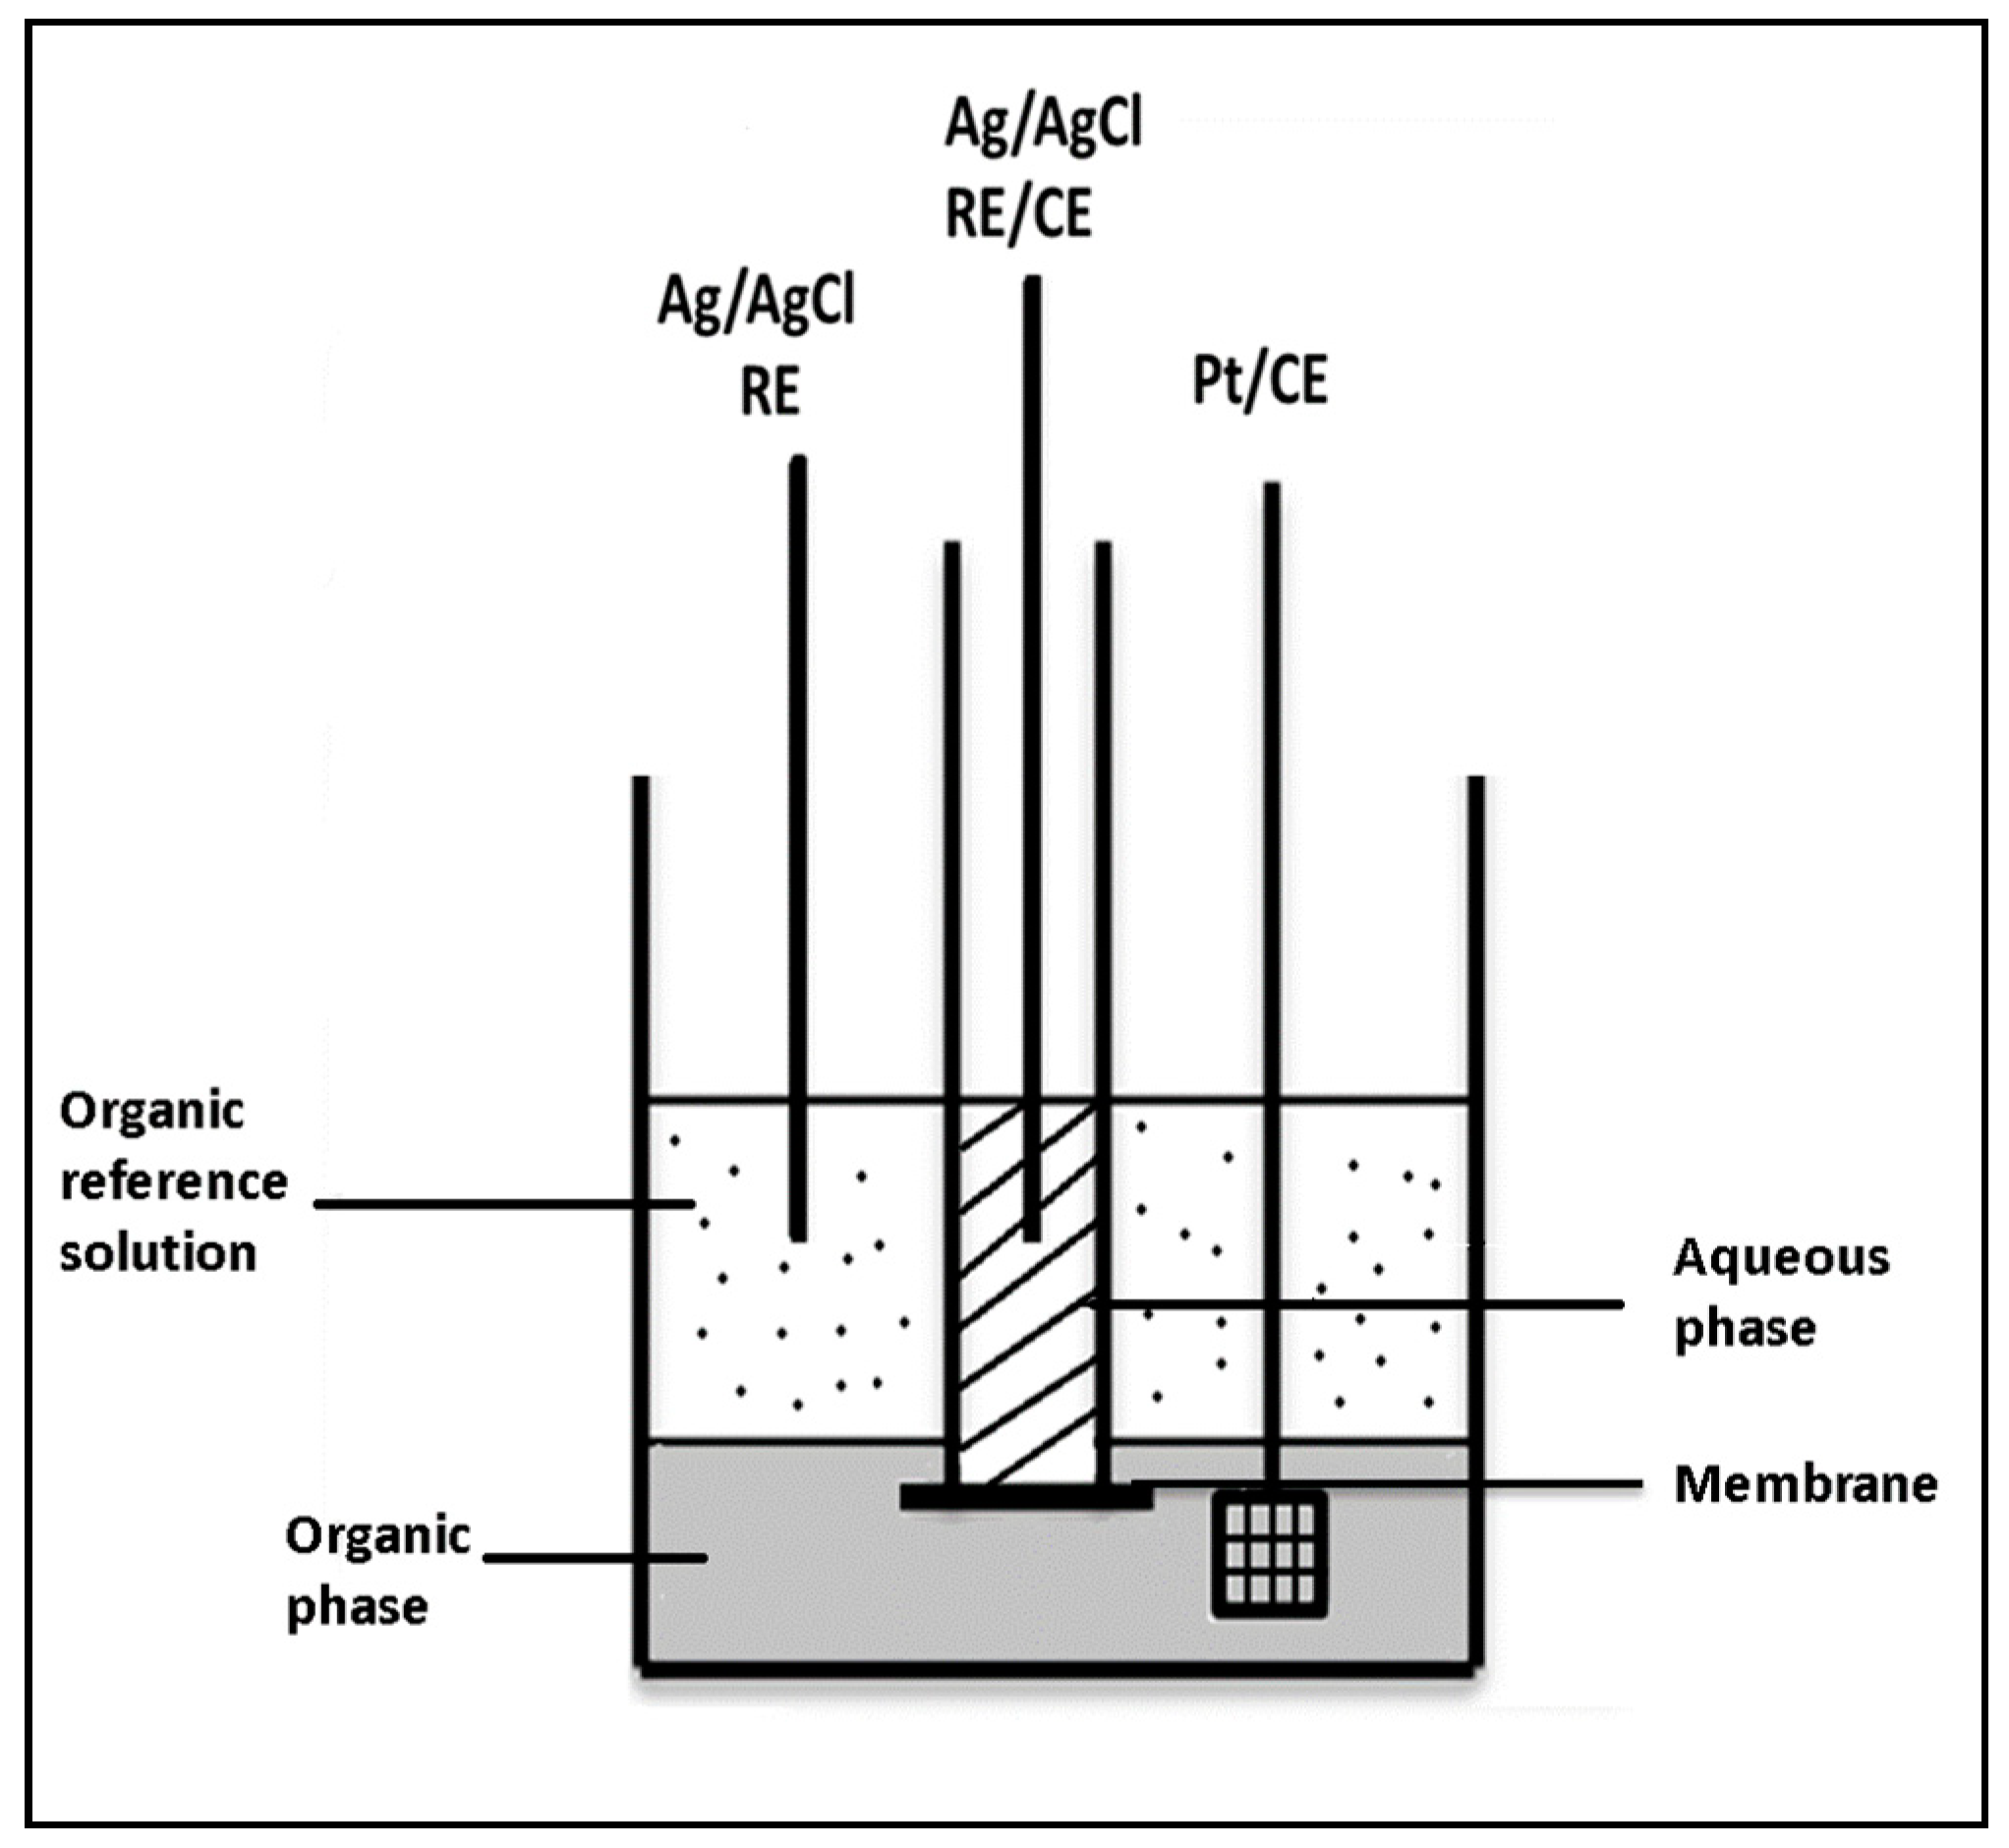
2.2. Electrochemical Cell of the Microscale Interface

The electrochemical experiments were carried out utilizing a potentiostat Autolab PGSTAT101 (Metrohm, Selangor, Malaysia) with Nova 1.1 software provided along with the apparatus. As previously reported [42,45], the membrane-modified water|1,6-DCH interface was polarized in a three-electrode cell with one silver|silver chloride (Ag|AgCl) electrode serving as reference and counter electrodes in the aqueous phase. In contrast, a second silver|silver chloride (Ag|AgCl) electrode with platinum mesh (Pt) electrode served as a reference and a counter electrode, respectively, in the organic phase, as illustrated in Figure 2. The cell used was placed in a Faraday cage to minimize the electrical noise. The array of the microporous supported liquid|liquid interface for studying the ion transfer process was characterized as a previously reported [31]. Briefly, 2500 micropores arranged in a cube close-packed (CCP) arrangement, each with a diameter of 2.5 ± 0.09 μm, a pore center-to-center separation of 12.65 ± 0.13 μm and 100 μm membrane thickness(L). The membrane used was sealed using silicone sealant to one end of the borosilicate glass tube containing 500 µL of the aqueous phase before being immersed in a 10 mL glass beaker that contained 1.0 mL of the organic phase on the bottom and 2 mL of the organic reference solution on the top. The cells used in this study are summarized as follows:
Ag | AgCl | x   μ M   DIC +   in   10   mM   LiCl   ( W ) | | 10   mM   BTPPATPBCl   ( 1 , 6-DCH ) | 1.0   mM   BTPPACl   in   10   mM   LiCl ( W ) | AgCl | Ag Cell (1)
Ag | AgCl | x   μ M   DIC + in   artificial   serum   ( W ) | | 10   mM   BTPPATPBCl   ( 1 , 6-DCH ) | 1.0   mM   BTPPACl   in   10   mM   LiCl ( W ) | AgCl | Ag Cell (2)
where x denotes the concentration of dibucaine in the aqueous phase. The TMA + was added into the final experiment of DIC + transfer as a reference to the potential scale. Before adding a drug or model ion into the aqueous phase using a micropipette to reach the required concentration, CVs of blank (background electrolytes) were recorded at 10 mVs−1 over a wide range of potential scales to determine the boundaries of the available potential window.

3. Results and Discussion

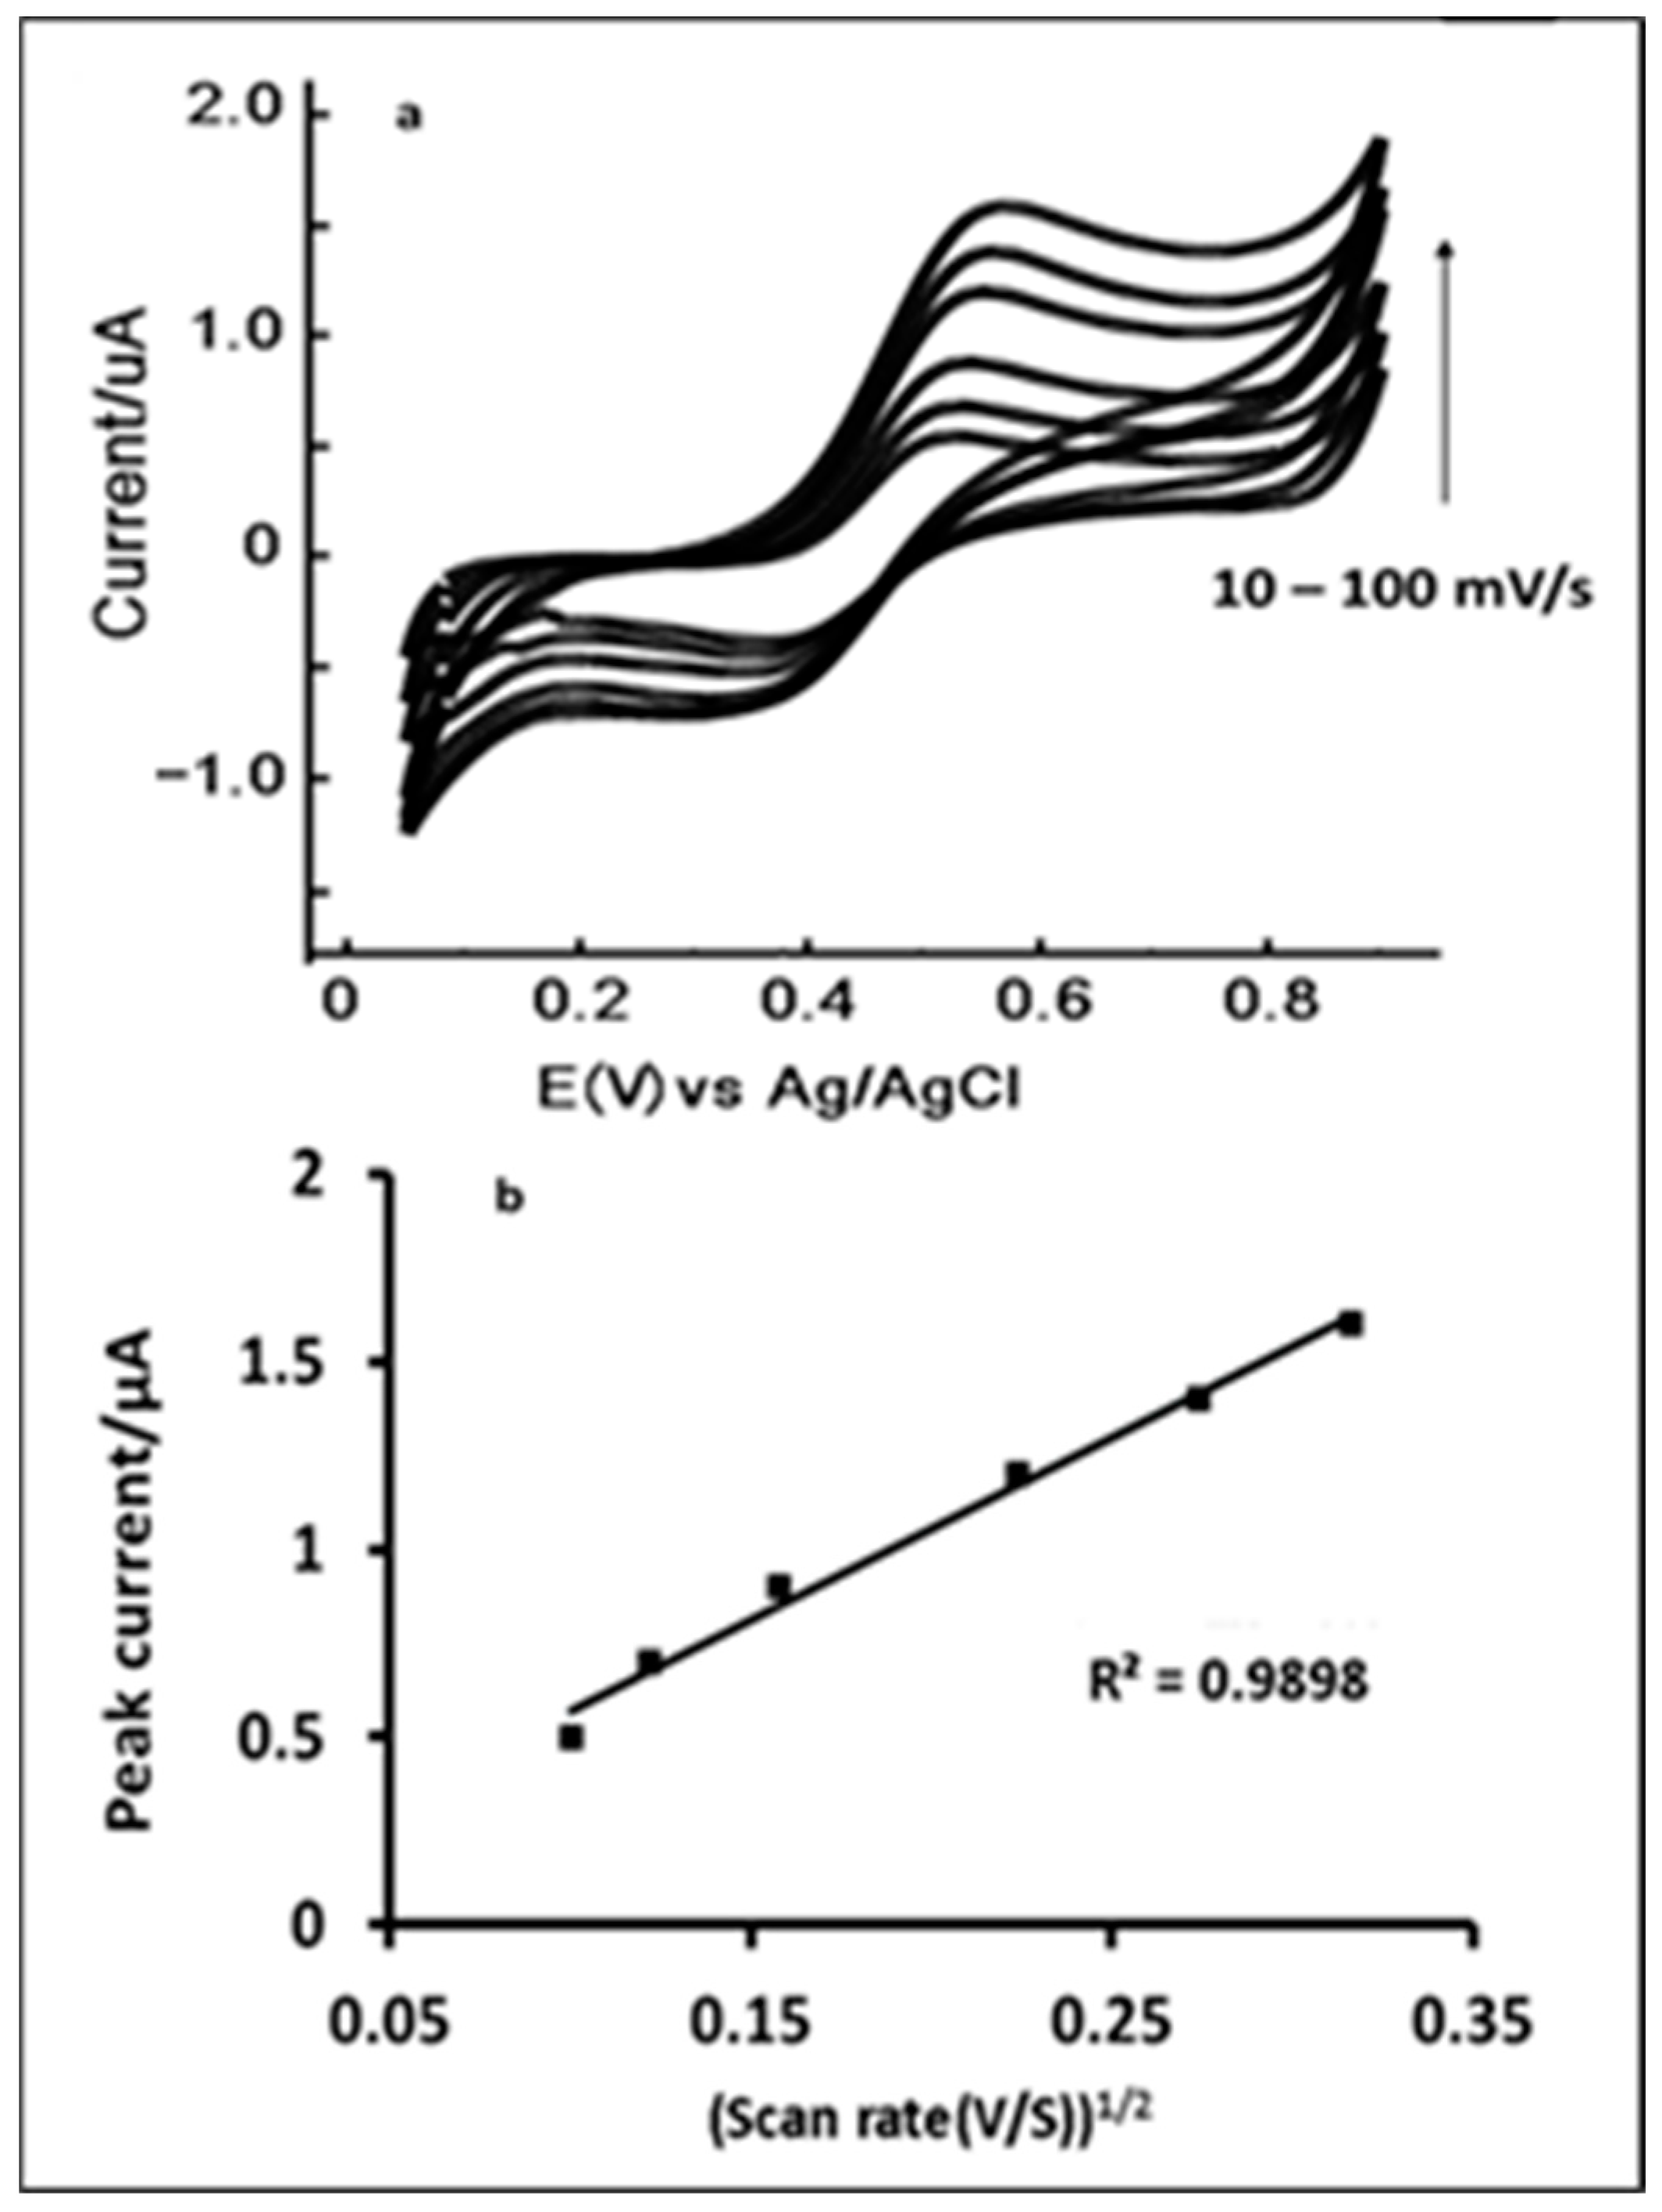
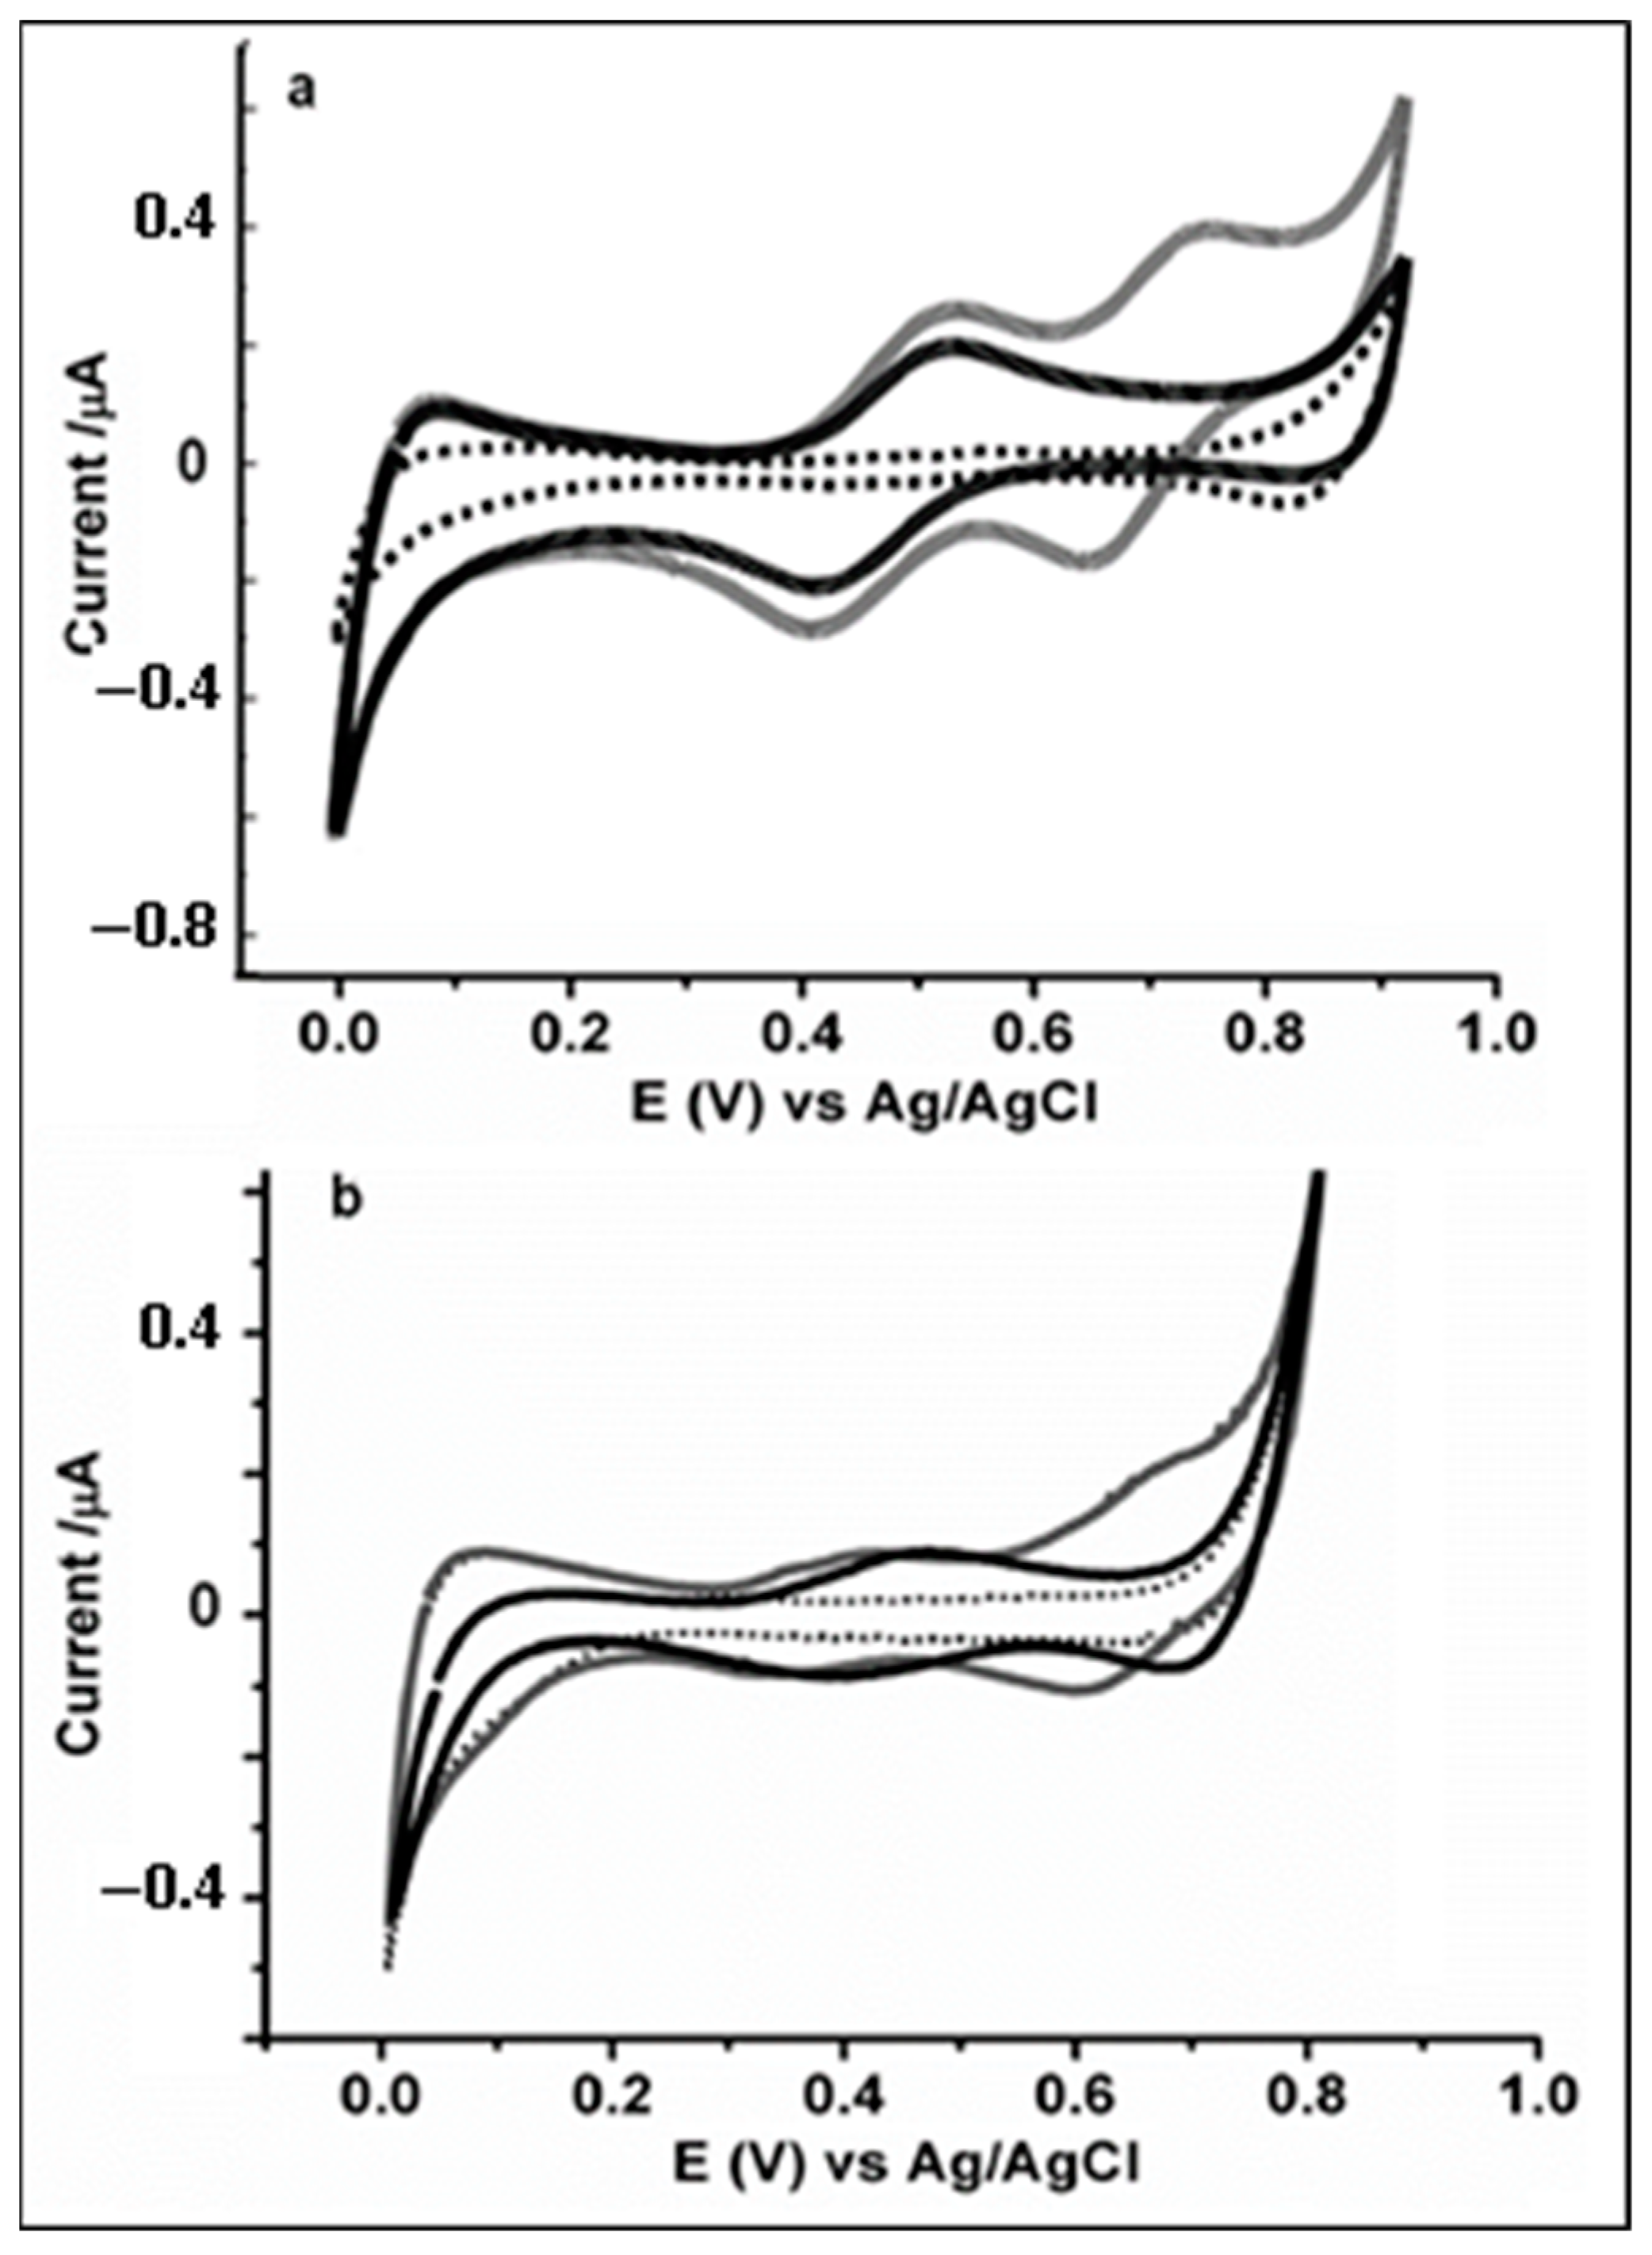
3.1. Electrochemical Behavior at the Micro-ITIES Array

Background-subtracted voltammograms for concentrations ranging from 20 to 100 µM, with an increment of 20 µM of dibucaine cation ( DIC + ) at the micro-ITIES arrays, are introduced in Figure 3a. Given that the DIC has the amine group in its structure with pKa = 8.30 [25], the aqueous phase applied here, 10 mM LiCl (pH = 4), is adjusted by 10 mM HCl to ensure that the DIC is fully protonated. The voltammograms obtained show that DIC + ions, which was initially present in the aqueous phase, was transferred from the aqueous phase into the organic phase on the forward CV sweep, then these ions were transported back into the aqueous phase from the organic phase in the reverse scan under control potential. The potential peaks were observed at approximately 0.52 and 0.40 V for the forward and the reverse scans. Approximately 80 µM of tetramethylammonium ion ( TMA + ) was spiked into the final experiment of 100 µM of DIC + in the aqueous phase (Figure 3b) as a model ion and a potential axis reference ion, at transfer potentials of approximately 0.73 and 0.67 V for forward and reverse scans, respectively [45]. The aim of TMA + addition was evidence of the suitable setup of the experimental cell. No interference was observed between the transfers of TMA + and dibucaine. Figure 3c represents the calibration plots bearing the linear relationship between the peak currents versus DIC+ concentrations in the aqueous phase for the forward and reversed scans, with the regression equations: Ip(μA) = 0.0046 concentration (μM)−0.018 (μA), R2 = 0.9977 for forward scan and Ip = −0.0038 concentration (μM)−0.017 (μA), R2 = 0.9889 for reverse scan.
The microporous silicon nitride membrane used here showed recessed microinterface behavior so that the pores were filled with the aqueous phase and the interface was within the pore length and at the organic phase side [31]. For recessed micro-ITIES array, spherical diffusion is generally observed at the pore opening, while linear diffusion dominates within the channel’s confines. In comparison to the inlaid interface, the recessed interface demonstrated a lower steady-state current ( I s s ), by a factor equal to ( 4 l +   π r a ) + 1, as reported by Bond and co-workers [46]. This reduction is attributed to the shielding effect of the surrounding pore walls.
However, the voltammograms obtained (Figure 3a,b) displayed symmetrical behavior on both forward and reverse scans, which showed incorporation between the peak and steady-state behavior with peak current dominance on the forward scan over the peak observed on the reverse scan. This behavior demonstrates that the ion accumulated close to the pore interface on the organic side during the water-to-organic transfer, owing to the slower diffusion process in the more viscous 1,6-DCH, as shown in previous simulation reports [47]. The diffusion zone overlap was expected to occur and contribute to the more pronounced peak shape observed because the pore center-to-center separation in the membrane used was not big enough. Consequently, the spherical diffusion contribution will decline, while the linear diffusion contribution will increase, thus resulting in the appearance of a peak-shaped voltammogram [47].
Another possible factor for the observed voltammogram behavior is that the ITIES is in the pore channel’s center. In this condition, the diffusion patterns (and the shielding effect of the surrounding pore wall) produced from the forward and reverse sweeps are observed to be equal [16]. The transfer processes from both W to O and O to W may be treated similarly to the recessed ITIES condition, where W and O signify aqueous and organic phases, respectively. Therefore, the limiting current can be calculated at such a recessed micro-ITIES by Equation (1) [45,48]:
I l i m = 4 π n F D C r 2 4 l + π r
where n refers to the number of pores, F the constant of Faraday, D denotes the diffusion coefficient, C represents the bulk concentration of the transporting species, r is the radius of the pore and l signifies the recess depth (100 μm). Equation (1) was utilized to determine the diffusion coefficient of DIC + in the aqueous phase from the slope of the linearity of the peak currents (forward scan) versus DIC + concentrations (Figure 3c). Its value of 3.92 × 10⁻⁶ cm2 s−1 is in good agreement with the expected theoretical value calculated by the relationship between the molar mass and the diffusion coefficient (log D a q u = 4.15 − 0.488 log Mr) [49], 3.99 × 10⁻⁶ cm2 s−1. However, it was 3-fold lower than the previously reported value [26] at the water|o-nitrophenyl octyl ether interface (7.9 × 10⁻⁶ cm2 s−1). As reported previously [50], the ion-pair formation of the transferring anion with the supporting electrolyte cation was present in the organic phase.
If the diffusion zones are heavily overlapped, a purely linear diffusion will be observed; the Randles–Ševcik expression defines the resulting peak current. CV of 100 μM of DIC at varying scan rates (10–100 mVs−1) (Figure 4a) was performed, demonstrating that the forward peak slightly shifted to a more positive potential with increasing sweep rate, whereas the peak shape became more pronounced as the scan rate was increased. Furthermore, the peak current (Ip) associated with the ion transfer (IT) process was linearly dependent on the square root of the scan rate (ν), indicating a one-dimensional diffusion-controlled process (Figure 4b). For the forward scan, the linear response was expressed by the slope equation: Ip (µA) = 4.8701 ν1/2 (V/s)1/2 + 0.0808 (µA), R2 = 0.9898. For a linear diffusion process, the peak current is expected to be proportional to the square root of the scan rate (υ1/2), as described by the Randles–Ševcik Equation (2).
I p = 0.4463 z i F A C i z i F v D i R T
where Ip is peak current, F signifies faraday constant (96,485), A denotes the total cross-sectional area of the interfaces (0.25 mm2), zi represents the charge, R is the gas constant 8.314 J/mol K, T is the absolute temperature of 298 K° and Ci is the bulk concentration of the transferring ions in the aqueous phase. From the negative (cathodic) peak current, it is possible to determine the diffusion coefficient of the transferred anion in water (or equivalently for this sign of current, for a cation in the 1,6-DCH phase). Similarly, the positive (anodic) peak current would yield the diffusion coefficient of the transferred cation in water, or anion in 1,6-DCH, respectively. From Equation (2), the diffusion coefficient of DIC + from the Randles–Ševcik plot’s slope was calculated to be 5.2 × 10⁻⁵ cm2 s−1, which was 6-fold higher than a previous study [26]. This result indicates that the micro-ITIES is closest to the recessed microinterface behavior.

3.2. Thermodynamic Data of D I C + Transfer at the Microinterface

The analytical parameters of simple ion transfer for DIC + were determined from the voltammograms illustrated in Figure 3 and summarized in Table 1. By transforming the experimental value obtained to the Galvani potential scale, the standard transfer potential of an ionized drug can be obtained using standard thermodynamic values of well-known reference ions such as TMA + shown by the following Equation (3) [51,52].
E 1 / 2 ( DIC + )   Δ o w ° ( DIC + ) =   E 1 / 2 ( TMA + )   Δ o w ° ( TMA + )
where Δ o w ° represents the standard transfer potential of the TMA + and DIC + , E 1 / 2 ( drug )   and   E 1 / 2 ( TMA + ) are the experimental half-wave potentials. The value of Δ o w ° ( TMA + ) used was 0.173 V [42]. The Galvani transfer potential of DIC + ( Δ o w ° ( DIC + ) determined by Equation (3) was −0.077 V, while the published literature value in the water | o-nitrophenyl octyl ether (o-NPOE) interface was −0.097 mV [26]. Notably, the Gibbs energy of ion transfer ( Δ G t r ,   D r u g 0 ,   w o ) is immediately linked to the standard transfer potential [30,52]. Thus, the ( Δ G t r , DIC + 0 ,   w o ) of DIC + transfer from the aqueous to the 1,6-DCH phase can be obtained by Equation (4).
  Δ 0 w DIC + ° =   ( Δ G t r , DIC + 0 ,   w o ) zF
The value calculated for ( Δ G t r , D I C + 0 ,   w o ) of DIC + transfer across water|1,6-DCH was –7.4 kJ/mol.
Another parameter that can be calculated according to the standard transfer energy is the partition coefficient ( logP ° ) or defined as the lipophilicity coefficient of a specific solute containing two immiscible solvents [30]. The DIC + partition coefficient ( logP DIC + ° ) between 1,6-DCH and water is denoted by Equation (5) as:
logP DIC + ° =   ( Δ G t r , DIC + 0 ,   w o ) 2.3 RT
where R signifies the gas constant 8.314 J/mol-K, and T, the absolute temperature of 298 K°. The calculated value of l o g P D I C + ° was 1.3, which was lower than the value measured at a nitrobenzene–water interface (2.86) [25]. To compare the partition coefficients of the neutral form ( l o g P n o c t ° (4.4)) [53] in n-octanol–water system with the partition coefficient of ionized species ( l o g P D I C + ° (1.3)), dibucaine in neutral form is significantly more lipophilic than ionizable form.

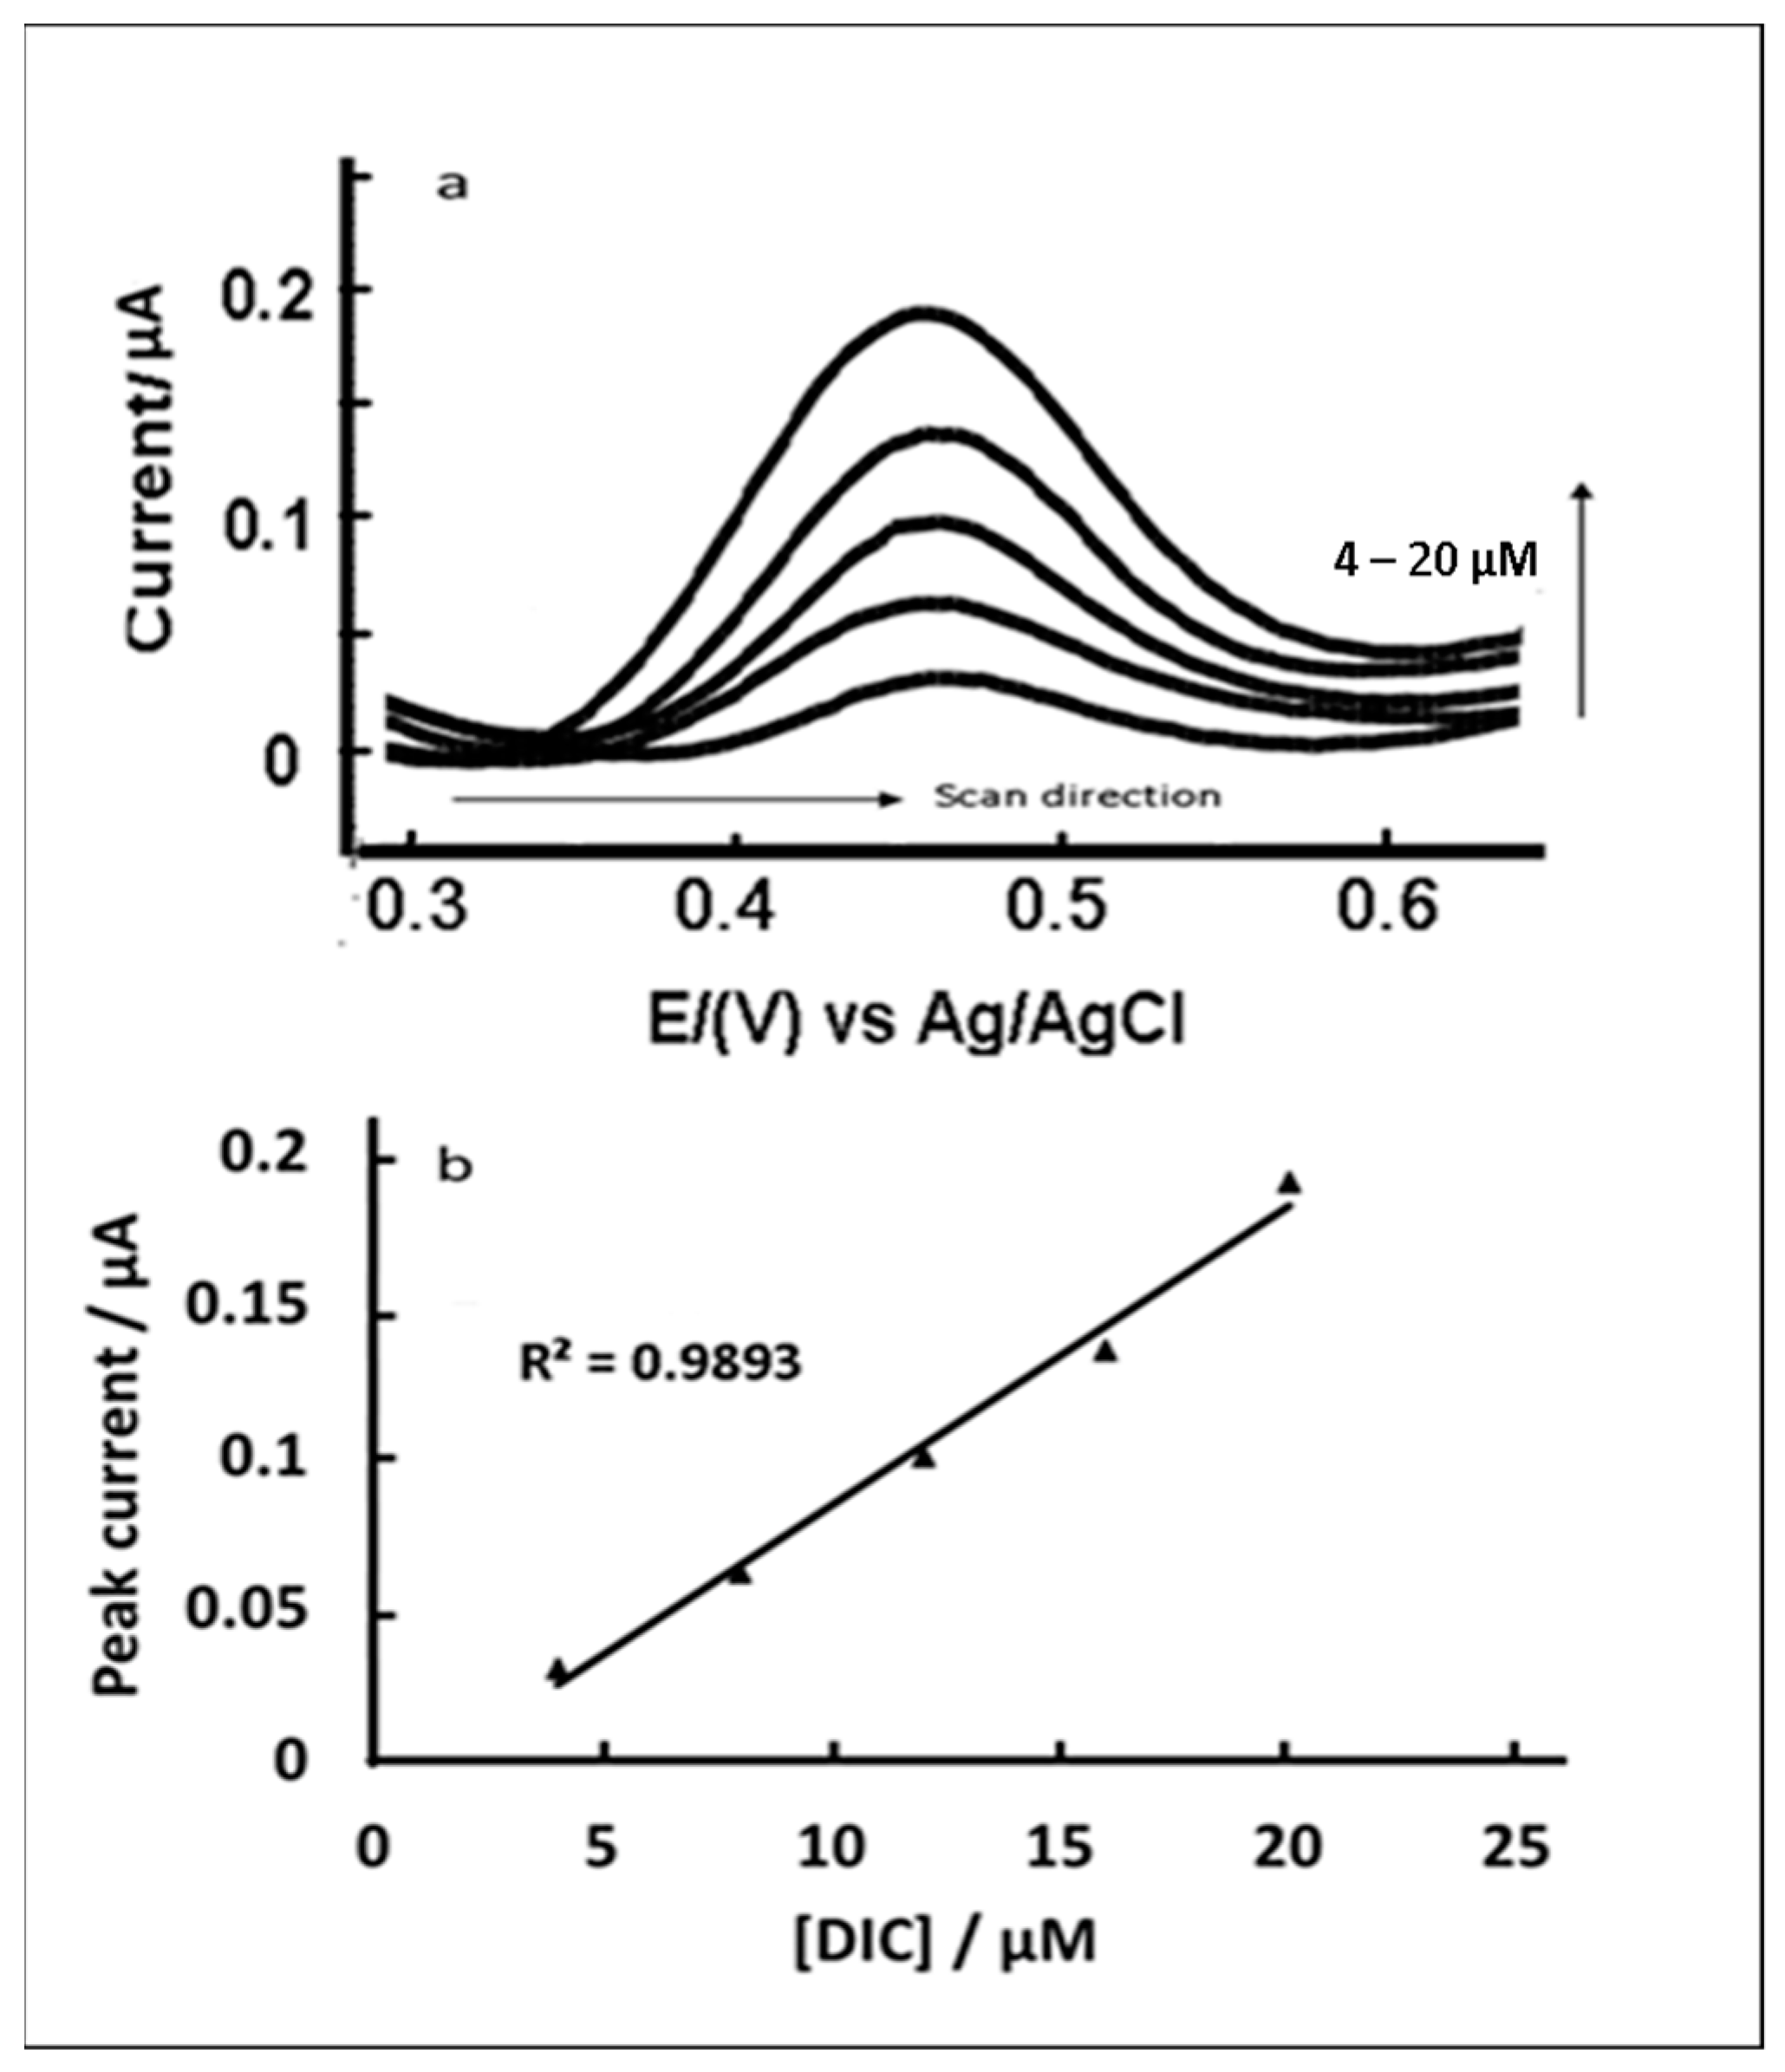
3.3. Differential Pulse Voltammetric (DPV) Analysis at the Micro-ITIES Array

DPV was utilized to evaluate the parameter linearity, the limit of detection (LOD) and the performance of the proposed membrane, wherein it is possible to define better sensitivity of peaks at a lower concentration than the voltammograms obtained by CV. A background electrolyte transfer (absent of DIC) was initially recorded before the background subtraction procedure was utilized to increase the method’s sensitivity. Figure 5a shows the voltammograms obtained for the increased DIC concentrations in the aqueous phase in the range of 4 to 24 μM, with an increment of 4 μM. The voltammograms in Figure 5b exhibited the linearly increased peak current with an increase in the DIC + concentration, with a linear concentration dependence observed within the range studied—Ip(μA) = 0.007 concentration (μM) − 0.0141 (μA), R2 = 0.9794 (n = 5). The potential scan was in the positive direction with the peak potential for DIC   + transfer from the aqueous phase to the organic phase was found to be 0.46 ± 0.01 V.
The LOD is calculated based on 3σ/b, where σ denotes the blank’s standard deviation and b is the curve slope [30]. The LOD is 0.9 ± 0.06 µM, marking an improved membrane use for the 1.5 µM detected using DPV [31]. Electrochemical methods reporting the determination of dibucaine in pharmaceutical formulations and biological samples are scarce, and all these methods are focused on the solid|liquid interface. The suggested method is sensitive and comparable to other approaches. The analytical results of these measurements are summarized in Table 2.

3.4. Determination of Dibucaine in Artificial Serum at the Micro-ITIES Array

The detection of dibucaine in an artificial serum matrix, representing the aqueous phase solution was performed using Cell 2. In this work, artificial serum solutions were divided into two types to investigate the possibility of BSA hampering the determination of DIC   + , as reported previously with some ionized drugs at the liquid|liquid interface [31,40]. As indicated in the experimental section, the first solution was prepared from serum components, without BSA, while the second solution was prepared with BSA at physiological concentration.
Several methods have reported that BSA impedes the detection process, including drug–protein binding, potential window shortening [30,32] or adsorption of protein at the interface [32,40]. An overall BSA charge is approximately −17 at physiological pH [30] and dibucaine (pKa 8.3) has a charge of +1. This difference, in turn, may enhance albumin–dibucaine binding, despite the action of electrolyte ions protecting the charges will partly reduce the binding reaction.
CVs of 100 μM dibucaine in the absence and presence of BSA in artificial serum matrices were conducted, as illustrated in Figure 6a,b. The addition of BSA led to a decrease in the potential window from 900 (in its absence) to 800 mV. As discussed in the previous section, voltammograms demonstrated symmetrical shape, with the dominance of peak-shaped responses over a steady-state behavior on both forward and reverse sweeps (Figure 6a). However, in Figure 6b, with the addition of BSA, the peak current response is less sharp due to drug–protein interaction [32].
It can be observed that the peak current responses for dibucaine in artificial serum without BSA on both forward and reverse sweeps were slightly higher than that in the presence of BSA. Since current responses are proportional to the transporting species’ concentration, this decrement can be suggested as a low concentration of free dibucaine in the aqueous phase. TMA   + was also added for each artificial serum matrix (Figure 6a,b). The half-wave potential of the TMA   + ion was observed to shift to a more negative potential in the presence of BSA, which was from 0.68 V without BSA to 0.64 V with BSA. Similarly, the current responses for TMA + slightly decreased in the presence of BSA in both forward and reverse scans from ~0.2 ± 0.03 (BSA absence) to ~0.1 ± 0.02 µA and from ~ 0.1 ± 0.06 in the absence of BSA to ~ 0.08 ± 0.04 µA in the presence of BSA. This result indicated that BSA was adsorbed at the interface and inhibited the drug ion transfer, as previously reported [32].

3.5. Differential Pulse Voltammetry at the Micro-ITIES Array

DIC detection in two artificial serum matrices to study the impact of BSA on the DIC detection was investigated using DPV. As shown in Figure 7a and Figure 8a, the decrease in the obtained current signal in the serum solution (BSA presence) by CV is also observed with DPV. The potential scan was positive, equivalent to dibucaine transfer from the aqueous phase to the organic phase. Compared to the CV responses, higher current responses were obtained using DPV, denoting an advantage of its enhanced sensitivity, thereby allowing improved detection of dibucaine in artificial serum with BSA.
Figure 7a and Figure 8a display increasing concentrations of dibucaine added to two artificial serum matrices in the absence and presence of BSA, respectively. Voltammograms obtained from both sets demonstrated that BSA affected the transfer process of dibucaine detection by causing reduced peak currents. However, the peak currents were linearly increased with dibucaine concentrations in both artificial serum matrices (Figure 7b and Figure 8b), as depicted by the regression equations: Ip(μA) = 0.0098 concentration (μM) − 0.0145 (μA), R2 = 0.9893 for serum without BSA and Ip = −0.0063 concentration (μM) − 0.036 (μA), R2 = 0.9812 for serum with BSA. In the presence of BSA, the response of peak currents for dibucaine was almost two-fold lower than without BSA. The LOD for dibucaine in artificial serum without BSA was 1.4 ± 0.07 μM, while the detection limit in the presence of BSA was 1.9 ± 0.12 μM. The relative standard deviation (RSD%) and recoveries of the detected concentrations in the serum matrix (BSA presence) are summarized in Table 3. These concentrations were calculated from the regression equation (Figure 8b) as the precision and accuracy of the proposed method. The results demonstrate the validity of the proposed method for determining dibucaine in the serum matrix in the presence of BSA.

4. Conclusions

The voltammetric behavior of ion dibucaine transfer across water|1,6-dichlorohexan at micro-ITIES was investigated via CV and DPV. The experimental voltammograms were contributed by both radial and linear diffusions on the forward scan (producing a combination of steady-state and peak behavior), while a linear diffusion control on the reverse scan (producing peak behavior). This behavior indicates that the diffusion zone overlap exists, and the micro-ITIES is closest to the recessed microinterface behavior. The analytical parameters of simple ion transfer for DIC + were determined to be slightly lower than values from previous studies due to the ion-pair formation of the transferring anion with the supporting electrolyte cation present in the organic phase, as reported previously [50]. Moreover, the DPV method was utilized effectively to detect low dibucaine concentrations, with the LOD of 0.9 ± 0.06 µM. The effect of BSA on the detection of dibucaine was studied at micro-ITIES using voltammetry methods. Higher peak responses of current were recorded for DPV compared to CV responses, denoting its increased sensitivity, consequently allowing for improved detection of dibucaine in artificial serum in the presence of BSA. However, higher peak currents were recorded for dibucaine detection in artificial serum without BSA, as demonstrated in the CVs. These results indicated that BSA affected the detection of dibucaine in artificial serum. Although it was still possible to detect dibucaine in the presence of BSA, the peak current responses were slightly reduced.
On the contrary, the DPV technique was efficiently utilized for dibucaine detection, with an LOD of 1.9 ± 0.12 µM. Further improvements in membrane preparation may enable the controlled location of the ITIES within the pore structure. A lower detection limit might be achieved using differential pulse stripping voltammetry combined with preconcentrating the gel layer’s target, followed by fast stripping [32,56].

Author Contributions

E.M.A.: Formal analysis, investigation, writing—original draft preparation, methodology and data curation. J.A. and N.A.Y.: Supervision, resources and visualization. R.M.Z.: Project administration, conceptualization, writing—review and editing and funding acquisition. All authors have read and agreed to the published version of the manuscript.

Funding

This research was funded by the Putra Grant, Universiti Putra Malaysia (GP-IPS/2018/9618600) and the Libyan Ministry of Education for the scholarship (MOE-LY).

Institutional Review Board Statement

Not applicable.

Informed Consent Statement

Not applicable.

Data Availability Statement

No data Availability.

Acknowledgments

The authors are grateful to the Deputy Dean of Universiti Putra Malaysia and Putra Grant, Universiti Putra Malaysia (GP-IPS), for the support. As one of the authors, Eissa would like to thank the Libyan Ministry of Education for the scholarship (MOE-LY).

Conflicts of Interest

The authors declare no conflict of interest.

References

  1. Girault, H.H. Charge Transfer across Liquid—Liquid Interfaces. In Modern Aspects of Electrochemistry; Springer: Boston, MA, USA, 1993; pp. 1–62. [Google Scholar]
  2. Samec, Z. Electrochemistry at the interface between two immiscible electrolyte solutions (IUPAC Technical Report). Pure Appl. Chem. 2004, 76, 2147–2180. [Google Scholar] [CrossRef]
  3. Malkia, A.; Liljeroth, P.; Kontturi, K. Membrane activity of ionisable drugs—A task for liquid–liquid electrochemistry? Electro-chem. Commun. 2003, 5, 473–479. [Google Scholar] [CrossRef]
  4. Arrigan, D.; Herzog, G.; Scanlon, M.D.; Strutwolf, J.; Bard, A.; Zoski, C. Bioanalytical applications of electrochemistry at liquid-liquid microinterfaces. In Electroanalytical Chemistry: A Series of Advances; CRC Press: Boca Raton, FL, USA, 2013; Volume 25, pp. 105–178. [Google Scholar]
  5. Arrigan, D.W.M. Bioanalytical Detection Based on Electrochemistry at Interfaces between Immiscible Liquids. Anal. Lett. 2008, 41, 3233–3252. [Google Scholar] [CrossRef]
  6. Foster, A.H.; Carlson, B.M. Myotoxicity of local anesthetics and regeneration of the damaged muscle fibers. Anesth. Analg. 1980, 59, 727–736. [Google Scholar] [CrossRef]
  7. Dayan, P.S.; Litovitz, T.L.; Crouch, B.I.; Scalzo, A.J.; Klein, B.L. Fatal accidental dibucaine poisoning in children. Ann. Emerg. Med. 1996, 28, 442–445. [Google Scholar] [CrossRef]
  8. Elsayed, M.M. Rapid determination of cinchocaine in skin by high-performance liquid chromatography. Biomed. Chromatogr. 2007, 21, 491–496. [Google Scholar] [CrossRef]
  9. Izumoto, S.-I.; Machida, Y.; Nishi, H.; Nakamura, K.; Nakai, H.; Sato, T. Chromatography of crotamiton and its application to the determination of active ingredients in ointments. J. Pharm. Biomed. Anal. 1997, 15, 1457–1466. [Google Scholar] [CrossRef]
  10. Zoest, A.R.; Wanwimolruk, S.; Hung, C.T. Simple High-Performance Liquid Chromatographic Method for the Analysis of Quinine in Human Plasma without Extraction. J. Liq. Chromatogr. 1990, 13, 3481–3491. [Google Scholar] [CrossRef]
  11. Šatínský, D.; Chocholouš, P.; Válová, O.; Hanusová, L.; Solich, P. Two-column sequential injection chromatography for fast iso-cratic separation of two analytes of greatly differing chemical properties. Talanta 2013, 114, 311–317. [Google Scholar] [CrossRef]
  12. Cherkaoui, S.; Veuthey, J.-L. Micellar and microemulsion electrokinetic chromatography of selected anesthetic drugs. J. Sep. Sci. 2002, 25, 1073–1078. [Google Scholar] [CrossRef]
  13. Culea, M.; Palibroda, N.; Moldovan, Z.; Abraham, A.D.; Frangopol, P.T. Gas chromatographic study of some local anesthetics. Chromatographia 1989, 28, 24–26. [Google Scholar] [CrossRef]
  14. Ohshima, T.; Takayasu, T. Simultaneous determination of local anesthetics including ester-type anesthetics in human plasma and urine by gas chromatography–mass spectrometry with solid-phase extraction. J. Chromatogr. B Biomed. Sci. Appl. 1999, 726, 185–194. [Google Scholar] [CrossRef]
  15. Mohammad, M.A.; Zawilla, N.H.; El-Anwar, F.M.; El-Moghazy Aly, S.M. Column and thin-layer chromatographic methods for the simultaneous determination of acediasulfone in the presence of cinchocaine, and cefuroxime in the presence of its hydrolyt-ic degradation products. J. AOAC Int. 2007, 90, 405–413. [Google Scholar] [CrossRef] [PubMed] [Green Version]
  16. Essig, S.; Kovar, K.A. Fluorimetric determination of cinchocaine in a pharmaceutical drug by scanning and video densitome-try. Chromatographia 2001, 53, 321–322. [Google Scholar] [CrossRef]
  17. Sakai, T. Simultaneous spectrophotometric determination of dibucaine and chlorpheniramine maleate in pharmaceuticals using thermochromism of ion associates. Analyst 1982, 107, 640–646. [Google Scholar] [CrossRef]
  18. Abdel-Ghani, N.T.; Youssef, A.F.; Awady, M.A. Cinchocaine hydrochloride determination by atomic absorption spectrometry and spectrophotometry. Il Farm. 2005, 60, 419–424. [Google Scholar] [CrossRef]
  19. Shubietah, R.M.; Zuhri, A.Z.A.; Khalid, B.A. Ion-pair Spectrophotometric Determination of Dibucaine. Sci Pharm 2000, 68, 189–200. [Google Scholar] [CrossRef] [Green Version]
  20. Fernandez-Marcote, M.S.; Mochón, M.C.; Sánchez, J.J.; Pérez, A.G. Electrochemical reduction at a mercury electrode and differen-tial-pulse polarographic determination of dibucaine in pharmaceutical ointments. Analyst 1996, 121, 681–685. [Google Scholar] [CrossRef]
  21. Elqudaby, H.M.; Hendawy, H.A.; Souaya, E.R.; Mohamed, G.G.; Eldin, G.M. Sensitive electrochemical behavior of cinchocaine hy-drochloride at activated glassy carbon and graphite pencil electrodes. Int. J. Pharm. Anal. 2015, 40, 1269–1284. [Google Scholar]
  22. Chiniforoshan, H.; Tabrizi, L.; Pourrahim, N. A new Ag-nanoparticle with 4-nitro phenylcyanamide ligand: Synthesis charac-terization and application to the detection of dibucaine, naphazoline, dopamine, and acetaminophen. J. Appl. Electrochem. 2015, 45, 197–207. [Google Scholar] [CrossRef]
  23. Komorsky-Lovrić, Š.; Vukašinović, N.; Penovski, R. Voltammetric Determination of Microparticles of Some Local Anesthetics and Antithusics Immobilized on the Graphite Electrode. Electroanalysis 2003, 15, 544–547. [Google Scholar] [CrossRef]
  24. Arai, K.; Ohsawa, M.; Kusu, F.; Takamura, K. Drug ion transfer across an oil—water interface and pharmacological activity. Bio-Electrochem. Bioenerg. 1993, 31, 65–76. [Google Scholar] [CrossRef]
  25. Kubota, Y.; Katano, H.; Senda, M. Ion-transfer Voltammetry of Local Anesthetics at an Organic Solvent/Water Interface and Pharmacological Activity vs. Ion Partition Coefficient Relationship. Anal. Sci. 2001, 17, 65–70. [Google Scholar] [CrossRef] [PubMed] [Green Version]
  26. Samec, Z.; Langmaier, J.; Trojánek, A.; Samcová, E.; Malek, J. Transfer of Protonated Anesthetics across the Water|o-Nitrophenyl Octyl Ether Interface: Effect of the Ion Structure on the Transfer Kinetics and Pharmacological Activity. Anal. Sci. 1998, 14, 35–41. [Google Scholar] [CrossRef] [Green Version]
  27. Ribeiro, J.A.; Silva, A.F.; Pereira, C.M. Electrochemical Study of the Anticancer Drug Daunorubicin at a Water/Oil Interface: Drug Lipophilicity and Quantification. Anal. Chem. 2013, 85, 1582–1590. [Google Scholar] [CrossRef]
  28. Ortuño, J.A.; Gil, A.; Serna, C.; Molina, A. Voltammetry of some catamphiphilic drugs with solvent polymeric membrane ion sensors. J. Electroanal. Chem. 2007, 605, 157–161. [Google Scholar] [CrossRef]
  29. Collins, C.J.; Arrigan, D.W.M. Ion-Transfer Voltammetric Determination of the β-Blocker Propranolol in a Physiological Matrix at Silicon Membrane-Based Liquid|Liquid Microinterface Arrays. Anal. Chem. 2009, 81, 2344–2349. [Google Scholar] [CrossRef]
  30. Sairi, M.; Arrigan, D.W.M. Electrochemical detection of ractopamine at arrays of micro-liquid | liquid interfaces. Talanta 2015, 132, 205–214. [Google Scholar] [CrossRef] [Green Version]
  31. Almbrok, E.M.; Yusof, N.A.; Abdullah, J.; Zawawi, R.M. Electrochemical Behavior and Detection of Diclofenac at a Microporous Si3N4 Membrane Modified Water–1,6-dichlorohexane Interface System. Chemosensors 2020, 8, 11. [Google Scholar] [CrossRef] [Green Version]
  32. Collins, C.J.; Lyons, C.; Strutwolf, J.; Arrigan, D.W.M. Serum-protein effects on the detection of the β-blocker propranolol by ion-transfer voltammetry at a micro-ITIES array. Talanta 2010, 80, 1993–1998. [Google Scholar] [CrossRef]
  33. Zhao, P.; Zhu, G.; Zhang, W.; Zhang, L.; Liang, Z.; Zhang, Y. Study of multiple binding constants of dexamethasone with human serum albumin by capillary electrophoresis–frontal analysis and multivariate regression. Anal. Bioanal. Chem. 2008, 393, 257–261. [Google Scholar] [CrossRef] [PubMed]
  34. Mallik, R.; Yoo, M.J.; Chen, S.; Hage, D.S. Studies of verapamil binding to human serum albumin by high-performance affinity chromatography. J. Chromatogr. B 2008, 876, 69–75. [Google Scholar] [CrossRef] [PubMed] [Green Version]
  35. Zhang, Q.; Huang, Y.; Zhao, R.; Liu, G.; Chen, Y. Determining binding sites of drugs on human serum albumin using FIA-QCM. Biosens. Bioelectron. 2008, 24, 48–54. [Google Scholar] [CrossRef] [PubMed]
  36. Hu, Y.-J.; Liu, Y.; Sun, T.-Q.; Bai, A.-M.; Lü, J.-Q.; Pi, Z.-B. Binding of anti-inflammatory drug cromolyn sodium to bovine serum albumin. Int. J. Biol. Macromol. 2006, 39, 280–285. [Google Scholar] [CrossRef] [PubMed]
  37. Su, T.J.; Lu, J.R.; Cui, Z.F.; Thomas, R.K. Fouling of ceramic membranes by albumins under dynamic filtration conditions. J. Membr. Sci. 2000, 173, 167–178. [Google Scholar] [CrossRef]
  38. Fechner, P.; Bleher, O.; Ewald, M.; Freudenberger, K.; Furin, D.; Hilbig, U.; Kolarov, F.; Krieg, K.; Leidner, L.; Markovic, G.; et al. Size does matter! Label-free detection of small molecule–protein interaction. Anal. Bioanal. Chem. 2014, 406, 4033–4051. [Google Scholar] [CrossRef]
  39. Carter, D.C.; Chang, B.; Ho, J.X.; Keeling, K.; Krishnasami, Z. Preliminary Crystallographic Studies of Four Crystal forms of Serum Albumin. JBIC J. Biol. Inorg. Chem. 1994, 226, 1049–1052. [Google Scholar] [CrossRef]
  40. Hu, Y.-J.; Liu, Y.; Pi, Z.-B.; Qu, S.-S. Interaction of cromolyn sodium with human serum albumin: A fluorescence quenching study. Bioorg. Med. Chem. 2005, 13, 6609–6614. [Google Scholar] [CrossRef]
  41. Vanýsek, P.; Sun, Z. Bovine serum albumin adsorption on a water/nitrobenzene interface. Bioelectrochem. Bioenerg. 1990, 23, 177–194. [Google Scholar] [CrossRef]
  42. Katano, H.; Senda, M. Voltammetry at 1,6-Dichlorohexane|Water Interface. Anal. Sci. 2001, 17, 1027–1029. [Google Scholar] [CrossRef] [Green Version]
  43. Cretin, M.; Alerm, L.; Bartroli, J.; Fabry, P. Lithium determination in artificial serum using flow injection systems with a selec-tive solid-state tubular electrode based on NASICON membranes. Anal. Chim. Acta 1997, 350, 7–14. [Google Scholar] [CrossRef]
  44. Makarychev-Mikhailov, S.; Shvarev, A.; Bakker, E. Calcium Pulstrodes with 10-Fold Enhanced Sensitivity for Measurements in the Physiological Concentration Range. Anal. Chem. 2006, 78, 2744–2751. [Google Scholar] [CrossRef] [PubMed]
  45. Zazpe, R.; Hibert, C.; O’Brien, J.; Lanyon, Y.H.; Arrigan, D.W. Ion-transfer voltammetry at silicon membrane-based arrays of mi-cro-liquid–liquid interfaces. Lab Chip 2007, 7, 1732–1737. [Google Scholar] [CrossRef] [PubMed]
  46. Bond, A.M.; Luscombe, D.; Oldham, K.B.; Zoski, C.G. A comparison of the chronoamperometric response at inlaid and recessed disc microelectrodes. J. Electroanal. Chem. Interfacial Electrochem. 1988, 249, 1–14. [Google Scholar] [CrossRef]
  47. Strutwolf, J.; Scanlon, M.D.; Arrigan, D.W.M. Electrochemical ion transfer across liquid/liquid interfaces confined within solid-state micropore arrays—Simulations and experiments. Analyst 2009, 134, 148–158. [Google Scholar] [CrossRef]
  48. Osborne, M.; Shao, Y.; Pereira, C.M.; Girault, H.H. Micro-hole interface for the amperometric determination of ionic species in aqueous solutions. J. Electroanal. Chem. 1994, 364, 155–161. [Google Scholar] [CrossRef]
  49. Avdeef, A. The rise of PAMPA. Expert Opin. Drug Metab. Toxicol. 2005, 1, 325–342. [Google Scholar] [CrossRef]
  50. Katano, H.; Tatsumi, H.; Senda, M. Ion-transfer voltammetry at 1, 6-dichlorohexane| water and 1, 4-dichlorobutane|water interfaces. Talanta 2004, 63, 185–193. [Google Scholar] [CrossRef]
  51. Osborne, M.D.; Girault, H.H. Amperometric detection of the ammonium ion by facilitated ion transfer across the interface between two immiscible electrolyte solutions. Electroanalysis 1995, 7, 425–434. [Google Scholar] [CrossRef]
  52. Lam, H.-T.; Pereira, C.M.; Roussel, C.; Carrupt, P.-A.; Girault, H.H. Immobilized pH Gradient Gel Cell to Study the pH Dependence of Drug Lipophilicity. Anal. Chem. 2006, 78, 1503–1508. [Google Scholar] [CrossRef] [Green Version]
  53. Ran, Y.; Jain, N.; Yalkowsky, S.H. Prediction of aqueous solubility of organic compounds by the general solubility equation (GSE). J. Chem. Inf. Comput. Sci. 2001, 41, 1208–1217. [Google Scholar] [CrossRef] [PubMed]
  54. Ensafi, A.A.; Allafchian, A. Potentiometric Sensor for the Determination of Dibucaine in Pharmaceutical Preparations and Electrochemical Study of the Drug with BSA. Bull. Korean Chem. Soc. 2011, 32, 2722–2726. [Google Scholar] [CrossRef] [Green Version]
  55. Elashery, E.A.S.; Frag, E.Y.; Sleim, A.A.E. Novel and selective potentiometric sensors for Cinchocaine HCl determination in its pure and Co-formulated dosage form: A comparative study of in situ carbon sensors based on dif-ferent ion pairing agents. Measurement 2020, 108549. [Google Scholar] [CrossRef]
  56. Goh, E.; Lee, H.J. Applications of Electrochemistry at Liquid/Liquid Interfaces for Ionizable Drug Molecule Sensing. Rev. Polarogr. 2016, 62, 77–84. [Google Scholar] [CrossRef] [Green Version]
Figure 1. The chemical structure of dibucaine hydrochloride.
Chemosensors 09 00015 g001
Figure 2. Schematic diagram of the three-electrode electrochemical cell used to support micro-ITIES arrays.
Chemosensors 09 00015 g002
Figure 3. (a) Background-subtracted voltammograms of DIC + transfer in the concentrations range of 20 to 100 μM, in increment of 20 µM. (b) Voltammograms of 100 µM DIC + with 40µM TMA + (dashed line) across water|1,6-DCH microinterface at scan rate 10 mVs−1. (c) Calibration curve of the forward peak currents (positive scan) and reverse peak currents (negative scan) against DIC + concentrations.
Chemosensors 09 00015 g003
Figure 4. (a) CVs of 100 μM DIC + via water|1,6-DCH microinterface at increasing potential scan rates of 10 to 100 mV s−1, as indicated by the arrow. (b) Peak currents versus the square root of the scan rate on the forward and reverse sweeps.
Chemosensors 09 00015 g004
Figure 5. (a) Differential pulse voltammetry (DPV) of different concentrations of dibucaine hydrochloride (DIC) (as arrow indicates) (4, 8, 12, 16, 20 and 24 µM) at the water|1,6-DCH microinterface. (b) Calibration curve for DIC   + ion transfer.
Chemosensors 09 00015 g005
Figure 6. Cyclic voltammetry at artificial serum|1,6-DCH micro-ITIES array at 10 mV/s(Cell 2). An artificial serum solution (no analyte) (dotted line), 24 µM DIC   + (black line) and 40 μM TMA   + (grey line) for artificial serum without BSA (a) and artificial serum with BSA (b).
Chemosensors 09 00015 g006
Figure 7. DPV (background subtracted) of increasing dibucaine concentrations (4, 8,12, 16 and 20 μM) in artificial serum (BSA absence) at the microinterface array (a). Calibration curve of peak currents vs. concentrations (b).
Chemosensors 09 00015 g007
Figure 8. DPV (background subtracted) of increasing dibucaine concentrations (8,12, 16, 20 and 24 μM) in artificial serum (BSA presence) at the microinterface array (a) Calibration curve of peak currents vs. concentrations (b).
Chemosensors 09 00015 g008
Table 1. The formal transfer potential, the standard Gibbs energy of transfer and the partition coefficient of ionized dibucaine drug in the water|1,6-DCH system.
Parameter D I C +
p K a 8.30 ± 0.12 a
Δ D C H w ° (V)−0.077 ± 0.32
( Δ G t r , D I C 0 ,   w o ) (kJ mol−1)−7.4 ± 0.06
l o g P D I C °   (ionised)1.3 ± 0.02
          l o g P n o c t ° ( neutral ) 4.4 b
D D I C + / cm2 s13.91 ± 0.2 × 10⁻⁶
a,b Data obtained from [53].
Table 2. Comparison of the proposed DPV method with some previous electrochemical methods to determine dibucaine.
InterfaceDetection MethodLinear Range
(μM)
LOD (μM)
± SD
Reference
A graphite pencil|Britton–Robinson bufferDPV
SWV
1.5–18
1–11
0.7± 0.05
0.5 ± 0.06
[21]
An activated glassy carbon|Britton–Robinson bufferDPV
SWV
1.3–14
2–28
0.4 ± 0.002
0.9 ± 0.003
[21]
Silver nanoparticle on glassy carbon electrodeDPV18.5–72.20.002[22]
An ion-selective electrodePotentiometric1–10 0.7[54]
In situ carbon paste electrodesPotentiometric10–10,00010 ± 0.14[55]
Water|1,6-DCHDPV4–240.9 ± 0.06This work
Table 3. Recovery of dibucaine in serum (BSA presence).
Concentration Added (μM)Concentration Founded (μM)
(n = 5 (± SD))
Recovery (%)RSD %
(n = 5)
87.9 ± 0.2398.82.94
1212.1 ± 0.24100.82.03
1616.01 ± 0.22100.11.39
2018.4 ± 0.4922.18
2424.8 ± 0.4103.31.6
SD: standard deviation (n = 5); RSD: relative standard deviation.
Publisher’s Note: MDPI stays neutral with regard to jurisdictional claims in published maps and institutional affiliations.

