Article

Potentiometric Carbon Quantum Dots-Based Screen-Printed Arrays for Nano-Tracing Gemifloxacin as a Model Fluoroquinolone Implicated in Antimicrobial Resistance

1
Pharmaceutical Analytical Chemistry Department, Faculty of Pharmacy, Ain Shams University, Abbassia, Cairo 11566, Egypt
2
Department of Chemistry and Biochemistry, University of Maryland, College Park, MD 20742, USA
*
Authors to whom correspondence should be addressed.
Submission received: 29 November 2020 / Revised: 24 December 2020 / Accepted: 27 December 2020 / Published: 31 December 2020
(This article belongs to the Special Issue Applications of Chemosensors in Real-World Sample Analysis)

Abstract

:
Antimicrobial resistance (AMR) is a neglected issue that poses a serious global threat to public health, causing long-term negative consequences at both humanitarian and economic levels. Herein, we report an unprecedented economic fabrication method of seven potentiometric screen-printed sensors for the ultra-trace determination of gemifloxacin (GEMI) as a model of the fluoroquinolones antibiotics deeply involved in the growing AMR problem. Sensors were constructed by depositing homemade carbon ink on a recycled X-ray sheet, patterned using stencils printed with an office printer in simple, cost-effective steps requiring no sophisticated equipment. Four sensors were modified using carbon quantum dots (CQDs) synthesized from dextrose through a single-step method. Sensors exhibited a linear response in the concentration ranges 10−5–10−2 M (sensors 1, 3 and 4), 10−6–10−3 M (sensor 2) and 10−6–10−2 M (sensors 5, 6 and 7). LOD allowed tracing of the target drug at a nano-molar level down to 210 nM. GEMI was successfully determined in pharmaceutical formulations and different water samples without any pretreatment steps with satisfactory recovery (96.93–105.28% with SD values < 3). All sensors revealed a long lifetime of up to several months and are considered promising tools for monitoring water quality and efficiency of water treatment measures.

1. Introduction

In recent years, antimicrobial resistance (AMR) has presented a growing significant threat to global public health that demands urgent action across different government sectors and society. The emergence of COVID-19 poses serious consequences for the escalating development of AMR as antibiotics are widely used as a part of the treatment protocols in many countries. Furthermore, due to the difficulty in differentiating bacterial pneumonia from other viral pulmonary infections, many patients without bacterial infections receive unnecessary antibiotics [1]. Nevertheless, this problem that has no borders is likely to be overshadowed by the pandemic for some time [2].
Multiple issues concerning the quality of water have drawn global attention recently. Low-income countries, where potable water is already insufficient, are more negatively affected by AMR than wealthier countries, which is a disturbing fact as it highly increases the burden on their healthcare systems as well as their economy [1]. Safe drinking water is becoming rare, and even tap water which was trusted to be safe for domestic use has been proven to be contaminated with different pharmaceuticals, especially antibiotics [3]. This problem originates in surface water which plays a major role in the emergence of antibiotic resistance as unmetabolized antibiotics reach rivers and lakes via several routes [4].
Due to the uncontrolled use of fluoroquinolones, a powerful bactericidal class of antibiotics widely employed in human and veterinarian medicine, increased antimicrobial resistance to this class has been growing and posed a red-light alert to the international authorities [4]. Resistance in Escherichia coli to fluoroquinolones that are most widely used for the treatment of urinary tract infections is widely spread in many parts of the world where this treatment is now ineffective in more than 50% of patients [5]. Most fluoroquinolones are excreted unmetabolized and they enter the water cycle as the parent compounds [4]. Once in the environment, fluoroquinolones possess recognized ecotoxicity effects since they influence aquatic life and humans, causing several toxic acute and chronic effects [6].
Over the past century, evolution in science has led to advancement in analytical techniques allowing the detection and quantitation of minute amounts of pharmaceuticals in water. Most pharmaceuticals in water analyses were conducted by laborious protocols involving pretreatment procedures followed by analytical techniques, mostly chromatographic ones [7]. Potentiometric sensors are preferably used for pharmaceutical ultra-trace detection in the environment as they are eco-friendly, portable, easily designed, allow in situ monitoring, and require small amounts of sample. They also provide sensitive and consistent measurements at affordable costs [8].
The development of screen-printed potentiometric electrodes was a successful step in the way of integrating various chemical processes in single lab-on-a-chip (LOC) devices. Screen-printed sensors have the outstanding advantages of portability, rapid analysis and low sample, reagents, and energy consumption [9]. Therefore, the employment of screen-printing technology in the sequential mass production of miniaturized, reproducible, sensitive, and disposable cost-effective electrodes for the electrochemical trace analysis of a broad range of substances in biomedical, pharmaceutical, and environmental samples is currently experiencing extensive growth [10].
Screen printing offers several advantages over other conventional ways of sensor manufacture, e.g., the sensor area, thickness and composition are easily controlled and modified, statistical validation of experimental results became more feasible by the use of replicate sensors [10] and screen-printed electrodes (SPEs) have longer lifetimes with no significant loss in performance characteristics on storage in dry conditions [11]. Lately, nanoparticles have been confirmed to be important additives enhancing the performance of ion-selective electrodes and reducing electrical resistance [12]. Different carbon-based materials have been extensively used in analytical sensing including carbon nanotubes and graphene [13]. Carbon quantum dots (CQDs) comprise a novel class of carbon nanomaterials that have recently drawn attention due to their fascinating features, which include low cost, low toxicity, good biocompatibility, high light and chemical stability, solubility in water, simple eco-friendly preparation, and widely available carbon precursors [14,15,16]. Until now, CQDs have been used in the electrochemical detection of few materials; these studies showed that CQDs have wide applications in the electrochemical field due to their unique electronic properties [17].
Gemifloxacin mesylate (GEMI), a prominent member of the fluoroquinolone class of antibiotics used worldwide for treatment of pneumonia and acute exacerbations of chronic bronchitis, is known to cause serious adverse effects on natural ecosystems including aquatic natural life and humans [18]. Chemically, gemifloxacin mesylate is [(R, S) -7-[(4Z)-3-(aminomethyl)-4-(methoxyimino)-1-pyrrolidinyl]-1-cyclopropyl-6-fluoro-1, 4-dihydro-4-oxo-1, 8-naphthyridin-3-carboxylic acid mesylate [19] (Figure S1). It is an orally administered broad-spectrum bactericidal agent [20]. Several analytical assays have been reported for the analysis of GEMI including high performance liquid chromatography (HPLC) [21], HPLC coupled with mass spectrometry (HPLC-MS) [20], gas chromatography–mass spectrometry (GC-MS) [22], spectrofluorimetry [23,24] and voltametric assay using screen-printed carbon electrodes [25]. Many of these methods are complicated, require derivatization procedures, sophisticated instrumentation and pretreatment steps and are time and labor consuming. A literature survey showed that there were four reports for the potentiometric determination of GEMI, as shown in Table S1 [19,26,27,28]. However, none of these electrodes were applied for the determination of GEMI in environmental samples and some of them involved the complicated and tedious procedure of manufacturing a molecularly imprinted polymer while others were liquid state ISEs which were less stable, more complicated with inner filling solution and difficult to miniaturize in comparison to their solid-contact, screen-printed counterparts developed in this work.
In this work, we propose a new and simple method of fabrication of seven inexpensive potentiometric screen-printed carbon-based sensors. The fabrication steps do not require any expensive material or sophisticated equipment. Four of the seven developed screen-printed potentiometric sensors were modified using CQDs. Different factors affecting the analytical performance were studied and optimized and the analytical application of the developed sensors was evaluated through the determination of GEMI in pharmaceutical formulations and its ultra-trace analysis in different water samples without any pretreatment steps. This presents a distinct advantage for continuous monitoring of the quality of drinking water and environmental water samples.
This research is significant as it addresses several issues. First, from a practical point of view, it presents an easy, cost-effective method for the production of screen-printed carbon-based potentiometric sensors on a large scale. Second, it can be applied to minute sample volumes with no sample preparation and extraction steps for detecting GEMI in ultra-trace amounts. Third, the effect of CQD incorporation was evaluated and explained. Fourth, to the best of our knowledge, a unique membrane in one of the sensors including an ion pair, ion additive and cyclodextrin was explored for the first time. Fifth, we studied offline sample analysis; however, the developed sensors can be easily applied to in-line monitoring of different chemicals and pharmaceuticals in complex matrices as they are portable, microfabricated and depend on a surface phenomenon, not on column specifications nor optical path length.

2. Materials and Methods

2.1. Apparatus

A pH meter (Jenway) 3510 PH/mV/°C meter coupled with a Ag/AgCl, double junction reference electrode (Thermo Scientific Orion 900200), model 63,178 USA 314-771-5750, and a digital ion analyzer (Jenco model 3330, Essex, UK) were utilized for potentiometric measurements. A pH glass sensor (Jenway model 3510, Staffordshire, UK) was employed for pH adjustments. A magnetic stirrer and heater (Bandelin Sonorex), model RX510S (Hungary), was used in stirring and temperature adjustment. A Witeg Ultrasonic Cleaner Set, model WUC-D06H (Korea), and a Sorvall™ WX+ ultracentrifuge (Thermo Scientific™ (Waltham, MA, USA)) were used for carbon quantum dot preparation. A Malvern Zetasizer (Malvern, UK), a JEOL JEM-2100 high-resolution transmission electron microscope (München, Germany) and a Bruker D8 DISCOVER X-ray diffractometer (Billerica, Massachusetts, USA) were used for the characterization of CQDs.

2.2. Chemicals and Reagents

Chemicals and reagents used were of analytical grade, while the water used was deionized (DI). Glucose anhydrous was purchased from Alpha Chemika (Mumbai, India). Graphite powder was purchased from Nice Chemicals (P) LTD (Kerala, India). Sodium tetra phenyl borate (NaTPB), and polyvinyl chloride (PVC) of high molecular weight were purchased from Fluka (Seelze, Germany). Acetone, cyclohexanone, sodium hydroxide, sodium dodecyl sulphate (SDS), sodium chloride, potassium chloride, zinc sulphate and hydrochloric acid (HCl) were purchased from El Nasr Company (Cairo, Egypt). β-cyclodextrin hydrate was bought from Sigma-Aldrich (Steinheim, Germany). Dioctyl phthalate (DOP) was obtained from Acros Organics (Morris Plains, NJ, USA). Tetrahydrofuran (THF) of HPLC grade was acquired from Qualikems Fine Chem PVT. LTD. (Delhi, India). Gemifloxacin mesylate (GEMI) pure sample, with 99.61% purity according to the reported reference method [29], tobramycin, gentamycin, streptomycin, and moxifloxacin were kindly supplied by NODCAR (Cairo, Egypt). Citrate buffer (1 × 10⁻³ M), pH 3, was prepared by mixing citric acid solution with sodium citrate dihydrate solution [30].

2.3. Pharmaceutical Formulation

Quinabiotic® tablets labeled to contain 400 mg GEMI (equivalent to 320 mg Gemifloxacin), batch no. (190095A, 190401A), produced by Utopia Pharmaceuticals (Cairo, Egypt), were acquired from the Egyptian market.

2.4. Stock Standard Solution

Stock solution of GEMI (1 × 10⁻² M) was freshly prepared by dissolving a certain amount of the drug in deionized water followed by using citrate buffer pH 3 to complete the volume to 100 mL. Preparation of working solutions in the concentration range (1 × 10⁻⁸) to (1 × 10⁻³ M) was performed by using citrate buffer pH 3 to dilute suitable aliquots from the freshly prepared stock solution (1 × 10⁻² M).

2.5. Water Samples

Representative river water samples were acquired from several locations along the Nile River (Giza, Egypt), while tap water samples were collected from a home (Cairo, Egypt) at different time intervals. All samples were directly stored in amber glass bottles with polypropylene open-top screw caps and Teflon-silicon septa. The bottles, pre-rinsed with water of ultra-pure grade, were filled with no headspace remaining, immediately labelled, and kept at 4 °C during lab transport. Upon receiving them, the received samples were filtered then kept at 4 °C until being analyzed, when they were spiked with different GEMI concentrations and then immediately measured.

2.6. Procedures

2.6.1. Preparation of CQDs

Amorphous CQDs were prepared according to Siddique et al. [31,32] with some modifications to remove large-sized particles. This was achieved by simple ultrasonication of a 1:1 (volume ratio) mixture of 1 M dextrose solution and concentrated HCl. After 12 h of sonication, the brown-colored solution was oven-dried at 80 °C under ambient pressure for 24 h. The obtained dark brown powder was dissolved in DI water, sonicated for 10 min, left to settle overnight and then filtered on filter paper (Whatman) followed by filtration using a 0.45-µm filter. The filtrate, yellowish-brown containing fine dispersion of CQDs, was then ultra-centrifuged at 55,000 rpm using Falcon tubes (15 mL) until precipitation of the black CQDs.

2.6.2. Characterization of the Prepared CQDs

X-ray diffraction (XRD) was conducted to investigate the crystalline property of the synthesized CQDs, and its size was determined using a Malvern Zetasizer and high-resolution transmission electron microscopy (HRTEM).

2.6.3. Preparation of CQDs Solution

The prepared CQDs were dispersed either by using 1% w/w SDS solution or THF. The SDS-CQDs dispersion was prepared by dissolving 200 mg CQDs in 1% w/w SDS solution followed by sonication for 30 min to obtain 0.2% w/w solution. The THF-CQDs dispersion was prepared by dissolving 100 mg CQDs and 20 mg PVC in 37 mL THF followed by sonication for 2 min.

2.6.4. Preparation of the Ion Pair

The preparation of the ion pair was initiated by adding 20 mL of GEMI saturated aqueous solution to 20 mL of saturated NaTBP aqueous solution. The produced off-white precipitate was filtered, washed with water, and ground to a fine powder after drying at ambient temperature. The obtained complex was used for fabrication of sensors 1, 4 and 6 as well as sensor 3 in combination with β-cyclodextrin as an ionophore.

2.6.5. Preparation of Homemade Graphite Ink

Homemade graphite ink was prepared according to Khaled et al. [33] by thoroughly mixing 1.8 g DOP, 5 g 8% PVC cyclo-hexanone: acetone solution (1:1, v/v) and 3 g graphite powder. The homemade carbon ink was then used for the printing of sensors 1–5.

2.6.6. Preparation of the Homemade Graphite- CQDs Ink

The preparation of the homemade graphite- CQDs ink was achieved by thoroughly mixing 1.8 g of DOP, 5 g of 8% PVC cyclo-hexanone: acetone solution (1:1, v/v), and 3 g of graphite- CQDs mixture (1:9). The homemade graphite-CQDs ink was then used for the printing of sensors 6 and 7.

2.6.7. X-ray Sheet Recycling

A used X-ray sheet was recycled by dipping in concentrated Nitric acid for about 5 min then washed with water to clear off all pigmentation.

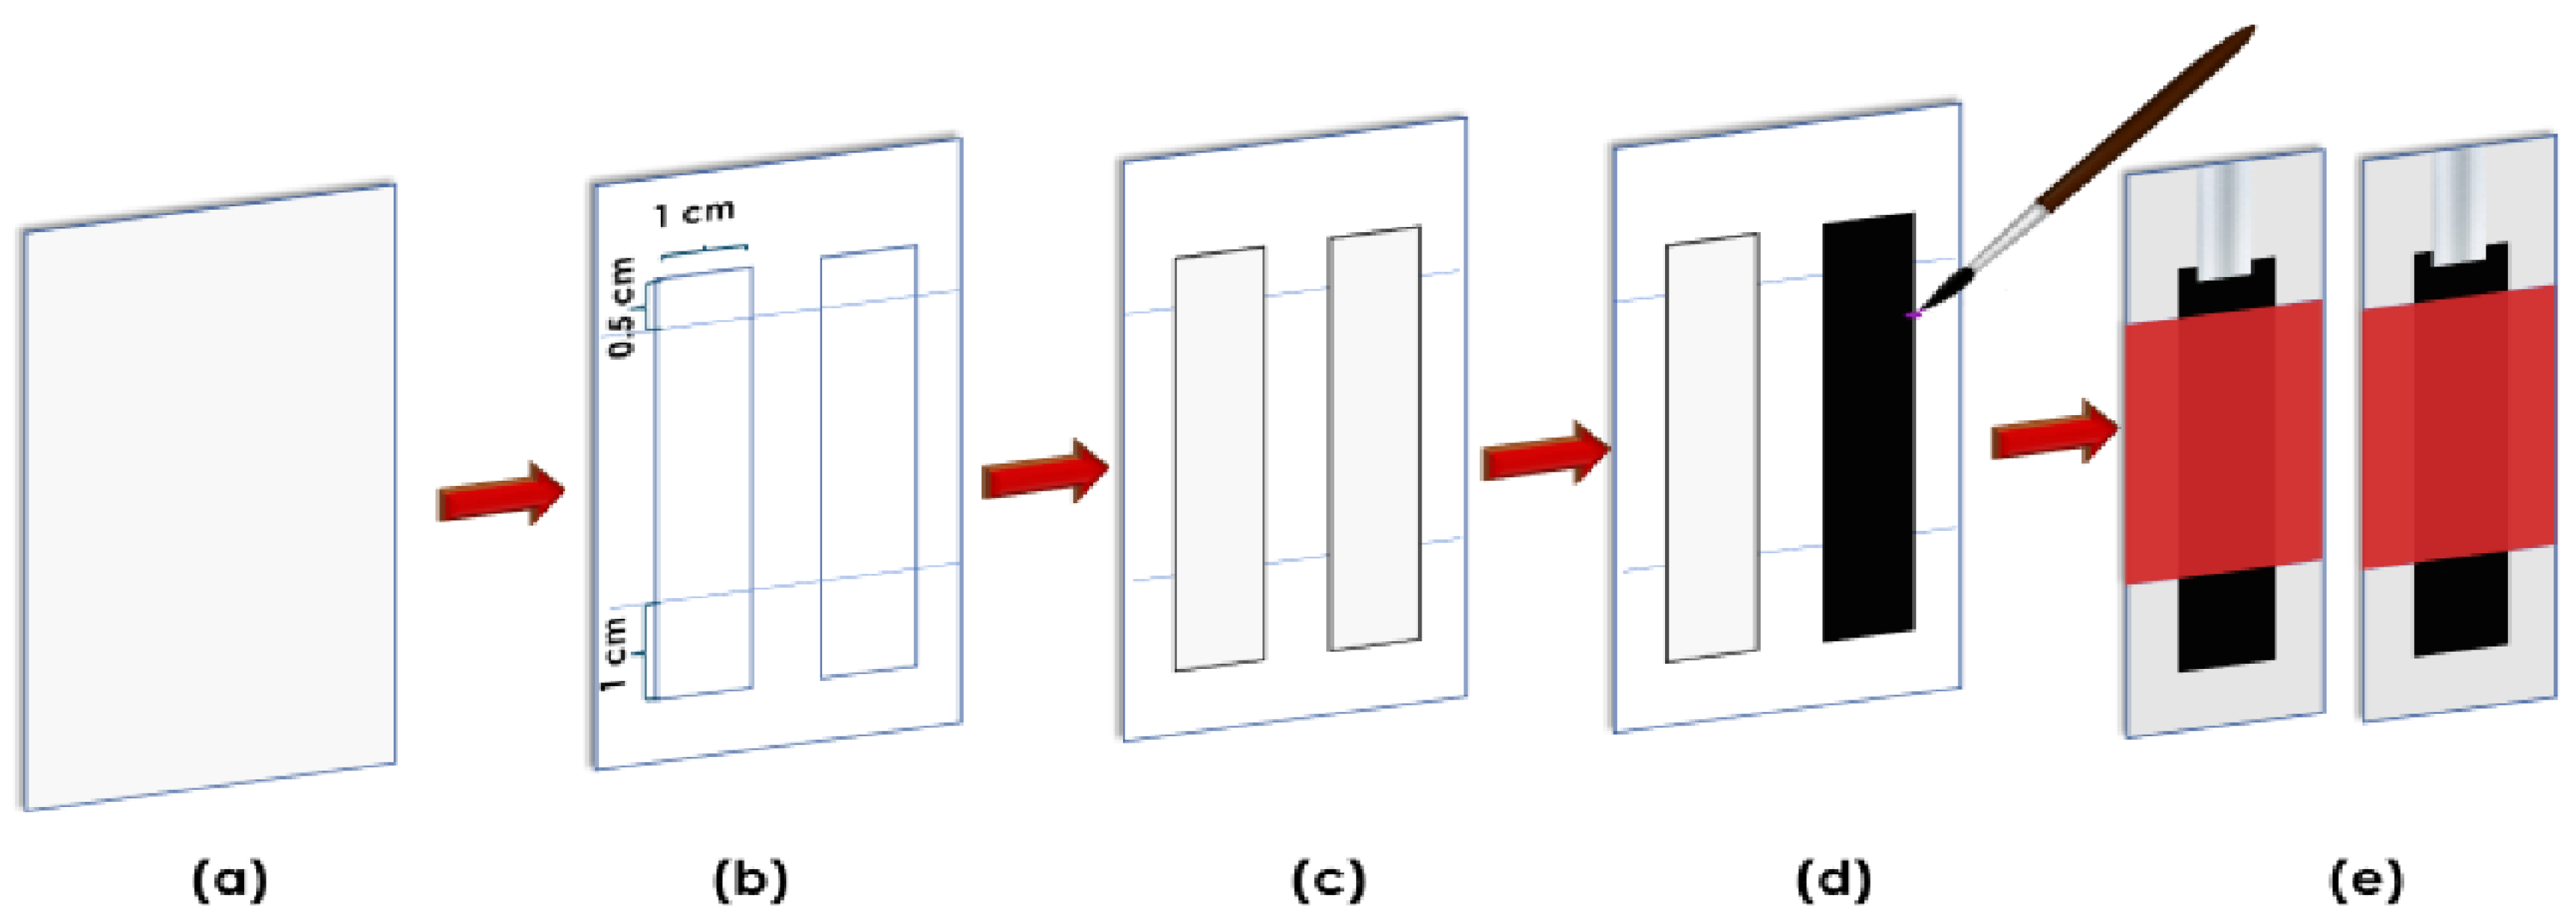
2.6.8. Sensors Fabrication

The potentiometric sensor strips were printed on a recycled X-ray sheet (dimensions 10 mm width × 35 mm length). The fabrication of the potentiometric working electrodes was performed in arrays of eight. A pattern printed on a self-adhesive stencil sheet is placed on the recycled X-ray sheet and used to delimit the electrode area to reproducibly obtain equal dimensions of the electrodes. Once the electrode region is determined by the cut pattern, the conducting ink was carefully painted on the delimited surface using a suitable brush. The working electrodes were printed using either the prepared homemade graphite ink for sensors 1–5 or homemade graphite- CQDs ink for sensors 6 and 7. The printed electrodes were heat treated at 60 °C for 30 min for sensors 1–5 and at 60 °C for 180 min for sensors 6 and 7, and all were stored dry at ambient temperature when not in use. After curing, the self-adhesive stencil was peeled off the X-ray sheet, removing the excess carbon ink with it. The printed sensors were covered with an insulating layer, leaving a specific square-shaped (10 mm × 10 mm) working area for applying the ion-sensing cocktail and a rectangular area (10 mm × 5 mm) painted with silver paint on the opposite end for electrical connection. The scheme of screen printing of the suggested sensors is shown in Figure 1.
The ion-sensing cocktail compositions for the suggested screen-printed sensors (1–7) are given in Table 1. All cocktails were mixed in a petri-dish and then homogenized into a smooth paste. They were then applied to the square-shaped working area of each sensor, left to dry overnight, and stored dry at ambient temperature when not in use.
After assembly, each sensor was conditioned by soaking in 10−2 M GEMI aqueous solution for 1 h before the start of measurements.

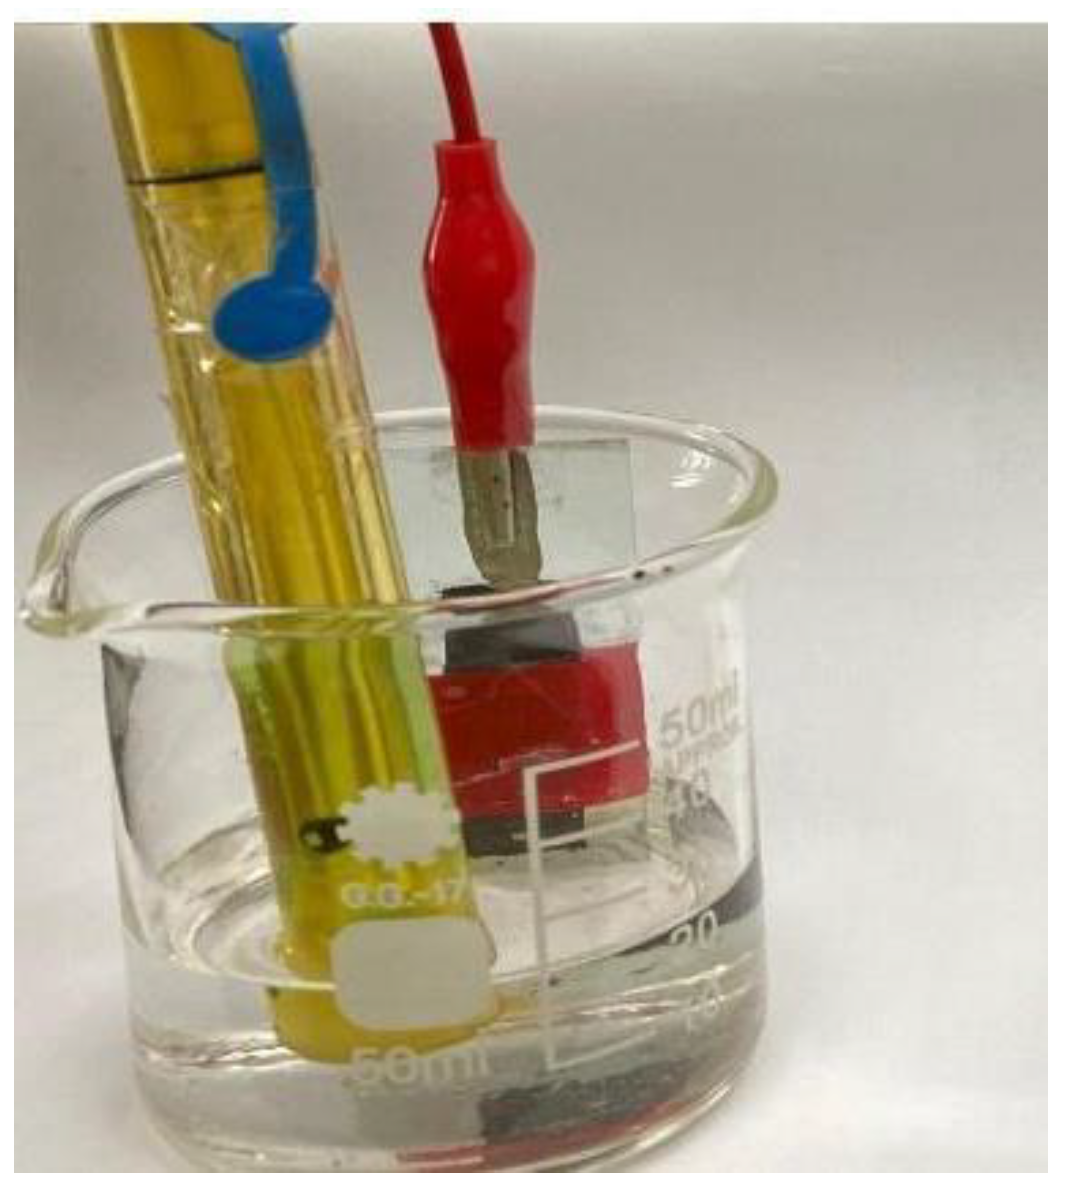
2.6.9. Sensors Calibration

Calibration of the proposed sensors was performed by transferring aliquots of GEMI over the concentration range of (1 × 10⁻⁸–1 × 10⁻² M) into six 50-mL beakers. Potential readings were recorded against a silver/silver chloride reference electrode after stabilization for all sensors (Figure 2).
Calibration curves of potential readings versus logarithmic GEMI concentration were constructed and regression equations were calculated for the linear region of the curve for each sensor.

2.6.10. Application to Pharmaceutical Formulation

Seven Quinabiotic® tablets were weighed to determine the average weight of a Quinabiotic® tablet. An accurate weight of finely ground tablets equivalent to 0.485 g GEMI was transferred into 100 mL volumetric flask and completed to the mark with citrate buffer pH 3 to prepare 1 × 10⁻² M stock solution. Suitable dilutions were made from the prepared stock to obtain 10−5, 10−4 and 10−3 M samples of Quinabiotic®. The prepared samples were potentiometrically measured using the developed sensors and the recovery values of GEMI were calculated from the suitable regression equations.

2.6.11. Application to Spiked Water Samples

Determination of GEMI in spiked tap and river water samples was accomplished by separately preparing appropriate dilutions of working standard solutions either by tap water or river water after filtration. The sensors were separately dipped in the spiked water samples and potential values were recorded. Between measurements, sensors were washed using deionized water. Concentrations were computed using the previous regression equations.

3. Results and Discussion

The extensive versatility displayed by SPEs lies in the broad range of ways available for modification of such electrodes. One of such modifications is the incorporation of carbon quantum dots in its fabrication, either in the printing ink or in its sensitive membrane, since the carbon-based nanomaterials improve the sensor performances by enhancing the conductance and transduction of the chemical to electrical signal resulting in lowering the detection limits, especially for residual pollutants in environmental samples [13].

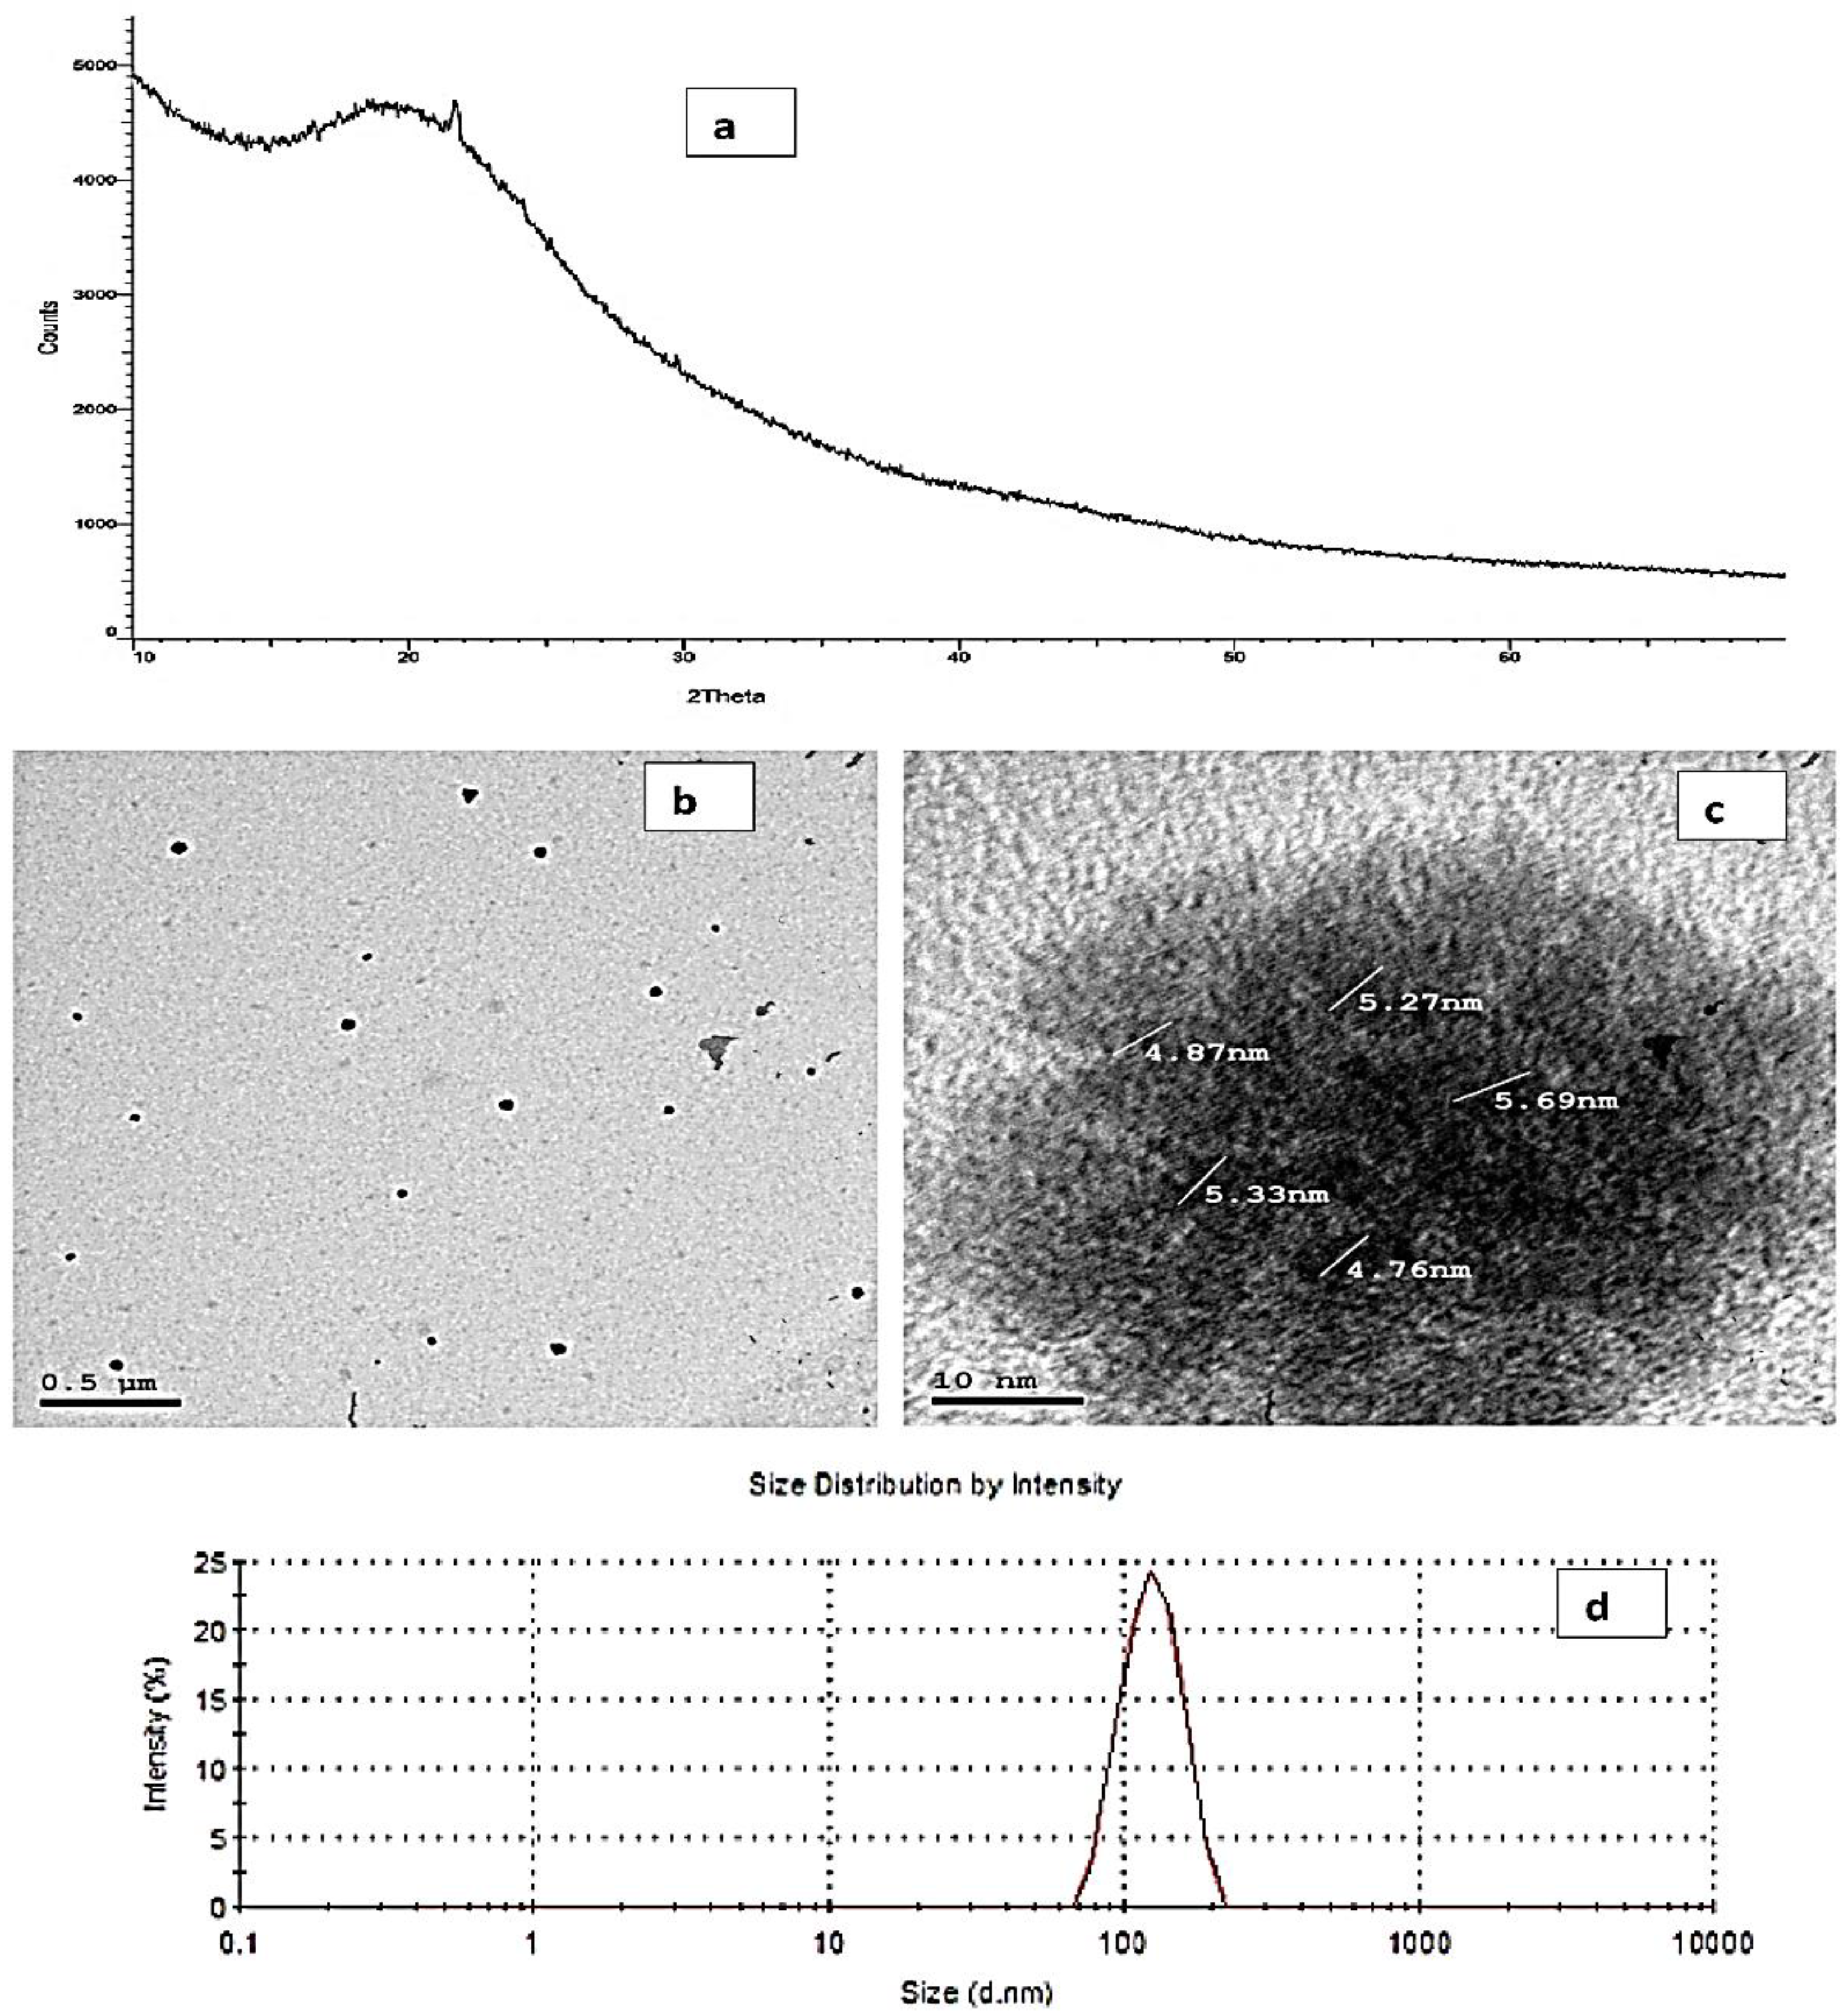
3.1. Preparation and Characterization of CQDs

The acid-assisted ultrasonic chemical method using dextrose as a carbon precursor was used for preparation of CQDs. Some slight modifications of the original method [31,32] were carried out to ensure the efficient separation of carbon nanoparticles from other larger microparticles, thus obtaining CQDs of small, homogenous, almost similar size.
A very light yellowish fine dispersion of CQDs was obtained after filtration on a 0.45-µm filter. X-ray diffraction (XRD) and HRTEM were used for structural characterization of the prepared CQDs. In Figure 3a, XRD patterns show a broad (002) diffraction peak at 21.7° which corresponds to graphitic structure, suggesting the carbonization of dextrose giving amorphous carbon composed of randomly oriented nanoparticles as it is a typical band confirming the formation of amorphous CQDs [34]. The examination of high-quality HRTEM images showed that the obtained CQDs are less than 10 nm in size (Figure 3b).
The particle sizes of the prepared CQDs were estimated using dynamic light scattering (DLS) which displays that the hydrodynamic diameters of CQDs are different, ranging from 120 to 210 nm (Figure 3c).

3.2. Fabrication of Screen-Printed Sensors

Seven different screen-printed sensors were easily fabricated by a novel, simple, cost-effective, and eco-friendly method. The method facilitates the production of a large number of reproducible electrodes in a short time.
A recycled X-ray sheet was used as the solid support on which the sensors were printed. A self-adhesive stencil sheet, on which the pattern was printed, was used to ensure the production of reproducible sensors with exactly the same dimensions.

3.2.1. Preparation of Homemade Conducting Inks

In electrochemical applications, the chemical composition of the ink is important. Ink should include a conducting filler (graphite), a non-conducting binder (PVC) and a volatile solvent (THF). A plasticizer (DOP) is also added to produce a flexible ink that can be easily brushed as a homogenous layer as the plasticizer molecules spread through the polymer, reducing polymer–polymer interactions (van der Waals forces), blocking the formation of a rigid network and leading to enhanced flexibility, softness, and elongation [35]. A carbon content of about 32% was chosen as an optimum amount for the proposed sensors, leading to a reasonable ohmic resistance with adequate adhesion to the X-ray sheet [36].
After printing, the screen is cured in an oven to ensure the dryness of the ink and the evaporation of the solvent, leaving the conducting filler cemented into the binder. The conducting ink employing graphite as a filler was used in sensors 1–5, while for sensors 6 and 7, the conducting filler was a mixture of graphite and CQDs dispersed in SDS, as the exceptional electrical properties of the nanostructures make them important transducing enhancers in different sensing systems. Besides, it was proven by Abed Al Ameer et al. [37] that the electrical conductivity increased by using mixtures of carbon fillers in different ratios. Different ratios of CQDs: graphite were tried such as 50:50, 70:30 and 90:10. CQDs: graphite in the ratio 90:10 was chosen as it improved the sensors’ analytical performance in terms of reproducibility of response and achieving a near-Nernstian slope.
CQDs are known to aggregate into packed bundles due to the presence of highly attractive van der Waals forces between them, and several studies of CQDs showed the presence of tiny nanoparticles as well as particle aggregates even in diluted solutions [38,39]. HRTEM results show average sizes of CQDs (4–6 nm) that are evidently smaller than those estimated by DLS. This discrepancy is essentially due to the fact that DLS measurements determine the overall hydrodynamic diameter and are sensitive to dynamic aggregation, agglomeration, etc. Accordingly, it is evident that some single CQDs aggregated, forming nanosized clusters which caused the increase in the average diameter, and thus, the aqueous solution always contains single CQDs and nanosized clusters co-existing together [38,40]. With the aid of ultrasonication, SDS was efficiently employed to disperse the prepared CQDs in aqueous medium owing to the adsorption energy between the SDS molecules and CQDs [41,42,43,44].

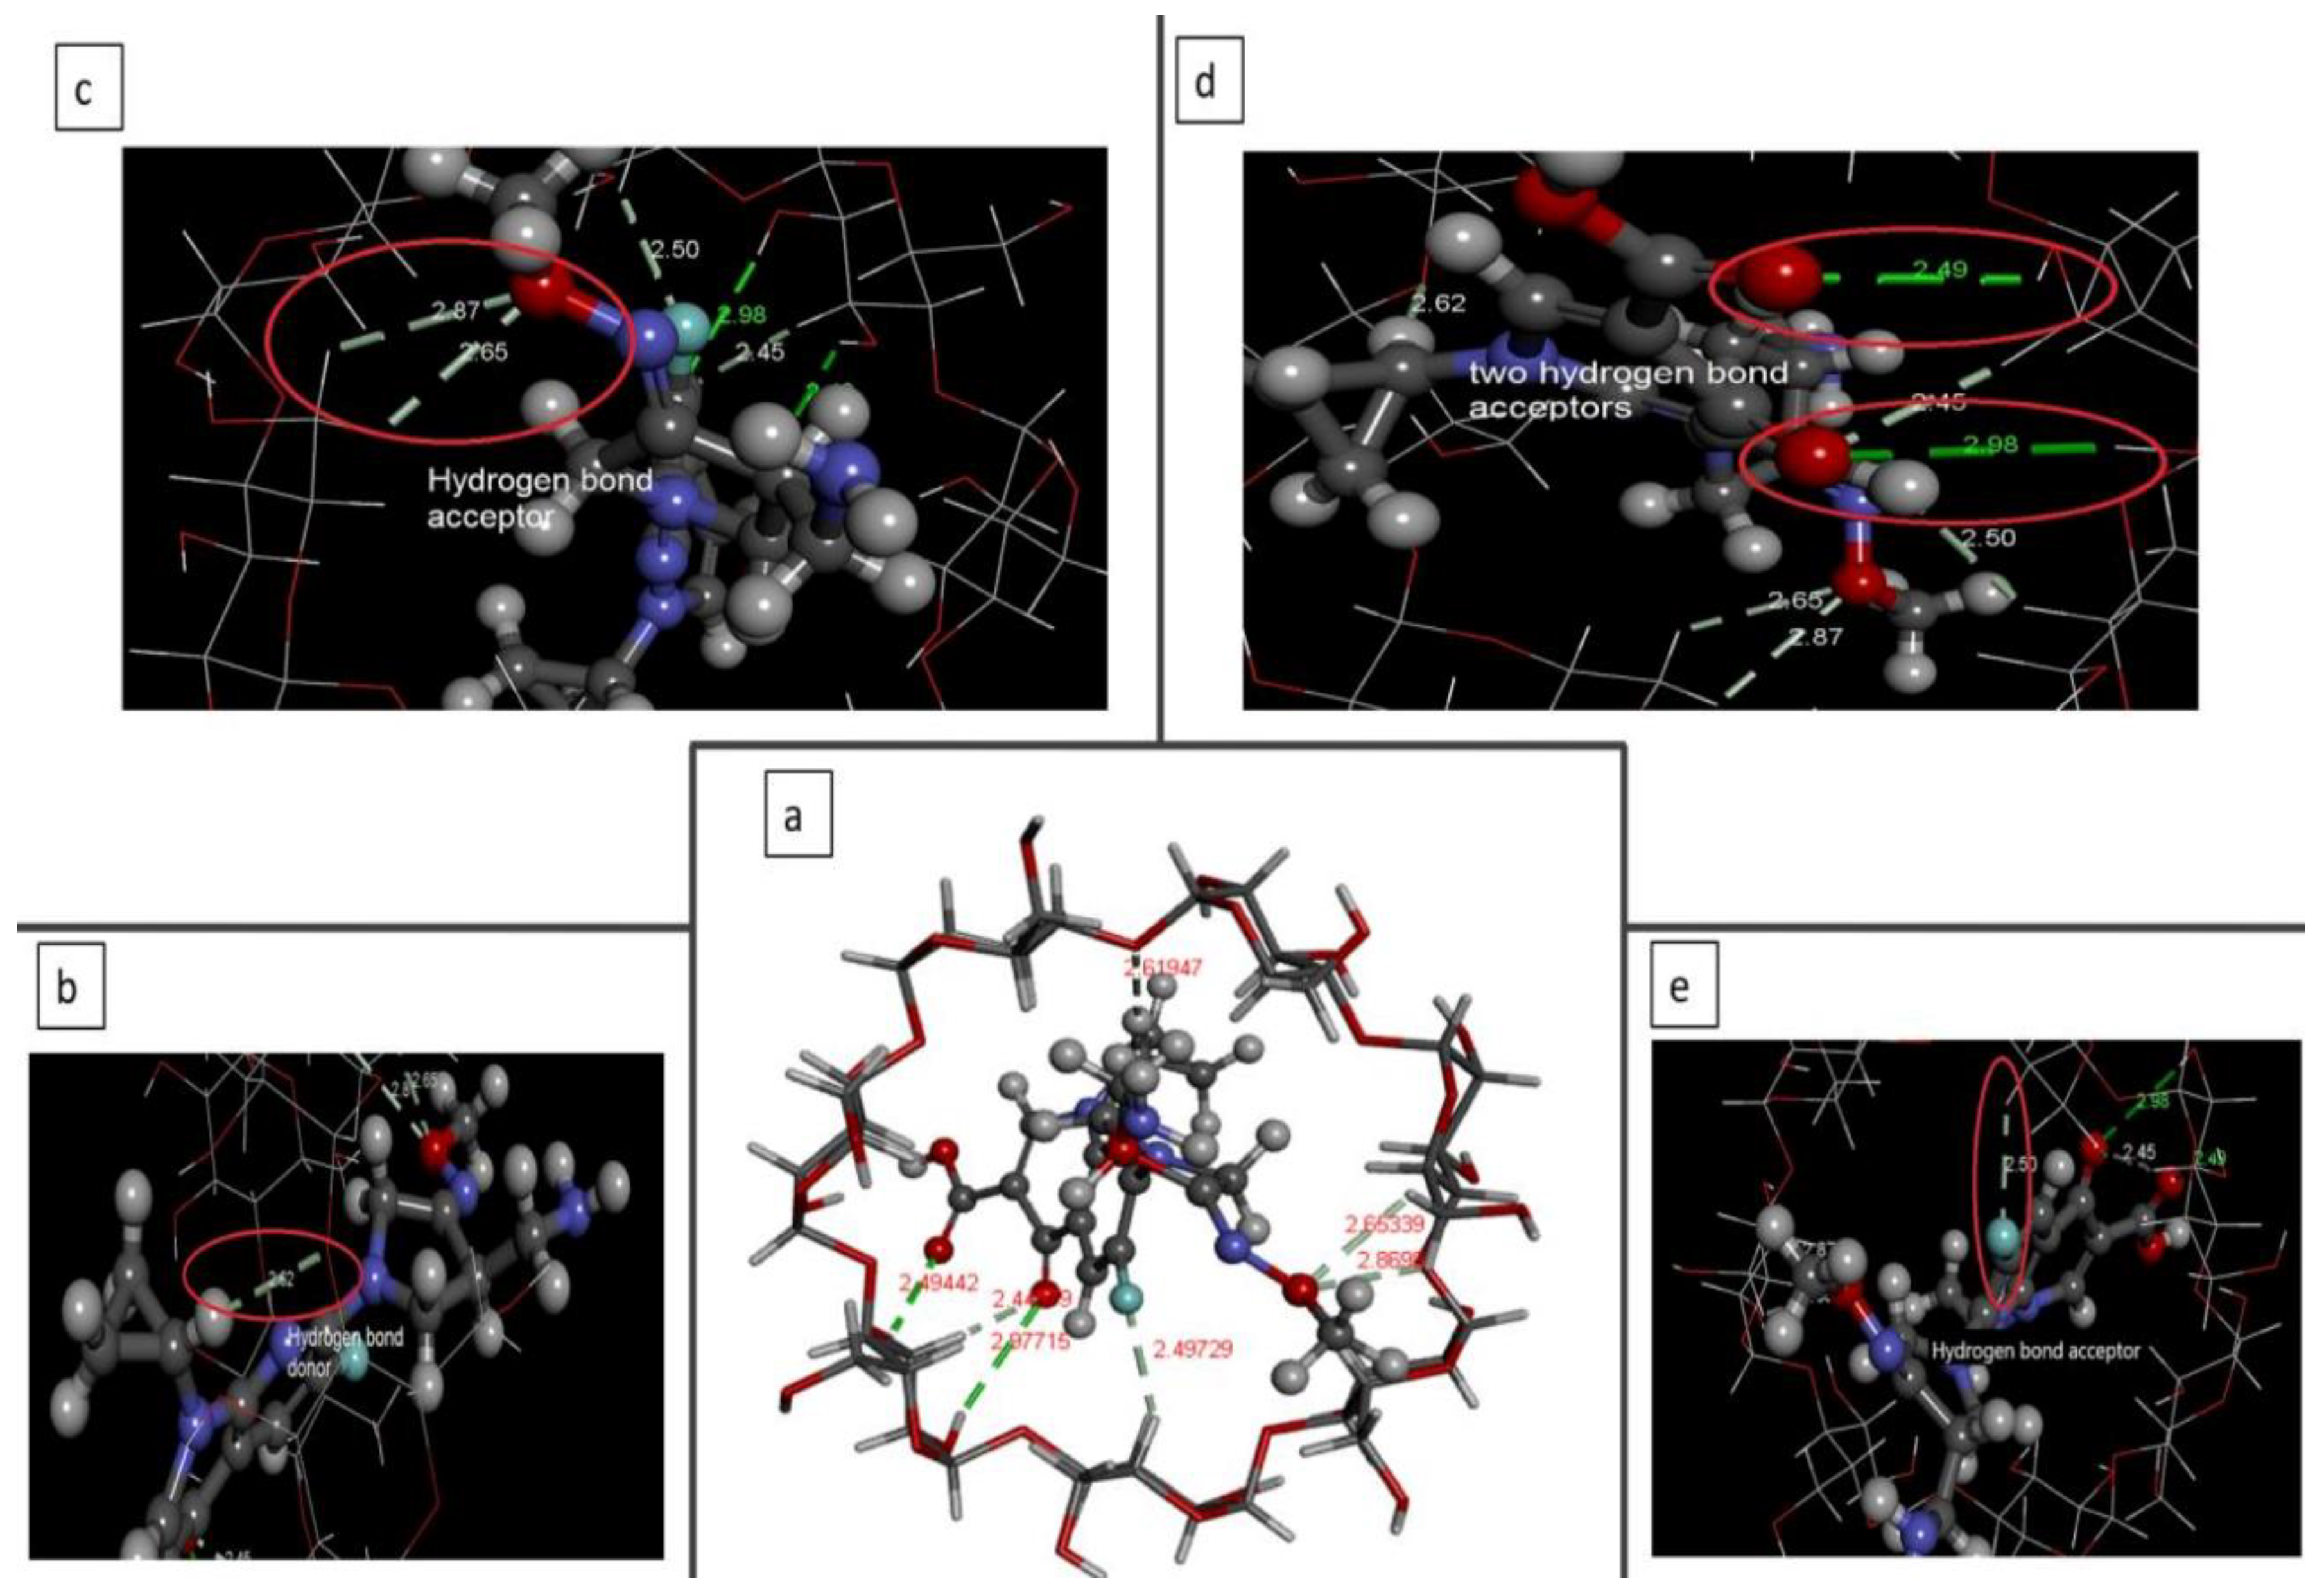
3.2.2. Preparation of the Sensitive Membranes

The sensitive membranes were prepared based on either the precipitation-based technique (sensors 1, 4 and 6) or the ionophore-based technique (2, 5 and 7), or a combination of both (sensor 3).
Sensors 1, 4 and 6 employ an ion pair of cationic GEMI with anionic sodium tetraphenylborate as ion exchange sites in the polymeric membrane.
GEMI reacted with sodium tetraphenyl borate forming a 1:2 water-insoluble ion pair which has optimum particle size and low solubility product. This ratio was confirmed by the Nernstian response of the proposed sensors which was about 30 mV, typical for divalent substances. Since the electrode responds to the analyte activity rather than concentration, the Nernstian slope slightly departs from the ideal value (30 mV).
The high molecular weight PVC, which provides a regular support matrix and confines the sensed ions, develops the need for a plasticizer which affects both the consequent physical and mechanical characteristics of the elastic product. Optimum physical characteristics of the membrane and high mobility of ions are obtained by using suitable quantities of plasticizer [45]. In our study, different quantities of DOP were tested at 250, 350 and 450 mg; it was found that on using 250 and 350 mg DOP, the flexibility of the membrane was very low, and the handling of the membrane was difficult, whereas 450 mg DOP produced flexible plastic and easily handled membrane. Thus, 450 mg DOP was used as the most appropriate plasticizer quantity.
In the ionophore-based technique used in sensors 2, 5 and 7, molecular recognition and inclusion complex formation are paramount for host–guest interactions [46]. In aqueous, non-aqueous and mixed media, supramolecular inclusion complexes can be formed between cyclodextrins and many organic ions and molecules [24]. The hydrophobic moiety of the guest molecule is entrapped into the hydrophobic cavity of the cyclodextrins, resulting in a non-polar/non-polar association complex and reduction in cyclodextrin ring strain, leading to a more stable lower energy state [47]. This interaction was investigated using molecular modeling on Discovery Studio v20.1.0.19295. The high negative ∆G values for the proposed orientation indicate the formation of a stable inclusion complex whose geometry is shown in the provided video. This orientation is more favorable compared to other studied orientations where the guest molecule is deeply anchored inside the host cavity in a way that maximizes the van der Waals intermolecular as well as hydrophobic interactions between the two molecules (Figure 4a). The thermodynamic results indicate that the inclusion process is exothermic and the suggested molecular model displays the presence of many hydrogen bonds between the host and guest molecules whose bond distances were found to be 2.49, 2.45, 2.98, 2.62, 2.87, 2.65 and 2.5 Å, showing the formation of strong hydrogen bonding which notably contributes to the stability of inclusion complexes (Figure 4b–e). The interacting groups in the host and guest molecules are shown in Figure 5a,b. These findings indicate that the guest molecule is firmly secured in the host cavity which is usually accompanied by the release of the high energy water molecules from the cavity of the host and the dehydration of the guest molecule hydrophobic part [24].
The incorporation of sodium tetraphenyl borate as an ion additive enhances the ionic mobility in the sensor matrix, reduces the anion interference of ISEs and decreases the membrane resistance of neutral carrier-based microelectrodes [48].
Sensor 3 is unprecedented in its fabrication; the sensitive membrane is based on the use of the two techniques—the ionophore technique (cyclodextrin and sodium tetraphenyl borate) and the precipitation-based technique (ion pair of GEMI with tetraphenyl borate).
In sensors 4 and 5, THF-dispersed CQDs were incorporated in the sensitive membrane to study the effect of introducing a carbon nanostructure with a high specific surface area on the electrode performance. CQDs prepared by carbonization of dextrose have C=O, C=C and OH as surface groups, which render the prepared CQDs hydrophilic in nature [31]. THF as a volatile aprotic solvent has both polar and non-polar characteristics and it is compatible with other components used in membrane fabrication. Thus, THF is the most suitable solvent to disperse CQDs incorporated in the membrane [49].

3.3. Effect of Soaking Time

Activation of the sensitive surface membrane is significant to form a thin layer where ion exchange occurs [50]. This was achieved by soaking it in 10−2 M GEMI solution at different times according to diffusion and interface equilibration. For the proposed sensors, different soaking times were assessed such as 0.5, 1, 2 and 24 h to obtain the best preconditioning process. Reproducible slope values and excellent response properties were obtained by soaking the sensors for 1 h. Longer soaking times negatively affect the sensors’ responses, which is due to leaching of the membrane ingredients to the solution. The sensors were stored dry, at room temperature, in closed vessels when not in use.

3.4. Effect of pH

Fluoroquinolones have carboxylic and amino ionizable groups [51]. At different pH values, GEMI can exist in either anionic, cationic, or amphiprotic form. The amino group acquires a positive charge in acidic medium, the carboxylic group acquires a negative charge in basic medium, while in neutral medium, the amphiprotic form prevails. Thus, adjusting the pH of the prepared solution is crucial in potentiometric measurement. Thus, the influence of pH on the potential response of the developed sensors was investigated using 10−3 and 10−4 M GEMI solutions over a range of 2–10 with either 0.1 N sodium hydroxide or hydrochloric acid solutions. The seven sensors displayed almost constant emfs within the pH range 2–3.5. as in Figure S2. Thus, pH 3 was the optimum pH for the seven suggested sensors.
Below pH 2, a noisy response was observed; this may be attributed to the penetration of H3O+ ions into the membrane surface. Above pH 7, there was a sharp decrease in the potential, which may be accredited to the generation of non-protonated amino groups.
The results suggested that the acidic medium is suitable because GEMI contains primary amino groups which bind with the protons present in the acidic medium, forming positively charged GEMI ions. These ions are attracted by the anionic tetraphenylborate group and, at the same time, this facilitates the inclusion between GEMI and cyclodextrin [27].

3.5. Performance Characteristics of the Fabricated Sensors

In our study, the electrochemical performance characteristics of the seven sensors were evaluated based on the IUPAC recommendation [52] (Table 2).
The calibration curves’ slopes are 30.5, 30, 30.3, 28.8, 29.6, 29.8 and 32 mV/concentration decades for sensors 1–7, respectively (Figure S3).
The linearity range was 10−5–10−2 for sensors 1, 3 and 4, 10−6–10−3 for sensor 2 and 10−6–10−2 for sensors 5–7. This reflects that both the use of β-CD together with the incorporation of CQDs results in a higher sensitivity with a wider linearity range. LOD values were computed from the intersection of the two extrapolated parts of the curves. In the case of the precipitation-based sensors (1, 4 and 6), the addition of CQDs significantly reduced the LOD, especially when added to the ink (660 nM for sensor 6); in case of the β-CD-based sensors (2, 5 and 7), the addition of CQDs dramatically reduced the LOD down to 210 nM, as in sensor 5, but in this case, their addition effect was more obviously observed when added to the membrane rather than the ink. Sensor 3 has an intermediate LOD value between sensor 1 and 2, which illustrates that the addition of β-CD to the ion pair complex decreased the LOD value. Table 2 shows that sensor 5 can detect the drug at a nano-molar level in dilute solution down to 210 nM (the most sensitive sensor).
Dynamic response time (Figure S4) is a significant factor as it allows the analysis of a large number of samples in a short time. The practical response time required to attain a steady potential response was estimated by a 10-fold increase in GEMI concentration. The investigated sensors exhibited a fast response time. Concerning precipitation-based sensors (1, 4 and 6), the addition of CQDs resulted in a faster response time; similarly, a shorter response time was recorded for the CQD and β-CD-based sensors (5 and 7) compared to the plain β-CD-based sensor 2. Meanwhile, sensor 3 showed the fastest response which may be due to the use of both the ion pair and ionophore together without the incorporation of CQDs. Although the sensors are disposable devices, the proposed sensors showed steady potentials within ±1 mV through daily measurements. Reproducible behavior was maintained for up to 7 months for all sensors.
The proposed sensors show excellent accuracy and precision as presented in Table 2. Stable responses with intraday RSD not exceeding 1.329% and interday analysis with RSD values less than 1.5% were obtained.

3.6. Sensors’ Selectivity

The potential selectivity coefficients (KpotA, B) of the suggested sensors were evaluated using the matched potential method (MPM) [53] for related drugs as moxifloxacin, some antibiotics such as aminoglycosides and inorganic salts such as potassium chloride and zinc sulphate.
MPM, recommended by IUPAC [54], is widely applicable for ions with unequal charges and even to non-Nernstian interfering ions. Adopting MPM, thus, allows producing more realistic results than those obtained by the separate solution method [53].
The results demonstrate that all the sensors show reasonable selectivity. Sensor 7 shows the highest selectivity for GEMI in presence of the structurally related moxifloxacin. Sensors 5–7 exhibit greatest selectivity for GEMI and the lowest response for the possibly interfering aminoglycosides antibiotics. Table 3 shows that sensors 3, 5–7 respond selectively to the tested drug in presence of inorganic salts. Thus, sensor 7 is considered the best candidate to detect GEMI in the presence of other interferents.

3.7. Direct Determination of GEMI in Pharmaceutical Tablets

The suggested sensors were successfully used for the quantitation of GEMI in Quinabiotic® tablets without preliminary pretreatment. The recoveries obtained were Accurate and precise as shown in Table 4. Sensor 3 showed the lowest SD value for the quantitation of GEMI in pharmaceutical tablet formulation (0.523).

3.8. Direct Determination of GEMI in Spiked Water Samples

To assess the possible matrix effect of real environmental water samples on the sensors’ performance, spiked tap and river water samples were analyzed. From the results shown in Table 4, the obtained recovery values of the spiked tap and river water samples ranged from 97.69 to 101.78% and 96.93 to 105.28% with SD values lower than 2 and 3, respectively. Sensors 4 and 3 showed the lowest SD values for the quantitation of GEMI in spiked tap (0.294) and river water (0.332) samples, respectively.

3.9. Statistical Comparison

To investigate the accuracy and precision of the suggested sensors, the attained results were compared to those of the spectrophotometric reported method [29] using the Student’s t-test, and the significance of the difference between group means was tested by a one-way ANOVA at p = 0.05. The tests ascertained that no statistically significant difference was perceived, as shown in Table 5.
No significant difference was found between groups by using ANOVA with F (7,16) equals 0.47 and p equals 0.84.

4. Conclusions

In summary, seven solid-contact screen-printed sensors were constructed by applying homemade conductive carbon ink on a recycled X-ray sheet patterned using self-adhesive stencils printed on a simple office printer. This was achieved in a very simple and economic way. CQDs synthesized from dextrose as the carbon precursor were used in the modification of four of the seven developed screen-printed potentiometric sensors. All the suggested sensors showed excellent performance regarding the analytical figures of merit together with long lifetime stability for several months and were successfully applied for the fast and accurate determination of GEMI in pharmaceutical formulation and its direct determination in various spiked water samples. The CQD-modified sensors displayed wider linear ranges and better sensitivity towards GEMI compared to the unmodified electrodes. The prepared sensors allowed the selective detection of GEMI in the presence of possible interferences, pharmaceutical formulations and also in environmental water. The developed sensors have been proven to be accurate, simple, and precise. Although some previously reported HPLC and potentiometric methods have lower detection limits, the simplicity, low cost, miniaturization, and microfabrication, which allow for on-line monitoring and analysis of environmental samples, give the developed sensors superiority over numerous previously published methods.
We envision that the proposed time- and cost-effective CQD-based sensors, prepared in such an easy way, will present a milestone in the potentiometric quantitation of pharmaceuticals in pharmaceutical formulations and complex matrices as well as the routine monitoring of the quality of water and effectiveness of water treatment measures to interrupt the transmission of AMR.

Supplementary Materials

The following are available online at https://0-www-mdpi-com.brum.beds.ac.uk/2227-9040/9/1/8/s1, Figure S1: Structure of gemifloxacin mesylate; Figure S2: Influence of pH on the potentiometric response of gemifloxacin screen-printed sensors; Figure S3: Potentiometric response of gemifloxacin screen-printed sensors; Figure S4: The dynamic response time of gemifloxacin screen-printed sensors. Table S1: Response characteristics of reported potentiometric sensors for gemifloxacin.

Author Contributions

All authors contributed equally to this work as follows: Conceptualization, M.F.A., Y.A.T., M.H.A., N.V.F. and N.M.; methodology, M.F.A., Y.A.T., M.H.A., N.V.F. and N.M.; software, M.F.A., Y.A.T., M.H.A., N.V.F. and N.M.; validation, M.F.A., Y.A.T., M.H.A., N.V.F. and N.M.; formal analysis, M.F.A., Y.A.T., M.H.A., N.V.F. and N.M.; investigation, M.F.A., Y.A.T., M.H.A., N.V.F. and N.M.; resources, M.F.A., Y.A.T., M.H.A., N.V.F. and N.M.; data curation, M.F.A., Y.A.T., M.H.A., N.V.F. and N.M.; writing—original draft preparation, M.F.A., Y.A.T., M.H.A., N.V.F. and N.M.; writing—review and editing, M.F.A., Y.A.T., M.H.A., N.V.F. and N.M.; visualization, M.F.A., Y.A.T., M.H.A., N.V.F. and N.M.; supervision, M.F.A.; project administration, M.F.A., Y.A.T., M.H.A., N.V.F. and N.M.; All authors have read and agreed to the published version of the manuscript.

Funding

This work was funded by the Sector of Community Affairs and Environment Development, Ain Shams University, Cairo, Egypt, as a part of the project entitled “Green nanotechnology approaches in water purification: evaluation of the effectiveness of functionalized carbon quantum dots in detection and removal of antibiotic residues in water sources”.

Institutional Review Board Statement

Not applicable.

Informed Consent Statement

Not applicable.

Data Availability Statement

The data presented in this study are available in this article and/or its supplementary material.

Acknowledgments

The authors are grateful to Maged Sami Asaad, Chairman of the Modern Company, Cairo, Egypt, for his sound advice, helpful suggestions and for providing some essential chemicals and materials. We would like to acknowledge Ahmed Essam, assistant professor at the Pharmacognosy Dept., Faculty of Pharmacy, Ain Shams University, for his kind support at the initial stages of this work. The authors would also like to thank Omar M. Qassem, TA at the Pharmaceutical Organic Chemistry Dept., Faculty of Pharmacy, Ain Shams University, for his invaluable assistance in the molecular modeling in this work.

Conflicts of Interest

There are no conflict of interest to declare.

References

  1. Antimicrobial resistance in the age of COVID-19. Nat. Microbiol. 2020, 5, 779. [CrossRef] [PubMed]
  2. Murray, A.K. The Novel Coronavirus COVID-19 Outbreak: Global Implications for Antimicrobial Resistance. Front. Microbiol. 2020, 11, 1020. [Google Scholar] [CrossRef] [PubMed]
  3. Gothwal, R.; Shashidhar, T. Antibiotic Pollution in the Environment: A Review. Clean Soil Air Water 2015, 43, 479–489. [Google Scholar] [CrossRef]
  4. Rusu, A.; Hancu, G.; Uivaroşi, V. Fluoroquinolone pollution of food, water and soil, and bacterial resistance. Environ. Chem. Lett. 2015, 13, 21–36. [Google Scholar] [CrossRef]
  5. Chooramani, G.; Jain, B.; Chauhan, P.S. Prevalence and antimicrobial sensitivity pattern of bacteria causing urinary tract infection; study of a tertiary care hospital in North India. Clin. Epidemiol. Glob. Health 2020, 8, 890–893. [Google Scholar] [CrossRef] [Green Version]
  6. Felis, E.; Kalka, J.; Sochacki, A.; Kowalska, K.; Bajkacz, S.; Harnisz, M.; Korzeniewska, E. Antimicrobial pharmaceuticals in the aquatic environment-occurrence and environmental implications. Eur. J. Pharmacol. 2020, 866, 172813. [Google Scholar] [CrossRef]
  7. Verenitch, S.S.; Lowe, C.J.; Mazumder, A. Determination of acidic drugs and caffeine in municipal wastewaters and receiving waters by gas chromatography-ion trap tandem mass spectrometry. J. Chromatogr. A 2006, 1116, 193–203. [Google Scholar] [CrossRef]
  8. Cosofre, V.V.; Buck, R.P. Recent advances in pharmaceutical analysis with potentiometric membrane sensors. Crit. Rev. Anal. Chem. 1993, 24, 1–58. [Google Scholar] [CrossRef]
  9. Chen, C.H.; Lin, Y.T.; Lin, M.S. Fabrication of a totally renewable off-channel amperometric platform for microchip electrophoresis. Anal. Chim. Acta 2015, 874, 33–39. [Google Scholar] [CrossRef]
  10. Fletcher, S. Screen-Printed Carbon Electrodes. Adv. Electrochem. Sci. Eng. 2016, 16, 425–443. [Google Scholar] [CrossRef] [Green Version]
  11. Khaled, E.; Khalil, M.M.; Abed el Aziz, G.M. Calixarene/carbon nanotubes based screen printed sensors for potentiometric determination of gentamicin sulphate in pharmaceutical preparations and spiked surface water samples. Sens. Actuators B Chem. 2017, 244, 876–884. [Google Scholar] [CrossRef]
  12. Kakhki, R. Application of Nanoparticles in the Potentiometric Ion Selective Electrodes. Russ. J. Electrochem. 2013, 49, 458–465. [Google Scholar] [CrossRef]
  13. Abdel-Karim, R.; Reda, Y.; Abdel-Fattah, A. Review—Nanostructured Materials-Based Nanosensors. J. Electrochem. Soc. 2020, 167, 037554. [Google Scholar] [CrossRef]
  14. Chen, B.; Liu, M.; Li, C.; Huang, C. Fluorescent carbon dots functionalization. Adv. Colloid Interface Sci. 2019, 270, 165–190. [Google Scholar] [CrossRef] [PubMed]
  15. Zhang, S.; Zhang, L.; Huang, L.; Zheng, G.; Zhang, P.; Jin, Y.; Jiao, Z.; Sun, X. Study on the fluorescence properties of carbon dots prepared via combustion process. J. Lumin. 2019, 206, 608–612. [Google Scholar] [CrossRef]
  16. Qu, S.; Wang, X.; Lu, Q.; Liu, X.; Wang, L. A biocompatible fluorescent ink based on water-soluble luminescent carbon nanodots. Angew. Chem. Int. Ed. 2012, 51, 12215–12218. [Google Scholar] [CrossRef] [PubMed]
  17. Lim, C.S.; Hola, K.; Ambrosi, A.; Zboril, R.; Pumera, M. Graphene and carbon quantum dots electrochemistry. Electrochem. Commun. 2015, 52, 75–79. [Google Scholar] [CrossRef]
  18. Shankaraiah, G.; Saritha, P.; Bhagawan, D.; Himabindu, V.; Vidyavathi, S. Photochemical oxidation of antibiotic gemifloxacin in aqueous solutions–A comparative study. S. Afr. J. Chem. Eng. 2017, 24, 8–16. [Google Scholar] [CrossRef]
  19. Al-Mohaimeed, A.M.; Al-Tamimi, S.A.; Alarfaj, N.A.; Aly Fatma, A. New coated wire sensors for potentiometric determination of gemifloxacin in pure form, pharmaceutical formulations and biological fluids. Int. J. Electrochem. Sci. 2012, 7, 12518–12530. [Google Scholar]
  20. Doyle, E.; Fowles, S.E.; McDonnell, D.F.; McCarthy, R.; White, S.A. Rapid determination of gemifloxacin in human plasma by liquid chromatography-tandem mass spectrometry method. J. Chromatogr. B 2000, 746, 191–198. [Google Scholar] [CrossRef]
  21. Bera, A.K.; De, A.K.; Pal, B. A Simple, Rapid and Validated Reverse Phase High Performance Liquid Chromatographic Method for the Estimation of Gemifloxacin in Pharmaceutical Dosage Form. J. Chem. Pharm. Res. 2014, 6, 1011–1017. [Google Scholar]
  22. Robledo, V.R.; Smyth, W.F. A study of the analytical behaviour of selected new molecular entities using electrospray ionisation ion trap mass spectrometry, liquid chromatography, gas chromatography and polarography and their determination in serum at therapeutic concentrations. Anal. Chim. Acta 2008, 623, 221–230. [Google Scholar] [CrossRef] [PubMed]
  23. Tekkeli, S.E.K.; Önal, A. Spectrofluorimetric methods for the determination of gemifloxacin in tablets and spiked plasma samples. J. Fluoresc. 2011, 21, 1001–1007. [Google Scholar] [CrossRef] [PubMed]
  24. Dsugi, N.F.A.; Elbashir, A.A.; Suliman, F.E.O. Supramolecular interaction of gemifloxacin and hydroxyl propyl β-cyclodextrin spectroscopic characterization, molecular modeling and analytical application. Spectrochim. Acta Part A Mol. Biomol. Spectrosc. 2015, 151, 360–367. [Google Scholar] [CrossRef]
  25. Radi, A.E.; Khafagy, A.; El-Shobaky, A.; El-Mezayen, H. Anodic Voltammetric determination of gemifloxacin using screen-printed carbon electrode. J. Pharm. Anal. 2013, 3, 132–136. [Google Scholar] [CrossRef] [Green Version]
  26. Abo-talib, N.F. Ion selective electrodes for stability-indicating determination of gemifloxacin mesylate. Anal. Bioanal. Electrochem. 2013, 5, 74–86. [Google Scholar]
  27. Idress, M.; Elbashir, A. Development and Validation of Potentiometric ZnO Nanorods Modified Ion Selective Electrode for Determination of Gemifloxacin in Pharmaceutical Formulation. Curr. Trends Anal. Bioanal. Chem. 2017, 1, 50–56. [Google Scholar] [CrossRef]
  28. Abdallah, N.A.; Ibhrahim, H.F.; Hegabe, N.H. Comparative study of molecularly imprinted polymer and magnetic molecular imprinted nanoparticles as recognition sites for the potentiometric determination of gemifloxacin mesylate. Int. J. Electrochem. Sci. 2017, 12, 10894–10910. [Google Scholar] [CrossRef]
  29. Ambadas, R.R.; Sunita, P.P. Validated UV-spectrophotometric methods for determination of gemifloxacin mesylate in pharmaceutical tablet dosage forms. E-J. Chem. 2010, 7, 344–349. [Google Scholar] [CrossRef]
  30. Jain, A.; Jain, R.; Jain, S. Preparation of Buffer Solution and Measurement of pH. In Basic Techniques in Biochemistry, Microbiology and Molecular Biology; Springer Protocols Handbooks; Humana: New York, NY, USA, 2020; ISBN 9781493998609. [Google Scholar]
  31. Siddique, A.B.; Pratap Singh, V.; Chatterjee, S.; Kumar Pramanik, A.; Ray, M. Facile synthesis and versatile applications of amorphous carbon dots. Mater. Today Proc. 2018, 5, 10077–10083. [Google Scholar] [CrossRef]
  32. Siddique, A.B.; Pramanick, A.K.; Chatterjee, S.; Ray, M. Amorphous Carbon Dots and their Remarkable Ability to Detect 2,4,6-Trinitrophenol. Sci. Rep. 2018, 8, 9770. [Google Scholar] [CrossRef] [PubMed]
  33. Khaled, E.; Hassan, H.N.A.; Mohamed, G.G.; Ragab, F.A.; Seleim, A.E.A. Disposable potentiometric sensors for monitoring cholinesterase activity. Talanta 2010, 83, 357–363. [Google Scholar] [CrossRef] [PubMed]
  34. Okamura, M.; Takagaki, A.; Toda, M.; Kondo, J.N.; Domen, K.; Tatsumi, T.; Hara, M.; Hayashi, S. Acid-catalyzed reactions on flexible polycyclic aromatic carbon in amorphous carbon. Chem. Mater. 2006, 18, 3039–3045. [Google Scholar] [CrossRef]
  35. Frag, E.Y.Z.; Mohamed, G.G.; El-Dien, F.A.N.; Mohamed, M.E. Construction and performance characterization of screen printed and carbon paste ion selective electrodes for potentiometric determination of naphazoline hydrochloride in pharmaceutical preparations. Analyst 2011, 136, 332–339. [Google Scholar] [CrossRef] [PubMed]
  36. Makarova, N.M.; Kulapina, E.G. New potentiometric screen-printed sensors for determination of homologous sodium alkyl sulfates. Sens. Actuators B Chem. 2015, 210, 817–824. [Google Scholar] [CrossRef]
  37. Abed Al ameer, N.A.; Jameel, W.W.; Hassan, N.S. Studying the Electrical Conductivity of Different Carbon Fillers Reinforced Polyvinyl Chloride Composite Materials. Coll. Eng. J. 2014, 16, 260–268. [Google Scholar]
  38. Liu, H.; Zhao, X.; Wang, F.; Wang, Y.; Guo, L.; Mei, J.; Tian, C.; Yang, X.; Zhao, D. High-Efficient Excitation-Independent Blue Luminescent Carbon Dots. Nanoscale Res. Lett. 2017, 12, 399. [Google Scholar] [CrossRef] [Green Version]
  39. Ray, S.C.; Saha, A.; Jana, N.R.; Sarkar, R. Fluorescent carbon nanoparticles: Synthesis, characterization, and bioimaging application. J. Phys. Chem. C 2009, 113, 18546–18551. [Google Scholar] [CrossRef]
  40. Eaton, P.; Quaresma, P.; Soares, C.; Neves, C.; de Almeida, M.P.; Pereira, E.; West, P. A direct comparison of experimental methods to measure dimensions of synthetic nanoparticles. Ultramicroscopy 2017, 182, 179–190. [Google Scholar] [CrossRef]
  41. Duan, W.H.; Wang, Q.; Collins, F. Dispersion of carbon nanotubes with SDS surfactants: A study from a binding energy perspective. Chem. Sci. 2011, 2, 1407–1413. [Google Scholar] [CrossRef]
  42. Cao, L.; Yang, S.T.; Wang, X.; Luo, P.G.; Liu, J.H.; Sahu, S.; Liu, Y.; Sun, Y.P. Competitive performance of carbon “quantum” dots in optical bioimaging. Theranostics 2012, 2, 295–301. [Google Scholar] [CrossRef] [PubMed]
  43. Wang, B.; Ma, H.; Zhang, T.; Zhang, Y.; Chuan, L.F. Effects of sodium dodecyl sulfate concentrations on the dispersion of carbon nanofibers in water. Nanosci. Nanotechnol. Lett. 2013, 5, 377–383. [Google Scholar] [CrossRef]
  44. Geng, Y.; Xiang, Z.; Lv, C.; Wang, Y.; Xin, X.; Yang, Y. High efficiency gold extraction through photo-luminescent vesicles self-aggregated by sodium dodecyl sulfate and carbon quantum dots with a visual fluorescent method for Au (III) detection. Sep. Purif. Technol. 2019, 222, 60–67. [Google Scholar] [CrossRef]
  45. Rezvani Ivari, S.A.; Darroudi, A.; Arbab Zavar, M.H.; Zohuri, G.; Ashraf, N. Ion imprinted polymer based potentiometric sensor for the trace determination of Cadmium (II) ions. Arab. J. Chem. 2017, 10, S864–S869. [Google Scholar] [CrossRef] [Green Version]
  46. El-Kosasy, A.M.; Aziz, L.E.; Trabik, Y.A. Comparative study of beta cyclodextrin and calix-8-arene as ionophores in potentiometric ion-selective electrodes for sitagliptin phosphate. J. Appl. Pharm. Sci. 2012, 2, 51–56. [Google Scholar] [CrossRef] [Green Version]
  47. Suliman, F.E.O.; Elbashir, A.A.; Schmitz, O.J. Study on the separation of ofloxacin enantiomers by hydroxyl-propyl-β-cyclodextrin as a chiral selector in capillary electrophoresis: A computational approach. J. Incl. Phenom. Macrocycl. Chem. 2015, 83, 119–129. [Google Scholar] [CrossRef]
  48. Bakker, E.; Pretsch, E. Lipophilicity of tetraphenylborate derivatives as anionic sites in neutral carrier-based solvent polymeric membranes and lifetime of corresponding ion-selective electrochemical and optical sensors. Anal. Chim. Acta 1995, 309, 7–17. [Google Scholar] [CrossRef]
  49. National Center for Biotechnology Information. PubChem Compound Summary for CID 8028, Tetrahydrofuran. 2020. Available online: https://pubchem.ncbi.nlm.nih.gov/compound/Tetrahydrofuran (accessed on 22 December 2020).
  50. Salama, F.M.; Attia, K.A.; Said, R.A.; El-Olemy, A.; Abdel-Raoof, A.M. Disposable gold nanoparticle functionalized and bare screen-printed electrodes for potentiometric determination of trazodone hydrochloride in pure form and pharmaceutical preparations. RSC Adv. 2018, 8, 11517–11527. [Google Scholar] [CrossRef] [Green Version]
  51. Goswami, J.A.; Shah, N.J. Review of drugs and its analytical methods to treat allergic rhinitis in combination with other drugs in different dosage forms. Int. J. Pharm. Pharm. Sci. 2013, 5, 966–975. [Google Scholar]
  52. Umezawa, Y.; Buhlmann, P.; Umezawa, K.; Tohda, K.; Ammemiya, S. Potentiometric selectivity coefficients of ion-selective electrodes part1. Inorganic cations. Pure Appl. Chem. 2000, 72, 1851–2082. [Google Scholar] [CrossRef]
  53. Tohda, K.; Dragoe, D.; Shibata, M.; Umezawa, Y. Studies on the Matched Potential Method for Determining the Selectivity Coefficients of Ion-Selective Electrodes Based on Neutral Ionophores: Experimental and Theoretical Verification Koji. Anal. Sci. 2001, 17, 733–743. [Google Scholar] [CrossRef] [PubMed] [Green Version]
  54. Umezawa, Y.; Umezawa, K.; Sato, H. Selectivity coefficients for ion-selective electrodes: Recommended methods for reporting values KpotA, Bvalues (Technical Report). Pure Appl. Chem. 1995, 67, 507–518. [Google Scholar] [CrossRef]
Figure 1. The scheme of screen printing of the proposed sensors. (a) Transparent recycled X-ray sheet; (b) a pattern printed on a self-adhesive stencil sheet placed on the recycled X-ray sheet marking a defined square-shaped (10 mm × 10 mm) working area for applying the ion-sensing cocktail and a rectangular area (10 mm × 5 mm) on the other side for electrical contact using silver paint; (c) the electrode region determined by the cut pattern; (d) careful painting of conducting ink on the delimited surface using a suitable brush and (e) peeling off the self-adhesive stencil from the X-ray sheet followed by placing a layer of an insulator onto the printed electrodes and applying silver paint for electrical contact.
Chemosensors 09 00008 g001
Figure 2. Potentiometric cell assembly with a screen-printed ion-selective membrane sensor for GEMI and a double junction reference electrode.
Chemosensors 09 00008 g002
Figure 3. Characterization of carbon quantum dots (CQDs). (a) XRD pattern; (b) bright field high-resolution transmission electron microscopy (HRTEM) image of the CQDs and (c) high-magnification image showing CQDs; (d) CQD size distribution using dynamic light scattering (DLS).
Chemosensors 09 00008 g003
Figure 4. (a) Proposed 3D structure of the GEMI–β-CD inclusion complex; (b) hydrogen bond donor; (c) hydrogen bond acceptor; (d) two hydrogen bond acceptors and (e) hydrogen bond acceptor. The GEMI structure is presented as ball and sticks and the βCD structure is presented as sticks only.
Chemosensors 09 00008 g004
Figure 5. Two-dimensional interactions showing atoms and groups involved in hydrogen bonding between molecules of (a) host and (b) guest.
Chemosensors 09 00008 g005
Table 1. Ion-sensing cocktail compositions of gemifloxacin (GEMI) screen-printed sensors.
Amounts of Each
Component
Sensors
Ion Pair
(mg)
β–CD
(mg)
NaTPB
(mg)
PVC
(mg)
DOP
(mg)
THF
(ml)
C-Dots
THF Dispersion
(mg)
Sensor 110.00----------------190.00450.005.00--------
Sensor 2--------10.005.00190.00450.005.00--------
Sensor 310.0010.005.00190.00450.005.00--------
Sensor 410.00----------------190.00450.005.00170.00
Sensor 5--------10.005.00190.00450.005.00170.00
Sensor 6 *10.00----------------190.00450.005.00--------
Sensor 7 *--------10.005.00190.00450.005.00--------
* In case of sensors 6 and 7, carbon quantum dot (CQD) SDS dispersion is part of ink composition.
Table 2. Potentiometric performance characteristics of gemifloxacin screen-printed sensors.
ParameterSensor 1Sensor 2Sensor 3Sensor 4Sensor 5Sensor 6Sensor 7
Slope (mV/decade)30.53030.328.829.629.832
Intercept318.5318.0239.3284.3416.6390.6321.8
Correlation
Coefficient (r)
0.99660.99990.99990.99830.99750.99970.9965
LOD (nM)665096926903570210660954
Linear range (M)10−5–10−210−6–0−310−5–10−210−5–10−210−6–10−210−6–10−210−6–10−2
pH range2.2–3.22.0–3.31.9–3.52.0–3.31.9–3.32.0–3.31.9–3.6
Response time (s)25271015201822
Lifetime (month)7777777
Accuracy ± standard deviation *100.20 ± 0.71399.81 ± 0.321100.18 ± 1.00099.58 ± 0.82599.89 ± 0.24299.87 ± 0.70699.61 ± 0.784
Repeatability RSD% *0.1710.5640.7530.9420.1541.3290.136
Intermediate precision RSD% *0.9160.9390.8001.1450.2391.4620.354
* Average of three determinations.
Table 3. Potentiometric selectivity coefficients (Kpot Gemi, interferent) * for the investigated gemifloxacin screen-printed sensors.
InterferentSensor 1Sensor 2Sensor 3Sensor 4Sensor 5Sensor 6Sensor 7
Tobramycin3.26 × 10−15.70 × 10−21.65 × 10−16.49 × 10−27.63 × 10−34.00 × 10−21.50 × 10−1
Gentamycin1.49 × 10−11.17 × 10−11.43 × 10−15.35 × 10−11.47 × 10−19.22 × 10−23.49 × 10−2
KCl3.49 ×10−23.60 × 10−23.48 × 10−25.51 × 10−22.29 × 10−25.90 × 10−31.00 × 10−2
Moxifloxacin2.8 × 10−18.80 × 10−17.77 × 10−12.4 × 10−13.90 × 10−11.49 × 10−19.60 × 10−2
ZnSO41.82 × 10−11.48 × 10−17.40 × 10−23.50 × 10−17.43 × 10−21.08 × 10−11.00 × 10−2
Streptomycin9.80 × 10−21.50 × 10−21.28 × 10−11.48 × 10−16.47 × 10−21.06 × 10−32.75 × 10−3
* KpotA,B = ∆aA/aB, with ∆aA = a′A − aA, where KpotA,B denotes the selectivity coefficient, ion A is the primary ion, ion B is the interfering ion and aA is the initial background activity of ion A.
Table 4. Potentiometric determination of gemifloxacin in pharmaceutical formulation, spiked tap water and spiked river water samples using the proposed sensors.
MatrixSpiked Conc. (M)Recovery * %
Sensor 1Sensor 2Sensor 3Sensor 4Sensor 5Sensor 6Sensor 7
Pharmaceutical
Formulation
Mean 100.29 ± 1.336100.92 ± 1.00499.71 ± 0.52399.89 ± 1.50699.60 ± 0.77899.02 ± 1.697101.90 ± 1.513
Tap water samples10−5 M99.8010097.2399.51100.4197.04101.29
10−4 M100.8298.7497.61100.09102.7100.73101.41
10−3 M100.5398.9998.2499.88102.2299.89102.14
Mean100.38 ± 0.52699.24 ± 0.66797.69 ± 0.51099.83 ± 0.294101.78 ± 1.20899.22 ± 1.934101.61 ± 0.460
River water samples10−5 M99.37102.1199.8799.87102.2196.71102.38
10−4 M100.69108.0499.2698.83103.5595.53102.97
10−3 M100.61105.799.3499.88104.2898.55101.95
Mean 100.22 ± 0.740105.28 ± 2.98799.49 ± 0.33299.53 ± 0.603103.35 ± 1.05096.93 ± 1.522102.43 ± 0.512
* Average of three determinations.
Table 5. Statistical comparison between the determination of gemifloxacin in pure form by the proposed potentiometric methods and the published method.
ValuesProposed MethodsPublished Method [29]
Sensor 1Sensor 2Sensor 3Sensor 4Sensor 5Sensor 6Sensor 7
Mean100.2099.81100.1899.5899.8999.87100.2799.61
Standard deviation (SD)0.7130.3211.0000.8250.2420.7060.4080.784
Variance0.5080.1031.0000.6810.0590.4980.1660.615
N33333333
Student’s t test0.96
(2.78) *
0.41
(2.78) *
0.78
(2.78) *
0.05
(2.78) *
0.59
(2.78) *
0.43
(2.78) *
1.30
(2.78) *
* Figures in parenthesis are the corresponding theoretical values for F and t at the 95% confidence level.
Publisher’s Note: MDPI stays neutral with regard to jurisdictional claims in published maps and institutional affiliations.

