Article

Carbon Dioxide Sensing with Langmuir–Blodgett Graphene Films

Center for Microelectronic Technologies, Institute of Chemistry, Technology and Metallurgy, National Institute of the Republic of Serbia, University of Belgrade, Njegoševa 12, 11000 Belgrade, Serbia
*
Author to whom correspondence should be addressed.
Submission received: 2 November 2021 / Revised: 26 November 2021 / Accepted: 30 November 2021 / Published: 3 December 2021
(This article belongs to the Special Issue 2D Materials for Gas Sensing)

Abstract

:
Graphene has become a material of choice for an increasing number of scientific and industrial applications. It has been used for gas sensing due to its favorable properties, such as a large specific surface area, as well as the sensitivity of its electrical parameters to adsorption processes occurring on its surface. Efforts are ongoing to produce graphene gas sensors by using methods that are compatible with scaling, simple deposition techniques on arbitrary substrates, and ease of use. In this paper, we demonstrate the fabrication of carbon dioxide gas sensors from Langmuir–Blodgett thin films of sulfonated polyaniline-functionalized graphene that was obtained by using electrochemical exfoliation. The sensor was tested within the highly relevant concentration range of 150 to 10,000 ppm and 0% to 100% at room temperature (15 to 35 °C). The results show that the sensor has both high sensitivity to low analyte concentrations and high dynamic range. The sensor response times are approximately 15 s. The fabrication method is simple, scalable, and compatible with arbitrary substrates, which makes it potentially interesting for many practical applications. The sensor is used for real-time carbon dioxide concentration monitoring based on a theoretical model matched to our experimental data. The sensor performance was unchanged over a period of several months.

1. Introduction

Carbon dioxide (CO2) sensing has important applications across various industries, including pollution monitoring [1], hazard detection [2], smoke detection [3], room ventilation monitoring [4], and personal protection. As CO2 is one of the most important greenhouse gases, monitoring its concentration is indispensable in environmental protection, climate change monitoring [2], and carbon emissions cutting [5].
State-of-the-art CO2 detectors make use of free-space optics, which results in efficient but bulky sensors. On-chip sensing can be performed by utilizing novel materials, such as ceramics, polymers, carbon nanotubes, aluminum oxide, polyethyleneimine (PEI) [6], various organic and inorganic materials and their hybrids [7], semiconducting composite structures [8], and graphene. Graphene in particular is a good choice due to its wide availability and ease of use.
Since the first experimental realization in 2004 [9,10], graphene has caught immense interest throughout the scientific and industrial communities. Among other applications, gas sensing with graphene has become an active area of research. Graphene reacts to the presence of analyte gases by charge transfer from the substrate or electrical contacts, which causes a change in its electrical properties, such as carrier density [11]. As opposed to bulk graphite, exfoliated graphene has an electron cloud in pi orbitals above the surface, with which analytes can readily react. The reactivity of graphene to a number of analytes has been demonstrated, such as ammonia [12,13,14], CO and NOx [15], water vapor [16], acetone [17], toluene and 1,2-dichlorobenzene [18], and methane [19]. The number of analytes detected with graphene-based sensors has expanded throughout the years [20,21,22,23]. Detection of CO2 with graphene makes use of different graphene-based materials and physicochemical effects, such as graphene oxide [24], graphene-based electroluminescence [25], room-temperature hydrogen plasma-reduced graphene oxide [26], graphene/quantum dot composites [27,28], other graphene nanostructure composites [29], CVD graphene [11,30], or simply graphene sheets obtained by mechanical cleavage [31,32].
Efficient exfoliation of graphene sheets in solution has been achieved by several different methods, and is widely considered to be a promising approach to high-throughput production of graphene devices [33,34,35,36,37]. Nevertheless, many of these methods follow a series of complex chemistry steps, and deposition onto substrates for device fabrication generally requires costly and complex equipment, such as specialized printers [38]. Consequently, although several research groups have reported CO2 detection with graphene, very few have demonstrated graphene-based CO2 sensors made from solution-processed graphene, which would have economic and processing benefits over other methods, such as CVD [11]. Research shown to date, which makes use of widely available solution-processed graphene, makes use of costly or complex postprocessing steps, such as plasma treatment [26].
Here, we demonstrate graphene-based CO2 sensors made from commercially available solution-processed sulfonated polyaniline (PANI)-functionalized graphene following facile film deposition by the Langmuir–Blodgett method [39]. PANI functionalization dopes the graphene, making it more sensitive to CO2. Previous works on CO2 detection with PANI-functionalized graphene involved numerous processing steps, such as electrospinning, UV irradiation and polymerization [40], electrospraying, pressurization, plasma treatment and polymerization [41], nanopaper synthesis [42], and/or the use of toxic acids, such as sulfuric, nitric, and hydrochloric acid [43]. None of the previous works made use of Langmuir–Blodgett deposition, although the method can yield high-quality thin films [39] of practically any size using no equipment and no chemicals apart from deionized water. We demonstrate sensing operation at concentrations ranging from 150 to 10,000 ppm and from 0% to 100% volume concentrations at temperatures between 15 and 35 °C. As such, this work paves the way to a practical and inexpensive use of graphene for CO2 detection after additional challenges such as gas selectivity are overcome. Selectivity strategies in a future work may include functionalization, heterostructures, or nanocompositing [44,45,46].

2. Materials and Methods

Graphene was obtained from Sixonia Tech GmbH (G-DISP-NMP-CSO-2+, Dresden, Germany). The supplier performed electrochemical exfoliation from graphite in a process that resulted in sulfonated polyaniline (PANI) functionalization of graphene nanosheets in a solution of N-methyl pyrrolidone (NMP) at a concentration of >2 mg/mL. We gently dispersed the graphene solution, as obtained from the supplier, in deionized water, whereby NMP dissolved while the graphene flakes self-assembled at the surface of the water to form a continuous thin film. The sensor was formed by picking up the graphene film from the water surface on an alumina substrate with two interdigitated gold electrodes (DropSens IDEAU200-HPT-WB, Oviedo, Spain) using the Langmuir–Blodgett method [47,48]. This substrate, although employing only two electrodes and hence yielding resistance values that include contact resistance, is an easy-to-use standard in thin-film sensor testing. The procedure yielded a graphene active surface area of ~5 × 5 mm2 on top of the electrodes. Electrical connections between the electrodes and the wiring coming from the measurement system were made with commercially obtained silver paste.
The topography of the sensors was mapped with atomic force microscopy (AFM) using a ThermoMicroscopes AutoProbe CP. The scan area was set to 5 × 5 μm2. The film thickness on a transparent substrate was measured with UV–VIS optical transmittance.
The sensor was inserted into a homebuilt gas sensing chamber. A Pt1000 thermometer was inserted into the chamber next to our graphene sensor. We controlled the gas flow through the chamber with mass flow controllers (Alicat MC-200SCCM, Tucson, AZ, USA) (Figure 1). The total flow was kept fixed at 190 mL/min. First, the chamber was purged with argon, after which a controlled concentration of CO2 was injected into the flow from a 10,000-ppm calibrated cylinder of CO2 in argon. Using a calibrated cylinder as the source, in combination with mass flow controllers, eliminates the need for additional gas concentration calibration. For concentrations higher than 10,000 ppm, a cylinder with a high concentration of the gas was used as the source (CO2 3.8 from Messer). The flow of CO2 was further diluted by mixing with a 100% argon flow in a T-shaped mixing element. For example, for a CO2 concentration of 150 ppm, the flow of CO2 was 2.85 mL/min. The resistance of the sensor was tracked in time with a digital multimeter (Keysight 34461A), as the concentration of CO2 in the chamber was varied. The multimeter provides a constant current of 1 mA and measures the voltage drop across the sensor. The experiments were performed at temperatures ranging from 15 to 35 °C by inserting the gas sensing chamber into a larger environmental chamber for controlling the temperature. All gases were dry, meaning that the relative humidity in the gas sensing chamber was near zero.

3. Results

3.1. Experimental Section

A photograph of the graphene sensor is depicted in Figure 2a. The grey area on the left of the image is graphene, covering a pair of interdigitated gold electrodes on a ceramic substrate. The electrodes are connected to the external measurement circuit with silver paste, visible on the right. An atomic force micrograph of the sensing surface is shown in Figure 2b. The active layer of the sensor is made of flakes of graphene that lie on the surface of the substrate. The flakes have varying lateral dimensions, ranging from tens of nanometers to several micrometers in diameter. The flakes touch or overlap, such that together they form a continuous conductive graphene film. The film morphology is similar to that of the previously studied films made of graphene that is obtained by ultrasonic liquid-phase exfoliation [47]. Film thickness is about 11.5 nm on average, as measured with UV–VIS optical transmittance and shown in Figure S1 in Supplementary Materials.
First, we tested the sensor operation at high concentrations of CO2 in order to evaluate the overall performance and dynamic range. The gas temperature was kept at 30 °C during the measurements. We plot in Figure 3 the measured two-terminal resistance across the graphene sensor for CO2 volume concentrations ranging from 0% to 100% at atmospheric pressure. The measured resistance increased from an initial value of 56.5 to 57.8 Ω as the CO2 concentration was increased. Although the relative change was only 2.2%, the signal-to-noise ratio was excellent, making the signal easily measurable with a standard digital multimeter. Although the measured resistance includes contact resistance, due to the two-terminal configuration that was used, measuring resistance change during CO2 adsorption yields an accurate measure of sensor response.
To evaluate the sensor performance at the environmentally and physiologically important range between 150 and 10,000 ppm, we injected a controlled amount of CO2 from a calibrated cylinder. We performed the measurements at a range of temperatures between 15 and 35 °C and recorded the sensor response to varying CO2 concentrations, as shown in Figure 4. The concentration was varied in steps of increasing CO2 concentration. Between each step, the chamber was purged with argon. The sensor responded with a detectable change even for a concentration of 150 ppm CO2, with the response increasing at higher concentrations. We chose to work in a dry environment to avoid cross sensitivity with humidity. The temperature during the measurements was constant and stable, as depicted in Figure S1 of Supplementary Materials. A noticeable effect is the negative temperature coefficient of resistance, TCR, which leads to a decrease in the resistance baseline with increasing temperature. A negative TCR is commonly observed in single-layer graphene [10] and in multilayer graphene materials that possess a large number of defect sites, such as purposely introduced mechanical defects [49] or exfoliation-induced defects [50,51]. We previously demonstrated that liquid-phase exfoliated graphene, which is of similar morphology to the material presented here, contains reactive edge defect sites that are responsible for sensitivity to various analytes [52]. After each purging step, and before subsequent exposure to CO2, the measured resistance returned to approximately the same baseline value, which indicates recovery of the sensing surface, without the need for any treatment, such as heating. Sensor recovery without treatment is a beneficial feature for practical use of our sensor. Additionally, reversibility indicates that the interaction between the adsorbate and the sensing layer is weak, which is typical for physical adsorption. We performed the same sets of measurements over a period of several months without a noticeable change in device performance.
To quantify the sensor response, from data shown in Figure 4 we calculated the change in device resistance when the steady state was reached, ΔRS, defined as the difference between the steady-state resistance at each concentration of CO2 and the minimum resistance prior to injection of CO2, RB. The change in device resistance at a steady state at different temperatures and for different gas concentrations is plotted in Figure 5. The slopes of the sensor response curves were highest for the lowest concentrations of CO2 (<1000 ppm), indicating a larger sensitivity at low concentrations. The sensor was operational across the entire temperature range.
We use the data shown in Figure 4 to deduce the temperature dependence of the response of our sensor. Figure 6 depicts the steady-state resistance change as a function of temperature for seven different values of CO2 concentrations. The original values of ΔRS, as measured from the data in Figure 4 and used to plot Figure 5 and Figure 6, are given in Table S1 of Supplementary Materials. The origin of a weaker sensor response at higher temperatures is in basic principles of chemistry, in which the process of adsorption is exothermic, whereas desorption is endothermic. According to Le Chatelier’s principle, an increase in temperature will favor desorption over adsorption [53]. Although the sensor response is higher at lower temperatures, the sensor is operational at all temperatures near room conditions, which may be encountered in practice.

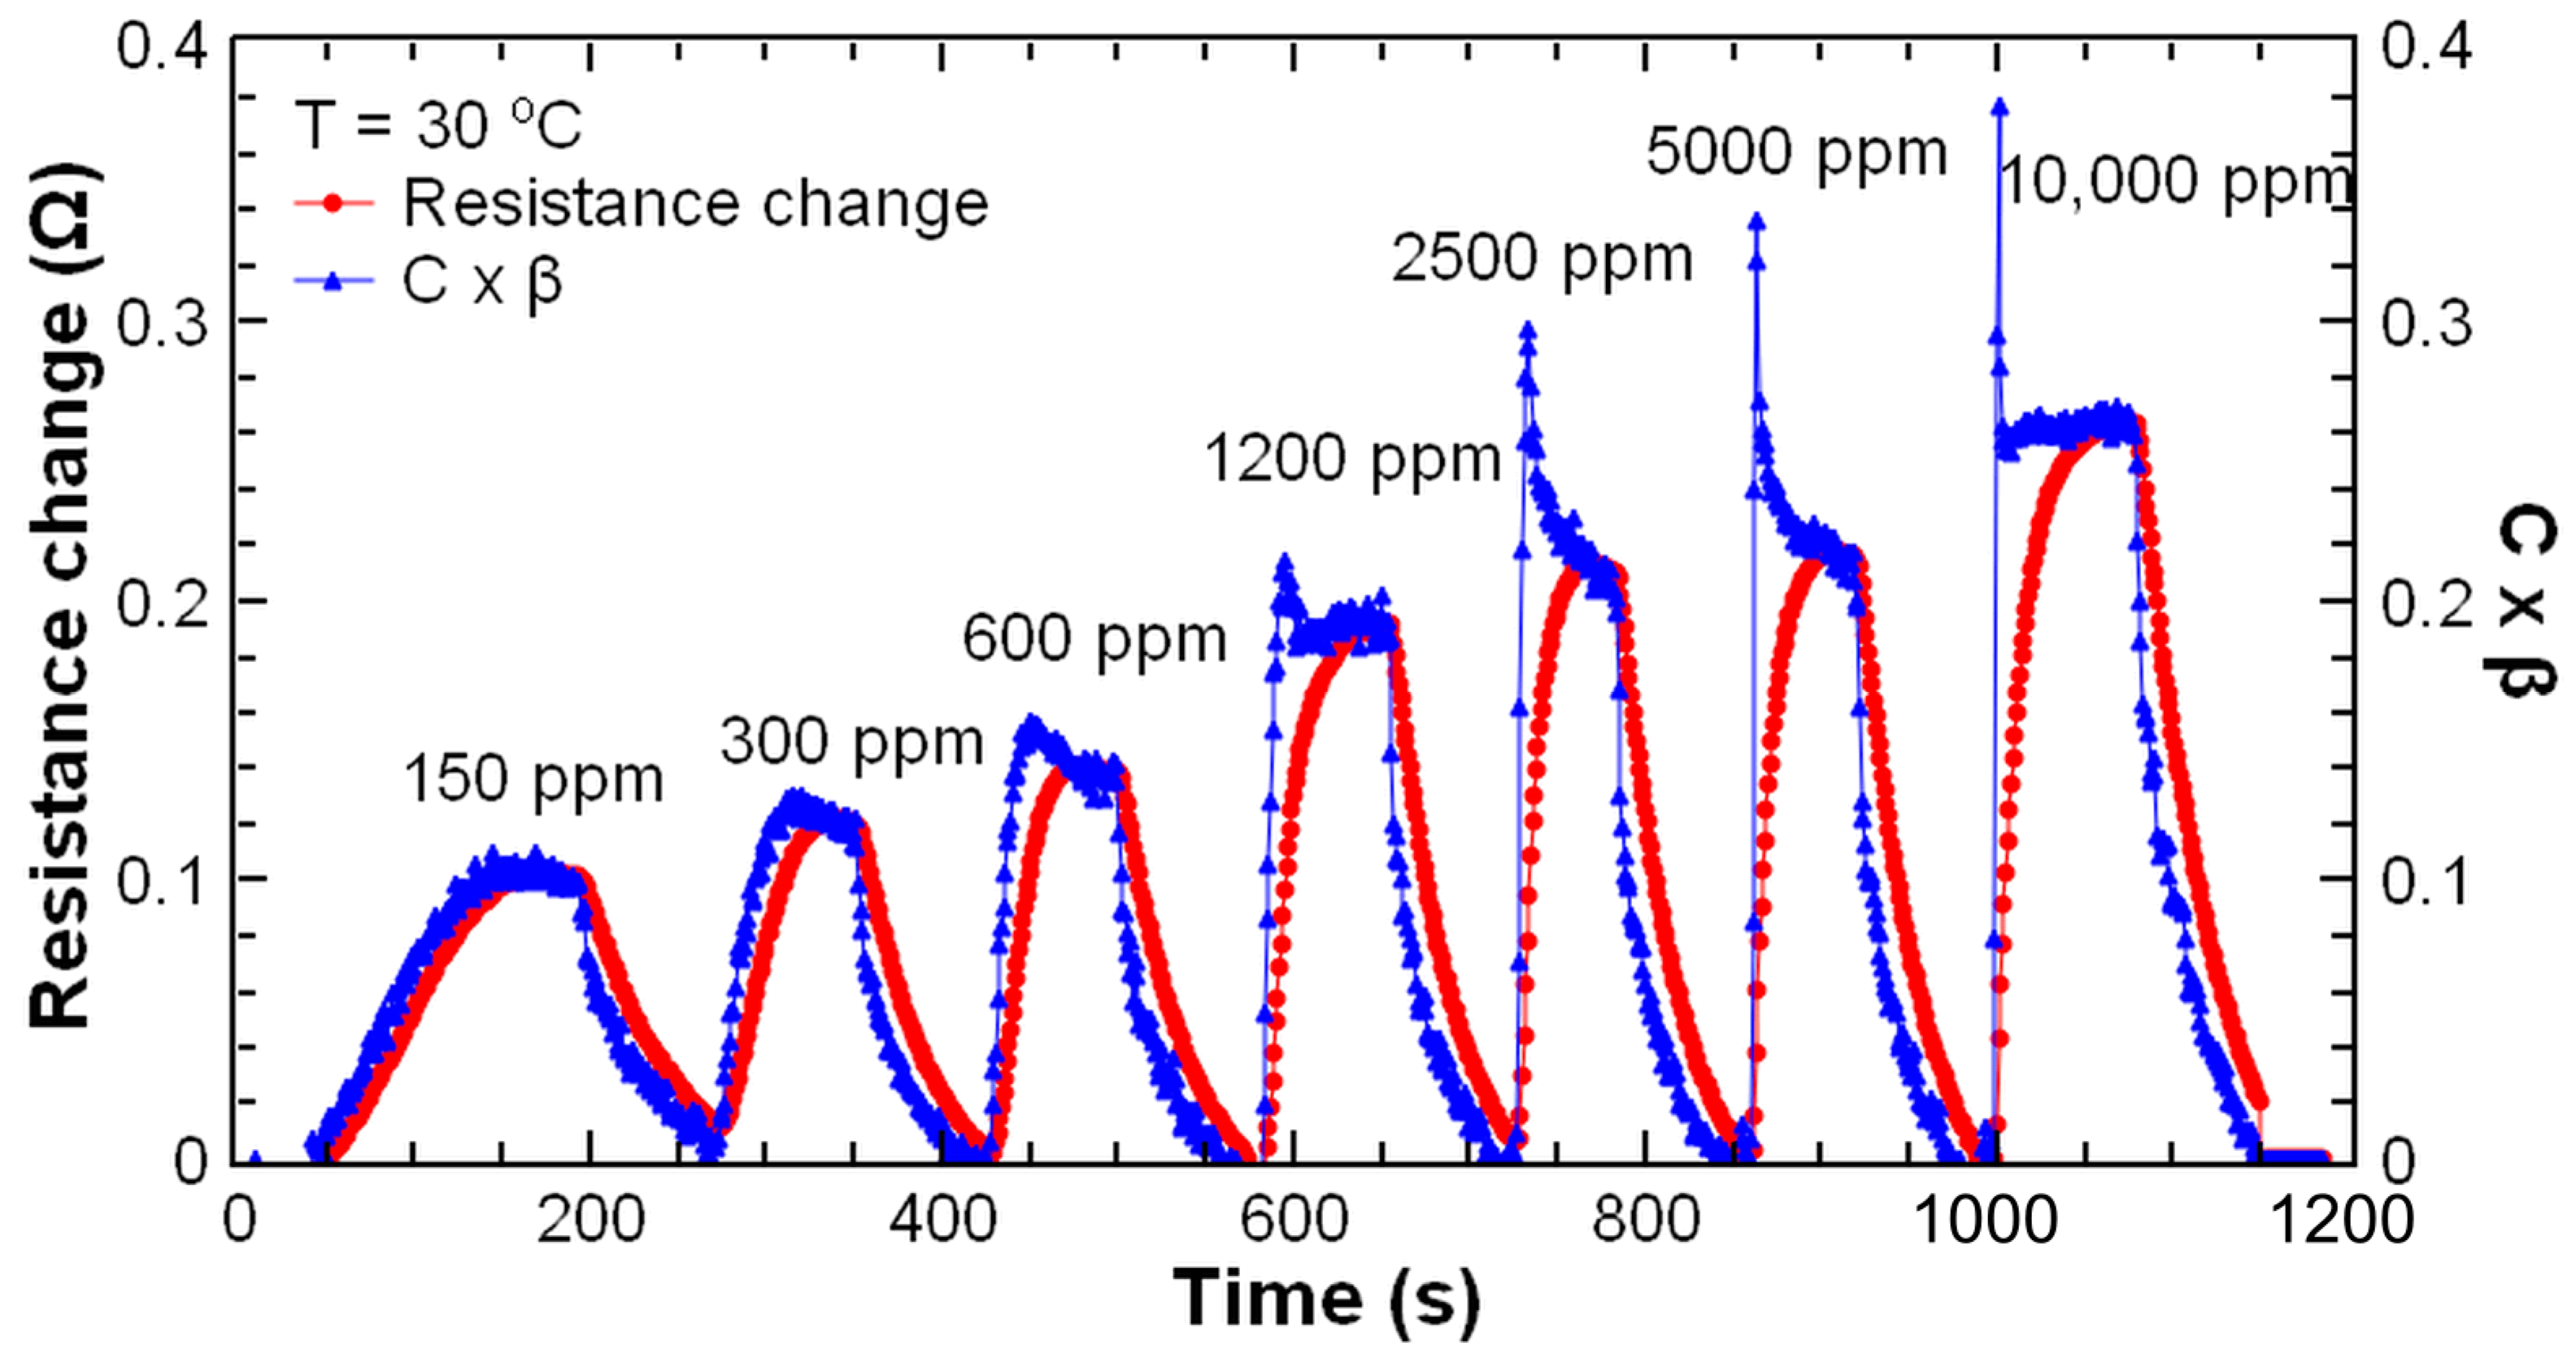
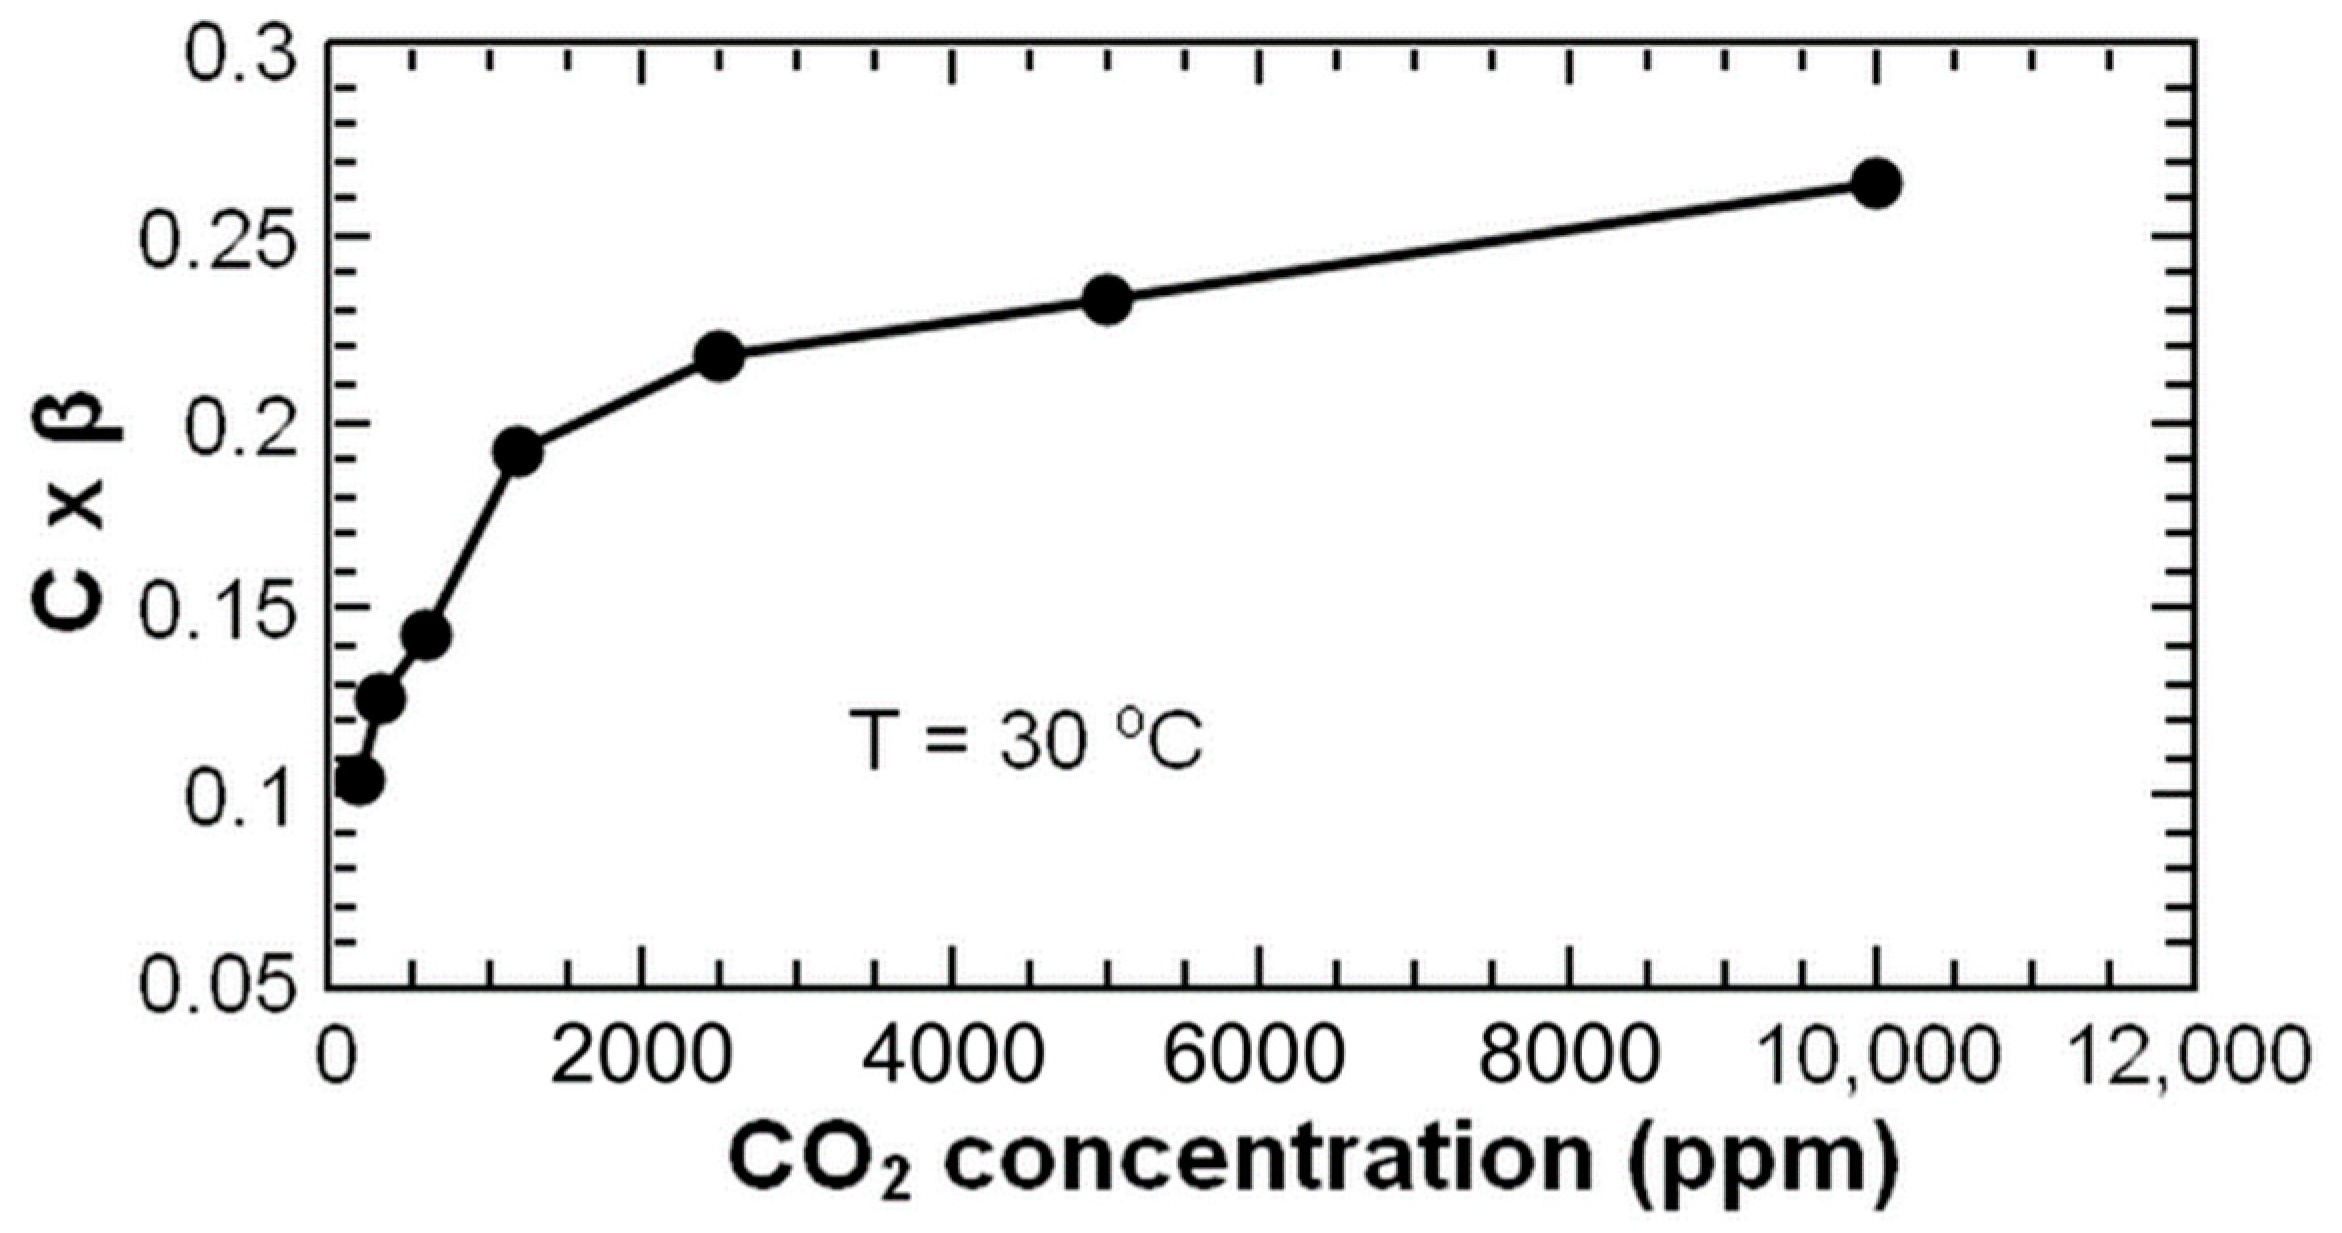
3.2. Real-Time Concentration Measurement

We proceeded to establish a theoretical model of our sensor’s response. We subsequently made use of the model to calibrate the measured resistance change, ΔR, to the actual concentration of CO2. We adapted the theoretical modeling approach previously devised by one of our coauthors [54], which is based on the Langmuir theory of adsorption [55]. Following the reasoning from [54], the output signal is represented in the form
R = R B + Δ R = R B + Δ R S ( 1 e x p ( t τ ) ) ,
where R is the measured sensor resistance at the moment t (t = 0 is the moment when the sensor output signal starts to increase after injection of CO2 of a given concentration), RB is the sensor signal before CO2 injection, ΔRS = RSRB is the resistance change corresponding to the steady-state value of signal response RS at the applied analyte concentration, and τ is the time constant for reaching the steady state. Given that the time required for reaching the set concentration in our homebuilt gas sensing chamber is estimated to be in the order of 1 s (the purging time of a chamber can be estimated as tch = 3 V/Q, where V is the chamber volume, and Q is the gas flow [56]), it is reasonable to assume based on the results shown in Figure 4 that τ is determined by the kinetics of the adsorption–desorption (AD) process on the sensing surface. In the Langmuir theory, τ depends on the analyte concentration C and the parameters β and γ that characterize the AD process, according to the expression
τ = γ 1 + β C
The steady-state resistance change equals
Δ R S = β C 1 + β C Δ R M A X .
The maximal possible value of the resistance change, ΔRMAX, is obtained when the sensing surface is completely covered by the adsorbed analyte molecules (i.e., when all the surface adsorption sites are occupied). After differentiation of the function R (Equation (1)) with respect to time, and simple mathematical transformations, the following expression is obtained:
C β = Δ R + γ R Δ R M A X Δ R
where R′ = dR/dt is the time derivative of the measured resistance. Since γ depends only on the AD process parameters, it is constant for a given temperature. Therefore, when γ and ΔRMAX are known, the quantity can be obtained from the measured value of the sensor resistance change and the slope of the curve R(t) for any given CO2 concentration and at any given time.
Based on the above theory, we apply an algorithm for measuring CO2 concentration in real time. First, ΔRMAX is determined as ΔRMAX = RMAXRB, where RMAX, the resistance corresponding to the maximal coverage of the sensing surface by the adsorbed molecules, is experimentally obtained by exposing the sensor to a very high gas concentration until resistance does not increase anymore with further increase in C, as in Figure 3. Then, from the measured R(t) at a given C and T, ΔRS and τ are extracted and used for the calculation of the parameter γ as
γ = τ Δ R M A X Δ R M A X Δ R S .
τ is determined by fitting Equation (1) to the experimentally obtained time dependence of the sensor output signal, and ΔRS from its steady-state value. The obtained value of γ is valid for all concentrations at the given temperature. The quantity C × β is then obtained from the measured signal according to Equation (4).
We apply the presented method to our experimental measurements. We estimate τ by fitting Equation (1) to the resistance measured at 1200 ppm of CO2 and at a temperature of 30 °C (red curve in Figure 4). Prior to fitting, we subtract the baseline. The fit is accomplished by linearization and least squares fitting, after which we obtain τ = 13.1 s. A plot of ΔR obtained with this time constant, overlaid with the experimental data, is depicted in Supplementary Materials (Figure S2). In Figure 3, RMAX = 57.8 Ω. Using Equation (5), γ is calculated to be 15.36 s.
In Figure 7, we show a plot of the measured resistance change ΔR (red curve) and the calculated quantity C × β (blue curve, obtained from Equation (4)), for all concentrations used in the experiment, at T = 30 °C. An important benefit of applying our theory to sensor operation is that the quantity C × β reaches a steady state much faster than the measured signal ΔR. From a practical standpoint, the theoretical model can be used to monitor gas concentration in real time, which is not the case when the experimental data are directly read out. We note that a simpler model, based on the time derivative of the measured signal, has been proposed to relate the measured signal to the gas concentration in 2D materials [57]. Although the derivative-based model is simpler, it enables a real-time readout of the concentration only in the special case when the concentration is zero and increasing rapidly, whereas our model enables continuous real-time monitoring of the concentration. The time derivative of the signal during a concentration change, described in [57], is visible in our data as well, depicted by the sharp peaks on the theoretical curve in Figure 7 during concentration changes.
In Figure 8, we show the relationship between the product C × β and the actual concentration of CO2. The values for C × β are read out from the blue curve in Figure 7 when it reaches a steady state at any given concentration. In practical applications, Figure 8 can be transferred to a lookup table from which the actual concentration values can be derived. This opens the way for practical utilization of the presented algorithm for the sensor readout procedure.

4. Discussion and Conclusions

We have presented carbon dioxide detection with a sensor made of thin graphene films deposited with Langmuir–Blodgett assembly. The films, made from commercially obtained graphene in solution which is deposited with a facile Langmuir–Blodgett assembly method, consist of nanoplatelets of graphene that are touching or overlapping, forming a continuous film between two electrodes.
The sensors show chemiresistive behavior in the presence of CO2 gas at concentrations ranging from 0% to 100%, with particular attention paid to the biologically relevant concentrations between 150 and 10,000 ppm. We have demonstrated sensor operation at temperatures between 15 and 35 °C.
The film thickness is approximately 11.5 nm. For sensing purposes, a thinner film may be more advantageous. The key parameter regarding sensing material thickness is the Debye screening length, which defines the material thickness at which an adsorbed molecule interacts with all of the material in its vicinity. If the material is less thick than the Debye length, the analyte starts to interact with the substrate as well, which decreases sensitivity and may introduce noise. If, however, the material is thicker than the Debye length, the analyte does not interact with the bottom layers of the material, which also results in less sensitivity and more noise. A typical Debye screening length is in the order of 1–3 nm [58], which indicates that graphene films produced with the use of a Langmuir–Blodgett trough, which may be thinner, would provide better sensitivity. Alternatively, the film could be made more sensitive by extending the Debye length by employing polyelectrolyte multilayers on top of the graphene [59].
The fact that the sensors are readily made, and that they operate at biologically relevant concentrations and temperatures, makes this technology potentially interesting for use in environmental, personal, and industrial CO2 detection. Furthermore, these sensors can be practically of any size, made on any substrate that could be rigid or flexible, opaque or transparent, pointing to diverse applications in wearable technology, in personal protection, or in industries such as automotive, aviation, production, and mining. We have also demonstrated that these sensors can be calibrated for direct real-time concentration readout, which is important for their practical use.

Supplementary Materials

The following are available online at https://0-www-mdpi-com.brum.beds.ac.uk/article/10.3390/chemosensors9120342/s1, Figure S1: Optical transmittance spectrum of graphene film; Figure S2: Temperature stability during the measurements; Figure S3: Exponential fit to experimental data; Table S1: Original data for ΔRS.

Author Contributions

Conceptualization, M.F., I.J. and M.S. (Marko Spasenović); formal analysis, S.A., M.S. (Milija Sarajlić) and M.S. (Marko Spasenović); funding acquisition, M.S. (Marko Spasenović); investigation, S.A. and D.V.-R.; methodology, S.A., M.S. (Milija Sarajlić), M.F., I.J. and M.S. (Marko Spasenović); project administration, M.S. (Marko Spasenović); resources, M.S. (Marko Spasenović); supervision, I.J. and M.S. (Marko Spasenović); visualization, S.A., M.S. (Milija Sarajlić) and M.S. (Marko Spasenović); writing—original draft, M.S. (Milija Sarajlić), I.J. and M.S. (Marko Spasenović). All authors have read and agreed to the published version of the manuscript.

Funding

This research was funded by the Science Fund of the Republic of Serbia, grant number 6057070, project Gramulsen, and by the Ministry of Education, Science, and Technological Development of the Republic of Serbia (Ministarstvo Prosvete, Nauke i Tehnološkog Razvoja), grant number 451-03-9/2021-14/200026.

Data Availability Statement

The data presented in this study are available on request from the corresponding author. Data on resistance maxima at each given concentration and temperature are available in Supplementary Materials.

Conflicts of Interest

The authors declare no conflict of interest. The funders had no role in the design of the study; in the collection, analyses, or interpretation of data; in the writing of the manuscript; or in the decision to publish the results.

References

  1. Meyer, P.L.; Sigrist, M.W. Atmospheric Pollution Monitoring Using CO2-Laser Photoacoustic Spectroscopy and Other Techniques. Rev. Sci. Instrum. 1990, 61, 1779–1807. [Google Scholar] [CrossRef]
  2. Romanak, K.D.; Bennett, P.C.; Yang, C.; Hovorka, S.D. Process-Based Approach to CO2 Leakage Detection by Vadose Zone Gas Monitoring at Geologic CO2 Storage Sites. Geophys. Res. Lett. 2012, 39, 2–7. [Google Scholar] [CrossRef]
  3. Chen, S.J.; Hovde, D.C.; Peterson, K.A.; Marshall, A.W. Fire Detection Using Smoke and Gas Sensors. Fire Saf. J. 2007, 42, 507–515. [Google Scholar] [CrossRef]
  4. Mahyuddin, N.; Awbi, H.B. A Review of CO2 Measurement Procedures in Ventilation Research. Int. J. Vent. 2012, 10, 353–370. [Google Scholar] [CrossRef]
  5. Löwe, H.; Seufert, G.; Raes, F. Comparison of Methods Used within Member States for Estimating CO2 Emissions and Sinks According to UNFCCC and EU Monitoring Mechanism: Forest and Other Wooded Land. Biotechnol. Agron. Soc. Environ. 2000, 4, 315–319. [Google Scholar]
  6. Molina, A.; Escobar-Barrios, V.; Oliva, J. A Review on Hybrid and Flexible CO2 Gas Sensors. Synth. Met. 2020, 270, 116602. [Google Scholar] [CrossRef]
  7. Rebber, M.; Willa, C.; Koziej, D. Organic-Inorganic Hybrids for CO2 Sensing, Separation and Conversion. Nanoscale Horizons 2020, 5, 431–453. [Google Scholar] [CrossRef]
  8. Lin, Y.; Fan, Z. Compositing Strategies to Enhance the Performance of Chemiresistive CO2 Gas Sensors. Mater. Sci. Semicond. Process. 2020, 107, 104820. [Google Scholar] [CrossRef]
  9. Novoselov, K.S.; Geim, A.K.; Morozov, S.V.; Jiang, D.; Zhang, Y.; Dubonos, S.V.; Grigorieva, I.V.; Firsov, A.A. Electric Field in Atomically Thin Carbon Films. Science 2004, 306, 666–669. [Google Scholar] [CrossRef] [PubMed] [Green Version]
  10. Geim, A.K.; Novoselov, K.S. The Rise of Graphene. Nat. Mater. 2007, 6, 183–191. [Google Scholar] [CrossRef] [PubMed]
  11. Smith, A.D.; Elgammal, K.; Fan, X.; Lemme, M.C.; Delin, A.; Råsander, M.; Bergqvist, L.; Schröder, S.; Fischer, A.C.; Niklaus, F.; et al. Graphene-Based CO2 Sensing and Its Cross-Sensitivity with Humidity. RSC Adv. 2017, 7, 22329–22339. [Google Scholar] [CrossRef] [Green Version]
  12. Barkov, P.V.; Glukhova, O.E. Carboxylated Graphene Nanoribbons for Highly-Selective Ammonia Gas Sensors: Ab Initio Study. Chemosensors 2021, 9, 84. [Google Scholar] [CrossRef]
  13. Dan, Y.; Lu, Y.; Kybert, N.J.; Luo, Z.; Johnson, A.T.C. Intrinsic Response of Graphene Vapor Sensors. Nano Lett. 2009, 9, 1472–1475. [Google Scholar] [CrossRef] [Green Version]
  14. Ly, T.N.; Park, S. Highly Sensitive Ammonia Sensor for Diagnostic Purpose Using Reduced Graphene Oxide and Conductive Polymer. Sci. Rep. 2018, 8, 1–12. [Google Scholar] [CrossRef]
  15. Gupta Chatterjee, S.; Chatterjee, S.; Ray, A.K.; Chakraborty, A.K. Graphene-Metal Oxide Nanohybrids for Toxic Gas Sensor: A Review. Sensors Actuators B Chem. 2015, 221, 1170–1181. [Google Scholar] [CrossRef]
  16. Andrić, S.; Tomašević-Ilić, T.; Bošković, M.V.; Sarajlić, M.; Vasiljević-Radović, D.; Smiljanić, M.M.; Spasenović, M. Ultrafast Humidity Sensor Based on Liquid Phase Exfoliated Graphene. Nanotechnology 2021, 32, 025505. [Google Scholar] [CrossRef] [PubMed]
  17. Wang, C.; Zhu, J.; Liang, S.; Bi, H.; Han, Q.; Liu, X.; Wang, X. Reduced Graphene Oxide Decorated with CuO-ZnO Hetero-Junctions: Towards High Selective Gas-Sensing Property to Acetone. J. Mater. Chem. A 2014, 2, 18635–18643. [Google Scholar] [CrossRef]
  18. Salehi-Khojin, A.; Estrada, D.; Lin, K.Y.; Bae, M.-H.; Xiong, F.; Pop, E.; Masel, R.I. Polycrystalline Graphene Ribbons as Chemiresistors. Adv. Mater. 2012, 24, 53–57. [Google Scholar] [CrossRef]
  19. Wei, W.; Nong, J.; Zhang, G.; Tang, L.; Jiang, X.; Chen, N.; Luo, S.; Lan, G.; Zhu, Y. Graphene-Based Long-Period Fiber Grating Surface Plasmon Resonance Sensor for High-Sensitivity Gas Sensing. Sensors 2017, 17, 2. [Google Scholar] [CrossRef]
  20. Justino, C.I.L.; Gomes, A.R.; Freitas, A.C.; Duarte, A.C.; Rocha-Santos, T.A.P. Graphene Based Sensors and Biosensors. TrAC Trends Anal. Chem. 2017, 91, 53–66. [Google Scholar] [CrossRef]
  21. Yavari, F.; Koratkar, N. Graphene-Based Chemical Sensors. J. Phys. Chem. Lett. 2012, 3, 1746–1753. [Google Scholar] [CrossRef] [PubMed]
  22. Meng, F.L.; Guo, Z.; Huang, X.J. Graphene-Based Hybrids for Chemiresistive Gas Sensors. TrAC Trends Anal. Chem. 2015, 68, 37–47. [Google Scholar] [CrossRef]
  23. Varghese, S.S.; Lonkar, S.; Singh, K.K.; Swaminathan, S.; Abdala, A. Recent Advances in Graphene Based Gas Sensors. Sensors Actuators B Chem. 2015, 218, 160–183. [Google Scholar] [CrossRef]
  24. Gupta, M.; Hawari, H.F.; Kumar, P.; Burhanudin, Z.A.; Tansu, N. Functionalized Reduced Graphene Oxide Thin Films for Ultrahigh CO2 Gas Sensing Performance at Room Temperature. Nanomaterials 2021, 11, 623. [Google Scholar] [CrossRef]
  25. Seekaew, Y.; Wongchoosuk, C. A Novel Graphene-Based Electroluminescent Gas Sensor for Carbon Dioxide Detection. Appl. Surf. Sci. 2019, 479, 525–531. [Google Scholar] [CrossRef]
  26. Muhammad Hafiz, S.; Ritikos, R.; Whitcher, T.J.; Razib, N.M.; Bien, D.C.S.; Chanlek, N.; Nakajima, H.; Saisopa, T.; Songsiriritthigul, P.; Huang, N.M.; et al. A Practical Carbon Dioxide Gas Sensor Using Room-Temperature Hydrogen Plasma Reduced Graphene Oxide. Sensors Actuators B Chem. 2014, 193, 692–700. [Google Scholar] [CrossRef]
  27. Nemade, K.R.; Waghuley, S.A. Role of Defects Concentration on Optical and Carbon Dioxide Gas Sensing Properties of Sb2O3/Graphene Composites. Opt. Mater. (Amst.) 2014, 36, 712–716. [Google Scholar] [CrossRef]
  28. Nemade, K.R.; Waghuley, S.A. Highly Responsive Carbon Dioxide Sensing by Graphene/Al2O 3 Quantum Dots Composites at Low Operable Temperature. Indian J. Phys. 2014, 88, 577–583. [Google Scholar] [CrossRef]
  29. Lee, Z.Y.; Hawari, H.F.; Djaswadi, G.W.; Kamarudin, K. A Highly Sensitive Room Temperature CO2 Gas Sensor Based on SnO2-RGO Hybrid Composite. Materials 2021, 14, 522. [Google Scholar] [CrossRef] [PubMed]
  30. Fan, X.; Elgammal, K.; Smith, A.D.; Östling, M.; Delin, A.; Lemme, M.C.; Niklaus, F. Humidity and CO2 Gas Sensing Properties of Double-Layer Graphene. Carbon N. Y. 2018, 127, 576–587. [Google Scholar] [CrossRef]
  31. Chen, G.; Paronyan, T.M.; Harutyunyan, A.R. Sub-Ppt Gas Detection with Pristine Graphene. Appl. Phys. Lett. 2012, 101. [Google Scholar] [CrossRef]
  32. Yoon, H.J.; Jun, D.H.; Yang, J.H.; Zhou, Z.; Yang, S.S.; Cheng, M.M.C. Carbon Dioxide Gas Sensor Using a Graphene Sheet. Sensors Actuators B Chem. 2011, 157, 310–313. [Google Scholar] [CrossRef]
  33. Wang, S.; Ang, P.K.; Wang, Z.; Tang, A.L.L.; Thong, J.T.L.; Loh, K.P. High Mobility, Printable, and Solution-Processed Graphene Electronics. Nano Lett. 2010, 10, 92–98. [Google Scholar] [CrossRef] [PubMed]
  34. Wu, J.; Becerril, H.A.; Bao, Z.; Liu, Z.; Chen, Y.; Peumans, P. Organic Solar Cells with Solution-Processed Graphene Transparent Electrodes. Appl. Phys. Lett. 2008, 92, 263302. [Google Scholar] [CrossRef] [Green Version]
  35. Yu, G.; Hu, L.; Vosgueritchian, M.; Wang, H.; Xie, X.; McDonough, J.R.; Cui, X.; Cui, Y.; Bao, Z. Solution-Processed Graphene/MnO2 Nanostructured Textiles for High-Performance Electrochemical Capacitors. Nano Lett. 2011, 11, 2905–2911. [Google Scholar] [CrossRef] [PubMed]
  36. Jaber-Ansari, L.; Hersam, M.C. Solution-Processed Graphene Materials and Composites. MRS Bull. 2012, 37, 1167–1175. [Google Scholar] [CrossRef]
  37. Singh, N.S.; Mayanglambam, F.; Nemade, H.B.; Giri, P.K. Facile Synthetic Route to Exfoliate High Quality and Super-Large Lateral Size Graphene-Based Sheets and Their Applications in SERS and CO2 Gas Sensing. RSC Adv. 2021, 11, 9488–9504. [Google Scholar] [CrossRef]
  38. Eslamian, M. Inorganic and Organic Solution-Processed Thin Film Devices. Nano-Micro Lett. 2017, 9, 3. [Google Scholar] [CrossRef] [Green Version]
  39. Tomašević-Ilić, T.; Pešić, J.; Milošević, I.; Vujin, J.; Matković, A.; Spasenović, M.; Gajić, R. Transparent and Conductive Films from Liquid Phase Exfoliated Graphene. Opt. Quantum Electron. 2016, 48, 1–7. [Google Scholar] [CrossRef]
  40. Hanan Abdali; Bentolhoda Heli; Abdellah Ajji Stable and Sensitive Amino-Functionalized Graphene/Polyaniline Nanofiber Composites for Room-Temperature Carbon Dioxide Sensing. RSC Adv. 2019, 9, 41240–41247. [CrossRef] [Green Version]
  41. Bhadra, J.; Popelka, A.; Abdulkareem, A.; Ahmad, Z.; Touati, F.; Al-Thani, N. Fabrication of Polyaniline–Graphene/Polystyrene Nanocomposites for Flexible Gas Sensors. RSC Adv. 2019, 9, 12496–12506. [Google Scholar] [CrossRef] [Green Version]
  42. Abdali, H.; Heli, B.; Ajji, A. Cellulose Nanopaper Cross-Linked Amino Graphene/Polyaniline Sensors to Detect CO2 Gas at Room Temperature. Sensors 2019, 19, 5215. [Google Scholar] [CrossRef] [PubMed] [Green Version]
  43. Mishra, A.K.; Ramaprabhu, S. Nanostructured Polyaniline Decorated Graphene Sheets for Reversible CO2 Capture. J. Mater. Chem. 2012, 22, 3708–3712. [Google Scholar] [CrossRef]
  44. Zhang, J.; Liu, X.; Neri, G.; Pinna, N. Nanostructured Materials for Room-Temperature Gas Sensors. Adv. Mater. 2016, 28, 795–831. [Google Scholar] [CrossRef] [PubMed]
  45. Joshi, N.; Hayasaka, T.; Liu, Y.; Liu, H.; Oliveira, O.N.; Lin, L. A Review on Chemiresistive Room Temperature Gas Sensors Based on Metal Oxide Nanostructures, Graphene and 2D Transition Metal Dichalcogenides. Microchim. Acta 2018, 185, 1–16. [Google Scholar] [CrossRef]
  46. Malik, R.; Tomer, V.K.; Mishra, Y.K.; Lin, L. Functional Gas Sensing Nanomaterials: A Panoramic View. Appl. Phys. Rev. 2020, 7, 021301. [Google Scholar] [CrossRef] [Green Version]
  47. Matković, A.; Milošević, I.; Milićević, M.; Tomašević-Ilić, T.; Pešić, J.; Musić, M.; Spasenović, M.; Jovanović, D.; Vasić, B.; Deeks, C.; et al. Enhanced Sheet Conductivity of Langmuir-Blodgett Assembled Graphene Thin Films by Chemical Doping. 2D Mater. 2016, 3, 015002. [Google Scholar] [CrossRef]
  48. Petty, M.C. Langmuir-Blodgett Films: An Introduction; Cambridge University Press: Cambridge, UK, 1996; ISBN 9780521413961. [Google Scholar]
  49. Boon, E.P.; Le, L.T.; Lee, W.Y. Inversion of Temperature–Resistance Relationship by Enlarged Structural Defects in Graphene Oxide. Carbon N. Y. 2016, 102, 81–85. [Google Scholar] [CrossRef]
  50. Sarkar, S.; Amin, K.R.; Modak, R.; Singh, A.; Mukerjee, S.; Bid, A. Role of Different Scattering Mechanisms on the Temperature Dependence of Transport in Graphene. Sci. Rep. 2015, 5, 1–10. [Google Scholar] [CrossRef] [Green Version]
  51. Kaur, A.; Singh, R.C. Temperature Sensor Based on Exfoliated Graphene Sheets Produced by Microwave Assisted Freezing Induced Volumetric Expansion of Carbonated Water. J. Mater. Sci. Mater. Electron. 2019, 30, 5791–5807. [Google Scholar] [CrossRef]
  52. Tomašević-Ilić, T.; Jovanović, Đ.; Popov, I.; Fandan, R.; Pedrós, J.; Spasenović, M.; Gajić, R. Reducing Sheet Resistance of Self-Assembled Transparent Graphene Films by Defect Patching and Doping with UV/Ozone Treatment. Appl. Surf. Sci. 2018, 458, 446–453. [Google Scholar] [CrossRef] [Green Version]
  53. Petrucci, R.; Harwood, W.S.; Herring, G.F.; Madura, J.D. General Chemistry: Principles and Modern Applications, 9th ed.; Pearson Prentice Hall: Upper Saddle River, NJ, USA, 2007; ISBN 9780131493308. [Google Scholar]
  54. Sarajlić, M.; Đurić, Z.G.; Jović, V.B.; Petrović, S.P.; Đorđević, D.S. An Adsorption-Based Mercury Sensor with Continuous Readout. Microsyst. Technol. 2012, 19, 749–755. [Google Scholar] [CrossRef]
  55. Langmuir, I. The Adsorption of Gases on Plane Surfaces of Glass, Mica and Platinum. J. Am. Chem. Soc. 1918, 40, 1361–1403. [Google Scholar] [CrossRef] [Green Version]
  56. Endres, H.E.; Jander, H.D.; Göttler, W. A Test System for Gas Sensors. Sensors Actuators B Chem. 1995, 23, 163–172. [Google Scholar] [CrossRef]
  57. Ricciardella, F.; Lee, K.; Stelz, T.; Hartwig, O.; Prechtl, M.; McCrystall, M.; McEvoy, N.; Duesberg, G.S. Calibration of Nonstationary Gas Sensors Based on Two-Dimensional Materials. ACS Omega 2020, 5, 5959–5963. [Google Scholar] [CrossRef] [PubMed] [Green Version]
  58. Du, X.; George, S.M. Thickness Dependence of Sensor Response for CO Gas Sensing by Tin Oxide Films Grown Using Atomic Layer Deposition. Sensors Actuators B Chem. 2008, 135, 152–160. [Google Scholar] [CrossRef]
  59. Piccinini, E.; Alberti, S.; Longo, G.S.; Berninger, T.; Breu, J.; Dostalek, J.; Azzaroni, O.; Knoll, W. Pushing the Boundaries of Interfacial Sensitivity in Graphene FET Sensors: Polyelectrolyte Multilayers Strongly Increase the Debye Screening Length. J. Phys. Chem. C 2018, 122, 10181–10188. [Google Scholar] [CrossRef]
Figure 1. Schematic of the experimental setup. MFC 1 and 2 are mass flow controllers.
Chemosensors 09 00342 g001
Figure 2. Sample characterization: (a) optical photograph of the graphene sensor; (b) atomic force micrograph of the sensor surface.
Chemosensors 09 00342 g002
Figure 3. Sensor response to CO2 across the full volume concentration range of 0% to 100%.
Chemosensors 09 00342 g003
Figure 4. Temporal variation of sensor resistance caused by a change of CO2 concentration at five constant temperatures.
Chemosensors 09 00342 g004
Figure 5. Resistance change at a steady state, ΔRS, as a function of CO2 concentration at different temperatures.
Chemosensors 09 00342 g005
Figure 6. Temperature dependence of the steady-state sensor response for different concentrations of CO2.
Chemosensors 09 00342 g006
Figure 7. The measured resistance change ΔR (red curve) and the calculated quantity C × β according to the presented model (blue curve), as a function of time, for different CO2 concentrations. The temperature is 30 °C.
Chemosensors 09 00342 g007
Figure 8. Quantity obtained experimentally as a function of the actual gas concentration.
Chemosensors 09 00342 g008
Publisher’s Note: MDPI stays neutral with regard to jurisdictional claims in published maps and institutional affiliations.

