Article

Flexible Low-Temperature Ammonia Gas Sensor Based on Reduced Graphene Oxide and Molybdenum Disulfide

1
The Higher Educational Key Laboratory for Measuring & Control Technology and Instrumentations of Heilongjiang Province, Harbin University of Science and Technology, Harbin 150080, China
2
School of Atmospheric Sciences, Sun Yat-sen University, Guangzhou 519000, China
*
Author to whom correspondence should be addressed.
Submission received: 9 October 2021 / Revised: 27 November 2021 / Accepted: 30 November 2021 / Published: 7 December 2021
(This article belongs to the Special Issue 2D Materials for Gas Sensing)

Abstract

:
Owing to harsh working environments and complex industrial requirements, traditional gas sensors are prone to deformation damage, possess a limited detection range, require a high working temperature, and display low reliability, thereby necessitating the development of flexible and low-temperature gas sensors. In this study, we developed a low-temperature polyimide (PI)-based flexible gas sensor comprising a reduced graphene oxide (rGO)/MoS2 composite. The micro-electro-mechanical system technology was used to fabricate Au electrodes on a flexible PI sheet to form a “sandwiched” sensor structure. The rGO/MoS2 composites were synthesized via a one-step hydrothermal method. The gas-sensing response was the highest for the composite comprising 10% rGO. The structure of this material was characterized, and a PI-based flexible gas sensor comprising rGO/MoS2 was fabricated. The optimal working temperature of the sensor was 141 °C, and its response-recovery time was significantly short upon exposure to 50–1500 ppm NH3. Thus, this sensor exhibited high selectivity and a wide NH3 detection range. Furthermore, it possessed the advantages of low power consumption, a short response-recovery time, a low working temperature, flexibility, and variability. Our findings provide a new framework for the development of pollutant sensors that can be utilized in an industrial environment.

1. Introduction

Ammonia is the second most produced chemical in the world and the most common industrial pollutant because of illegal ammonia discharge owing to leakage during chemical processing. Moreover, as a green and clean source of energy, ammonia has been developed for various applications, including use as rocket fuel [1] as well as in fuel cells [2], hydrogen-storage materials [3], and new energy vehicles [4]. This widespread use has resulted in an increase in ammonia leakage during industrial production processes. Thus, it is important to address the problem of ammonia leakage through the implementation of effective ammonia sensors in industries [5]. Presently, the most commonly used gas sensors are semiconductor gas sensors made of metal oxide or polymer materials; they are widely used for detecting the leakage of toxic and harmful gases [6,7]. However, because of their slow desorption characteristics, such sensors require a high working temperature. Furthermore, traditional sensors suffer from problems such as low selectivity, a narrow gas detection range, and high power consumption. Moreover, some sensors exhibit baseline drift and need to be recalibrated frequently [8].
Most ammonia sensors contain silicon or ceramic substrates that are rigid, brittle, and fragile [9], which make the sensors prone to deformation and damage, because industrial environments are complex and industrial gas leakage is often accompanied by stress shock. These problems can be prevented by developing sensors with flexible substrates, which are expandable, stable, and stretchable [10], making them functional after deformation induced by the impact of external forces. Such sensors can meet the gas-detection requirements in complex and dynamic environments and can be used in the fields with high ammonia concentration, such as industrial preparation of ammonia fuel and industrial ammonia storage.
In recent years, two-dimensional materials such as transition metal dichalcogenides (TMDCs) have gained considerable research attention because of their applicability as gas sensors. TMDCs possess an MX2 structure, where M is a transition metal (molybdenum, tungsten, or titanium) and X is a chalcogen atom (such as sulfur and selenium). The layered structure of TMDCs, with strong in-plane bonding and weak van der Waals interplanar bonding, enables its easy peeling off by mechanical means [11]. Furthermore, TMDCs are notable for their high surface area-to-volume ratio, absence of dangling bonds, strong spin–orbit-coupling interaction, and high gas-adsorption capability [12,13]. TMDC materials possess remarkable layer-related electrical, optical [14], thermal [15], and mechanical properties [16], which can be adjusted easily by various external treatments, such as strain application [17] and size scaling [18]. Thus, TMDC materials have demonstrated potential for applications in nanoelectronics [7], spintronics [19] and as photodetectors [20] and active gas sensors. In addition, it has been reported that molybdenum disulfide (MoS2) sheets can be bent to a radius of 0.75 mm without affecting their electronic properties [21]. Furthermore, MoS2 films possess a high Young’s modulus of up to 300 GPa, continuous crack deformity of up to 11%, and excellent transparency [22], rendering them a candidate material for flexible devices [23,24,25].
MoS2 exhibits excellent sensitivity to ammonia and can detect ammonia efficiently. However, after gas adsorption, the material cannot be completely restored, which affects sensor performance [21]. In 2012, Li et al. studied the responsiveness of MoS2 materials comprising different layers to NO gas and observed unstable sensor performance after repeated cycle tests, indicating that the materials are not conducive to repeated use [26]. In 2015, Ricciardella et al. reported a graphene-based gas sensor fabricated via chemical vapor deposition. The NH3 detection limits were up to 17 ppm. However, the recovery time was 20 min [27]. In 2016, Long et al. fabricated a MoS2/graphene hybrid structure and developed an ultrasensitive NH3 sensor with a detection limit of 50 ppb. However, its recovery was low [28]. Recently, several reports have been published on the fabrication of mixed MoS2 heterostructures for the improvement of the charge transfer in MoS2 and, therefore, shortening the recovery time. In 2018, Min et al. successfully fabricated a MoS2/reduced graphene oxide (rGO) gas sensor by an aqueous solution mixing method [29]. At 25 °C, the response of a MoS2/rGO material to NO2 was 4-fold that of pure rGO, and the flexural radius of the sensor was up to 14 mm. However, its responsiveness was low, and the deformation curvature and stability need to be improved. In 2020, Sangeetha et al. prepared a MoS2–rGO-composite-based optical-fiber sensor via a coating-modification method to detect formaldehyde gas and to determine its concentration [30]. However, the detection attains saturation at ~500 ppm, which limits the detection of higher gas concentrations. These findings indicate that the use of two-dimensional materials, such as graphene and TMDCs, in gas sensors can enable their operation at low temperatures and improve their gas-sensing performance, while increasing their gas-sensing response. However, problems such as a long response-recovery time, low flexibility, incomplete sensor recovery, and a narrow detection range remain to be solved.
In this study, we developed a low-temperature polyimide (PI)-based flexible gas sensor comprising a MoS2/rGO composite. A heating sensor and gas-sensing electrode were fabricated on the front and back sides of flexible PI sheets via the micro-electro-mechanical-system (MEMS) technology. Sensing materials MoS2 and rGO were synthesized via a one-step hydrothermal method to achieve gas-sensing properties. The morphology of the synthetic materials was characterized by field-emission scanning electron microscopy (SEM), X-ray diffraction (XRD) analysis, Brunauer–Emmett–Teller (BET) surface area analysis, Raman spectroscopy, and thermogravimetric analysis (TGA). Further, a gas-sensing test platform was established to verify the flexibility, selectivity, optimal working conditions, and gas-sensing response of the sensor. The mechanism of the sensor was also discussed.

2. Materials and Methods

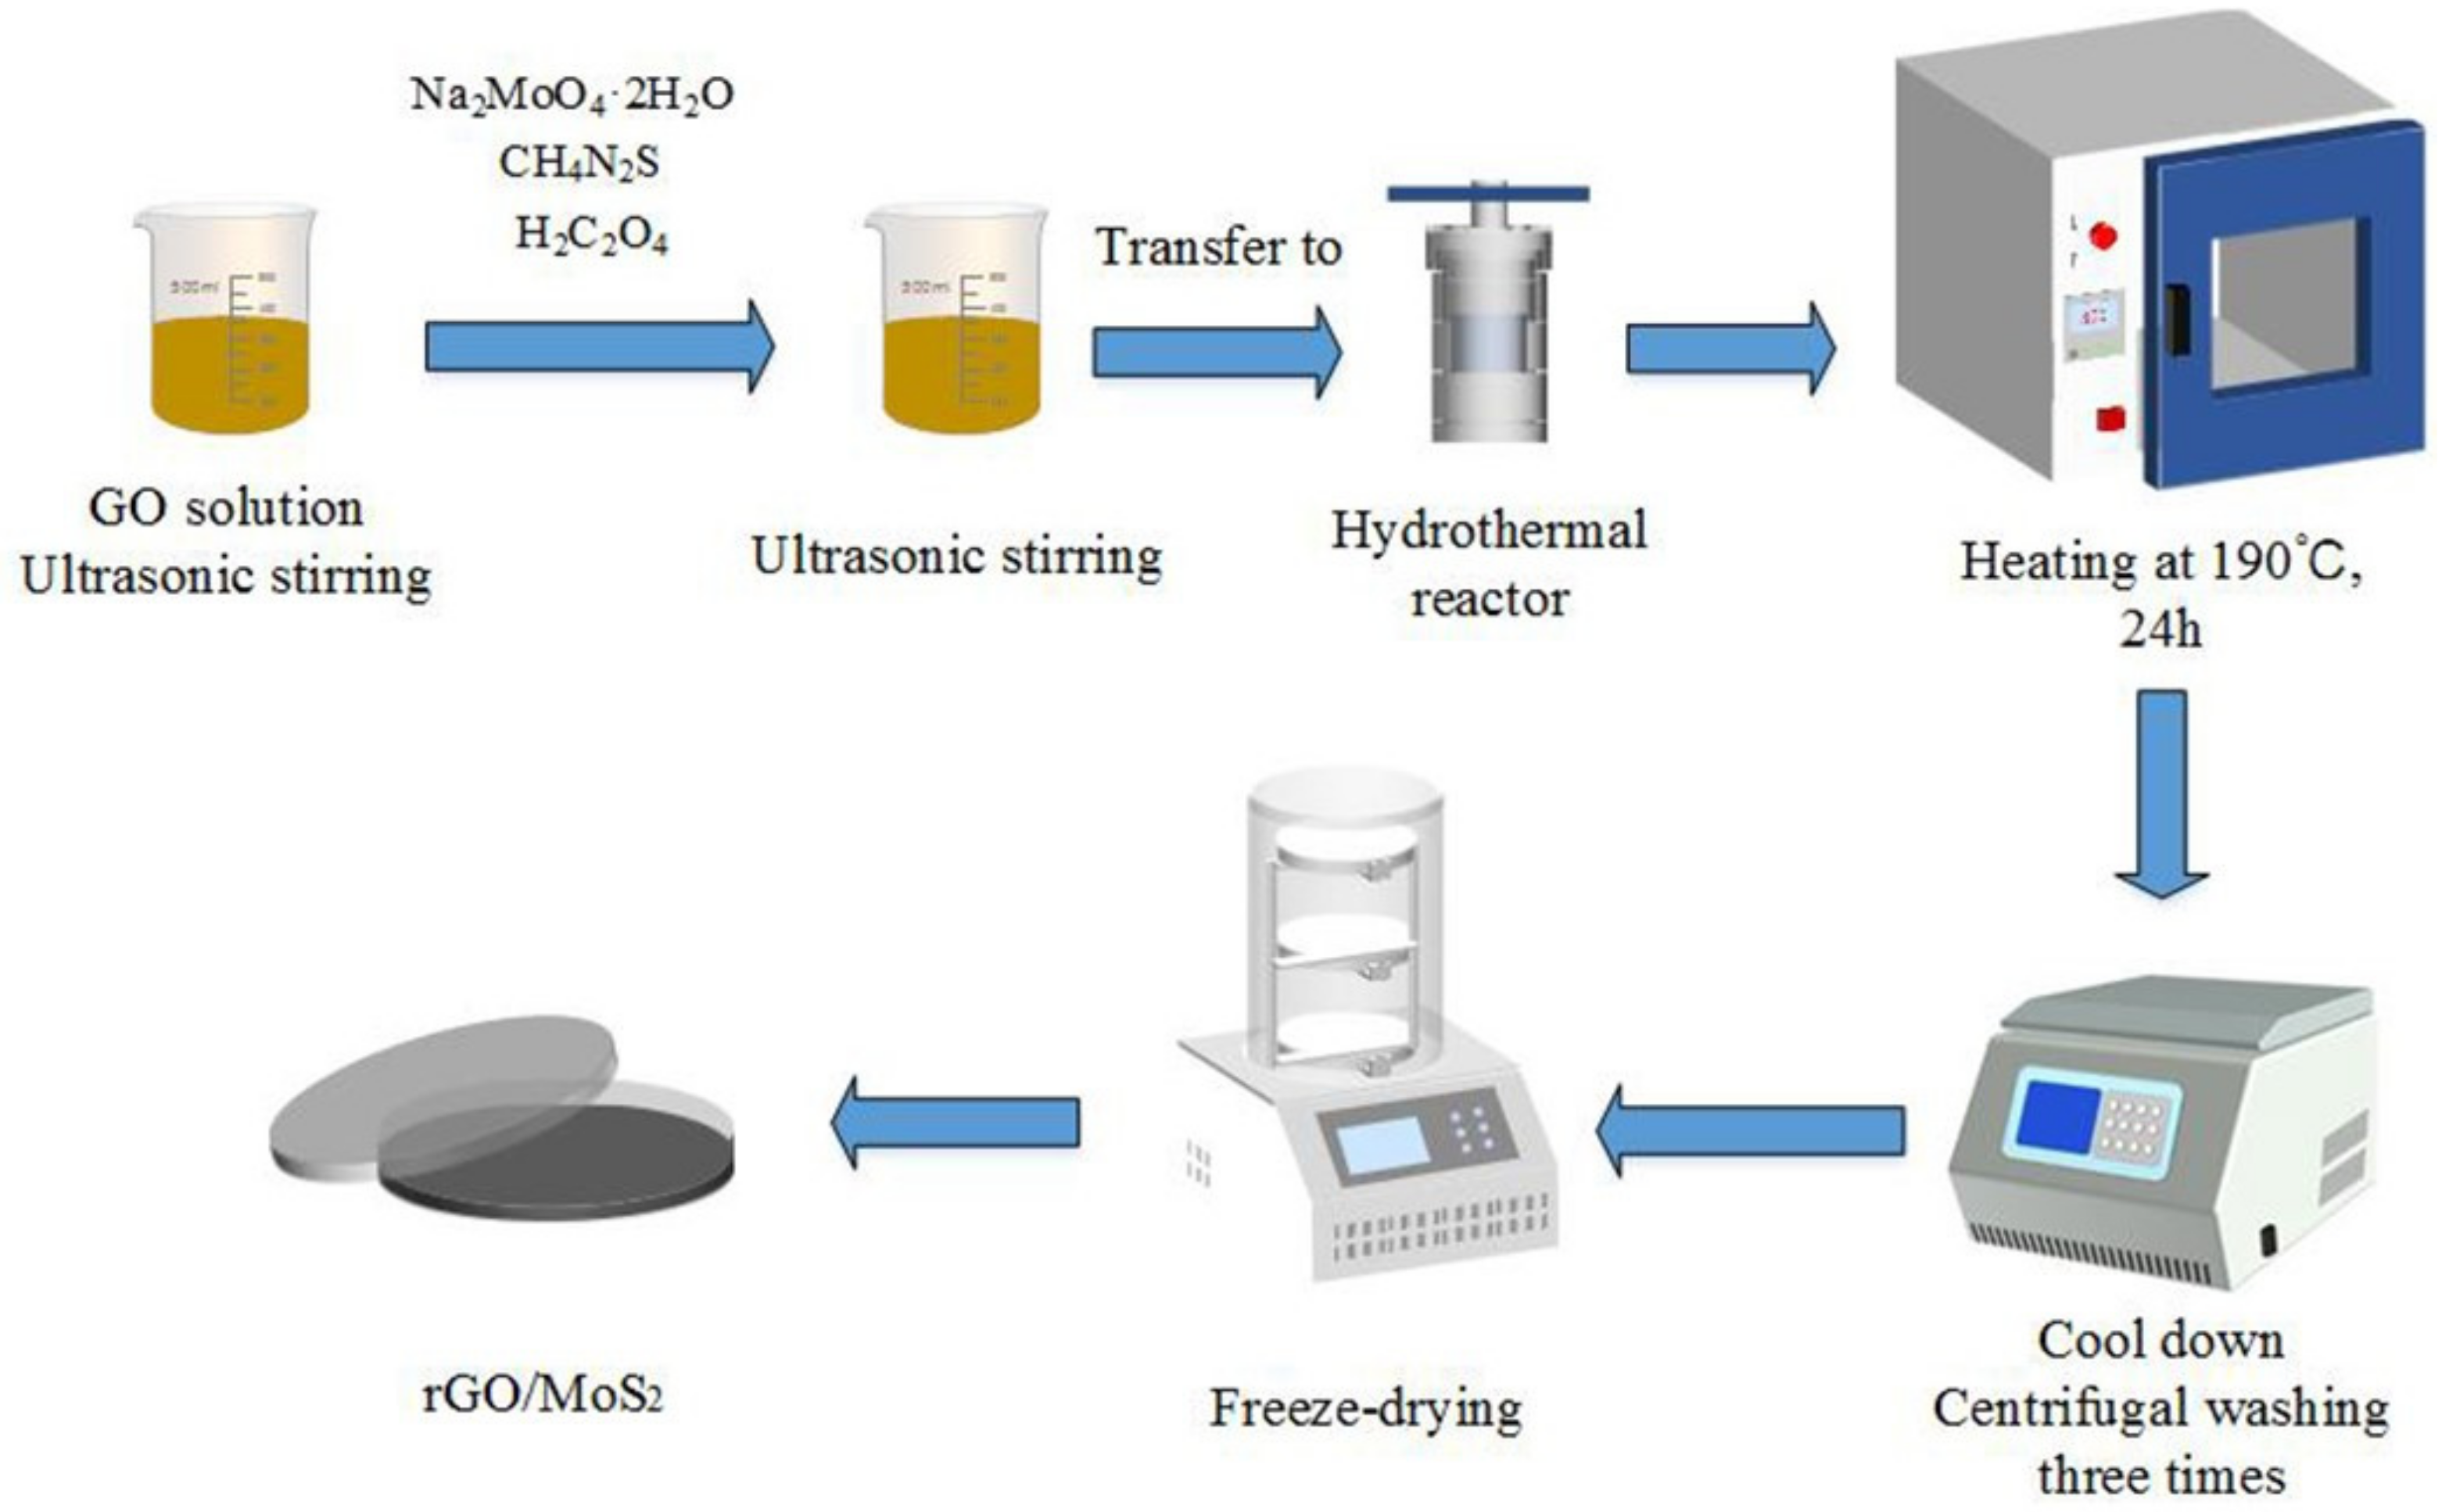
2.1. Synthesis of Sensing Materials

A graphene oxide (GO) dispersion (2 mg/mL) was prepared via Hummers’ method using graphite powder purchased from XFNANO Materials Tech Co., Ltd. (Nanjing, China) [31]. Further, 5%, 10%, and 15% GO solutions were prepared by stirring GO in 50 mL deionized water; they were used as the experimental precursors. Sodium molybdate dihydrate (Na2MoO4·2H2O, analytical grade, 3.82 g), thiourea (CH4N2S, analytical grade, 3.42 g), and oxalic acid (H2C2O4, analytical grade, 0.5 g) were dissolved in 50 mL of the GO precursor solution and stirred for 1 h at 25 °C. Then, the mixture was sonicated for 1 h, transferred to a 60 mL Teflon-lined stainless-steel vessel, and maintained at 190 °C for 24 h. After naturally cooling the mixture to 25 °C, the precipitate was separated by centrifugation at 2000 rpm for 10 min and washed several times using absolute ethanol and deionized water and then dried by freeze-drying at −70 °C. Subsequently, the nanocomposites were obtained in a powder form. To obtain pure MoS2, the process was repeated without using GO. Further, a control comprising only rGO was prepared. A schematic of the synthesis process is shown in Figure 1. The obtained material was characterized, and its gas-sensing performance was analyzed.

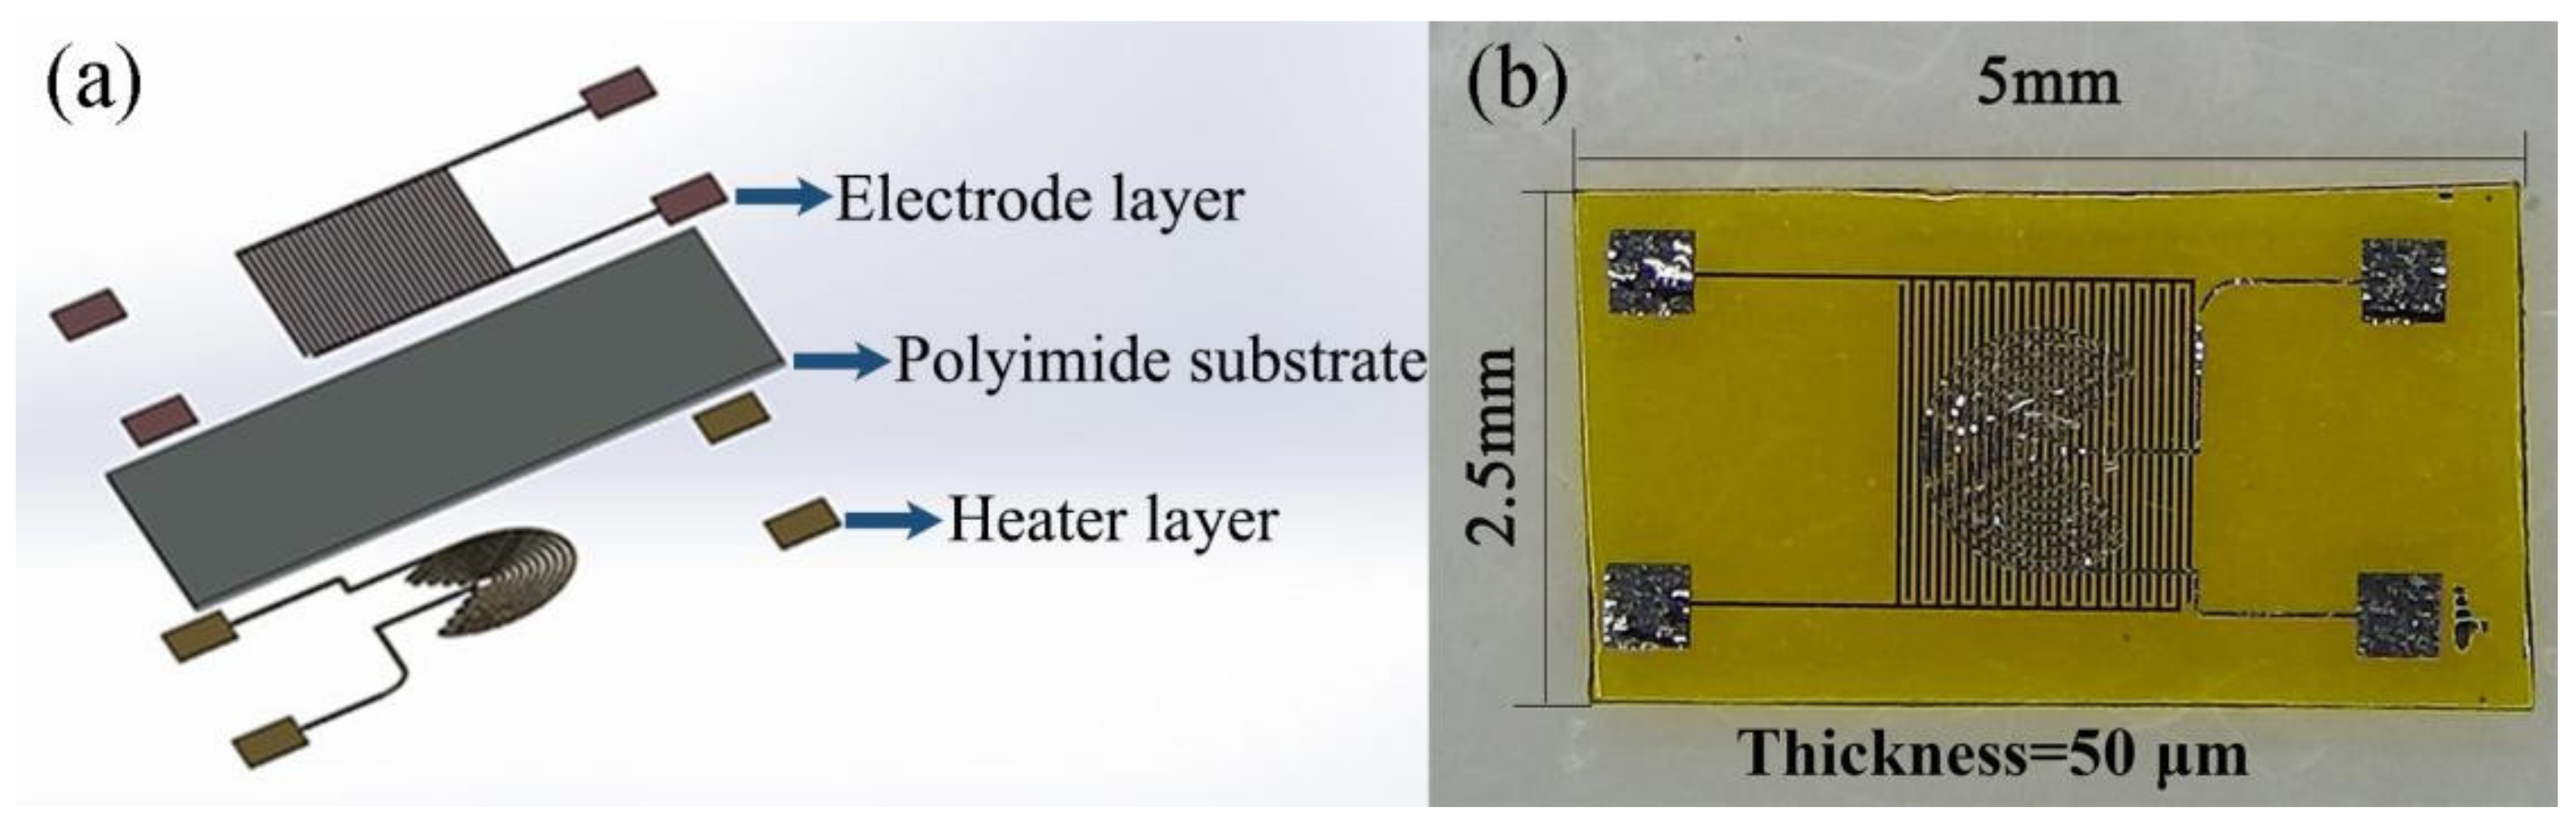
2.2. Fabrication of Flexible Gas Sensors

The structural design of the flexible gas sensor is shown in Figure 2. The sensor chip included a Pt heating layer, a flexible PI insulating substrate, and a sensitive layer comprising a Pt interdigital electrode, to form a sandwiched structure. The dimensions of the sensor chip were 5 mm × 2.5 mm × 50 μm.
The flexible gas sensors were fabricated as follows: PI films (50 μm), employed as the substrates, were cleaned three times via sequential ultrasonication in acetone and isopropanol. Then, the substrates were heated at 100 °C for 10 min and blow-dried with N2. Heating electrode coils and interdigital electrodes, both with a thickness of 20 μm, were fabricated through photolithography. Pt was used to fabricate the electrodes on both sides. To improve the mechanical properties, metal pads of the same size were prepared on the rear side of each pair of electrode pads. The electrode pads and conductor were connected using a conductive adhesive silver paste, and the electrical signal data were collected through a data acquisition unit.

2.3. Characterization of Sensing Materials

The sensing materials were analyzed via XRD analysis (Ultima IV, Rigaku, Tokyo, Japan) by using a high-intensity Cu Kα source (λ = 0.154 nm) at a scan rate of 5°/min, across a 2θ range of 5°–75°. The crystallization phase and crystallinity of the samples were identified from the XRD patterns obtained. The surface morphologies of the samples were analyzed via FE-SEM (JEOL JSM-7500F, Tokyo, Japan). Further, the samples were subjected to Raman analysis (Renishaw inVia Raman spectrometer, Renishaw plc., Wotton-under-Edge, UK), and the characteristic peaks of graphene contained in the sample were analyzed from the spectra obtained. Furthermore, the sensing materials were placed in a vacuum tube, degassed at 120 °C for 12 h, and the N2 adsorption–desorption curves of the samples were obtained at 350 °C by using a specific surface area and porosity analyzer (ASAP 2460 Version 3.01, Micromeritics Instrument (Shanghai) Ltd., Shanghai, China). The gas-adsorption capacity of the sensing materials was evaluated using the BET equation. A thermal image analyzer (Flir C3, West Malling, Kent, UK) was used to evaluate the heat. The thermogravimetric analysis (TGA) and differential thermal analysis (DTA) of the sensing materials were analyzed by ZCT-B-type differential thermal gravimetric analysis.

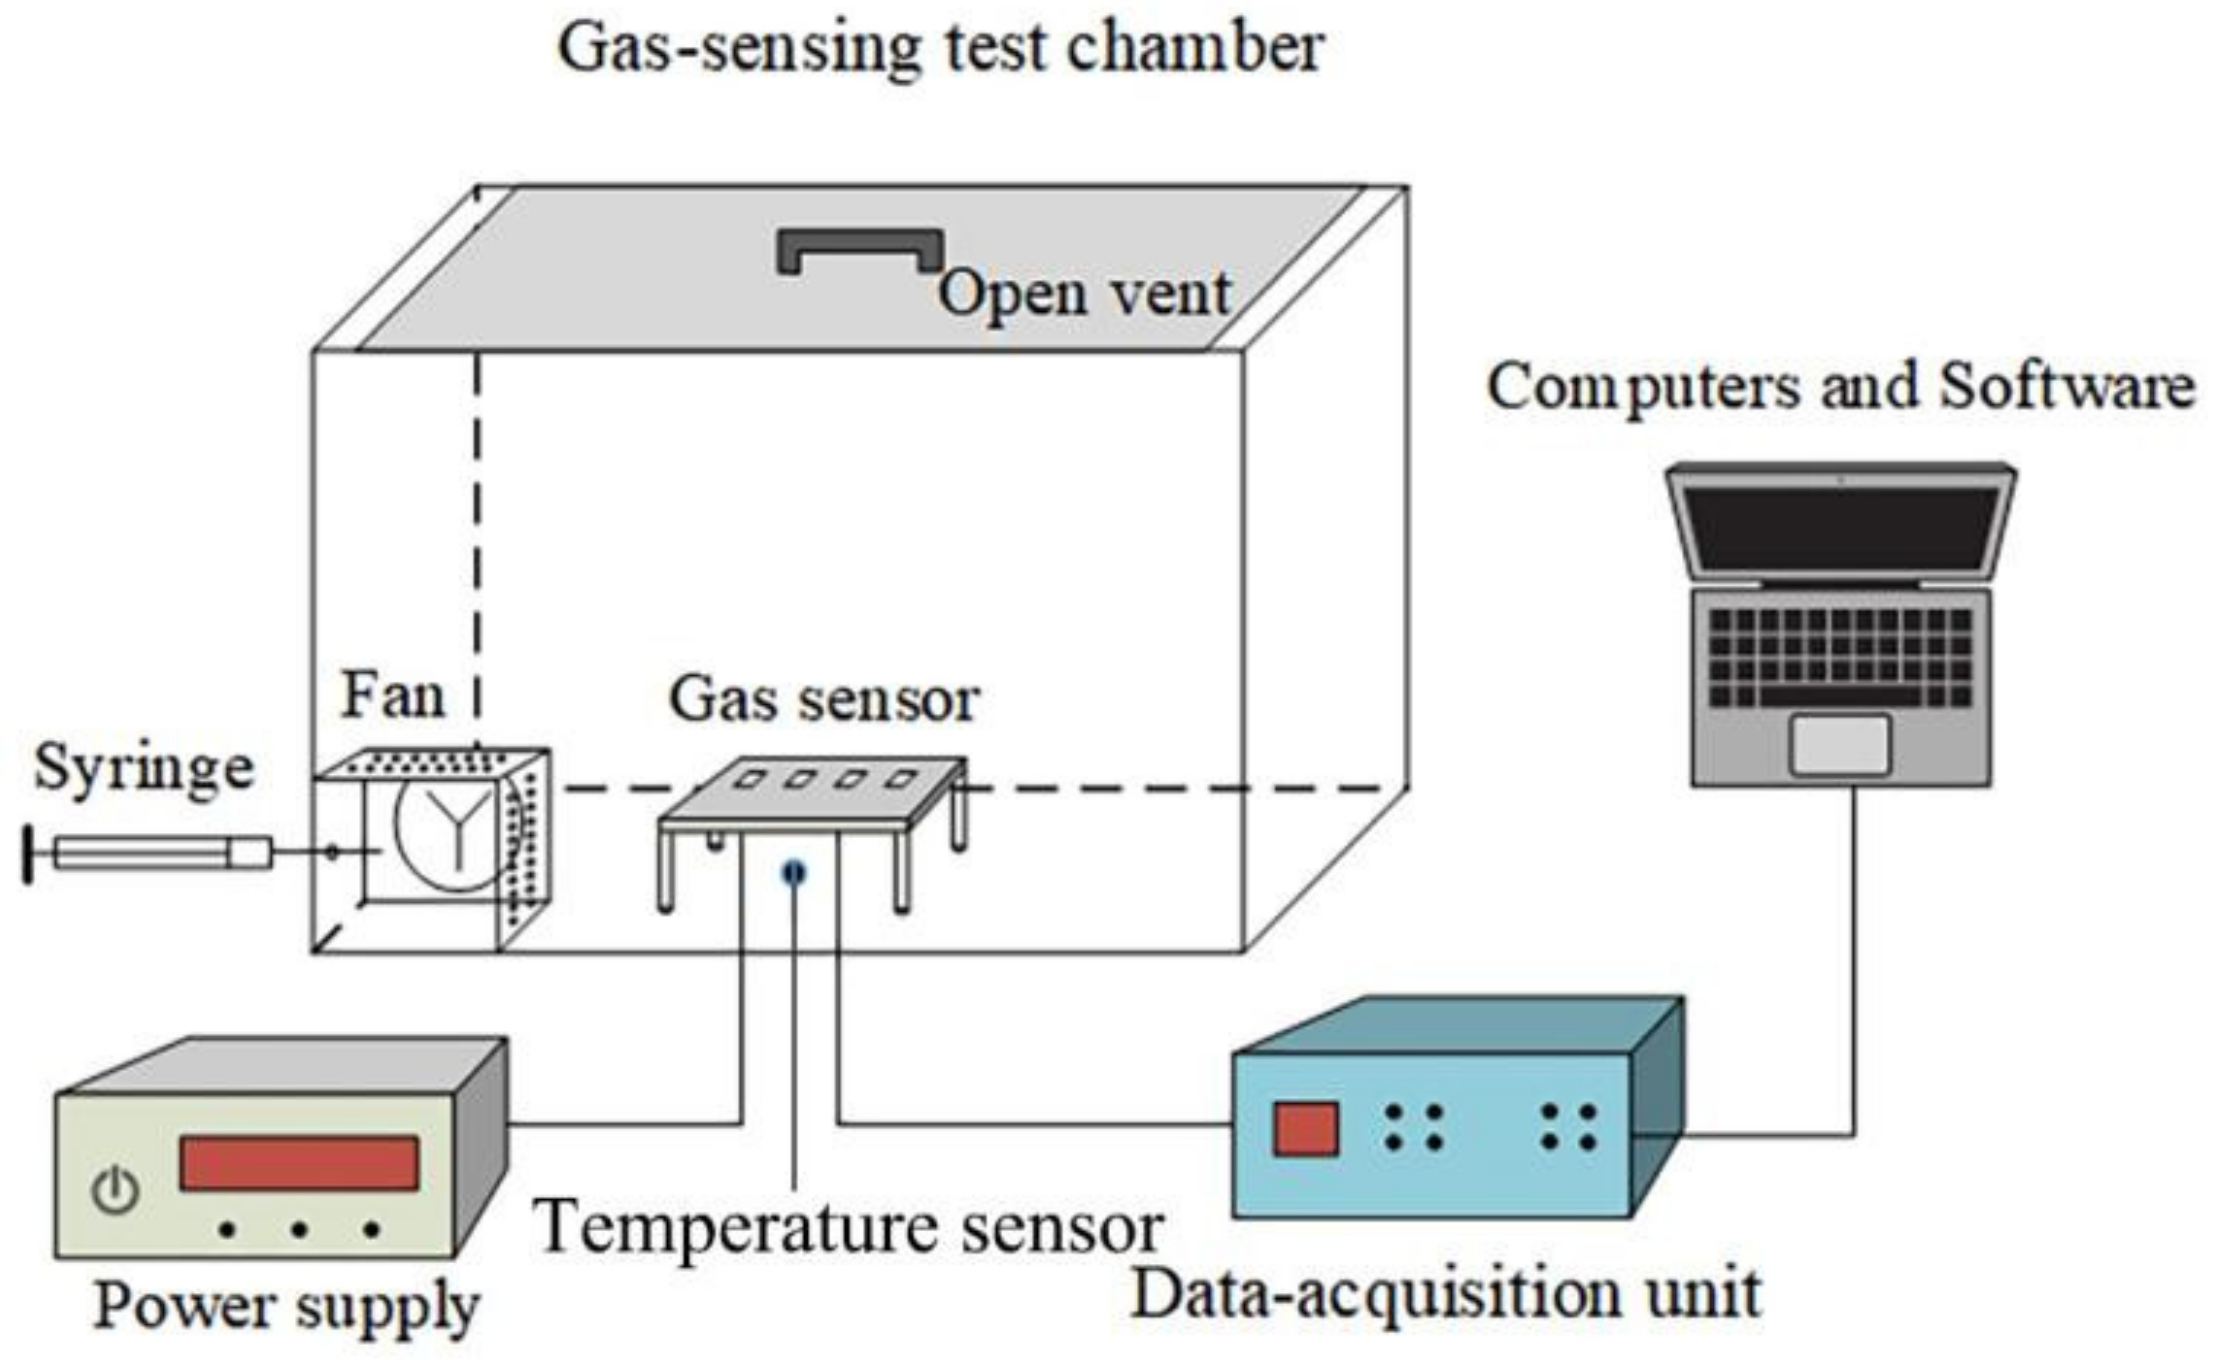
2.4. Test Platform for Gas Sensing

An appropriate amount of terpineol was added to the as-prepared samples and ground separately in a pestle and mortar for 1 h each to obtain 5%, 10%, 15%, pure rGO, and pure MoS2 slurries. Then, for each sample, a small amount of the slurry was coated onto the surface of the flexible interdigital electrode and dried at 80 °C for 1 h. Further, to improve the stability and repeatability of the sensors, they were aged at 60 °C for a week in air. The sensing measurements were carried out on an experimental platform that was developed in our laboratory. The resistance of the MoS2/rGO sensor was measured via the two-wire resistance measurement method. The platform comprised a closed sensor chamber (60 L), low-power circulating fan, data acquisition card, and computer-controlled software system, as shown in Figure 3. The volume of the gas was calculated corresponding to the concentration, and a calibrated gas sampler (e.g., syringe) was used to inject a certain volume of gas into the test chamber. For example, 2 μL corresponded to 10 ppm, and 100 μL corresponded to 500 ppm. Because the volume of the chamber was much larger than that of the injected gas, the gas-sampling error was neglected. The gas was rapidly and evenly distributed by using a fan. When the test gas was adsorbed onto the sensing material, the resistance of the sensing material changed and the electrical signal was measured. Simultaneously, the control software recorded the data by using a data-acquisition unit.

3. Results and Discussion

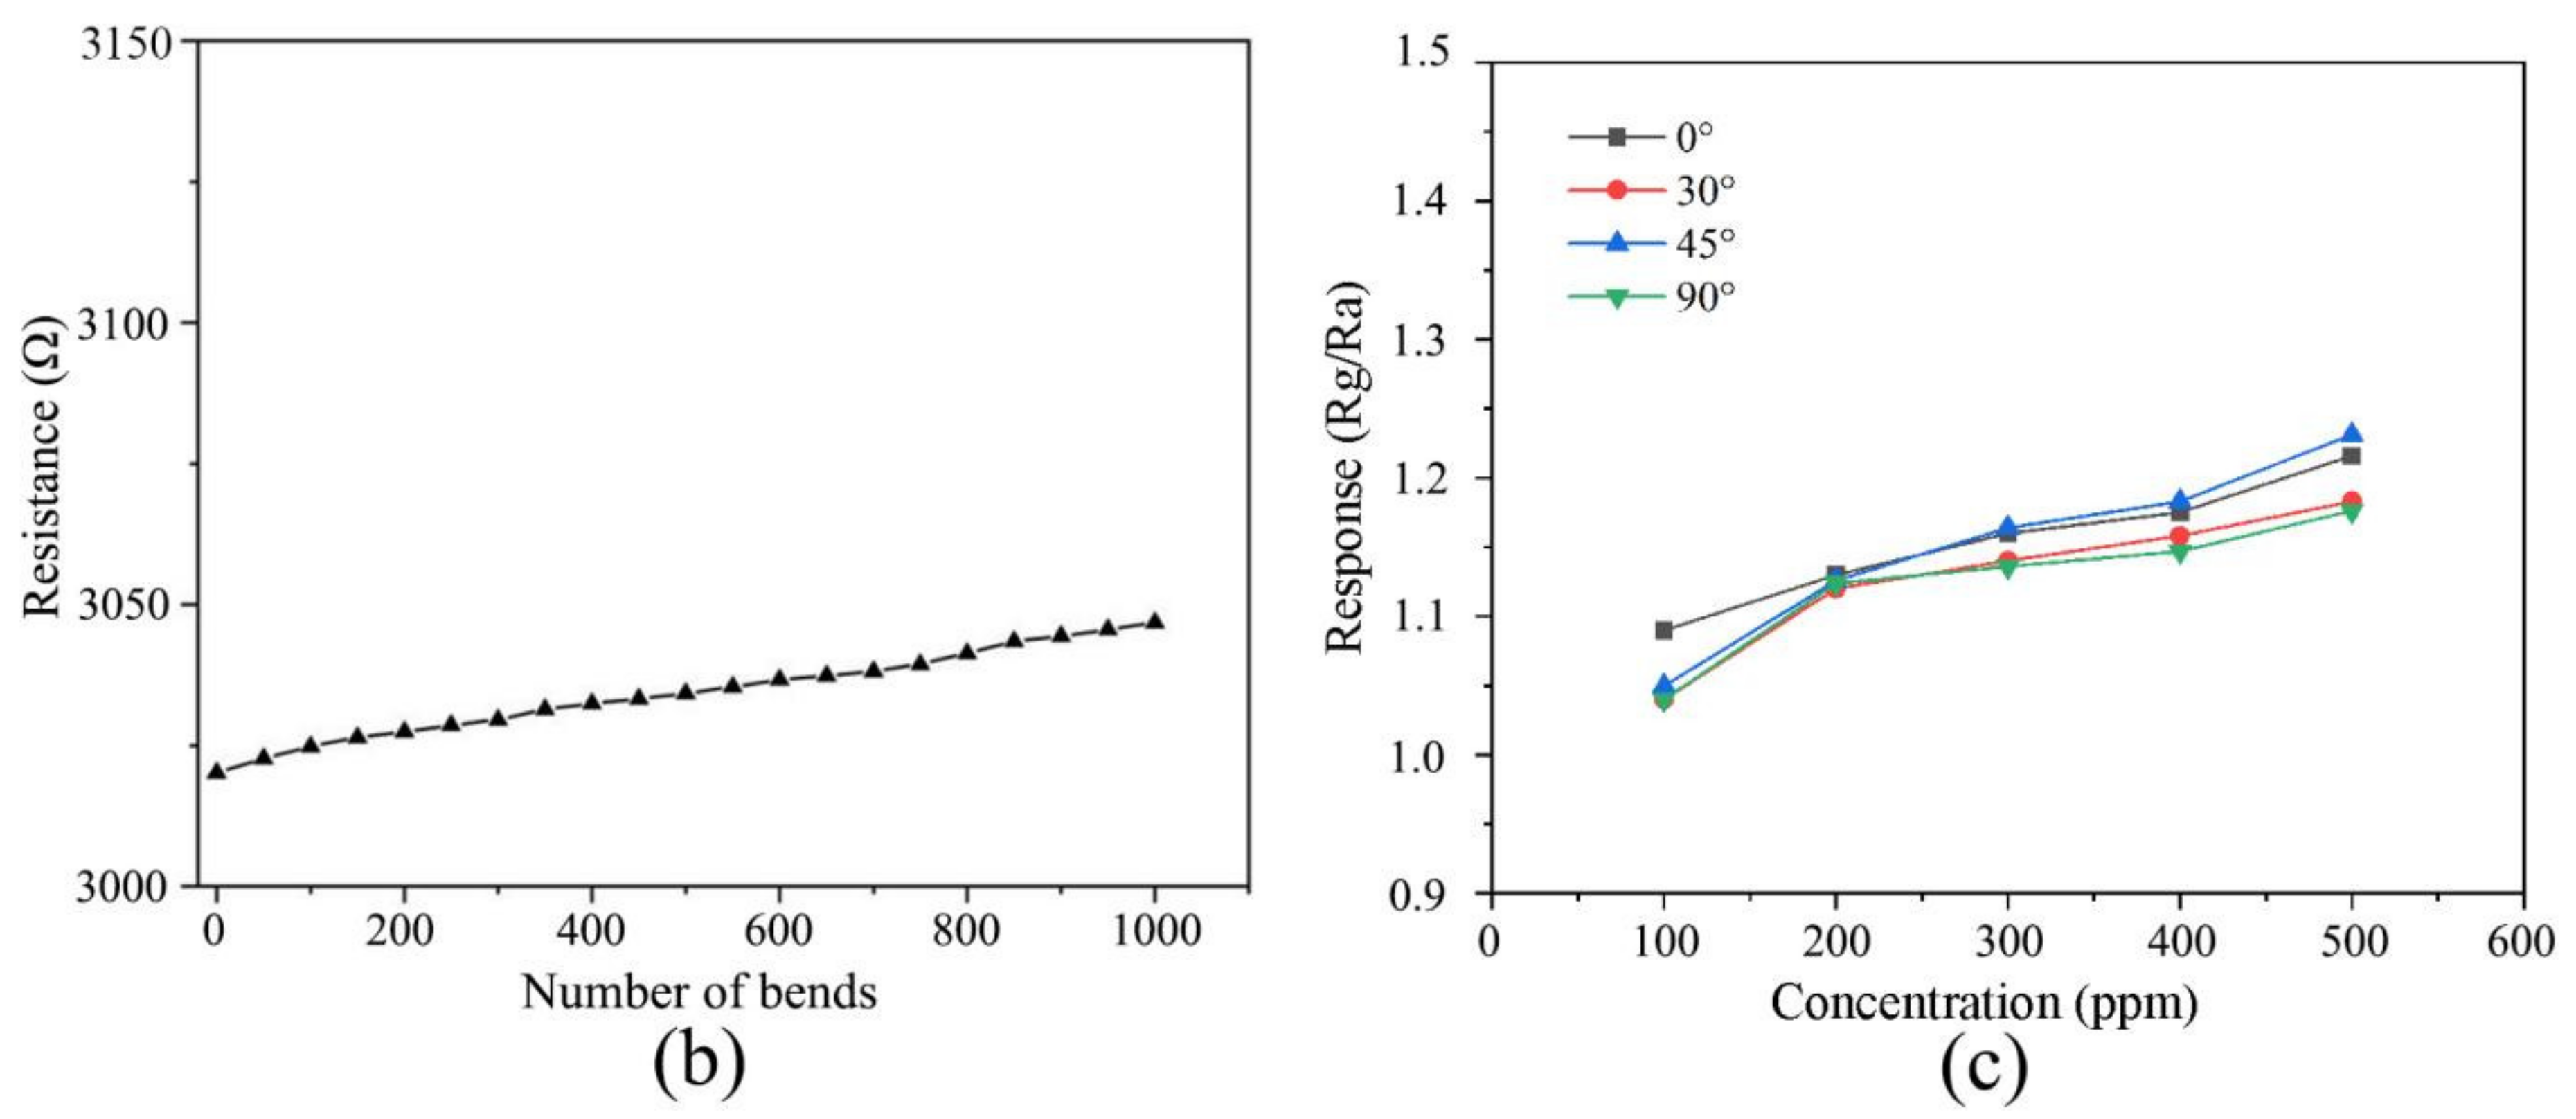
3.1. Sensor Flexibility Test

To verify the applicability of the rGO/MoS2 flexible gas sensor in wearable and variable electronic equipment, the mechanical properties such as bending and fatigue resistance of the device were evaluated. In this study, the change in device resistance with the number of bends was investigated. A bending experiment was conducted using a bending machine (Bending system, Custom-made setup), as shown in Figure 4a, and the precision of this test was 0.9°. The results of the bending experiment showed that continuous mechanical bending slightly increased the resistance. As shown in Figure 4b, although a small increase in resistance is observed owing to the tensile effect, the resistance of the device is maintained after 1000 bends. Furthermore, the response of the rGO/MoS2 sensor to the change in NH3 gas concentration at different bending angles (0°, 30°, 45°, and 90°) was studied. The deviation owing to the inherent resistance of the substrate was eliminated by calibration. As shown in Figure 4c, the sensor demonstrates excellent gas-sensing performance at bending angles of 0°–90°. The fabricated device exhibited relatively stable conductivity and high bending resistance. The experimental results show that the fabricated rGO/MoS2 sensor possesses mechanical flexibility and can be applicable in complex industrial environments.

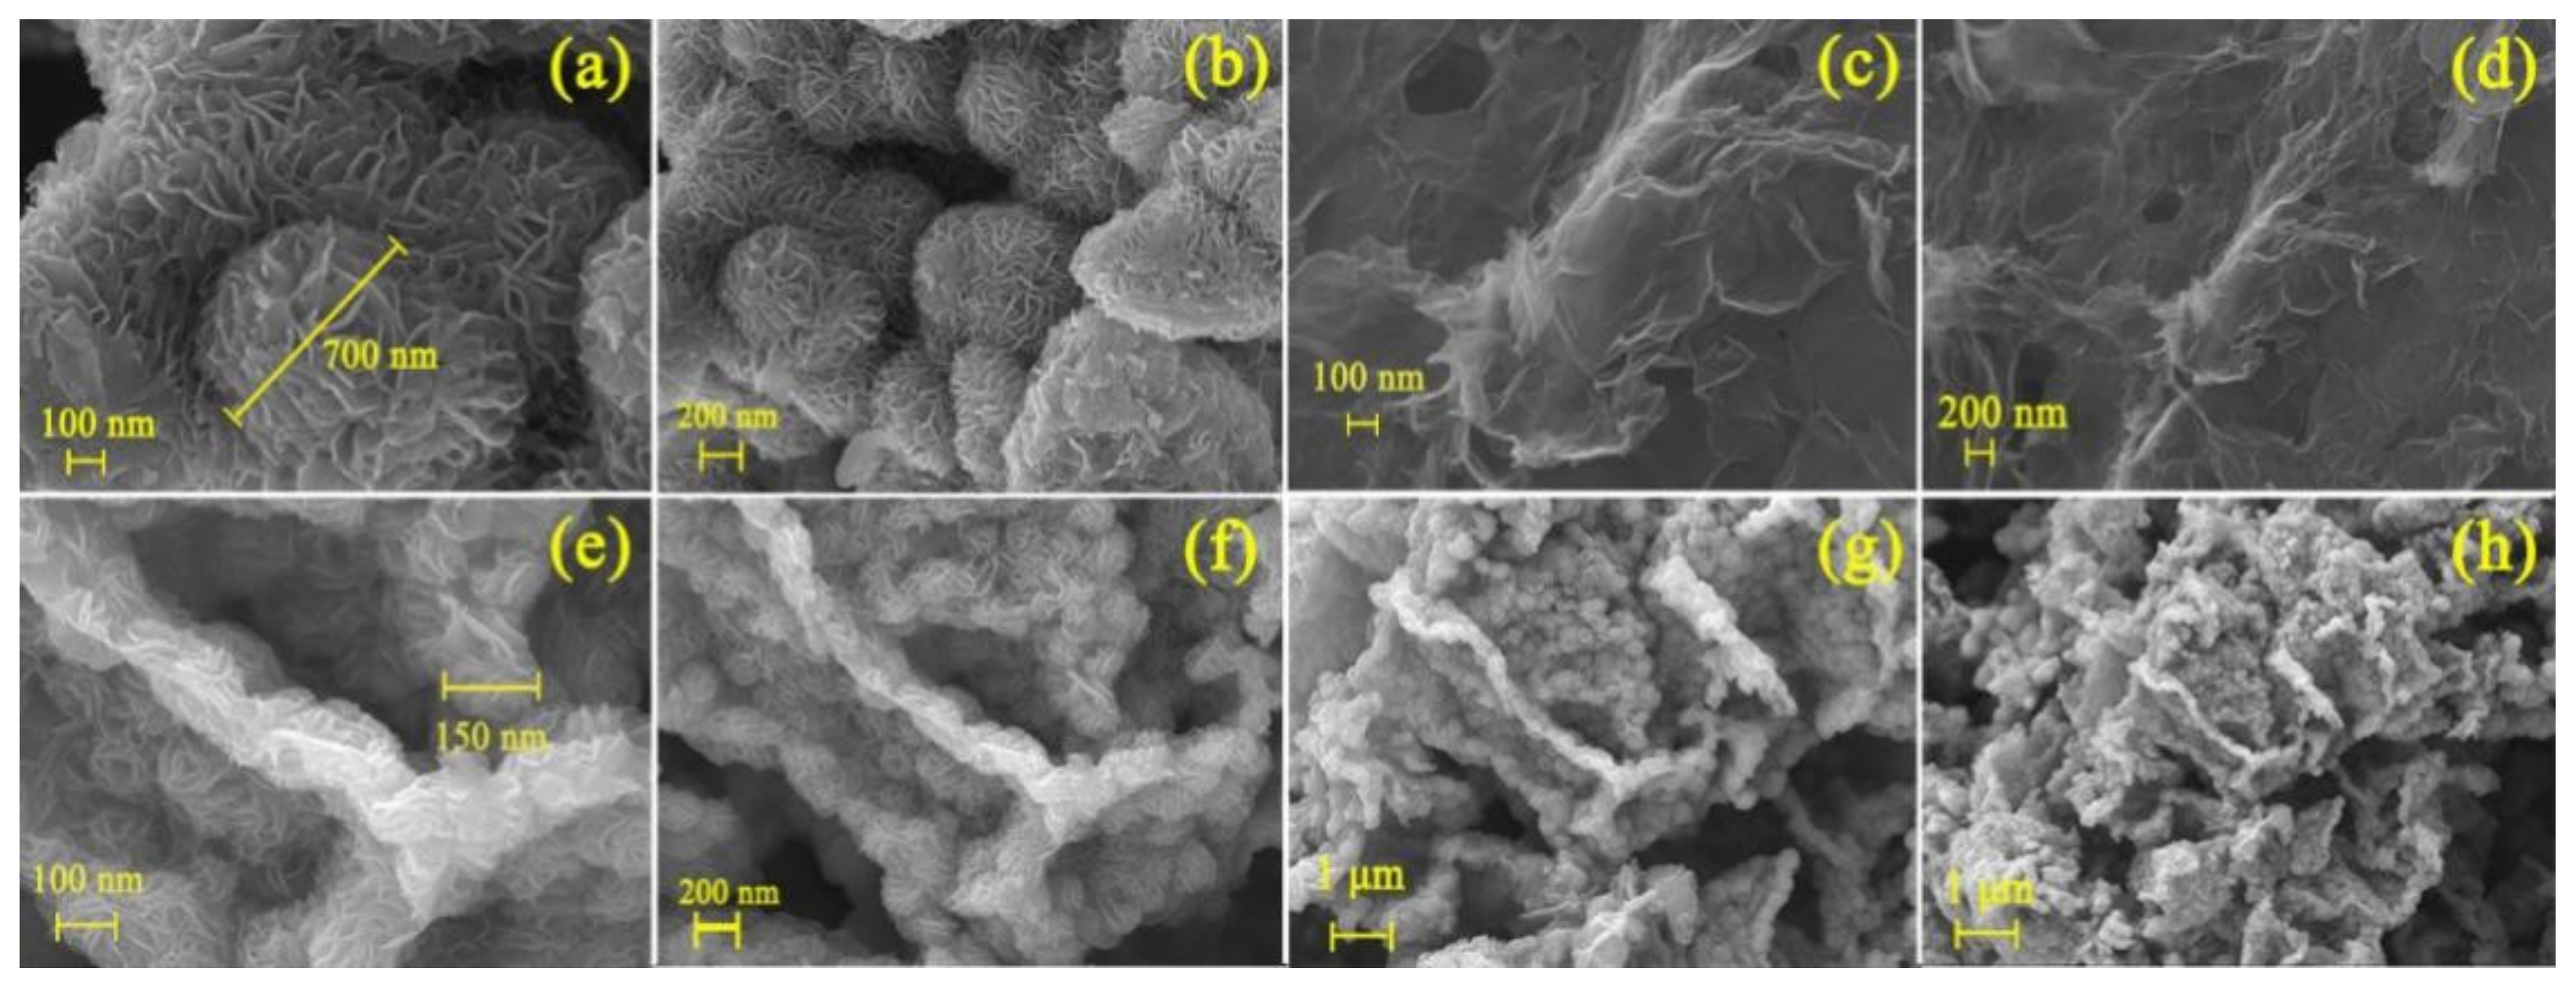
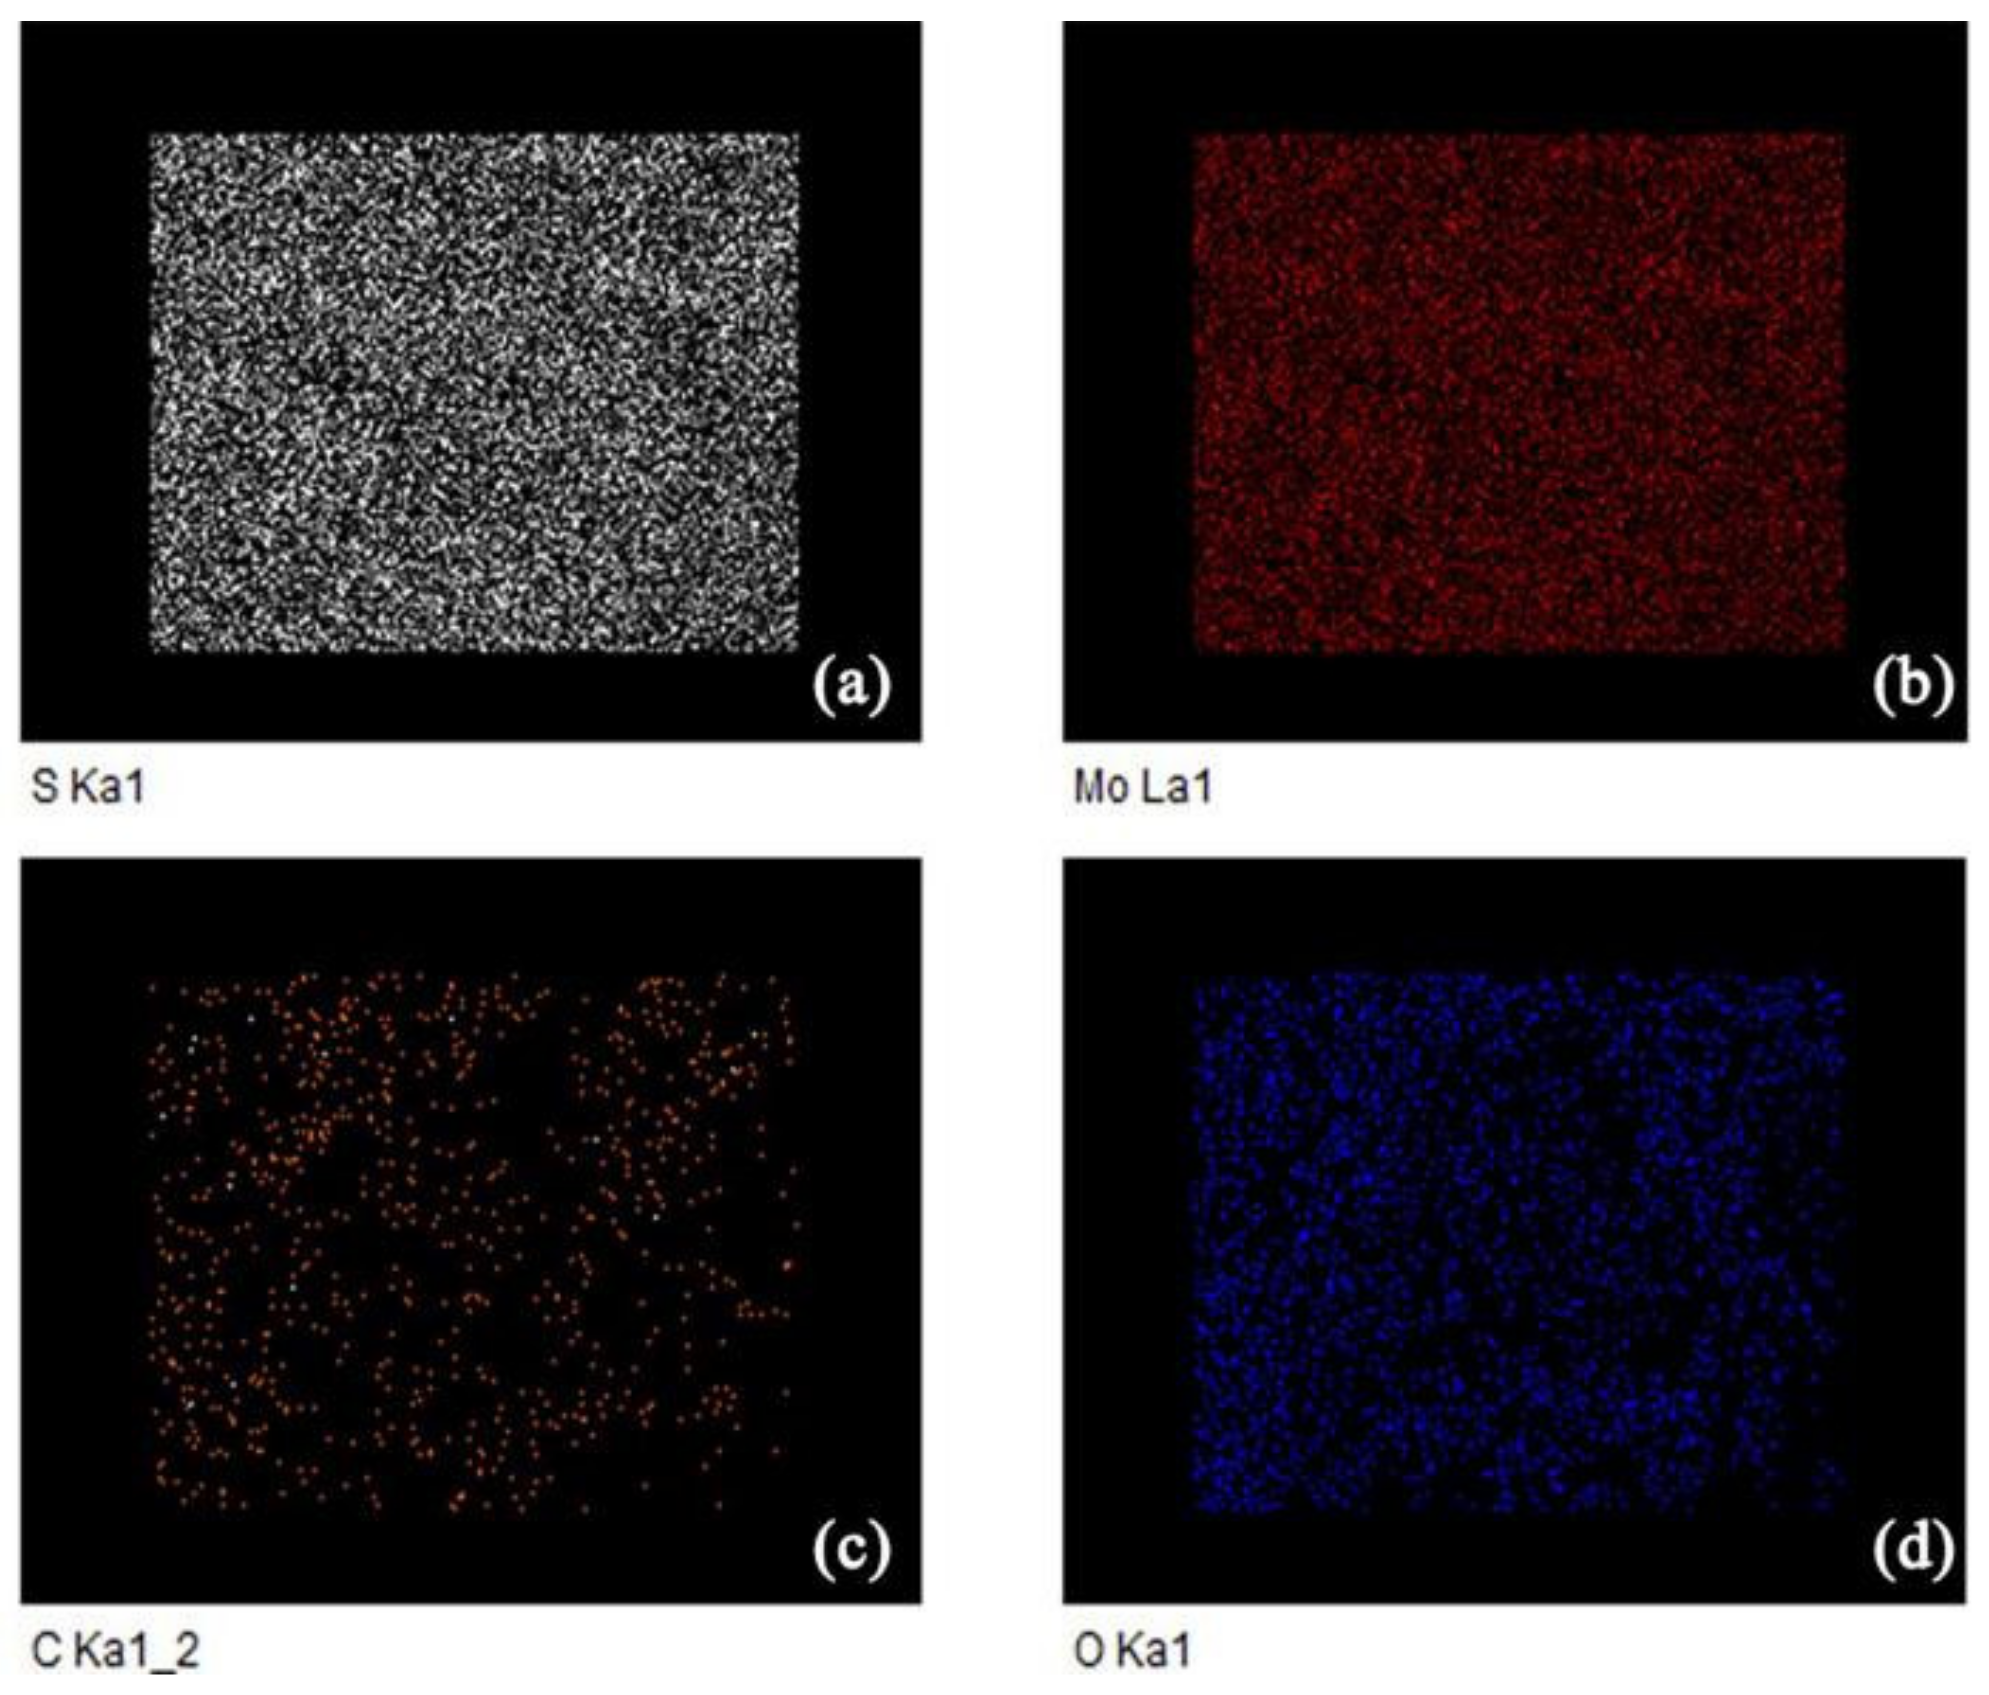
3.2. Scanning Electron Microscopy (SEM)

The morphologies of the synthesized samples were studied via SEM; the images are shown in Figure 5. The SEM images of pure MoS2 (Figure 5a,b) show high-density flower-like nanospheres, which is the characteristic morphology of MoS2 [32]. The SEM images of pure rGO (Figure 5c,d) show that the rGO sheet comprises wrinkles and curls, indicating its considerably thin characteristic. The SEM images of the 10% rGO/MoS2 composite material (Figure 5e–h) confirm the good combination between rGO flakes and flower-like MoS2 nanospheres. Curd-like MoS2 in the rGO/MoS2 composite is arranged in a lamellar layer. Compared with that of pure MoS2 (700 nm), the diameter of the curd-like structure (150 nm) is less, as shown in Figure 5a,e. Furthermore, the number of spherical structures is significantly large, which indicates the effective participation of MoS2. Thus, the specific surface area of the material is higher, and the active material can be used more effectively in the electron-transport process.
During the hydrothermal treatment, GO is reduced to rGO. Owing to a partial overlap or combination, GO self-assembles into a flexible structure. MoS2 in the composite material mainly comprises a finite-layer structure and is tightly coupled with the rGO sheets. In Figure 5f, the connected network formed by the layered or stacked MoS2 attached to rGO can be clearly observed; this structure is beneficial to the acceleration of resistance transmission in the sensor. The layered stack structure formed in the 10% rGO/MoS2 composite is conducive to the improvement of the mechanical properties of the material. This structure can considerably expand the interface contact area and improve the sensitivity of the sensor. Figure 5h shows the discontinuity and irregularity of the layered structure, the MoS2 curd-like particles are scattered in a disorderly manner, and the continuous running line of rGO is distorted, forming multiple defects. These defects enable an increase in the number of sites for the adsorption process and gas analysis, provide active energy sites, and improve gas detection efficiency [33].
Furthermore, we characterized the 10% rGO/MoS2 composite via energy dispersive X-ray spectroscopy (EDXS); the elemental distribution maps are shown in Figure 6. In addition to Mo and S, C was detected. The composite contains a large amount of C and O, indicating the existence and even distribution of rGO in the composite.

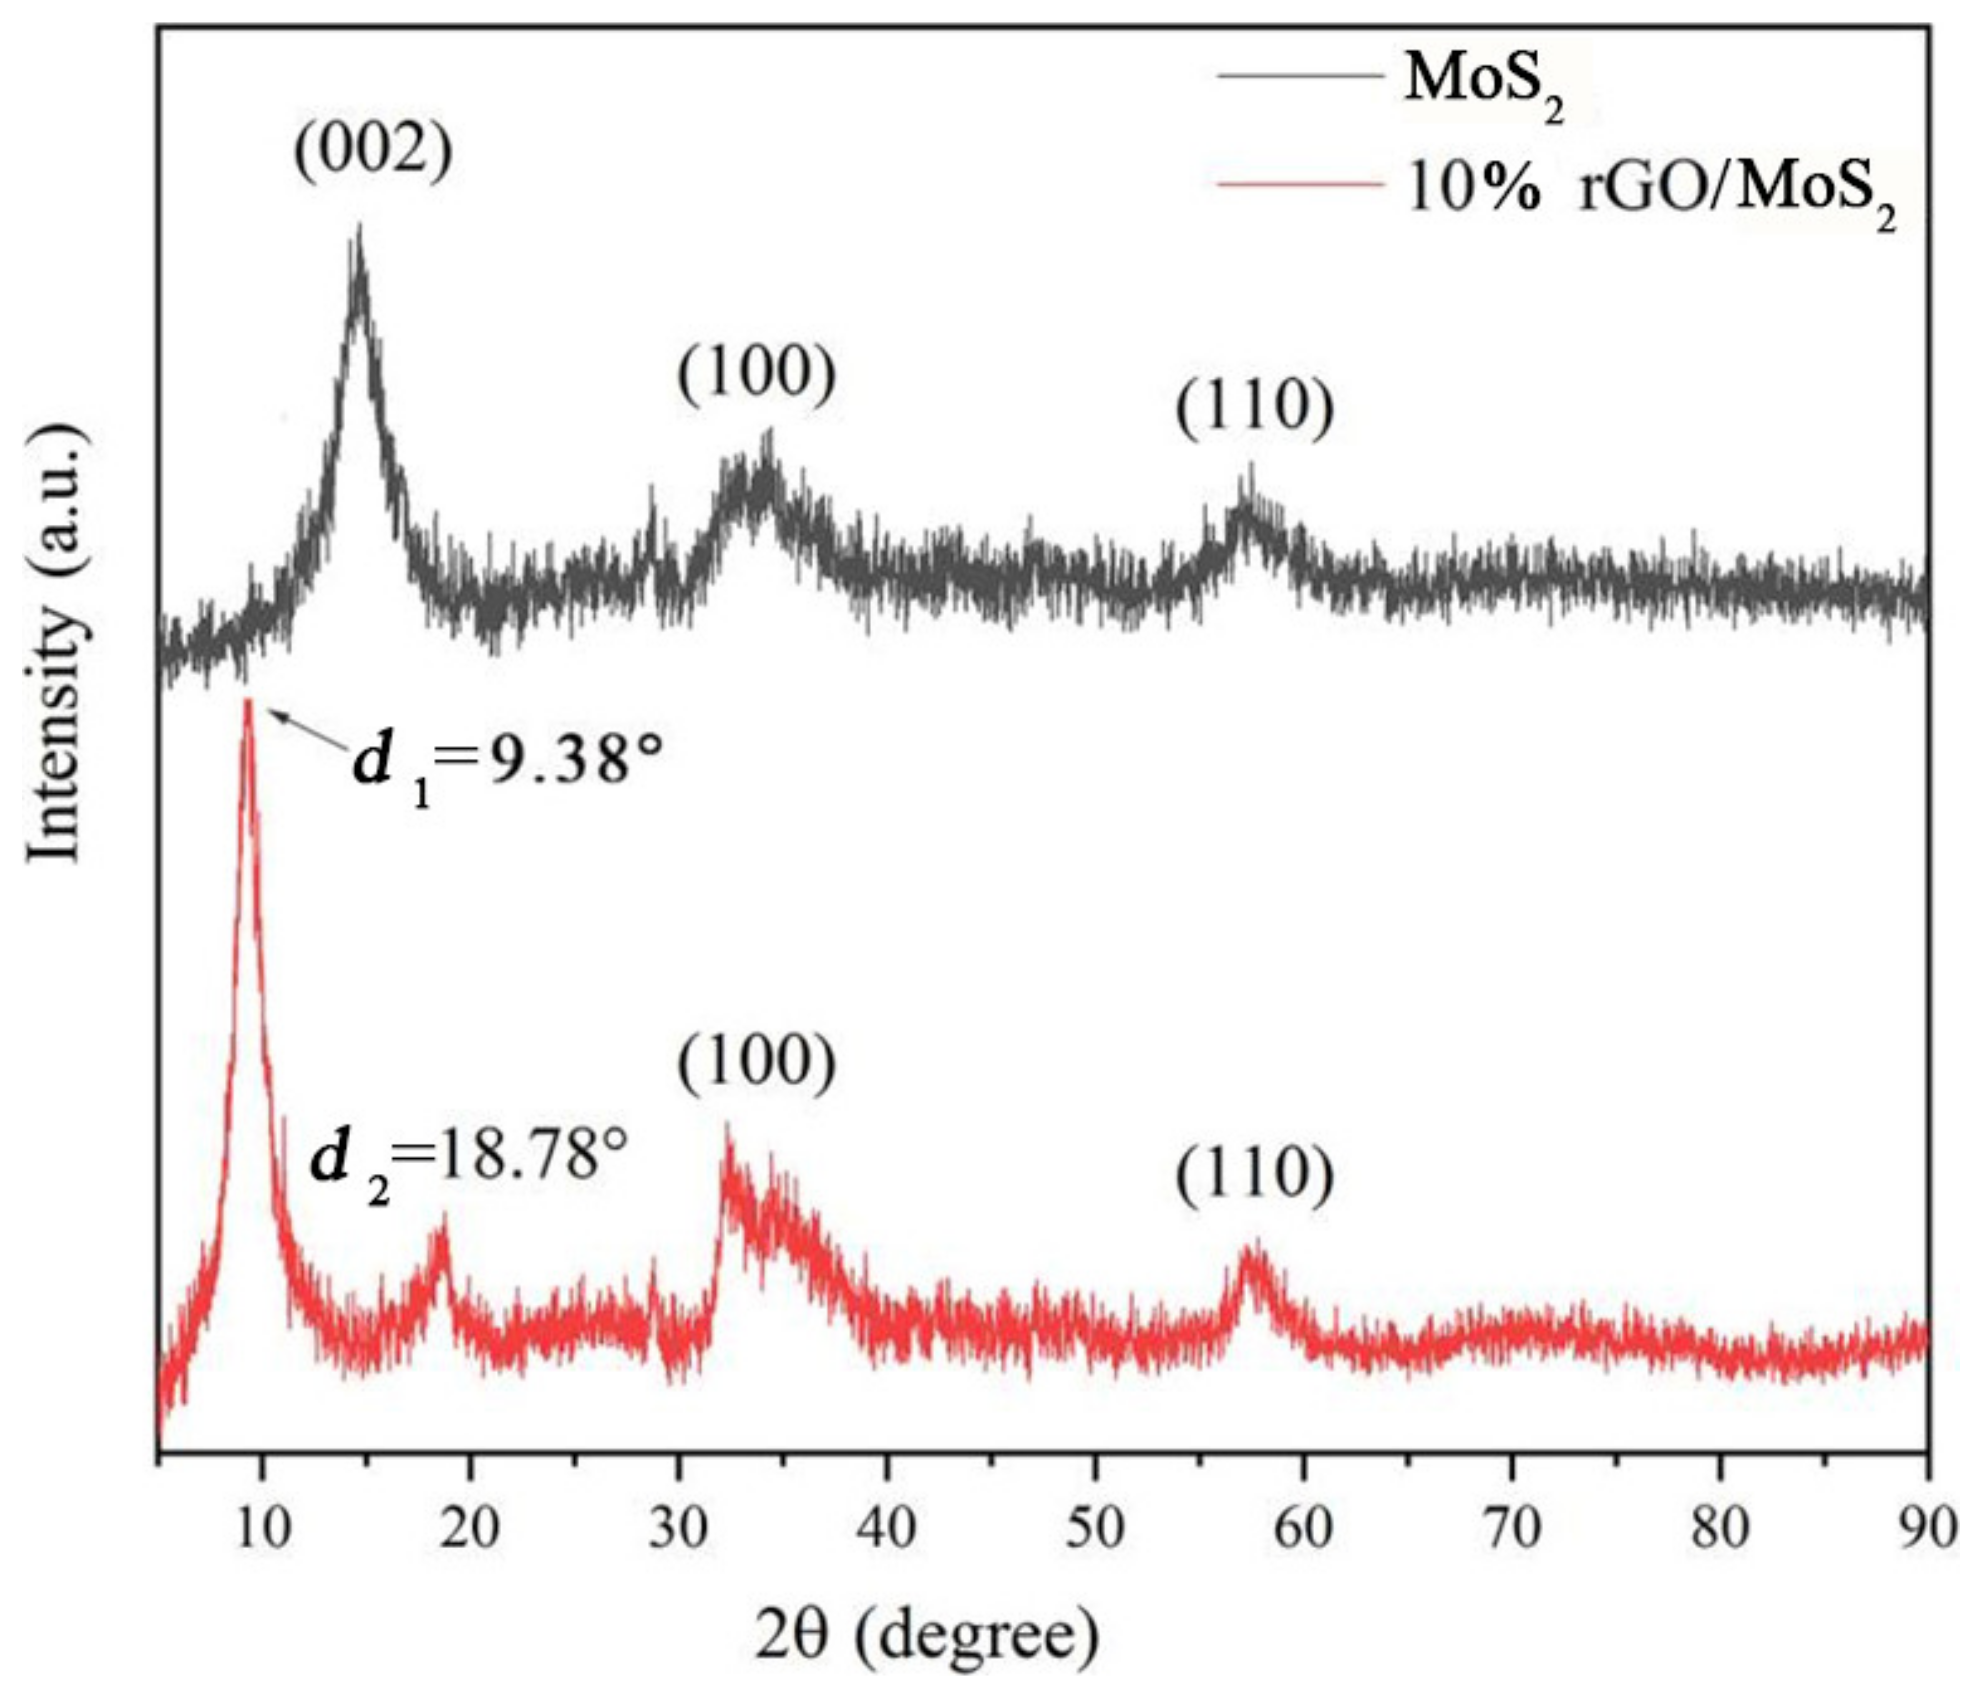
3.3. Powder XRD Analysis

In the XRD patterns of MoS2 and the 10% rGO/MoS2 composite material, no peaks corresponding to other elements are observed (Figure 7), indicating the high purity of the composite material. In the diffraction pattern of MoS2, the main peaks at 14.15°, 33.77°, and 58.49° can be attributed to the (002), (100), and (110) planes of MoS2, respectively (JCPDS card No. 37-1492). We calculated the lattice spacing (d = 6.26 nm) from the (002) peak at 2θ = 14.15° using the Bragg equation, 2dsinθ = nλ (d is the interplanar spacing, half of the diffraction angle (2θ), n = 1, λ = 0.154 nm). In contrast, the rGO/MoS2 composite material exhibits two different peaks at 2θ1 = 9.38° and 2θ2 = 18.78°, and correspond to d1 = 9.42 nm and d2 = 4.82 nm, respectively. The relationship between d1 and d2 indicates that the composite forms a layered structure with a wider interlayer spacing than that of pure MoS2. This may be attributed to the effect of the hydrothermal treatment that caused GO reduction and the disappearance of most of the oxygen-containing functional groups, resulting in the formation of numerous defects in the composite structure. Some of these defect positions combine with MoS2 to form a new interlayer structure [34]. This new type of defect location provides active energy sites for the adsorption of various gas molecules, which is beneficial for the improvement of gas sensitivity.

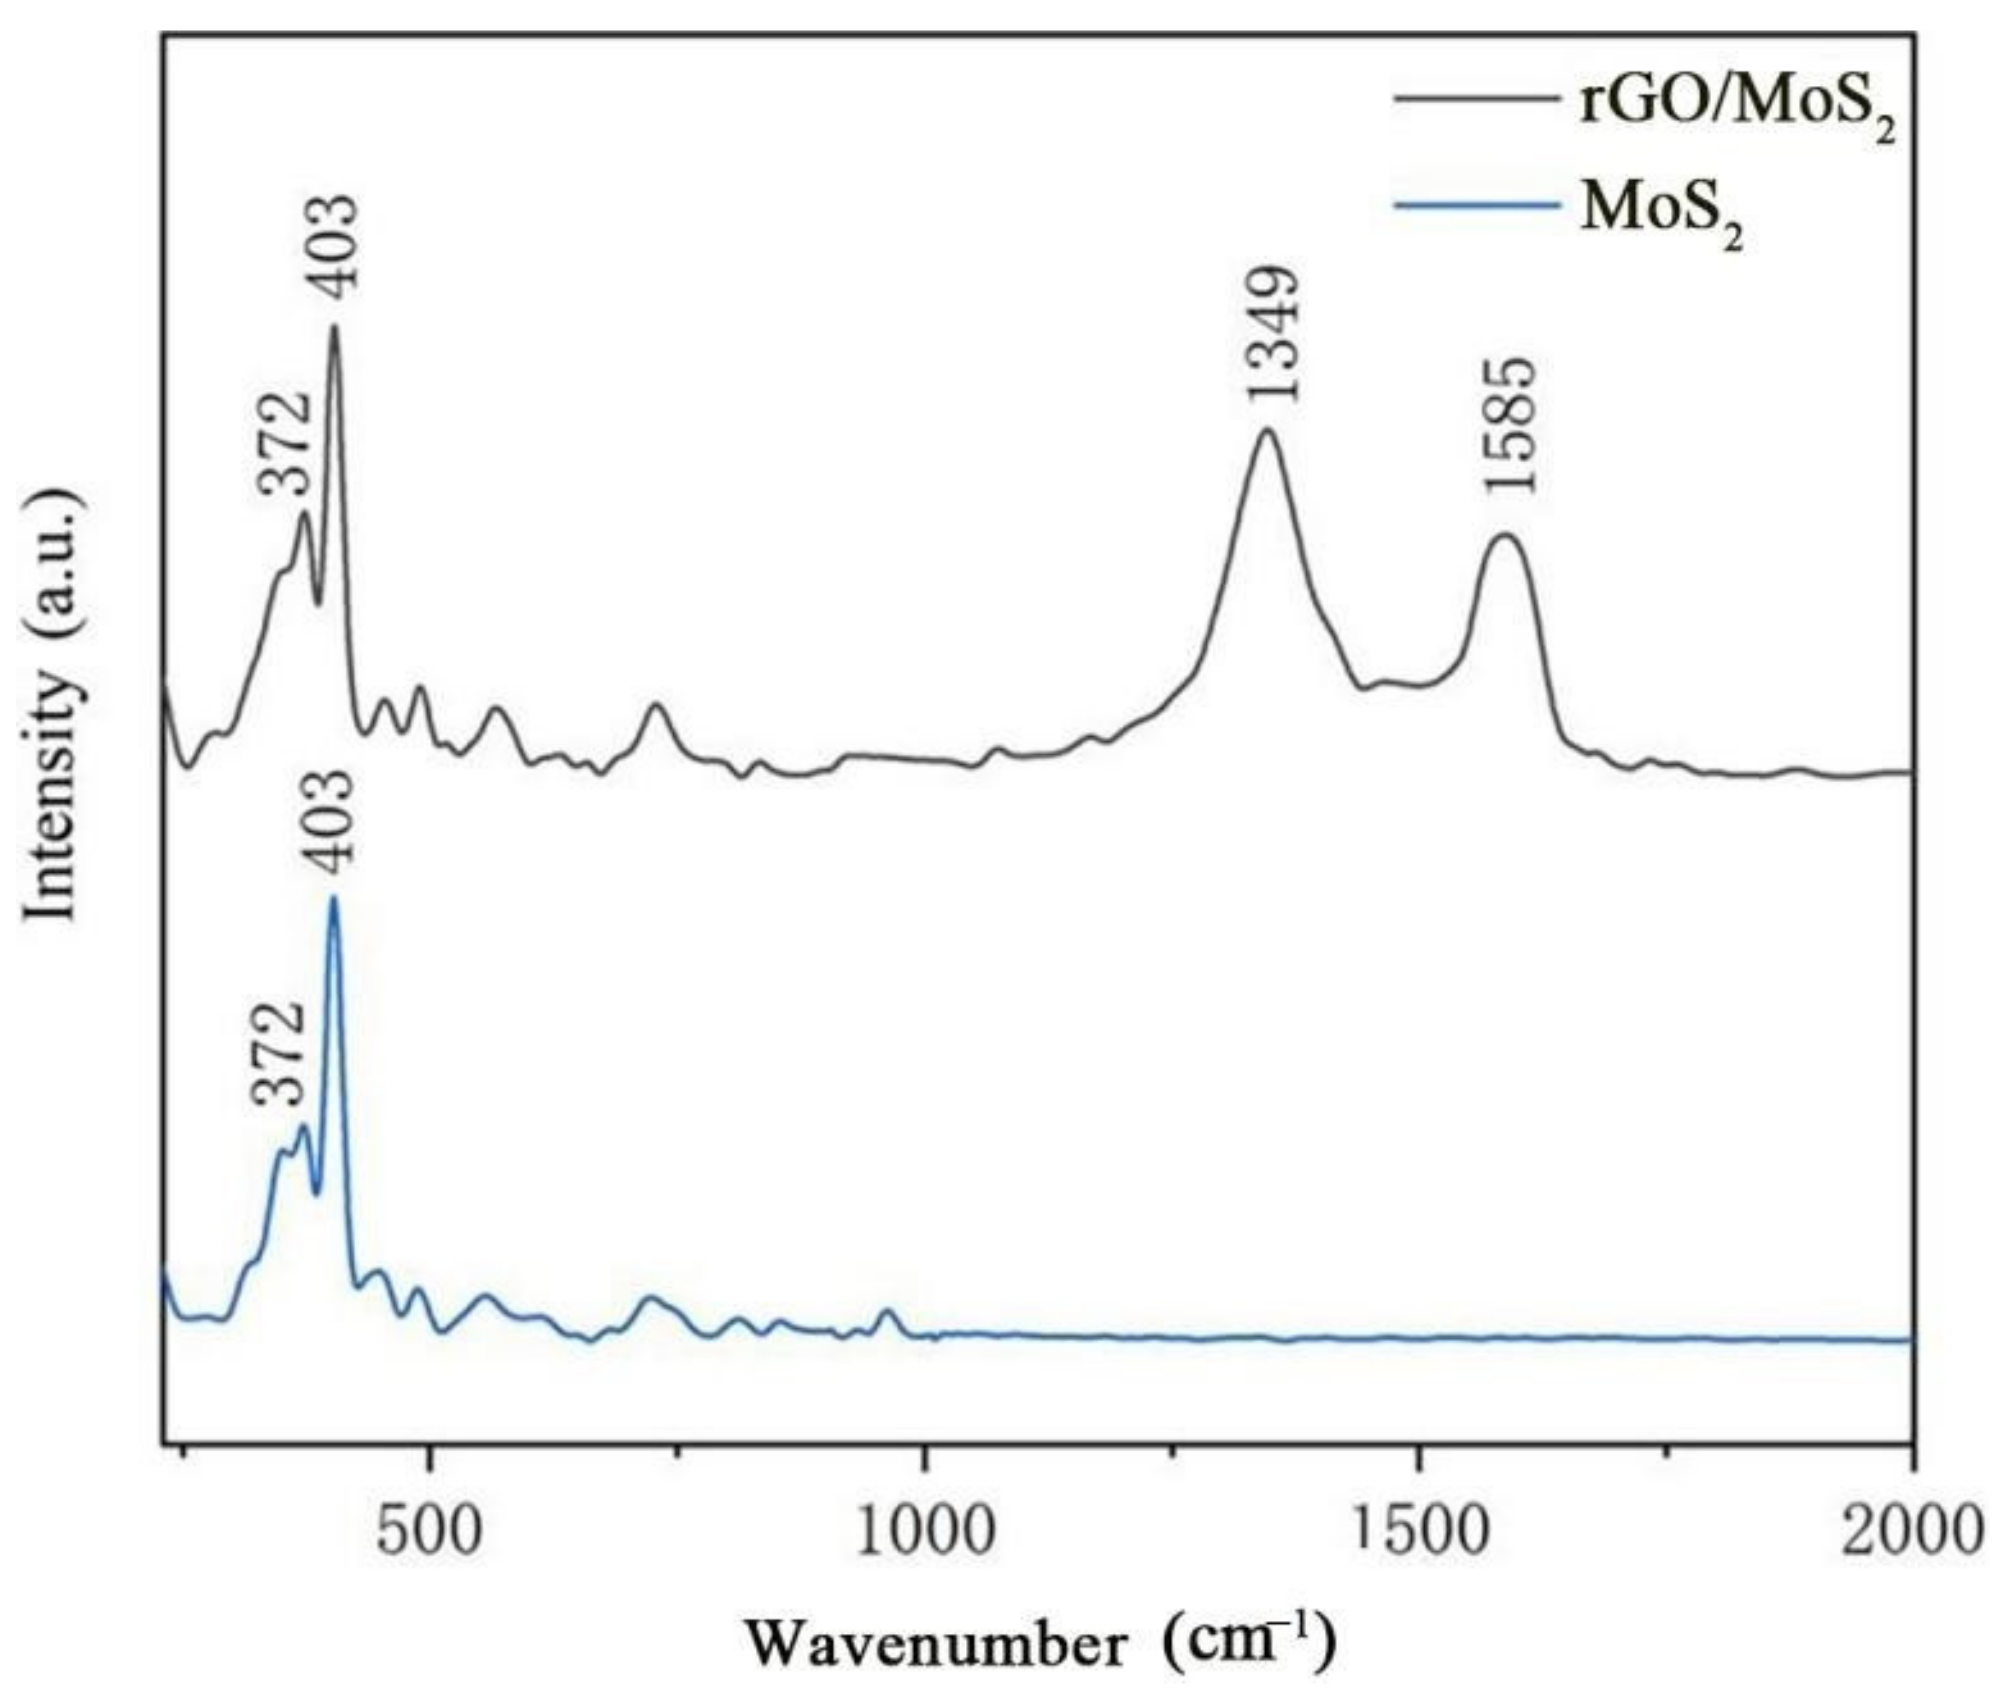
3.4. Raman Spectroscopy

The Raman spectrum of pure MoS2 (Figure 8) features the characteristic peaks of MoS2 at 372 and 403 cm−1, which are E12g and A2g peaks, respectively, thereby confirming that the material is MoS2. The E12g peak is owing to the internal molecular vibration of the sulfur atoms relative to the atomic layer of MoS2, and the vibration of the A2g peak is attributed to the out-of-layer movement of the sulfur atoms in the MoS2 relative to the axis of the non-MoS2 layer. In the 10% rGO/MoS2 composite, the E12g and A2g peaks of MoS2 are evident, and the characteristic peaks ascribed to the D and G bands of rGO are present at 1349 and 1585 cm−1, respectively, which proves that rGO has been successfully added to the mixture. The intensity ratio ID/IG of peaks D and G serves as an important parameter to evaluate the degree of order and defects of carbon materials. Generally, the smaller the ID/IG value, the higher the degree of order of carbon materials [35]. After calculation, the ID/IG value of the 10% rGO/MoS2 composite was approximately 1.39, which was higher than those of rGO (~1.03) and GO (~0.91), indicating that the size of GO decreased after reduction, resulting in the increase in the D peak intensity [36]. In addition, studies have shown that the increase in the ID/IG value indicates the improvement of the electrical properties of GO [37], which is beneficial to improve the gas-sensing response speed of the composite.

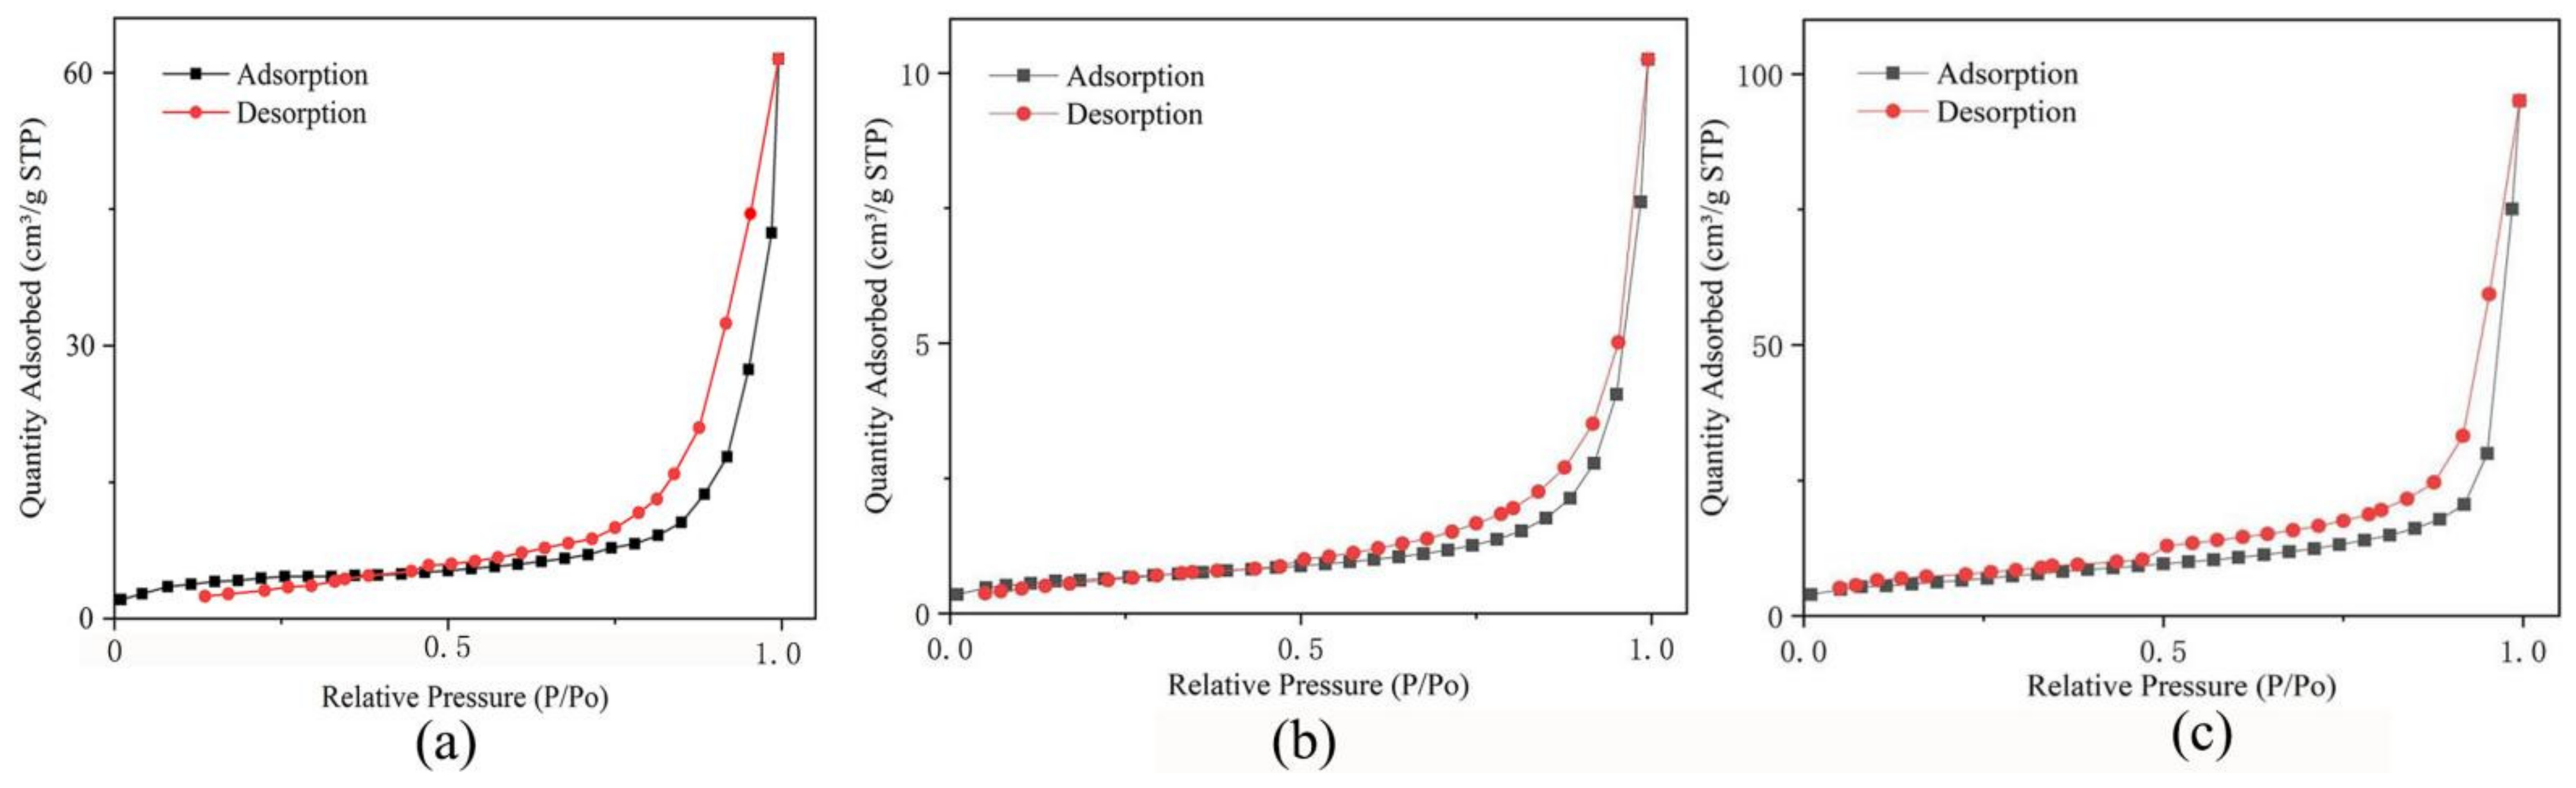
3.5. Specific Surface Area and Porosity Analysis
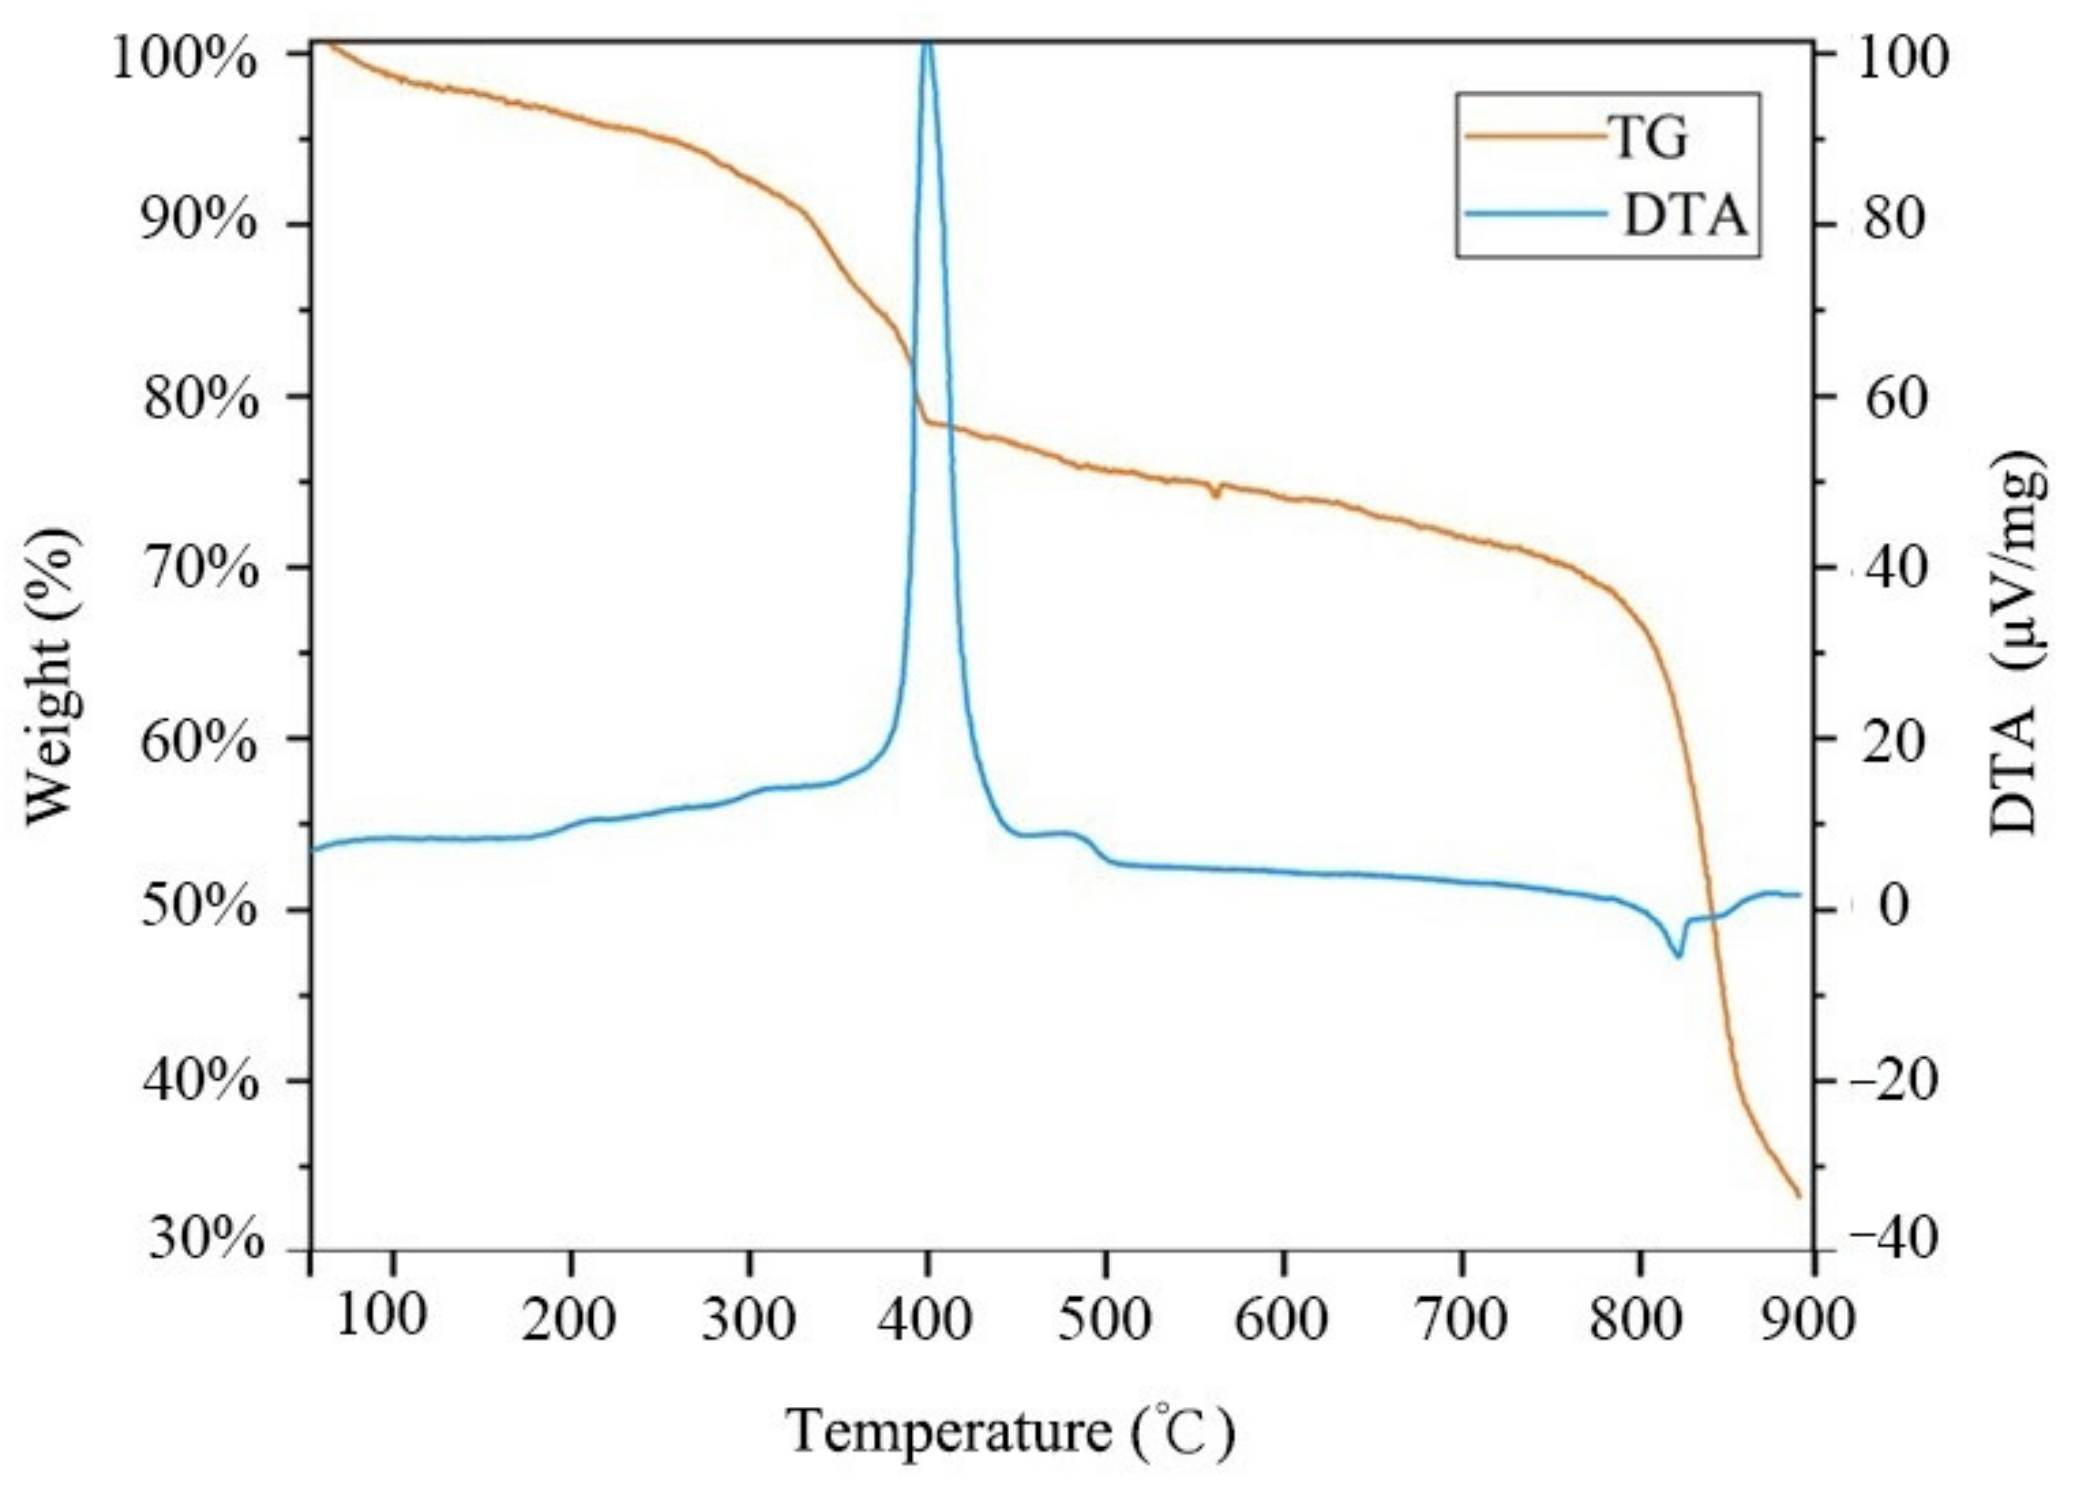
The specific surface area is one of the most important parameters in the evaluation of gas-sensing materials. To explore the influence of rGO addition on the specific surface area of MoS2, we conducted a N2 adsorption–desorption test on pure rGO, pure MoS2 and the 10% rGO/MoS2 composite. The relevant results are shown in Figure 9. The specific surface areas (Table 1) of pure rGO, pure MoS2 and the 10% rGO/MoS2 composite were 17.4157, 2.2204 and 23.2786 m2/g, respectively, which showed an approximately ten-fold increase for the as-prepared composite. Thus, rGO addition significantly increased the specific surface area of MoS2, enhancing its ability to adsorb and desorb gases.

3.6. TGA

We conducted TGA on the prepared 10% rGO/MoS2 composite; the results are shown in Figure 10. Within the test temperature range of 30–900 °C, the mass loss of the composite occurs in four stages. The small mass loss of 10% rGO/MoS2 in the first stage (30–300 °C) can be attributed to dehydration during physical adsorption. In the second stage (300–400 °C), the mass loss can be attributed to the thermal decomposition of the remaining oxygen-containing functional groups on rGO. In this stage, there is an obvious endothermic peak in the differential thermal analysis (DTA) curve at 400 °C. In the third stage (400–780 °C), the DTA and TG remains in a steady state. In the fourth stage (780–900 °C), the mass loss of the composite is due to the oxidation and pyrolysis of the carbon in rGO. This indicates that the material can maintain stable physical and chemical properties over 30–300 °C, and the heating temperature of the material should not be higher than 300 °C. This result is in line with that reported in another paper [38].

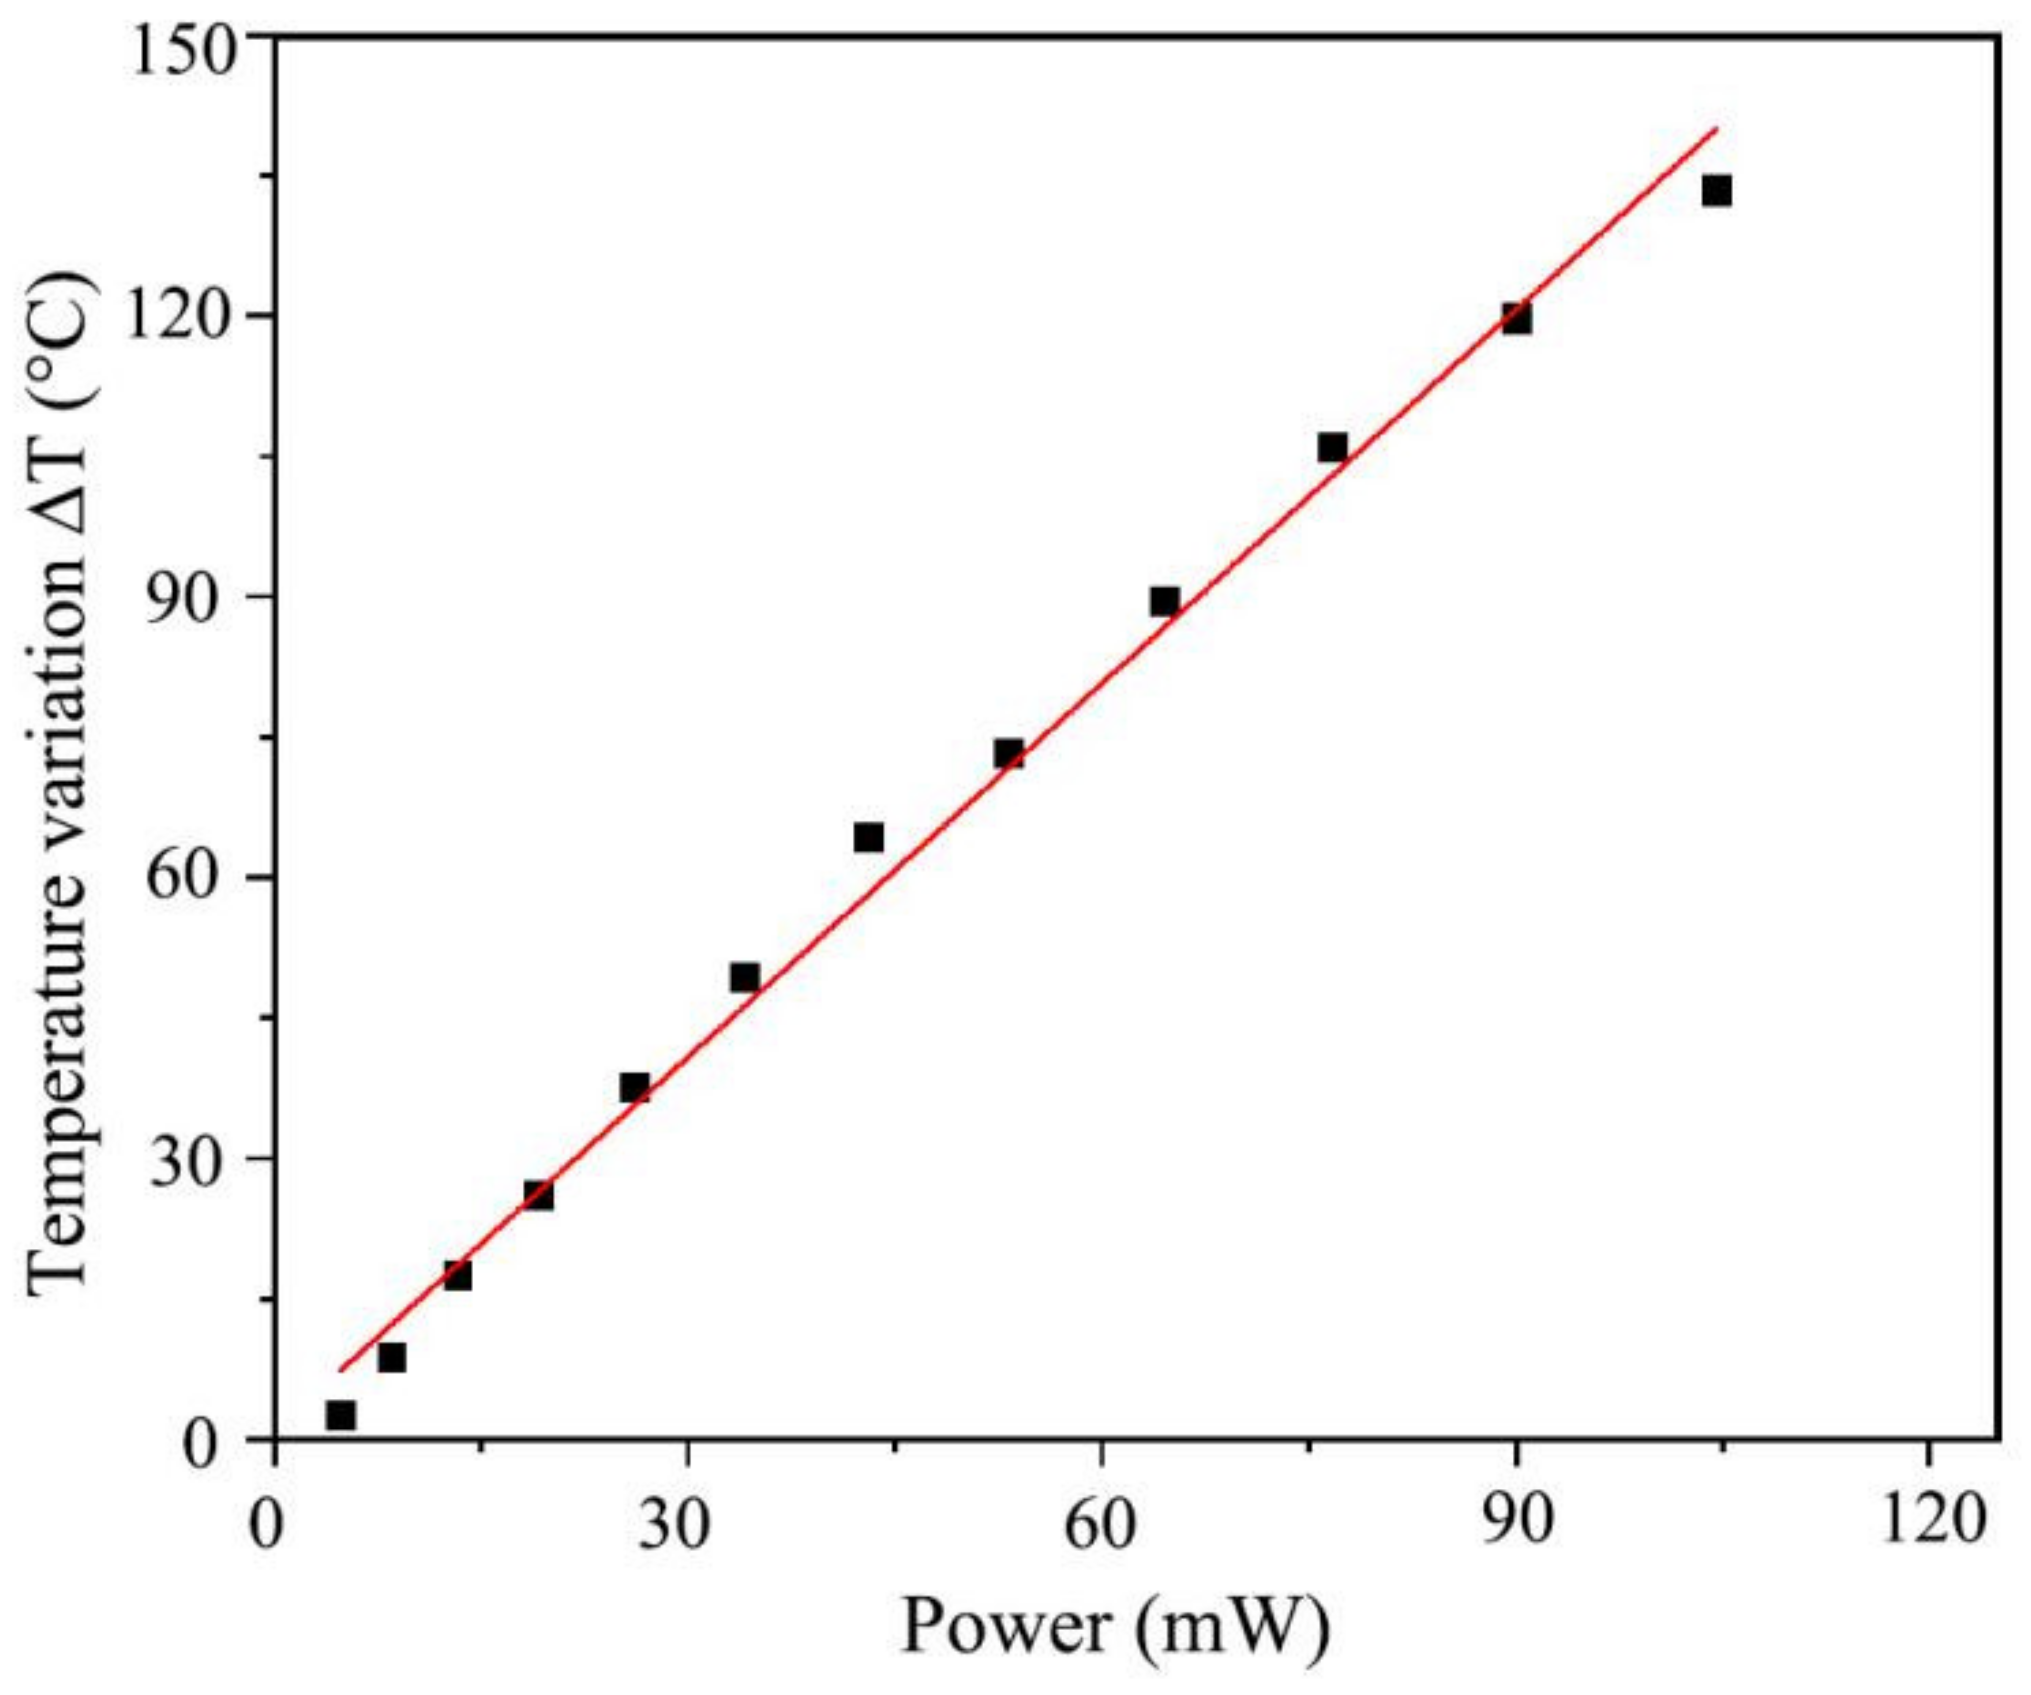
3.7. Heating Electrode Test

Temperature has an important influence on the response-recovery time and sensitivity of the sensor. To optimize the working conditions of the sensor, the relationship between the heating temperature and the input power of the heating electrode was studied. The sensor temperature (T0) before heating was 22 °C, and the heater used different power levels to obtain the temperature (T). Figure 11 shows the linear relationship between the heating power and the temperature change.

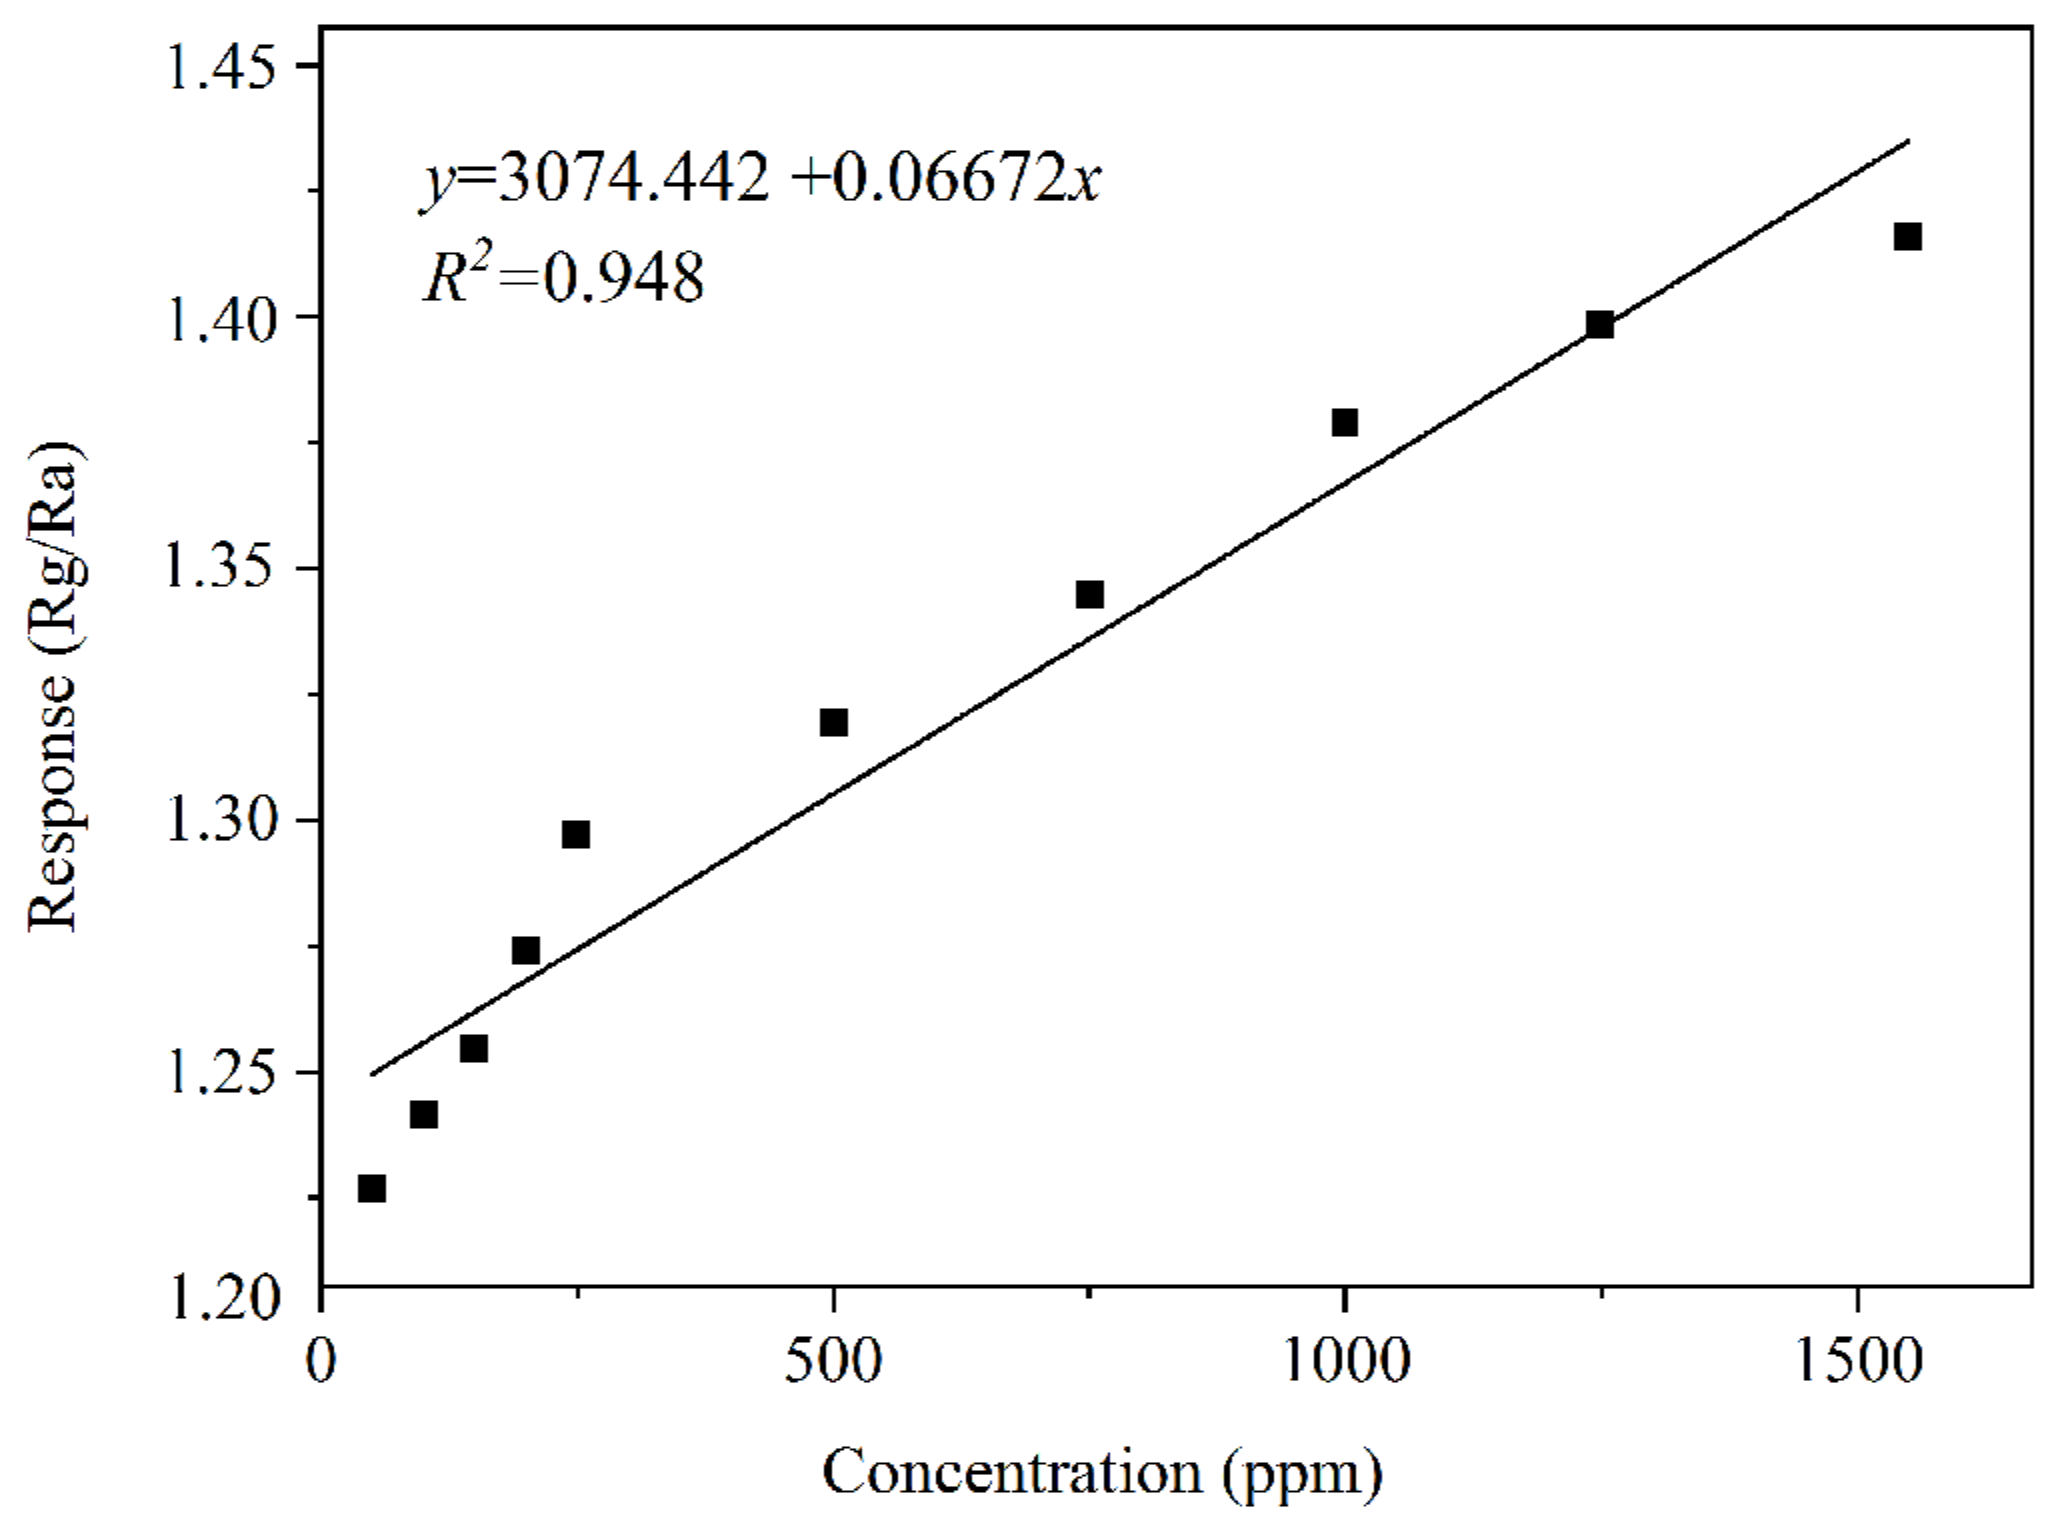
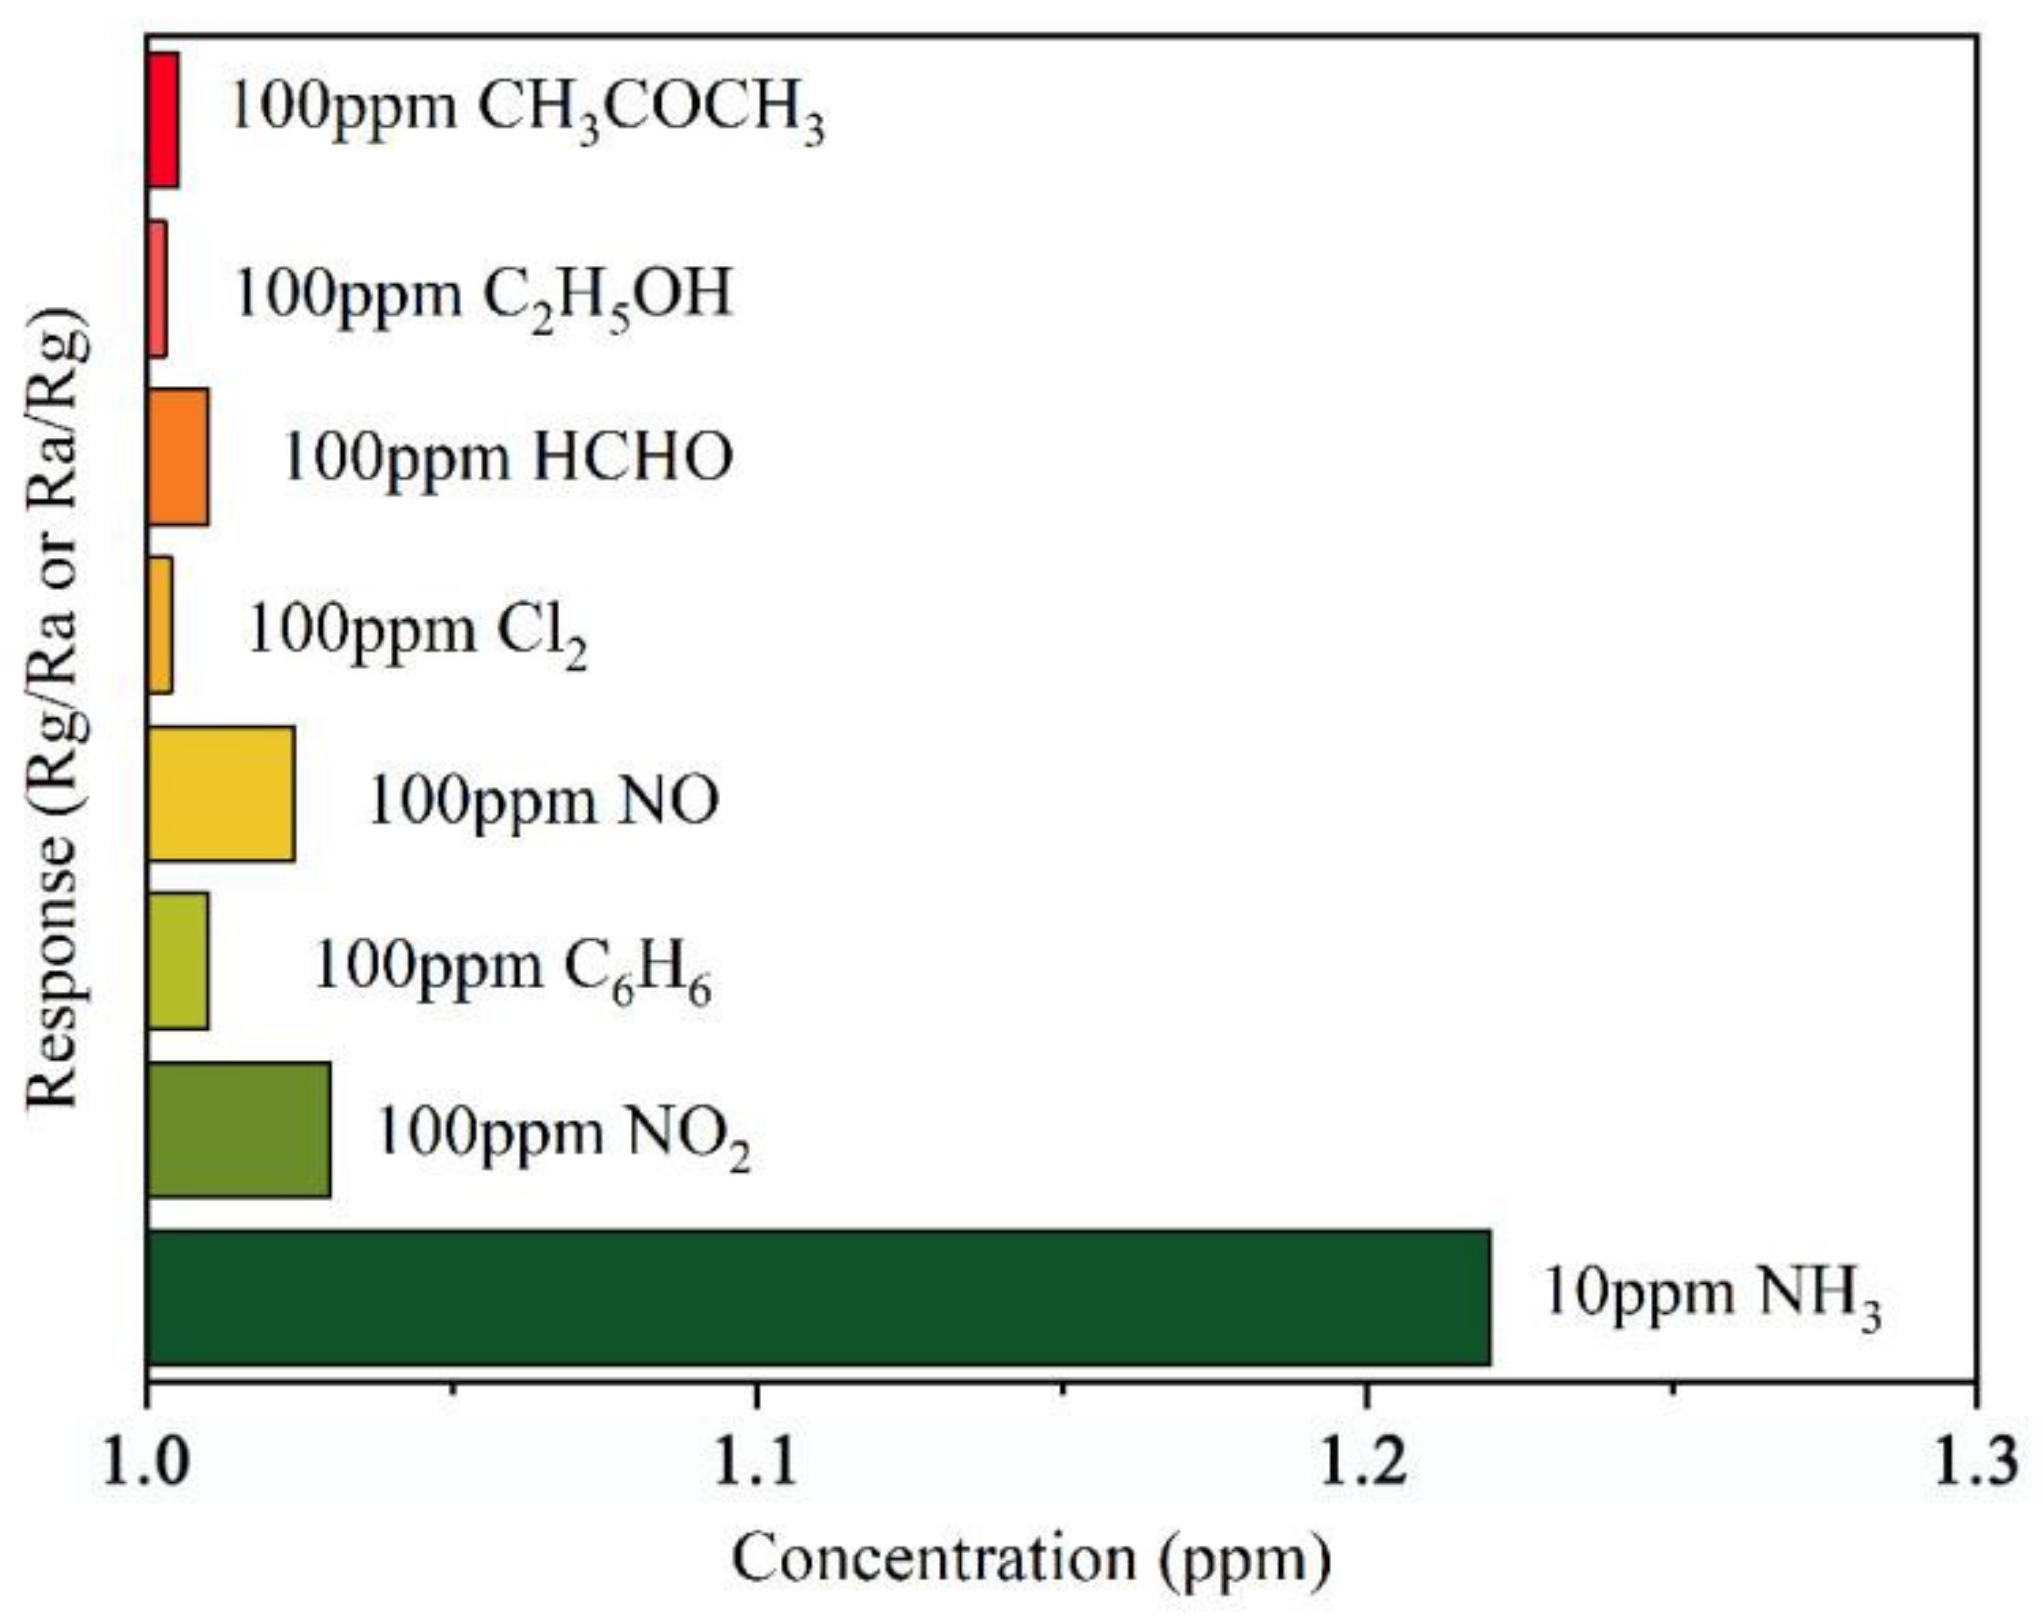
3.8. Gas-Sensing Response Parameters

Figure 12 shows a representative response curve obtained for 10% rGO/MoS2 upon exposure to 100 ppm NH3 at 141 °C. As shown in the figure, the resistance increased from 2983 Ω (in air) to 3080 Ω (in NH3 atmosphere). When the NH3 gas enters the gas-sensing test chamber, the test resistance increases. Because of the electron-donating property of NH3 molecules, the composite exhibits the p-type behavior of a semiconductor channel. In Figure 12, the relative response is defined as Response = Rg/Ra, where Ra is the basic resistance in air, and Rg is the test resistance. Response time (tresponse) is defined as the time required for the sensor to attain 90% of the maximum resistance value. Similarly, recovery time (trecovery) is defined as the time required for the maximum value to decrease to 10% of the maximum value.
The response parameters of the 10% rGO/MoS2 sensor to 100 ppm NH3 at 141 °C were tresponse = 17 s, trecovery = 56 s, and Response = 1.26. The limit of detection (LoD) of the sensor was 10 ppm.

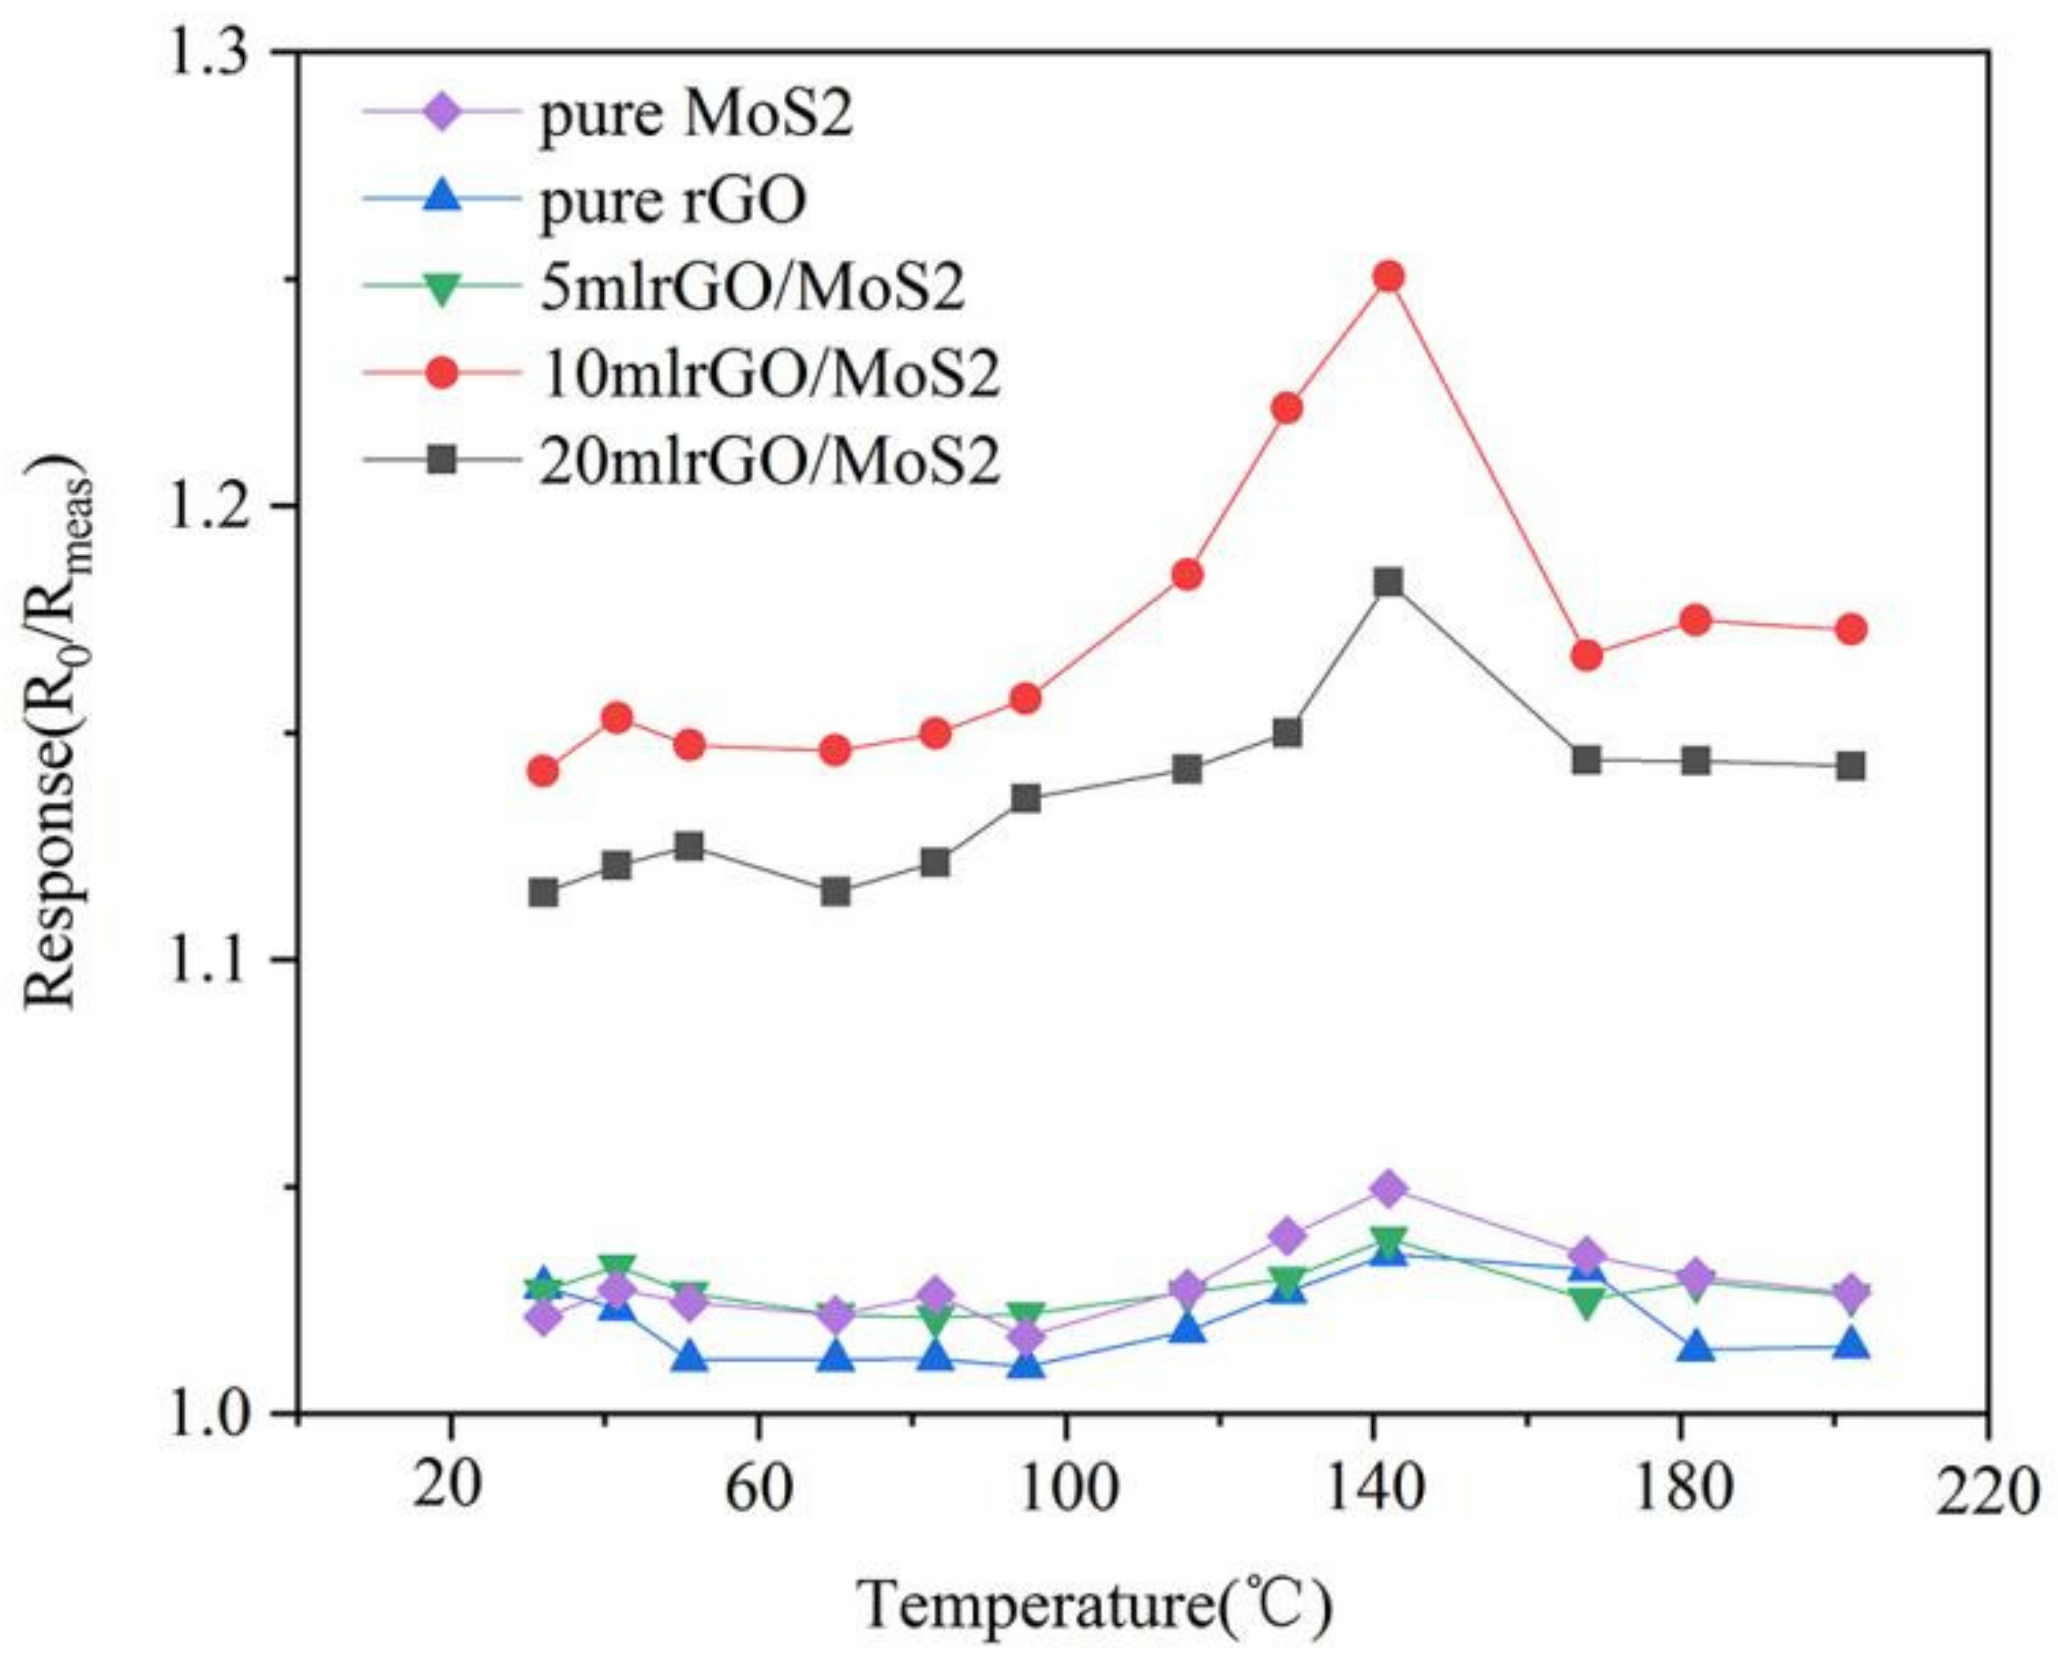
3.9. Optimization of Working Temperature and Mixing Ratio

The working temperature of the sensor has a significant impact on its performance; therefore, it is critical to determine the optimal working temperature for analyzing sensor performance. To identify the optimal working temperature of the sensor, we obtained the response curves of the gas sensors made of composites containing different rGO content upon exposure to 100 ppm NH3 in the temperature range of 25–200 °C, as shown in Figure 13. Figure 13 shows that the response value of the sensor changes with temperature. The response value of pure MoS2 to 100 ppm NH3 gas increases with an increase in the temperature, reaches the peak at 141 °C, and gradually decreases when the temperature continues to increase. With an increase in the temperature, the sensor response demonstrates an “increase–peak–decrease” trend. Under the same concentration and temperature conditions, the response values of pure rGO and pure MoS2 materials to NH3 were not high. In contrast, the response values of the composites with rGO and MoS2 were significantly higher. Among all composites, the performance of the 10%-rGO-doped composite was the highest, and the response value to 100 ppm NH3 gas attained a peak value of 1.26 at 141 °C. Although the sensor had a certain response at room temperature (25 °C), higher response was obtained upon heating. Therefore, we considered 141 °C and the 10% rGO/MoS2 composite to be the optimal working temperature and sensing material, respectively. Furthermore, we fabricated the gas sensor under the optimal conditions and studied its performance.
Figure 14 shows the continuous transient resistance–response–recovery curve of the sensor comprising the 10% rGO/MoS2 composite upon exposure to NH3 gas at concentrations of 50–1750 ppm at the optimal operating temperature. It is evident that the resistance of the sensor increases with an increase in the NH3 concentration, indicating its NH3-sensing ability. The change curve (Figure 15) of sensor resistance with the NH3 concentration in an NH3-flushed environment reflects the relationship between the NH3 concentration and the sensor resistance value. The resistance of the sensor comprising the 10% rGO/MoS2 composite exhibits a linear relationship with the NH3 concentration in the range of 50–1500 ppm. The sensitivity of the sensor is 0.06672, and the linearity is relatively high (R2 = 0.948). When the gas concentration was higher than 1500 ppm, the resistance value did not change significantly, indicating that the sensor became saturated at a high concentration of NH3.
Furthermore, selectivity is an important parameter of the NH3 sensor in practical applications. Figure 16 shows the responses of the 10% rGO/MoS2 sensor to various gases, including Cl2, NO, NO2, and a few typical volatile organic compounds (VOCs). The different responses of the sensor are mainly owing to the inherent chemical properties and reactivities of the gas molecules. It is evident that the response of the sensor to NH3 is much higher than that toward other gases. In addition, the response of the 10% rGO/MoS2 composite to 10 ppm NH3 is much higher than that to 100 ppm VOCs. All these observations confirm the high selectivity of the rGO/MoS2 sensor for NH3 sensing.

3.10. Sensing Mechanism

Gas sensing involves the processes of adsorption and desorption of gas molecules and the use of a sensitive platform. Recent theoretical studies have revealed the negative surface adsorption energy (−250 MeV) of NH3 molecules on the surface of MoS2 [39]. In addition, the first principles calculation reveals the partial charge (E) transfer from the adsorbed NH3 to the potential MoS2 channels. NH3 acts as an electron donor, and electrons are transferred from NH3 to MoS2, resulting in the decrease in MoS2 hole density, weaken of MoS2 conductivity, and increase in resistance [40]. Moreover, due to the existence of oxygen-containing functional groups and structural defects on rGO, the addition of rGO can provide more adsorption sites and is more conducive to the adsorption of gas, compared with those of pure MoS2.
In the process of hydrothermal preparation of rGO/MoS2 composites, due to the existence of oxygen-containing functional groups on the surface of GO, Mo4+ is adsorbed on the surface of graphene because of the electrostatic interaction, which provides nucleation sites for the growth of MoS2 materials. Compared with that of pure MoS2, the size of MoS2 in the composite is smaller and the active edge is more exposed, thus increasing the number of active sites for the gas-sensing reaction and, consequently, effectively improving the gas-sensing response [41]. The Fermi level of MoS2 is higher than that of graphene, and the addition of a small amount of rGO is beneficial. When the two are in contact, the heterostructure formed by the rGO/MoS2 composite separates the carriers into electrons and holes under the action of the potential field. The electron transfer ability of the composite is enhanced under the action of the potential barrier at the heterojunction interface to accelerate the electron transfer, therefore effectively improving the gas-sensing response time. When the content of added rGO exceeds the threshold (20% rGO/MoS2), a large amount of rGO is accumulated, which easily forms a network between the electrodes. Due to the high conductivity of rGO, the resistance adjustment of the composite is weakened, which reduces the sensitivity of the gas sensor. In addition, high content of rGO easily covers the active site of MoS2 and hinders the interaction between NH3 and MoS2. Therefore, the sensing performance of 10% rGO/MoS2 is optimal.

4. Conclusions

rGO/MoS2 composites were synthesized via a one-step hydrothermal method. The result showed that the NH3 detection performance of the rGO/MoS2 composites was the highest when the content of rGO was 10%. It was found by structural analysis that there were various defects on MoS2 and rGO, which served as the active sites for the adsorption of gas molecules. The flower-like MoS2 nanospheres in the rGO/MoS2 composite formed thin layers. Thus, when the diameter of the flower-ball structure decreased, the number of spherical structures significantly increased and the specific surface area of the material increased, thereby resulting in the enhancement of the electron-transport capacity of the active material. The XRD analysis results confirmed that most oxygen-containing functional groups in the rGO/MoS2 composites disappeared and their structures possessed numerous defects, which enabled the formation of a new interlayer structure. This resulted in an increase in the number of active energy sites, which was conducive to the improvement of the gas-sensing properties. The TGA results indicated that the composites could maintain stable physical and chemical properties at temperatures below 300 °C. The optimal working temperature of the sensor in this study was 141 °C, and the properties of the sensing materials were stable at this temperature.
In this study, we used the MEMS technology to fabricate a heating electrode and gas-sensing electrode on a flexible PI sheet with Pt to form a “sandwiched” sensor structure. We developed a gas-sensing test platform and measured the response parameters of the 10% rGO/MoS2 sensor to 100 ppm NH3 at 141 °C. The response time, recovery time, and response value were 17 s, 56 s, and 1.26, respectively, for a test range of 50–1500 ppm of NH3. The LoD of the sensor was 10 ppm. The flexible chip maintained stable gas-sensing performance under deformation at 30°, 45°, and 90° bending angles, and its performance was stable after 1000 bending tests. The fabricated sensor demonstrated stable conductivity and high bending resistance.
This sensor possessed the ability to detect NH3 across a broad concentration range and demonstrated high sensing performance, low power consumption, fast recovery response, low-temperature operation, and substrate flexibility. Further, the sensor possesses the advantages of having a small volume, high flexibility, and stable performance. It is suitable for mass production and for remote and distributed measurement. It provides a new approach for the detection of pollutants in industrial environments and the atmosphere.

Author Contributions

Conceptualization, Z.R. and Y.S.; methodology, T.S.; validation, T.W.; data curation, B.T.; writing—original draft preparation, Z.R.; writing—review and editing, Y.S.; visualization, H.N.; funding acquisition, X.Y. All authors have read and agreed to the published version of the manuscript.

Funding

This research was funded by the National Key Research and Development Project, grant number 2016YFA0602701,and National Science Foundation Program of China, grant number 61801149.

Institutional Review Board Statement

Not applicable.

Informed Consent Statement

Written informed consent has been obtained from the patient(s) to publish this paper.

Data Availability Statement

The data presented in this paper are available in this article.

Acknowledgments

The authors would like to thank the research staff for their contributions to this project.

Conflicts of Interest

The authors declare no conflict of interest.

References

  1. Chehade, G.; Dincer, I. Progress in green ammonia production as potential carbon-free fuel. Fuel 2021, 299, 120845. [Google Scholar] [CrossRef]
  2. Demirci, U.B.; Miele, P. Sodium borohydride versus ammonia borane, in hydrogen storage and direct fuel cell applications. Energy Environ. Sci. 2009, 2, 627–637. [Google Scholar] [CrossRef]
  3. Lan, R.; Irvine, J.T.S.; Tao, S. Ammonia and related chemicals as potential indirect hydrogen storage materials. Int. J. Hydrogen Energy 2012, 37, 1482–1494. [Google Scholar] [CrossRef]
  4. Tan, W.L.; Wang, Y.; Xi, C.F.; Zhou, L. Performance research of new electric vehicle air conditioning system based on ammonia working medium. J. Xihua Univ. (Nat. Sci. Ed.). 2017, 6, 40–46. [Google Scholar]
  5. Steinebach, H.; Kannan, S.; Rieth, L.; Solzbacher, F. H2 gas sensor performance of NiO at high temperatures in gas mixtures. Sens. Actuators B Chem. 2010, 151, 162–168. [Google Scholar] [CrossRef]
  6. Seon, P.; Chul, P.; Hyeonseok, Y. Chemo-electrical gas sensors based on conducting polymer hybrids. Polymers 2017, 9, 155. [Google Scholar]
  7. Vallejos, S.; Stoycheva, T.; Umek, P.; Navio, C.; Snyders, R.; Bittencourt, C.; Llobet, E.; Blackman, C.; Moniz, S.; Correig, X. Au Nanoparticle-functionalised WO3 nanoneedles and their application in high sensitivity gas sensor devices. Chem. Commun. 2011, 47, 565–567. [Google Scholar] [CrossRef] [PubMed] [Green Version]
  8. Liu, X.; Cheng, S.; Liu, H.; Hu, S.; Zhang, D.; Ning, H. A Survey on gas sensing technology. Sensors 2012, 12, 9635–9665. [Google Scholar] [CrossRef] [Green Version]
  9. Cheng, Y.; Wang, S.; Wang, R.; Sun, J.; Gao, L. Copper nanowire based transparent conductive films with high stability and superior stretchability. J. Mater. Chem. C 2014, 2, 5309–5316. [Google Scholar] [CrossRef]
  10. Zhao, S.; Li, J.; Cao, D.; Zhang, G.; Li, J.; Li, K.; Yang, Y.; Wang, W.; Jin, Y.; Sun, R.; et al. Recent advancements in flexible and stretchable electrodes for electromechanical sensors: Strategies, materials, and features. ACS Appl. Mater. Interfaces 2017, 9, 12147–12164. [Google Scholar] [CrossRef] [PubMed]
  11. Brent, J.R.; Savjani, N.; O’Brien, P. Synthetic approaches to two-dimensional transition metal dichalcogenide nanosheets. Prog. Mater. Sci. 2017, 89, 411–478. [Google Scholar] [CrossRef]
  12. Bertram, N.; Cordes, J.; Kim, Y.D.; Ganteför, G.; Gemming, S.; Seifert, G. Nanoplatelets made from MoS2 and WS2. Chem. Phys. Lett. 2006, 418, 36–39. [Google Scholar] [CrossRef] [Green Version]
  13. Wang, Z.; Zhang, T.; Zhao, C.; Han, T.; Fei, T.; Liu, S. Rational synthesis of molybdenum disulfide nanoparticles decorated reduced graphene oxide hybrids and their application for high-performance NO2 sensing. Sens. Actuators B 2018, 260, 508–518. [Google Scholar] [CrossRef]
  14. Bhattacharyya, S.; Pandey, T.; Singh, A.K. Effect of strain on electronic and thermoelectric properties of few layers to bulk MoS2. Nanotechnology 2014, 25, 465701. [Google Scholar] [CrossRef] [Green Version]
  15. Chen, K.X.; Wang, X.-M.; Mo, D.-C.; Lyu, S.-S. Thermoelectric properties of transition metal dichalcogenides: From monolayers to nanotubes. J. Phys. Chem. C 2015, 119, 26706–26711. [Google Scholar] [CrossRef]
  16. Castellanos-Gomez, A.; Poot, M.; Steele, G.A.; van der Zant, H.S.J.; Agrait, N.; Rubio-Bollinger, G. Elastic properties of Freely suspended MoS2 nanosheets. Adv. Mater. 2012, 24, 772–775. [Google Scholar] [CrossRef] [Green Version]
  17. He, K.; Poole, C.; Mak, K.F.; Shan, J. Experimental demonstration of continuous electronic structure tuning via strain in atomically thin MoS2. Nano Lett. 2013, 13, 2931–2936. [Google Scholar] [CrossRef] [PubMed] [Green Version]
  18. Sharma, S.; Bhagat, S.; Singh, J.; Ahmad, M.; Sharma, S. Temperature dependent photoluminescence from WS2 nanostructures. J. Mater. Sci. Mater. Electron. 2018, 29, 20064–20070. [Google Scholar] [CrossRef]
  19. Ezawa, M. High Spin-Chern Insulators with Magnetic Order. Sci. Rep. 2013, 3, 3435. [Google Scholar] [CrossRef] [PubMed] [Green Version]
  20. Gant, P.; Huang, P.; de Lara, D.P.; Guo, D.; Frisenda, R.; Castellanos-Gomez, A. A strain tunable single-layer MoS2 photodetector. Mater. Today 2019, 27, 8–13. [Google Scholar] [CrossRef]
  21. Pu, J.; Yomogida, Y.; Liu, K.-K.; Li, L.-J.; Iwasa, Y.; Takenobu, T. Highly flexible MoS2 thin-film transistors with ion gel dielectrics. Nano Lett. 2012, 12, 4013–4017. [Google Scholar] [CrossRef] [PubMed]
  22. Zhang, Q.; Bao, W.; Gong, A.; Gong, T.; Ma, D.; Wan, J.; Dai, J.; Munday, J.N.; He, J.-H.; Hu, L.; et al. A high-sensitivity, highly transparent, gel-gated MoS2 phototransistor on biodegradable nanopaper. Nanoscale 2016, 8, 14237–14242. [Google Scholar] [CrossRef] [Green Version]
  23. Zhang, S.; Liu, J.; Ruiz, K.H.; Tu, R.; Yang, M.; Li, Q.; Shi, J.; Li, H.; Zhang, L.; Goto, T. Morphological evolution of vertically standing molybdenum disulfide nanosheets by chemical vapor deposition. Materials 2018, 11, 631. [Google Scholar] [CrossRef] [Green Version]
  24. Ganatra, R.; Zhang, Q. Few-Layer MoS2: A promising layered semiconductor. ACS Nano 2014, 8, 4074–4099. [Google Scholar] [CrossRef] [PubMed]
  25. Das, S.; Gulotty, R.; Sumant, A.V.; Roelofs, A. Correction to all two-dimensional, flexible, transparent, and thinnest thin film transistor. Nano Lett. 2016, 16, 1515. [Google Scholar] [CrossRef] [PubMed]
  26. Li, H.; Yin, Z.; He, Q.; Li, H.; Huang, X.; Lu, G.; Fam, D.W.; Tok, A.I.; Zhang, Q.; Zhang, H. Fabrication of single- and multilayer MoS2 film-based field-effect transistors for sensing no at room temperature. Small 2012, 8, 63–67. [Google Scholar] [CrossRef]
  27. Kim, Y.H.; Kim, S.J.; Kim, Y.-J.; Shim, Y.-S.; Kim, S.Y.; Hong, B.H.; Jang, H.W. Self-activated transparent all-graphene gas sensor with endurance to humidity and mechanical bending. ACS Nano 2015, 9, 10453–10460. [Google Scholar] [CrossRef] [PubMed]
  28. Long, H.; Harley-Trochimczyk, A.; Pham, T.; Tang, Z.; Shi, T.; Zettl, A.; Carraro, C.; Worsley, M.A.; Maboudian, R. High surface area MoS2/Graphene hybrid aerogel for ultrasensitive NO2 detection. Adv. Funct. Mater. 2016, 26, 5158–5165. [Google Scholar] [CrossRef] [Green Version]
  29. Jung, M.W.; Kang, S.M.; Nam, K.H.; An, K.S.; Ku, B.C. Highly transparent and flexible NO2 gas sensor film based on MoS2/rGO composites using soft lithographic patterning. Appl. Surf. Sci. 2018, 456, 7–12. [Google Scholar] [CrossRef]
  30. Sangeetha, M.; Madhan, D. Ultra sensitive molybdenum disulfide (MoS2)/Graphene based hybrid sensor for the detection of NO2 and formaldehyde gases by fiber optic clad modified method. Opt. Laser Technol. 2020, 127, 106193. [Google Scholar] [CrossRef]
  31. Kim, K.S.; Zhao, Y.; Jang, H.; Lee, S.Y.; Kim, J.M.; Kim, K.S.; Ahn, J.-H.; Kim, P.; Choi, J.-Y.; Hong, B.H. Large-scale pattern growth of graphene films for stretchable transparent electrodes. Nature 2009, 457, 706–710. [Google Scholar] [CrossRef]
  32. Pandey, K.; Yadav, P.; Singh, D.; Gupta, S.K.; Sonvane, Y.; Lukačević, I.; Kim, J.; Kumar, M. First step to investigate nature of electronic states and transport in flower-like MoS2: Combining experimental studies with computational calculations. Sci. Rep. 2016, 6, 32690. [Google Scholar] [CrossRef] [PubMed]
  33. Ahmad, H.; Binsharfan, I.I.; Khan, R.A.; Alsalme, A. 3D Nanoarchitecture of polyaniline-MoS2 hybrid material for Hg(II) adsorption properties. Polymers 2020, 12, 2731. [Google Scholar] [CrossRef]
  34. Singh, S.; Sharma, S.; Singh, R.C.; Sharma, S. Hydrothermally synthesized MoS2-multi-walled carbon nanotube composite as a novel room-temperature ammonia sensing platform. Appl. Surf. Sci. 2020, 532, 147373. [Google Scholar] [CrossRef]
  35. Chen, Y.-J.; Gao, P.; Wang, R.-X.; Zhu, C.-L.; Wang, L.-J.; Cao, M.-S.; Jin, H.-B. Porous Fe3O4/SnO2 core/shell nanorods: Synthesis and electromagnetic properties. J. Phys. Chem. C 2009, 113, 10061–10064. [Google Scholar] [CrossRef]
  36. Xu, C.; Wang, X.; Zhu, J. Graphene−Metal particle nanocomposites. J. Phys. Chem. C 2008, 112, 19841–19845. [Google Scholar] [CrossRef]
  37. Wang, R.; Gao, S.; Wang, K.; Zhou, M.; Cheng, S.; Jiang, K. MoS2@rGO nanoflakes as high performance anode materials in sodium ion batteries. Sci. Rep. 2017, 7, 1–9. [Google Scholar] [CrossRef] [PubMed] [Green Version]
  38. Some, S.; Kim, Y.; Yoon, Y.; Yoo, H.; Lee, S.; Park, Y.; Lee, H. High-Quality reduced graphene oxide by a dual-function chemical reduction and healing process. Sci. Rep. 2013, 3, 1929. [Google Scholar] [CrossRef] [PubMed] [Green Version]
  39. Yue, Q.; Chang, S.; Qin, S.; Li, J. Functionalization of monolayer MoS2 by substitutional doping: A first-principles study. Phys. Lett. 2013, 377, 1362–1367. [Google Scholar] [CrossRef]
  40. Cao, R.; Zhou, B.; Jia, C.; Zhang, X.; Jiang, Z. Theoretical study of the NO, NO2, CO, SO2, and NH3adsorptions on multi-diameter single-wall MoS2nanotube. J. Phys. D Appl. Phys. 2015, 49, 045106. [Google Scholar] [CrossRef]
  41. Youn, D.H.; Jang, J.-W.; Kim, J.Y.; Jang, J.S.; Choi, S.H.; Lee, J.S. Fabrication of graphene-based electrode in less than a minute through hybrid microwave annealing. Sci. Rep. 2014, 4, 5492. [Google Scholar] [CrossRef] [PubMed] [Green Version]
Figure 1. Schematic of the synthesis of rGO/MoS2 composite.
Chemosensors 09 00345 g001
Figure 2. (a) Schematic of the structure of the flexible sensor, and (b) photograph of the flexible sensor.
Chemosensors 09 00345 g002
Figure 3. Schematic of the gas sensor test platform.
Chemosensors 09 00345 g003
Figure 4. Flexibility test: (a) photograph of sensor bending, (b) variation in device resistance with bending times, and (c) relationship between the response and NH3 gas concentration (100–600 ppm) at different bending angles.
Chemosensors 09 00345 g004aChemosensors 09 00345 g004b
Figure 5. SEM images at different magnifications: (a,b) MoS2, (c,d) rGO, and (eh) 10% rGO/MoS2.
Chemosensors 09 00345 g005
Figure 6. Energy dispersive X-ray spectroscopy (EDXS) maps of 10% rGO/MoS2.
Chemosensors 09 00345 g006
Figure 7. X-ray diffraction (XRD) patterns of MoS2 and the 10% rGO/MoS2 composite.
Chemosensors 09 00345 g007
Figure 8. Raman spectra of MoS2 and the 10% rGO/MoS2 composite.
Chemosensors 09 00345 g008
Figure 9. N2 adsorption and desorption isotherms of (a) pure rGO, (b) pure MoS2 and the (c) 10% rGO/MoS2 composite.
Chemosensors 09 00345 g009
Figure 10. Thermogravimetric analysis (TGA) and differential thermal analysis (DTA) curves of the 10% rGO/MoS2 composite.
Chemosensors 09 00345 g010
Figure 11. Relationship between the heating power and temperature.
Chemosensors 09 00345 g011
Figure 12. Representative response obtained upon exposing the gas-sensing material to 100 ppm of NH3 gas. Ra represents the basic resistance in air, Rg represents the test resistance value, tresponse represents the response time, and trecovery represents the recovery time.
Chemosensors 09 00345 g012
Figure 13. Response of pure MoS2, pure rGO, and rGO/MoS2 composites with different graphene contents to 100 ppm of NH3 at different operating temperatures.
Chemosensors 09 00345 g013
Figure 14. Variation in the response of the 10% rGO/MoS2 sensor to different concentrations of NH3.
Chemosensors 09 00345 g014
Figure 15. 10% rGO/MoS2 sensor response–concentration curve.
Chemosensors 09 00345 g015
Figure 16. Response of the 10% rGO/MoS2 sensor to various gases.
Chemosensors 09 00345 g016
Table 1. Specific surface area (SBET) and average pore diameter of MoS2 and the 10% rGO/MoS2 composite.
ParametersrGOMoS210% rGO/MoS2
SBET (m2/g)17.41572.220423.2786
Average pore size (nm)5.418611.2850 7.7910
Publisher’s Note: MDPI stays neutral with regard to jurisdictional claims in published maps and institutional affiliations.

