Article

Fluorescent AgNCs Formed on Bifunctional DNA Template for Potassium Ion Detection

1
Faculty of Chemistry, Adam Mickiewicz University, Uniwersytetu Poznańskiego 8, 61-614 Poznan, Poland
2
NanoBioMedical Centre, Adam Mickiewicz University, Wszechnicy Piastowskiej 3, 61-614 Poznan, Poland
*
Author to whom correspondence should be addressed.
Submission received: 31 October 2021 / Revised: 6 December 2021 / Accepted: 7 December 2021 / Published: 9 December 2021
(This article belongs to the Section (Bio)chemical Sensing)

Abstract

:
In this study, we examined properties of silver nanoclusters, which are AgNCs stabilized by DNA oligonucleotide scaffold containing G-quadruplex-forming sequences: human telomeric (Tel22) or thrombin-binding aptamer (TBA). Thus, we obtained two fluorescent probes abbreviated as Tel22C12-AgNCs and TBAC12-AgNCs, which were characterized using absorption, circular dichroism and fluorescence spectroscopy. Both probes emit green and red fluorescence. The presence of silver nanoclusters did not destabilize the formed G-quadruplexes. The structural changes of probes upon binding K+ or Na+ ions cause quenching in their red emission. Green emission was slightly quenched only in the case of Tel22C12-AgNCs; on the contrary, for TBAC12-AgNC’s green emission, we observed an increasing fluorescence signal. Moreover, the Tel22C12-AgNCs system shows not only a higher binding preference for K+ over Na+, but it was able to monitor small changes in K+ concentrations in the buffer mimicking extracellular conditions (high content of Na+ ions). These results suggest that Tel22C12-AgNCs exhibit the potential to monitor transmembrane potassium transport.

1. Introduction

Silver nanoclusters (AgNCs) are a new class of fluorescent markers, the formation of which requires a suitable template, e.g., peptides, proteins, dendrimers, polymers, thiols or DNA oligonucleotides [1]. The cytosine base-rich oligonucleotides are the most commonly used template for AgNCs preparation because the C-Ag+-C complex has the best binding affinity [2,3,4]. So far, no binding of silver cations to DNA has been observed as a result of interactions with phosphate groups; therefore, it is believed that silver cations are bound only to DNA bases [5]. Further studies on the interaction of Ag+ ions with various polymorphic DNA structures (cytosine-rich strands, duplex, i-motif and G-quadruplex) showed that the formation of DNA-Ag (I) complexes is a highly enthalpy-dependent process and negative enthalpy change is attributed to the exothermic coordination between silver ions and DNA bases [6]. The highest binding constants were obtained for oligonucleotides rich in cytosine base, followed by i-motifs and duplexes, while G-quadruplex matrices show the lowest silver ion binding constants [7]. The facile synthesis of silver nanoclusters (AgNCs) on DNA templates as well as their excellent brightness, good photostability and biocompatibility and small size compared to other fluorophores such as quantum dots or organic dyes make them the subject of extensive research resulting in numerous bioanalytical applications [8,9]. Moreover, the properly constructed oligonucleotide template enables obtaining fluorescent biosensors, which constitute a simple and cost-effective alternative to fluorophore-conjugated oligonucleotide probes. It is worth remembering that the bioanalytical application of fluorescent oligonucleotide probes is related not only to their ability to hybridize with the complementary strand but also to the discovered catalytic properties of some DNA fragments (DNAzymes) or the ability to bind other biomolecules (aptamers).
Thus, the use of DNA as a scaffold for nanoclusters is particularly convenient due to its structural versatility and easy integration with functional nucleic acids. For example, Dong et al. used aptamer-functionalized DNA-AgNCs for the detection of cocaine molecules with a LOD of 0.1 mM [10]. Lately, Alipour et al. developed the dual-emitted cluster on DNA template to detect transgenic DNA (GMO). The designed system included DNA elements related to genetic modification in maize and was able to adopt a three-way junction structure upon hybridization with its target and G-rich sequence. The ratio of green to red fluorescence of the nanocluster exhibited a linear response with the target concentration in the range from 0.01 to 1 μM [11]. Earlier, Feng et al. utilized AS1411 aptamer integrated with C-rich sequence (C10) to obtain biostable silver nanocluster for bioimaging specific tumor cells [12]. As it is known, AS1411 binds selectively to nucleolin, which is overexpressed on the surface of some malignant tumor cells [13,14]. The authors indicated that using L-conformation oligonucleotides as a scaffold enhanced the biostability of red emitting AgNCs; as a consequence, lower aptamer-AgNCs concentration is needed in order to observe fluorescence signals in vivo [12]. Martinez et al. introduced DNA-AgNCs aptamer that can selectively bind thrombin and emits bright fluorescence (~60% quantum yield) with an emission peak at ~700 nm [15].
In their structure, aptamers and DNAzymes often contain non-canonical forms of DNA among which four-stranded structures such as G-quadruplexes (GQ) should be distinguished. GQ structures show many topological forms depending on their sequence and nature of the cation that stabilizes the structure [16,17,18,19,20,21]. In particular, the channel cavity site of the G-quadruplex structure prefers K+ over Na+. Thus, by taking into account the stabilizing properties of the K+ ion, a number of probes have been developed for monitoring the gradient of potassium ions in cellular conditions [22,23,24,25,26,27]. Among them, oligonucleotides with sequences of human telomere DNA or thrombin-binding aptamer (TBA) 15-mer d(G2T2G2TGTG2T2G2) are the most extensively employed as receptor layers [28].
Sensitive and selective detection of K+ is essential to biomedical diagnosis. However, it is a challenge to selectively determine the extracellular K+ concentration due to the presence of the large excess of sodium ion (Na+) in physiological conditions [29]. Biosensors using G-quadruplex DNAs as sensing elements for K+ detections not only meet these criteria but also possess high biocompatibility and adjustable biodegradability.
The goal of the presented study was to obtain highly fluorescent AgNCs on cytosine-rich DNA template (C12) integrated with a G-quadruplex DNA to form the new sensing probes to monitor K+ changes in the extracellular environment. We assumed that the C-rich domain is mainly responsible for nanocluster formation and serves as the fluorescent tag, whereas the G-quadruplex forming domain serves as a receptor layout for potassium ions. For our purpose, with respect to the G-quadruplex forming part, we used two oligonucleotides bearing the sequence of human telomeric DNA (Tel22) and thrombin-binding aptamer (TBA). We obtained two fluorescent probes abbreviated as Tel22C12-AgNCs and TBAC12-AgNCs, respectively. As a result of the introduction of potassium ions, the Tel22 or TBA oligonucleotide fragment should assemble into a G-quadruplex secondary structure stabilized by the added metal cation. The structural changes were expected to have a significant impact on the specific interactions between GQ DNA and the formed silver nanoclusters on the C12 strand, thus modulating the fluorescence properties of DNA-AgNCs. We mainly utilized UV, fluorescence and CD spectroscopy techniques to monitor silver nanocluster formation and to perform spectral characterization of obtained AgNCs on Tel22C12 and TBAC12 scaffolds and the reference C12 oligonucleotide. Thermal denaturation experiments were also carried out to evaluate the stability of G-quadruplexes domain in Tel22C12-AgNCs and TBAC12-AgNCs systems and compared to free Tel22 and TBA G-quadruplexes. The effects of potassium and sodium ions on the spectral properties of Tel22C12-AgNCs and TBAC12-AgNCs were investigated. Finally, the performance of Tel22/C12-AgNCs as the fluorescent K+ probe for extracellular measurements was examined by determining linear responses in the absence as well as presence of sodium ions.

2. Materials and Methods

2.1. Materials

Oligonucleotides (Table 1) were synthesized and purified on a high-affinity column by Genomed (Warsaw, Poland) and IBA (Göttingen, Germany). The concentrations of the nucleotides were adjusted by UV/Vis spectrophotometry. Tris(hydroxymethyl)aminomethane (TRIS) (≥99.9%), dimethylarsinic acid sodium salt trihydrate (≥98%), silver (I) nitrate (AgNO3, ≥99.0%), sodium borohydride (NaBH4, ≥98%), sodium chloride (NaCl, ≥99.0%) potassium nitrogen (KNO3, ≥99.0%) and potassium chloride (KCl, ≥99.0%) were purchased from Sigma-Aldrich. All stock solutions were prepared using MiliQ type purified water with Ultrapure Water Simplicity UV system and autoclaved using the Classic Prestige Medical Autoclave.

2.2. Methods

2.2.1. DNA-Ag Nanoclusters Synthesis

Silver nanoclusters were synthesized following the procedure of Ritchie et al. [30], which was slightly modified by us [31]. First, the corresponding DNA solution of 2.0 μM was added to Tris-acetate buffer (10 mM, pH 7.5). Next, the appropriate volume of AgNO3 solution of 10 mM was added into the prepared corresponding DNA solution (1:1 molar ratio, Ag+/C base or Ag+/GC bases) and kept in the dark at 4 °C for 15 min. After that time, the freshly prepared NaBH4 solution was added to the cold mixture and shaken vigorously for 1 min to reduce silver ions and to form AgNCs on DNA. Finally, the obtained solution was further stored (at least 1 h) in the dark at 4 °C to prepare stable DNA-AgNCs.

2.2.2. Fluorescence Spectroscopy

Measurements of fluorescence spectra (emission spectra and excitation spectra) were performed by using an FP-8200 spectrofluorometer (Tokyo, Japan) equipped with a Peltier accessory and were carried out using 0.4 × 1 cm quartz cuvette containing 1 mL of sample. Spectra were recorded at 25 °C with record speed of 200 nm/min, with excitation and emission slits equal 5 nm and medium detector operation. The recording range of fluorescence spectra and their excitation and emission wavelengths were as follows:
  • C12-AgNCs: Emission spectra of C12-AgNCs were collected at 3 excitation wavelengths: λex = 260 nm, λex = 470 nm and λex = 580 nm. Excitation spectra were collected at emission wavelength λem = 630 nm.
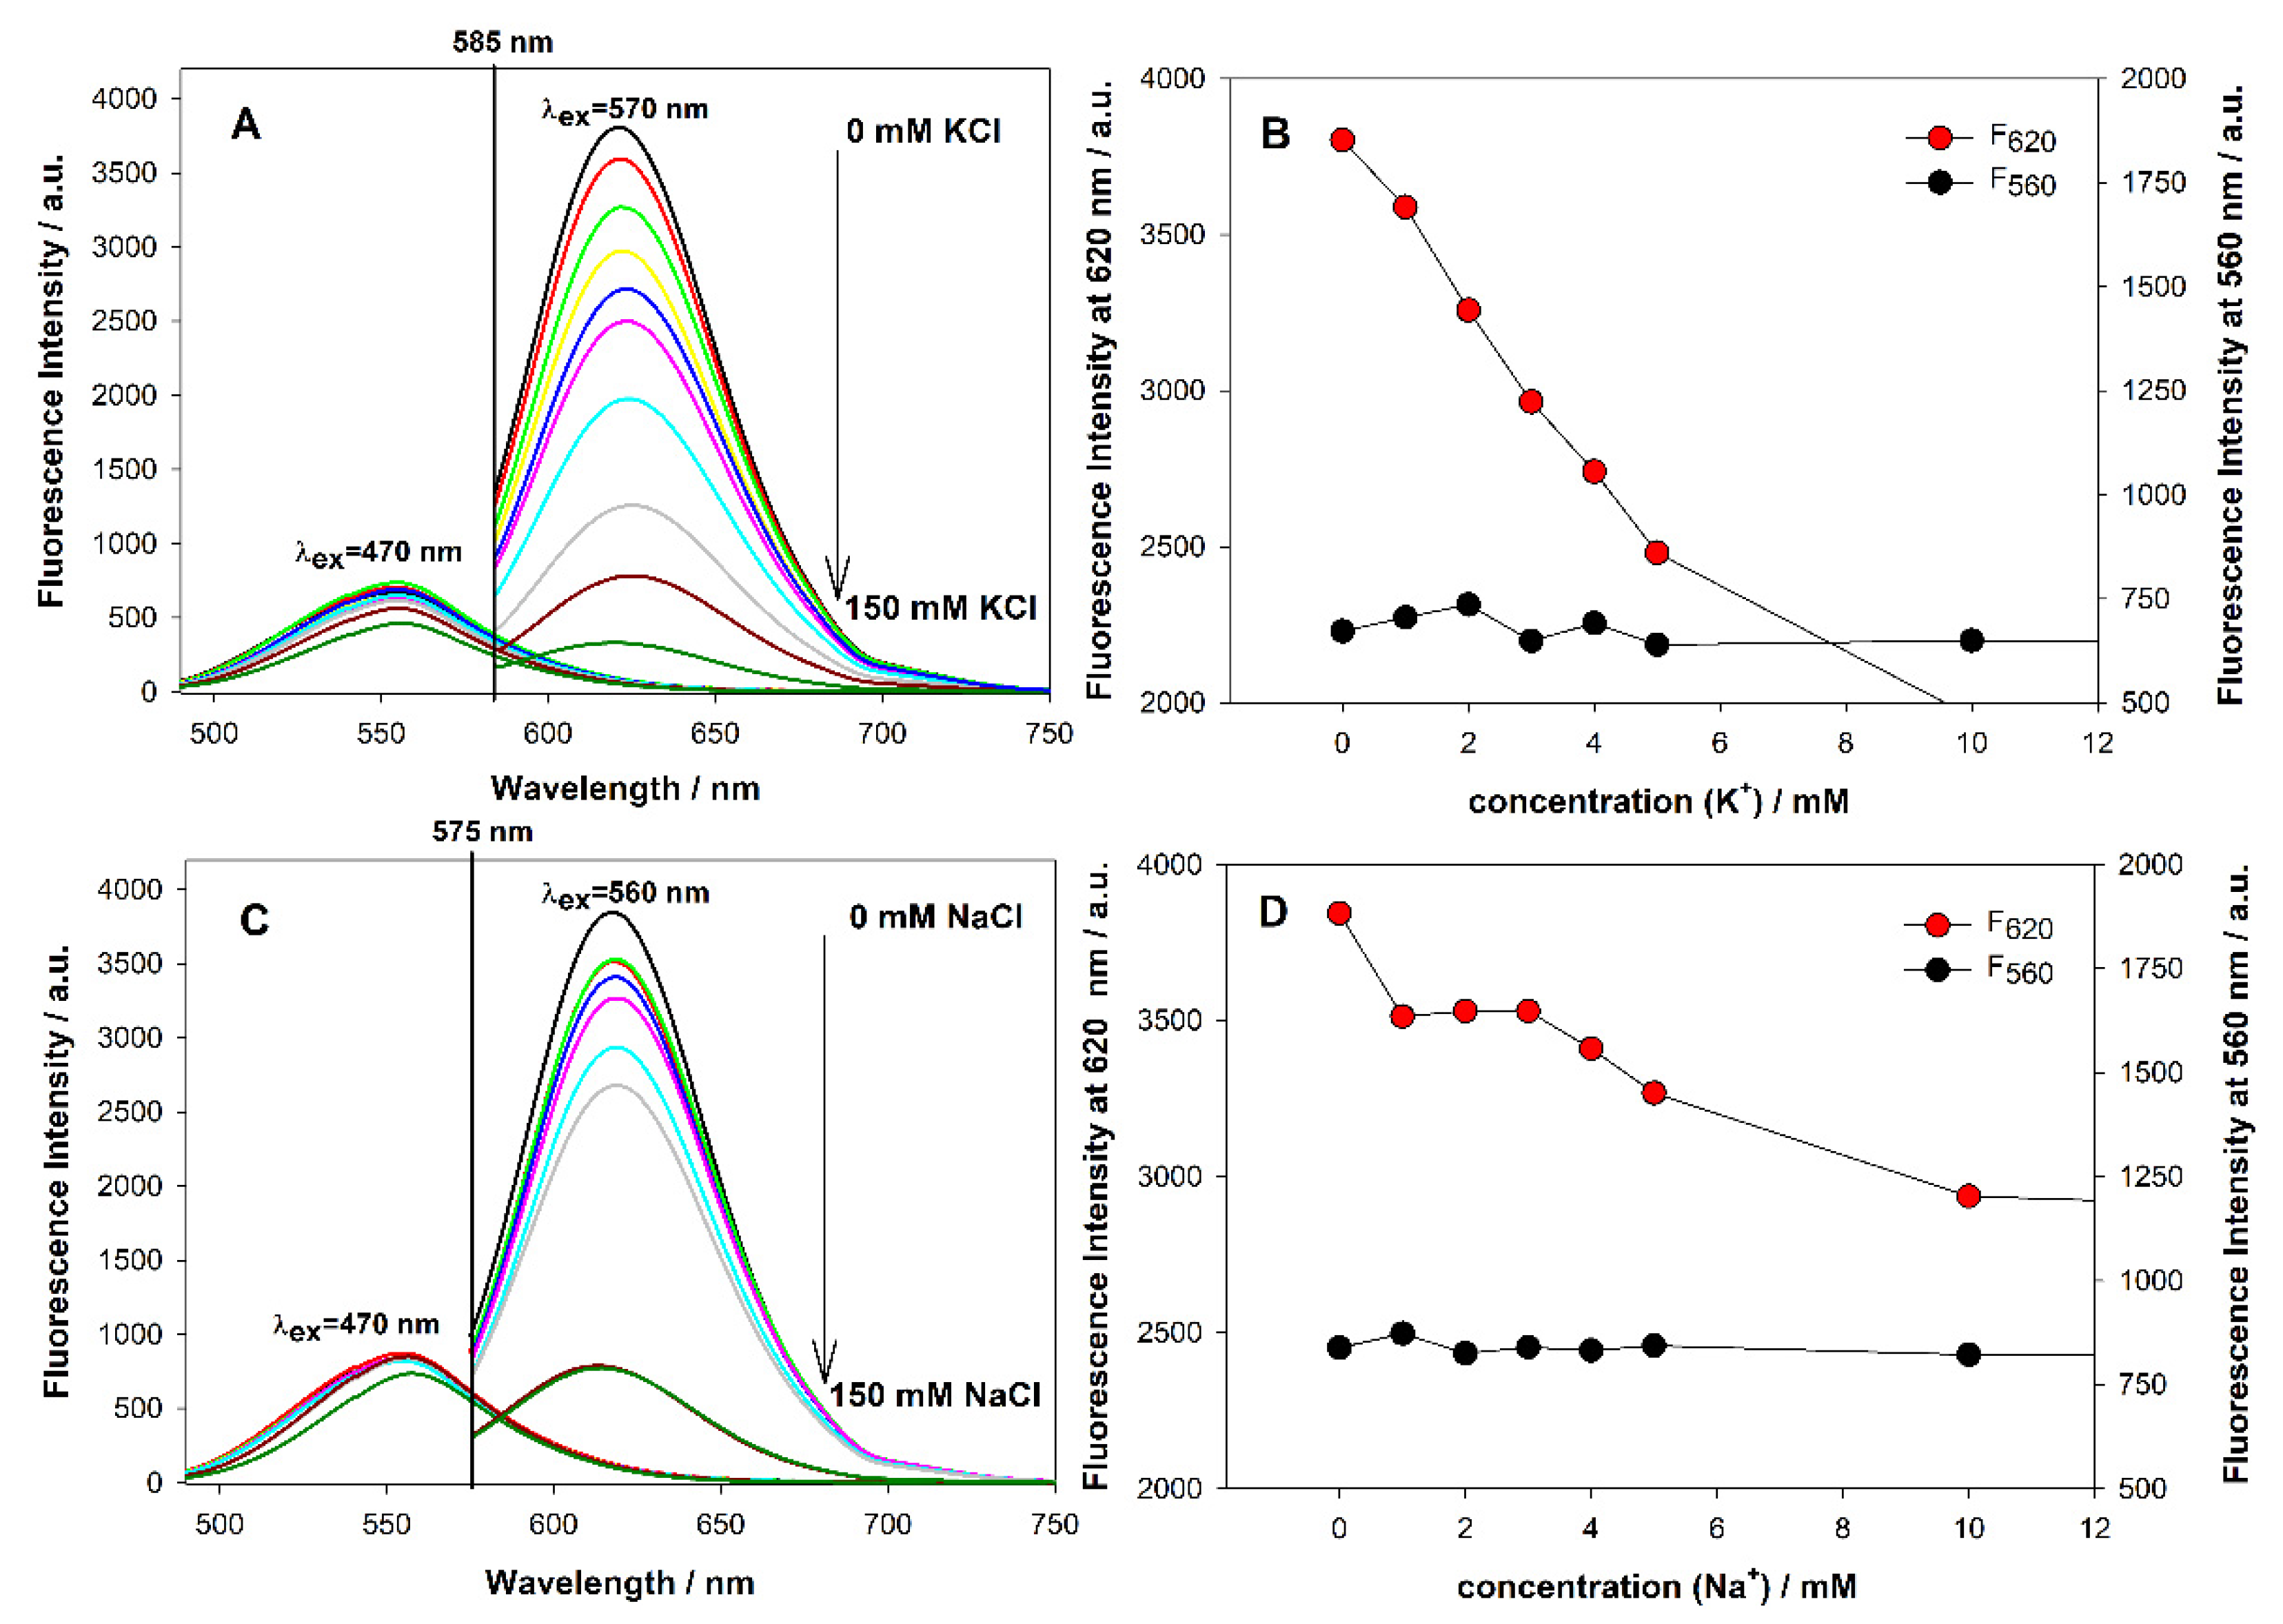
  • Tel22C12-AgNCs: Emission spectra of Tel22C12-AgNCs were collected at 3 excitation wavelengths: λex = 260 nm, λex = 470 nm and λex = 570 nm. Excitation spectra were collected at 2 emission wavelengths: λem = 550 nm and λem = 620 nm.
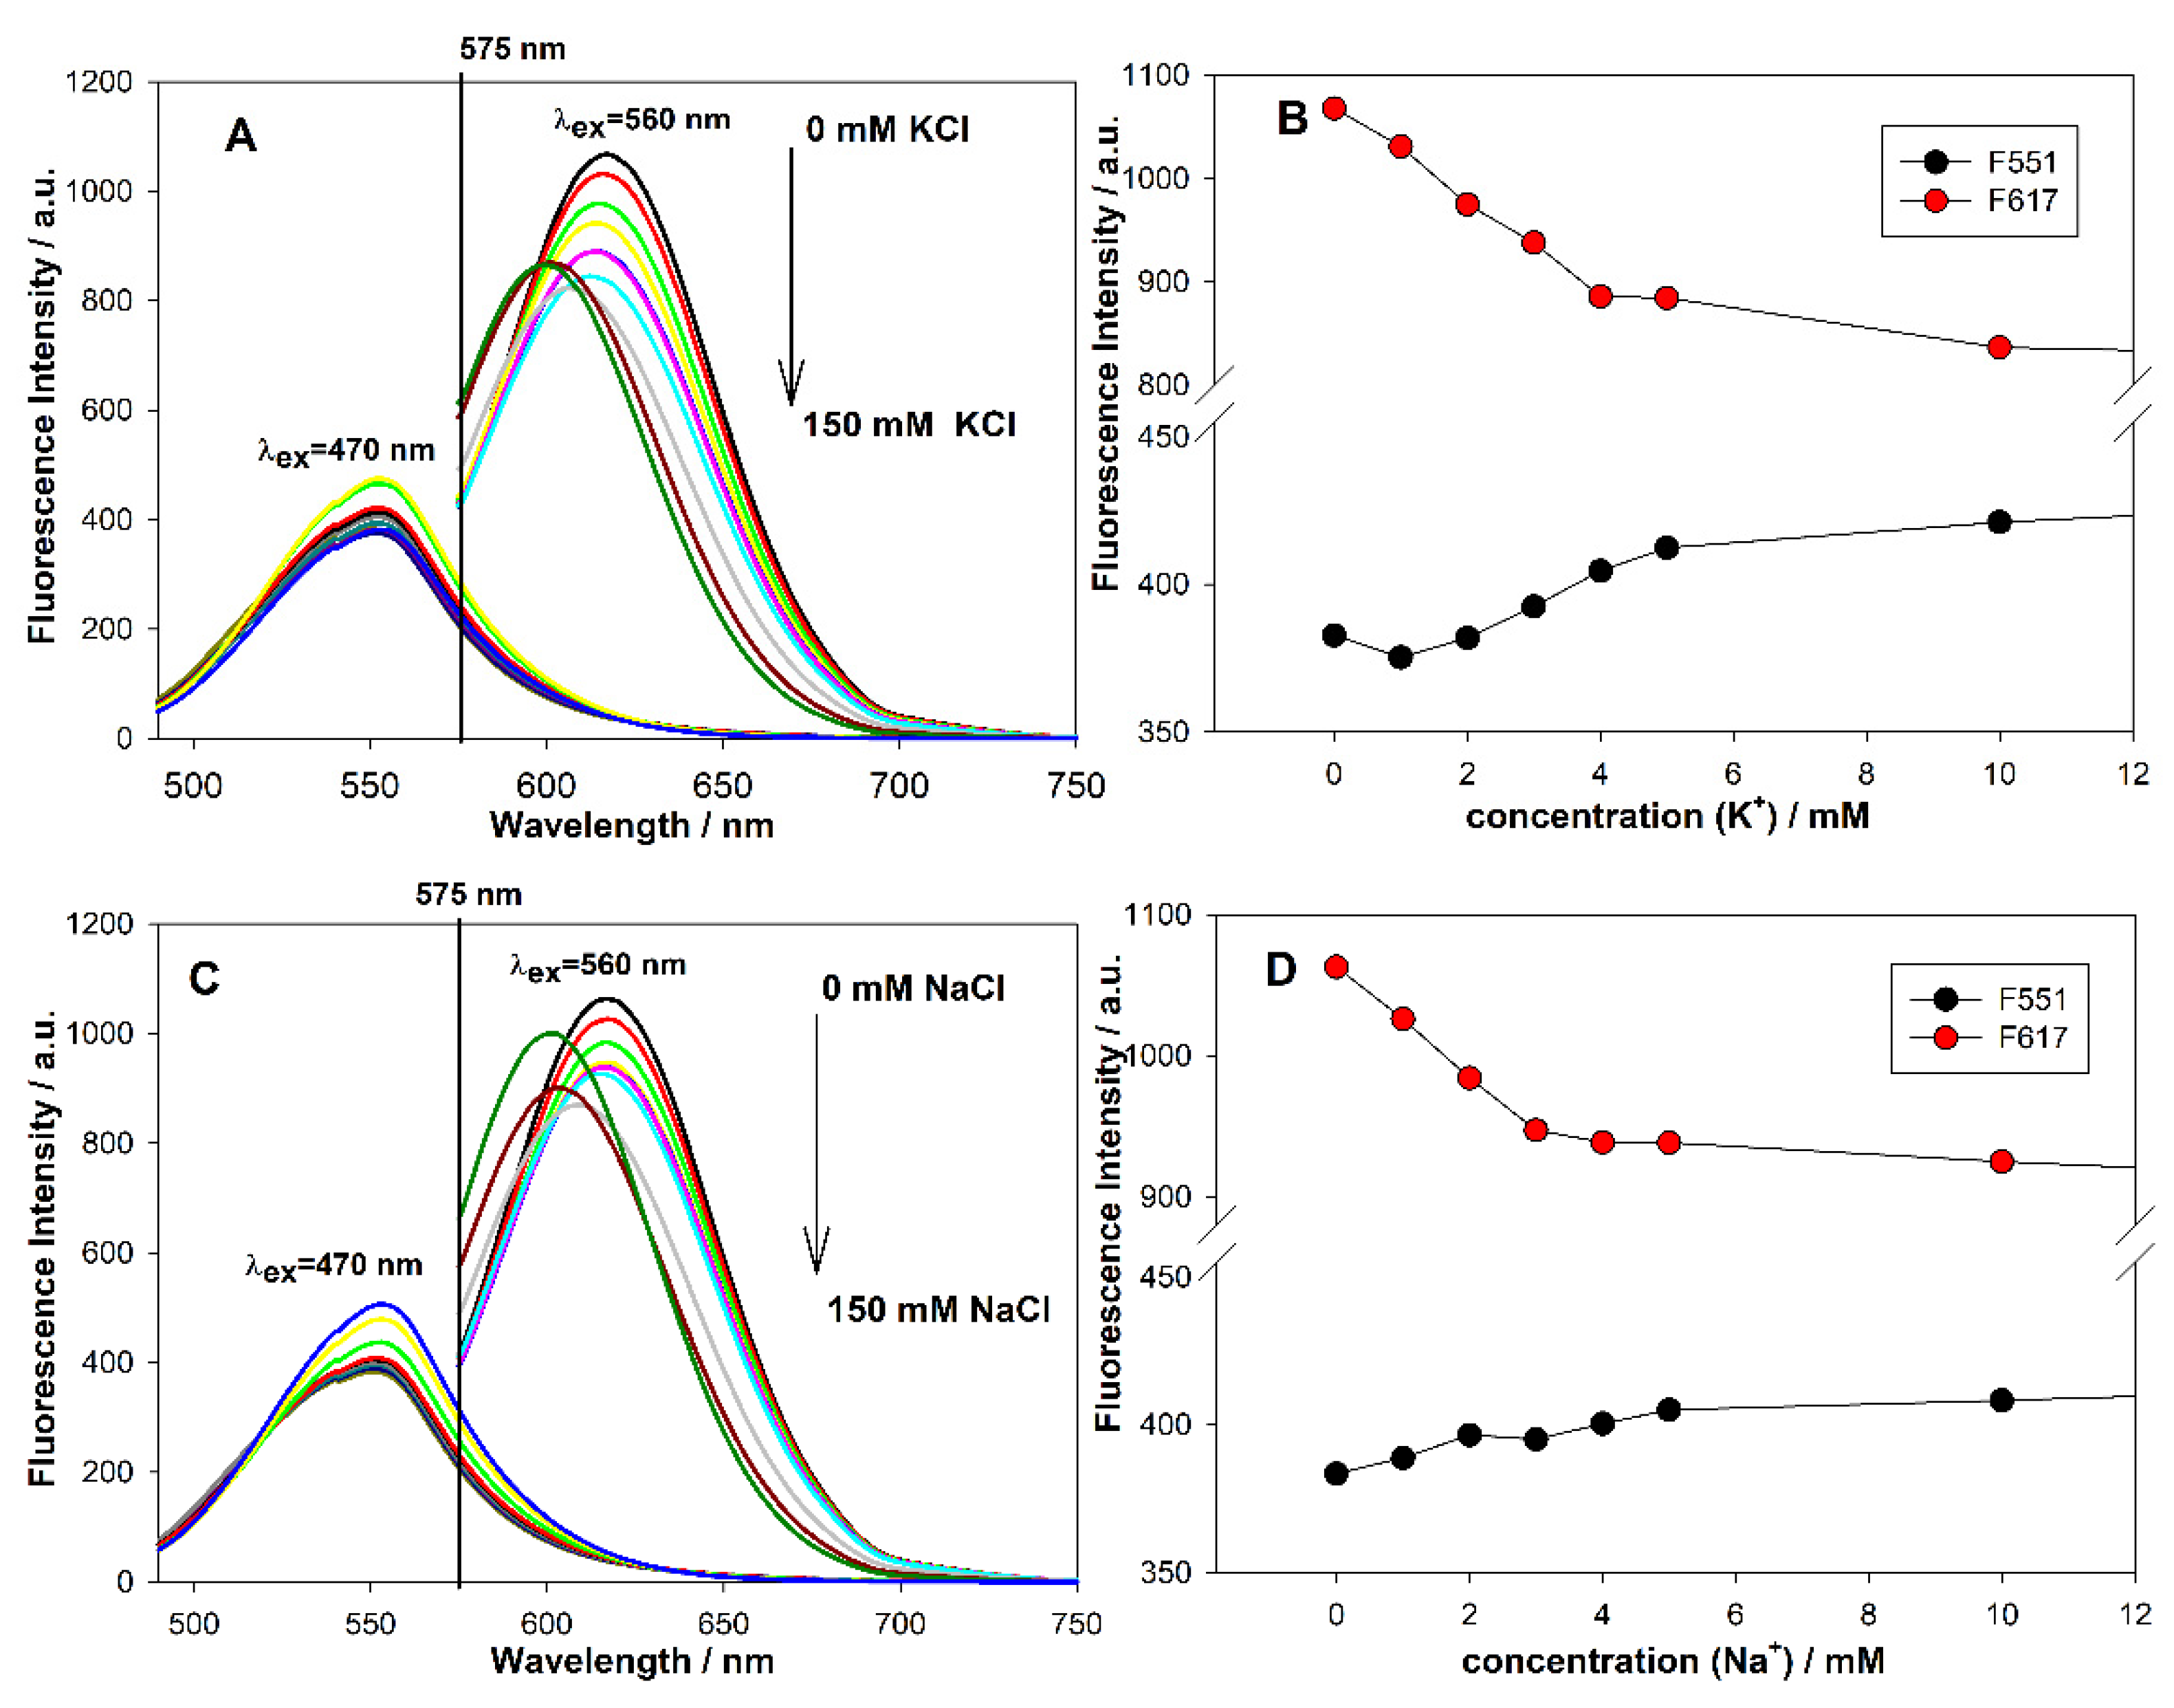
  • TBAC12-AgNCs: Emission spectra of TBAC12-AgNCs were collected at 3 excitation wavelengths: λex = 260 nm, λex = 470 nm and λex = 560 nm. Excitation spectra were collected at 2 emission wavelengths: λem = 550 nm and λem = 610 nm.

2.2.3. Circular Dichroism (CD) Spectroscopy

CD spectra were recorded on a Jasco J-820 Spectropolarimeter (Tokyo, Japan) equipped with a PTC-423L temperature controller at 25 °C. Each measurement was the average of three repeated scans recorded from 200 to 400 nm with a 10 mm quartz cell at a scan speed of 500 nm/min. The scan of the corresponding buffer solution was subtracted from the average scan for each sample.

2.2.4. UV-Vis Absorption Spectroscopy

Measurements of UV-Vis absorption spectra of the studied oligonucleotides were performed by using Jasco V-750 spectrophotometer (Tokyo, Japan) equipped with a Peltier-type temperature controller. Absorption spectra were recorded in the spectrum range of 220–800 nm with a record speed of 500 nm/min at 25 °C.

2.2.5. Transmission Electron Microscopy (TEM)

TEM investigations were carried out by means of JEOL ARM 200F. TEM images were taken with an accelerating voltage of 200 kv and at subångström resolution. The samples for examination by transmission electron microscopy were prepared by a deposition of a few droplets of silver nanoclusters solution onto holey carbon film supported by copper TEM grid.

2.2.6. Studies upon Metal Cation Effect

A typical investigation of metal cation effect in the concentration range of 0–0.15 M consisted of successive additions of small portions of a concentrated solution of 3 M KCl or 3 M NaCl salt to 1 mL of DNA-AgNCs prepared 24 h earlier. After each addition, the solution was stirred, followed by thermally equilibration.

3. Results

The aim of our research was to verify the effect of potassium or/and sodium ions on the emission properties of AgNCs templated on oligonucleotide strands with the sequences 5’-AGG GGT AGG GTT AGG GTT AGG GCC CCC CCC CCC C-3’ or 5’-GGT TGG TGT GGT TGG CCC CCC CCC CCC-3’. As reference, we used AgNCs synthesized on 12-mer oligonucleotide bearing only cytosines.

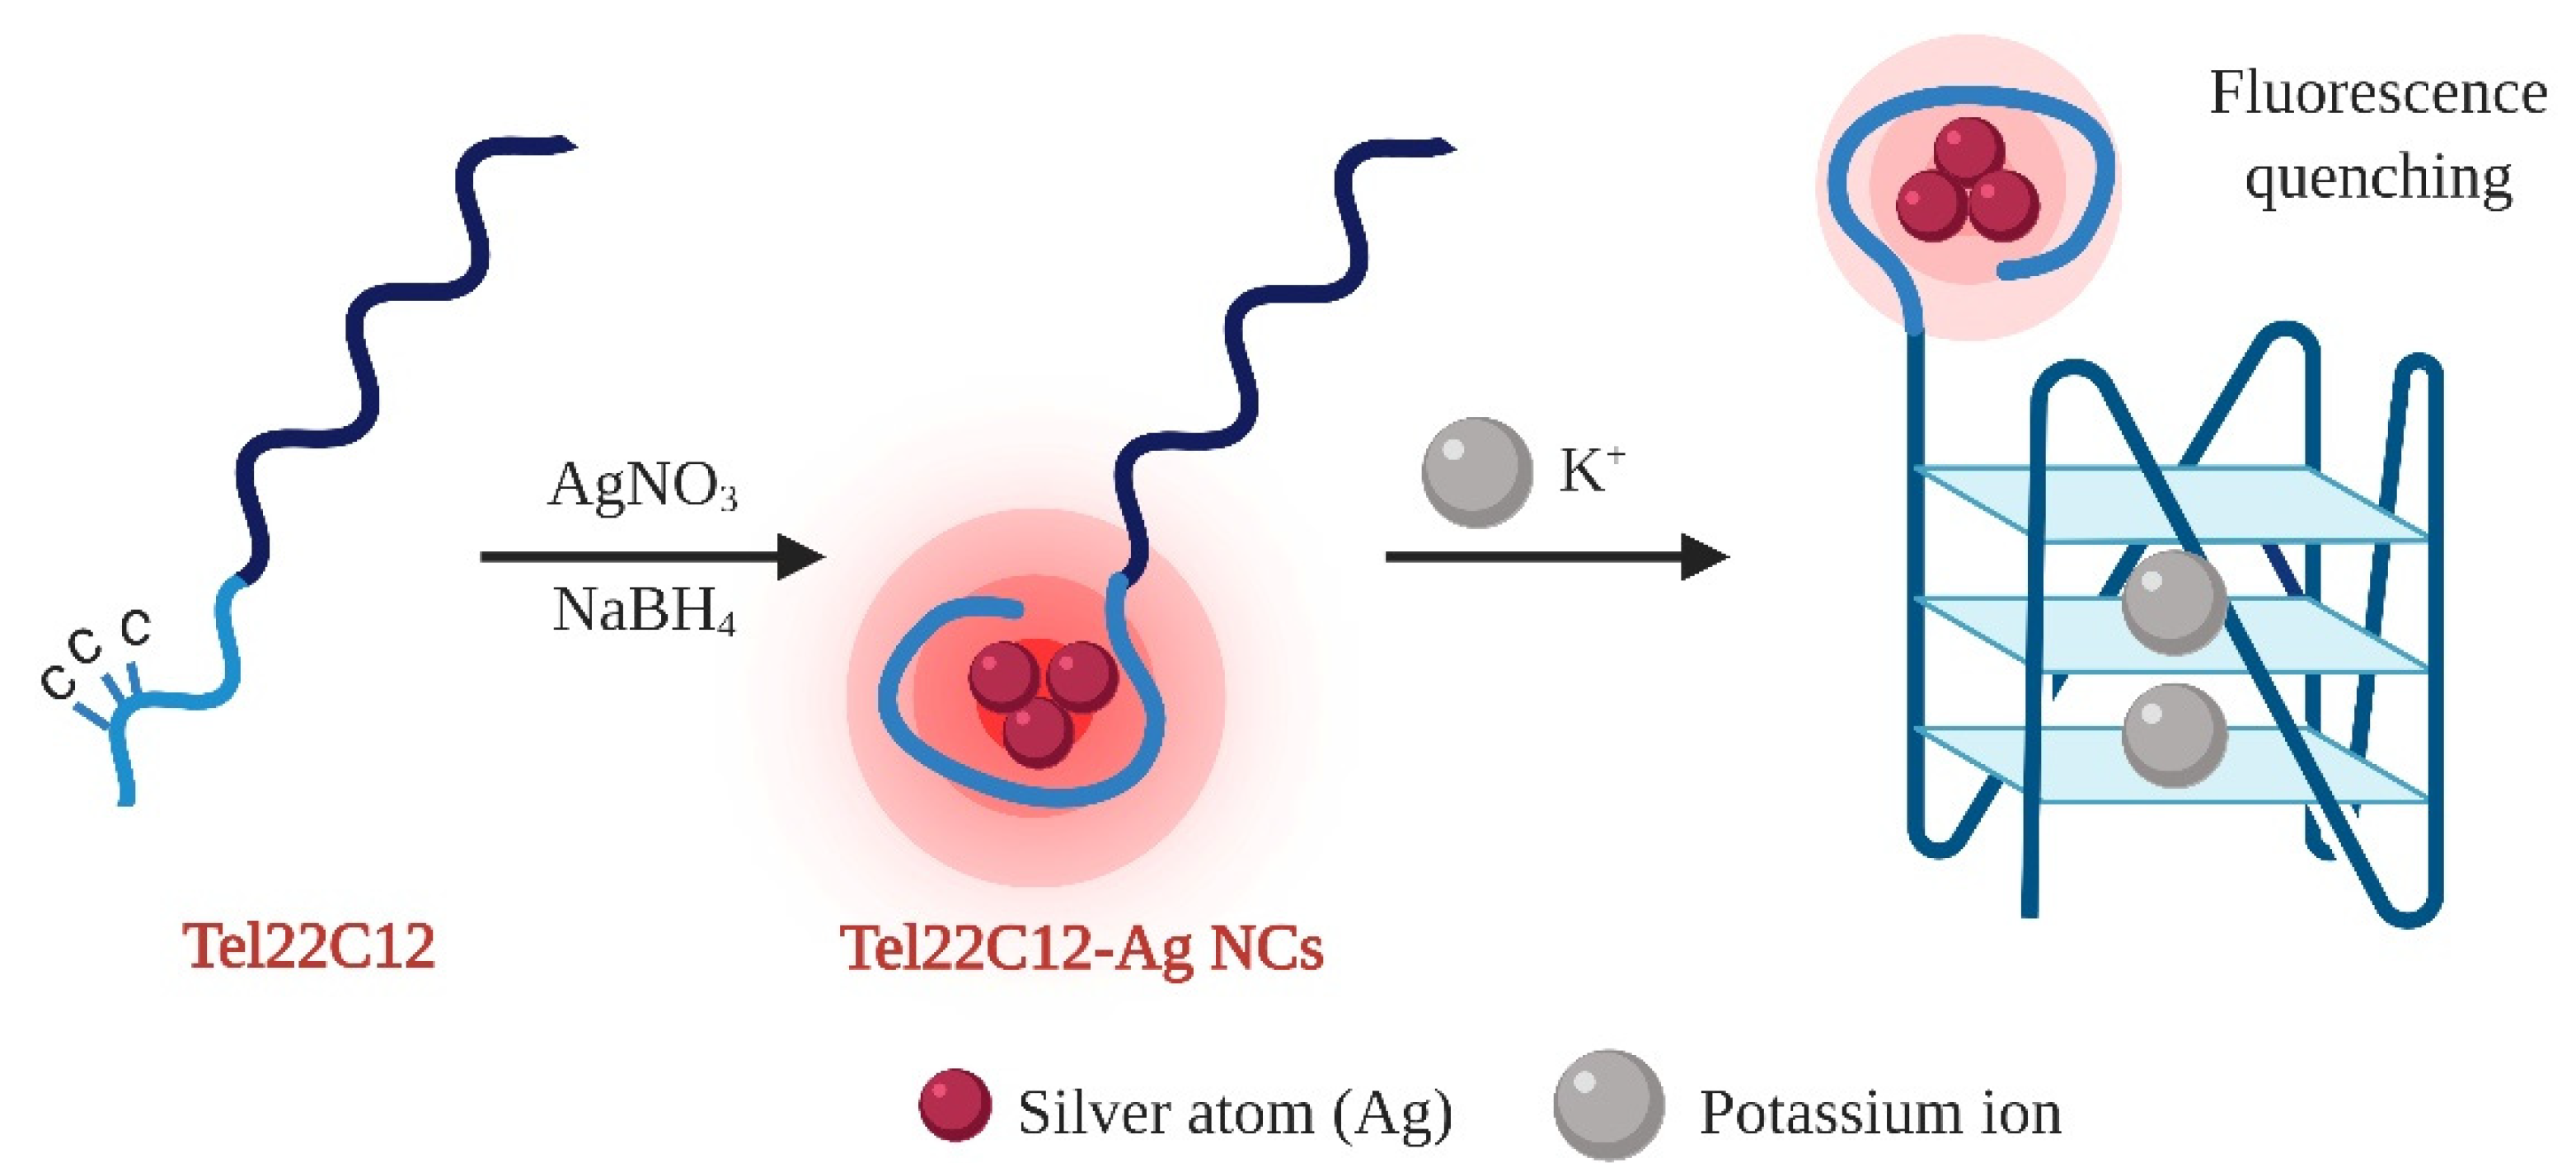
3.1. The Prinicple Working Idea

The strategy of the label-free monitor of potassium ion changes based on G-quadruplexes and AgNCs is presented in Figure 1. In this approach, the bifunctional sensor strand consists of two functional units, a 12-cytosine part (C12, marked blue) that serves as an AgNCs template and a G-quadruplex forming sequence (Table 1). C12 oligonucleotide possess the documented ability to be an effective template for bright red emission AgNCs with 2–7 Ag atoms [30].
We used two different G-quadruplex forming sequences, which form different structural topologies in the presence of potassium ions, the human telomeric sequence AGGG(TTAGGG)3 (Tel22) [16,17] and thrombin-binding aptamer GGTTGGTGTGGTTGG (TBA) [19,20]. We assumed that the addition of potassium or sodium ions induces G-quadruplex formation, causing remarkable changes in the fluorescence of silver nanocluster emissions.

3.2. Rationalization of AgNCs Templated on C12 Integrated with GQ

The synthesis of AgNCs on the DNA template was performed according to the procedure described by Petty [30] with slight modifications as in our previous study [31]. It is known that the sequence and length of the DNA oligonucleotide play an important role in determining the size of AgNCs and their optical properties, while the Ag+/DNA molar ratio determines fluorescence intensity [32]. As mentioned above, cytosine has the highest binding affinity for Ag+ ions, but other bases, particularly guanine, can also be used as a template for DNA-AgNCs formation [33,34,35]. In our case, TBAC12 and Tel22C12 templates contain C-rich and G-rich domains; as a consequence, the formation of AgNCs on both fragments cannot be ruled out. Therefore, we decided to check how the Ag+/DNA ratio affects the spectral properties of Tel22C12-AgNCs or TBAC12 silver nanoclusters. We used a two different amounts of silver ions to generate silver nanoclusters. The ratio of 1:1 (C) means that there is 1 Ag+ ion per 1 cytosine base in the template strand; a ratio of 1:1 (CG) means that there is 1 Ag+ ion per sum of cytosine and guanine bases present in the template strand. In the case of reduction, the number of BH4¯ was an equal amount of Ag+ ions. Anyway, silver nanoclusters were prepared by mixing TBAC12 or Tel22C12 buffer solutions with AgNO3 and then Ag+ was reduced by freshly prepared NaBH4. The formation of the nanoclusters during the reduction step was evident from the appearance of a yellowish color. First, the emission spectra of the as-prepared DNA-AgNCs were recorded with excitation at 260 nm, which is near the absorption maxima of DNA bases. As shown in Figure 2, changing the DNA/Ag+ molar ratio affects fluorescence intensities but does not change the emission wavelength position (λmax around 560 nm and λmax around 620 nm). Silver nanoclusters synthesized at the ratio of 1:1 (Ag+:cytosine) show the best photoemission properties for both emission wavelengths (Figure 2A). Using a higher molar ratio of silver ions to DNA, the overall fluorescence intensity (Figure 2B) was quenched practically by 50% compared to the fluorescence obtained with ratio 1:1 (Ag+/C).
The amount of AgNO3 used for the synthesis of silver nanoclusters also affects the absorption spectra (Figures S1–S3) and circular dichroism spectra (Figures S4 and S5). The most important factor is the presence of the absorption band at around 440 nm, which is characteristic for AgNCs [29]. The stability of electronic transitions in the absorption spectra was also tested for at least a week (Figures S1–S3). It is worth noticing that the absorption spectra of Tel22C12-AgNCs (Figure S2) as well as TBAC12-AgNCs (Figure S3), apart from the UV bands and band at 440 nm, possess a small band at 590 and 520 nm, respectively. The latter band’s intensity increases after 24 h contrary to decreasing intensity of bands at 440 nm and 350 nm. In the case of the CD spectra recorded for Tel22C12-AgNCs and TBAC12-AgNCs obtained with the ratio 1:1 (Ag+/C) and ratio 1:2 (Ag+/C), the differences are not so pronounced (Figures S4 and S5).
Morphology and size of Ag nanoclusters, obtained on C12 as well as Tel22C12 DNA scaffolds, were investigated using transmission electron microscopy (Figure S6). TEM images showed that the obtained silver nanoclusters are spherical in shape. The diameter of spherical C12-AgNCs oscillates around the values of 0.8 nm, 1.5 nm and 2 nm. These diameter values are in agreement with previous reports (<2 nm). TEM images indicated the different size distribution of the nanoclusters, as was expected from spectroscopic studies. The microscopic TEM images obtained for Tel22C12-AgNCs (Figure S6C,D) revealed that the synthesized Ag nanoclusters have larger sizes, mainly with a diameter of ~4.4 nm and ~5 nm, and confirmed earlier conclusions that the synthesized nanoclusters should have different sizes as two emission bands were observed, which correspond to the green (λem around 550 nm) and red (λem around 620 nm) color of fluorescence.
Therefore, the synthesis of silver nanoclusters on the DNA template was further carried out at a molar ratio of 1:1 (DNA(cytosine):Ag+). The final concentrations were 2 µM DNA/24 µM Ag+/24 µM BH4, respectively.

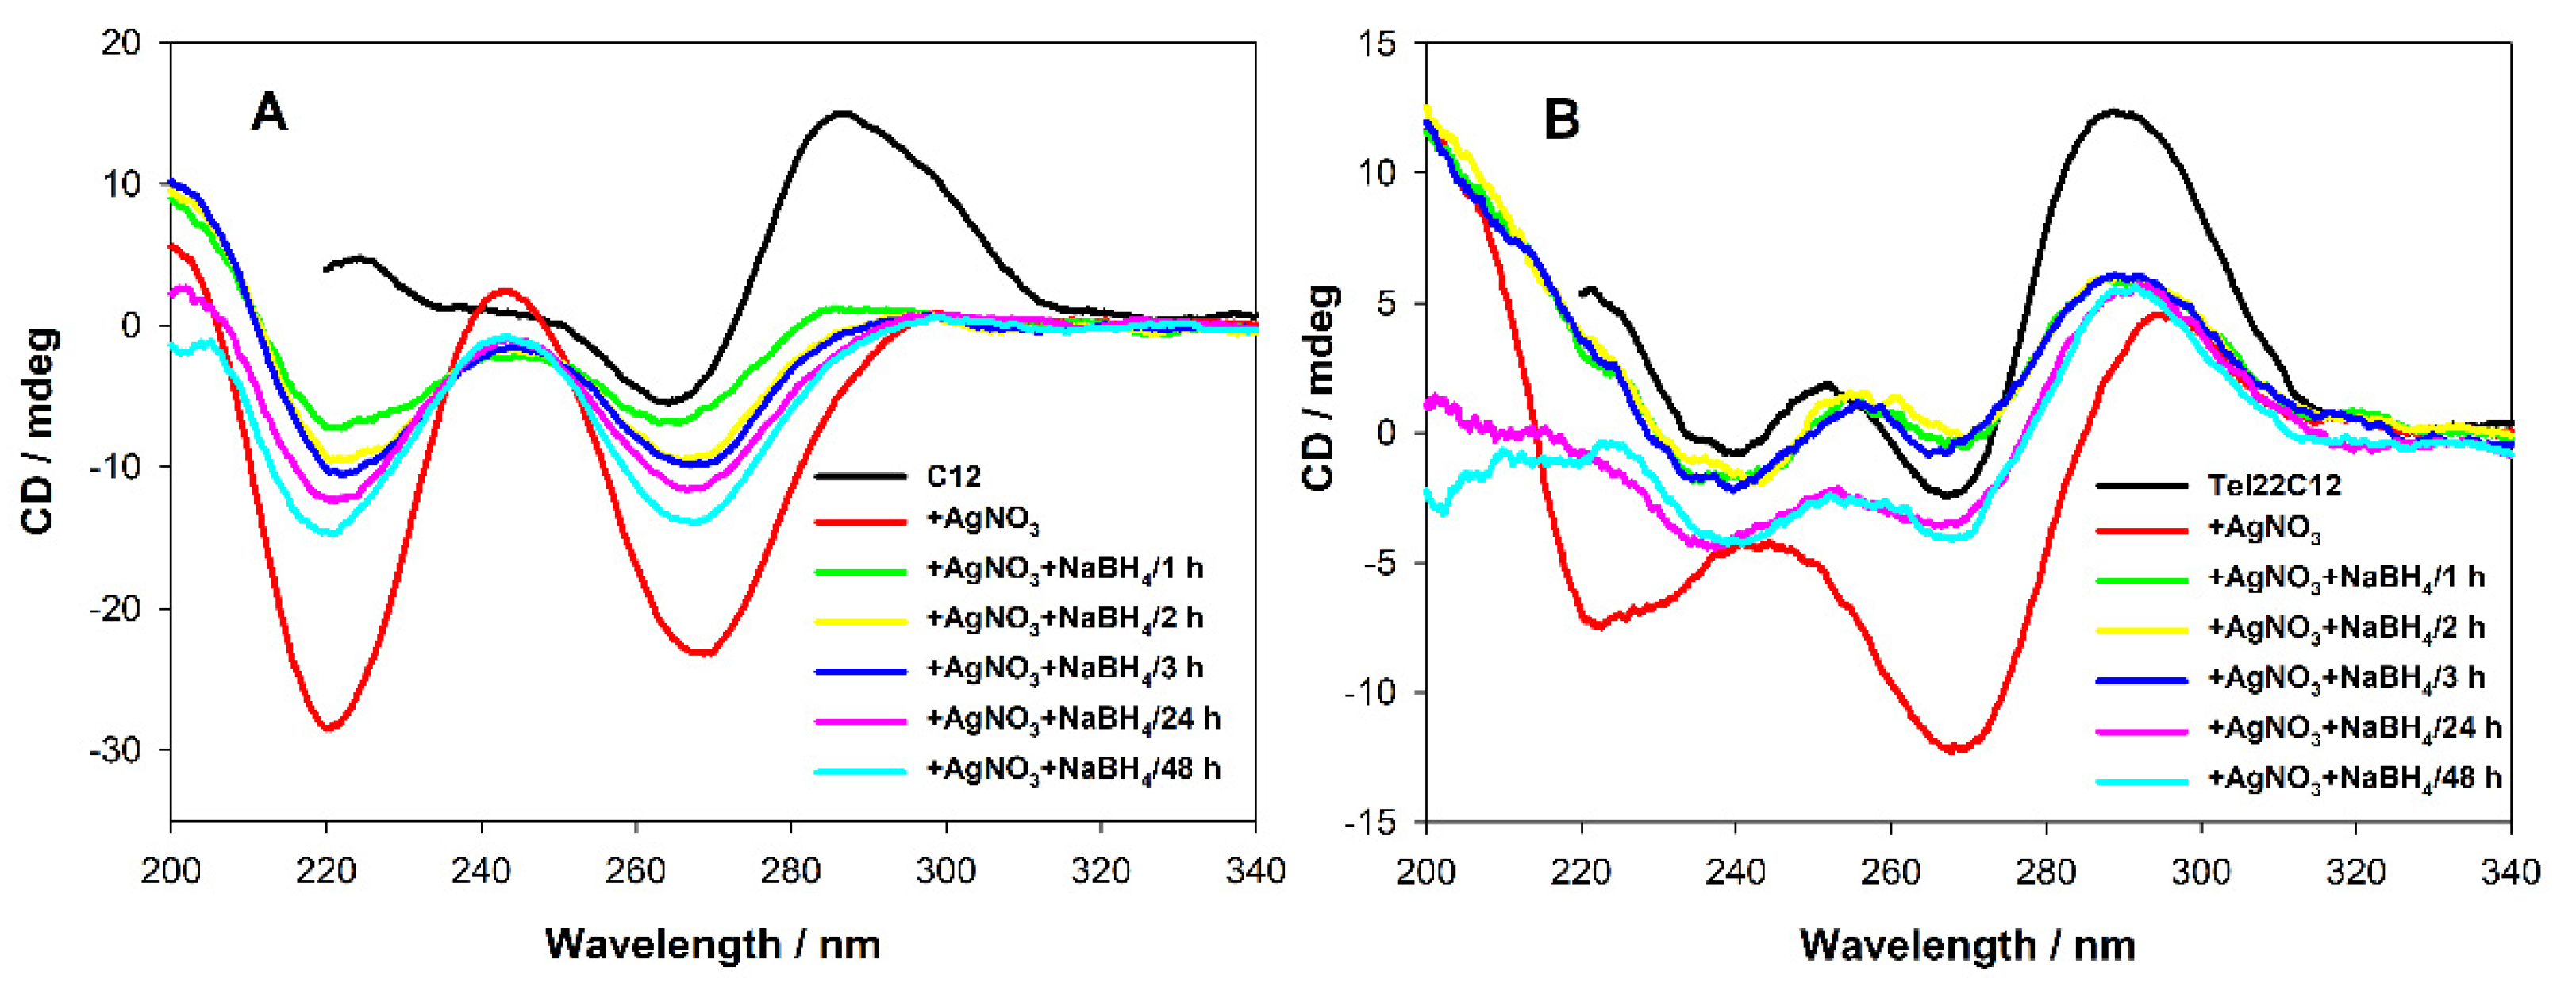
3.3. Circular Dichroism Studies upon AgNCs Templated on C12 Integrated with Tel22

In order to investigate conformational changes in Tel22C12-AgNCs and C12-AgNCs systems, CD spectra of the oligonucleotides were measured before and after the addition of Ag+ ions and reducing agent. In the absence of Ag+ ions, C12 oligonucleotide (black line, Figure 3A) shows the expected position of the CD bands for unstructured oligonucleotides rich in cytosine base, i.e., a positive band at 285 nm and a negative band at around 265 nm [36,37]. In the presence of Ag+ ions (red line, Figure 3A), the CD spectrum is radically changed as a result of base–Ag+ interaction, and two intense negative signals appear at 220 nm and 268 nm. Reduction by NaBH4 induces a decreasing intensity of these two negative bands. In the case of the Tel22C12 oligonucleotide (black line, Figure 3B), which is also rich in guanine bases, the CD spectrum shows a positive band at 290 nm and two negative bands at 267 nm and 240 nm. The addition of AgNO3 causes a large decrease in the intensity of the band at 290 nm with its simultaneous shift to 295 nm, and two intense negative bands are visible at 220 nm and 268 nm (red line, Figure 3B). The main difference between the CD spectra of C12-Ag+ and Tel22C12-Ag+ systems is the presence of a positive band at approximately 290 nm for Tel22C12, which may indicate the formation of a G-quadruplex stabilized with silver ions.
The effect of silver ion reduction (by NaBH4) is more pronounced for Tel22C12-AgNCs than for C12-AgNCs. There is a decrease in the intensity of negative CD signals with a simultaneous shift of one of them from 220 to 236 nm, and the positive band at 290 nm (attributed to G-quadruplex structure) is still present. It can be observed that within an hour after the reduction of Ag+ ions by sodium borohydride, the formed DNA-AgNCs are transformed, which is manifested by changes in the CD spectrum. Regarding the stability of the CD spectra over time, it can be observed that with increasing incubation time from 1 h to 48 h, there is a slight increase in the intensity of the CD signals obtained directly as a result of reduction by NaBH4.

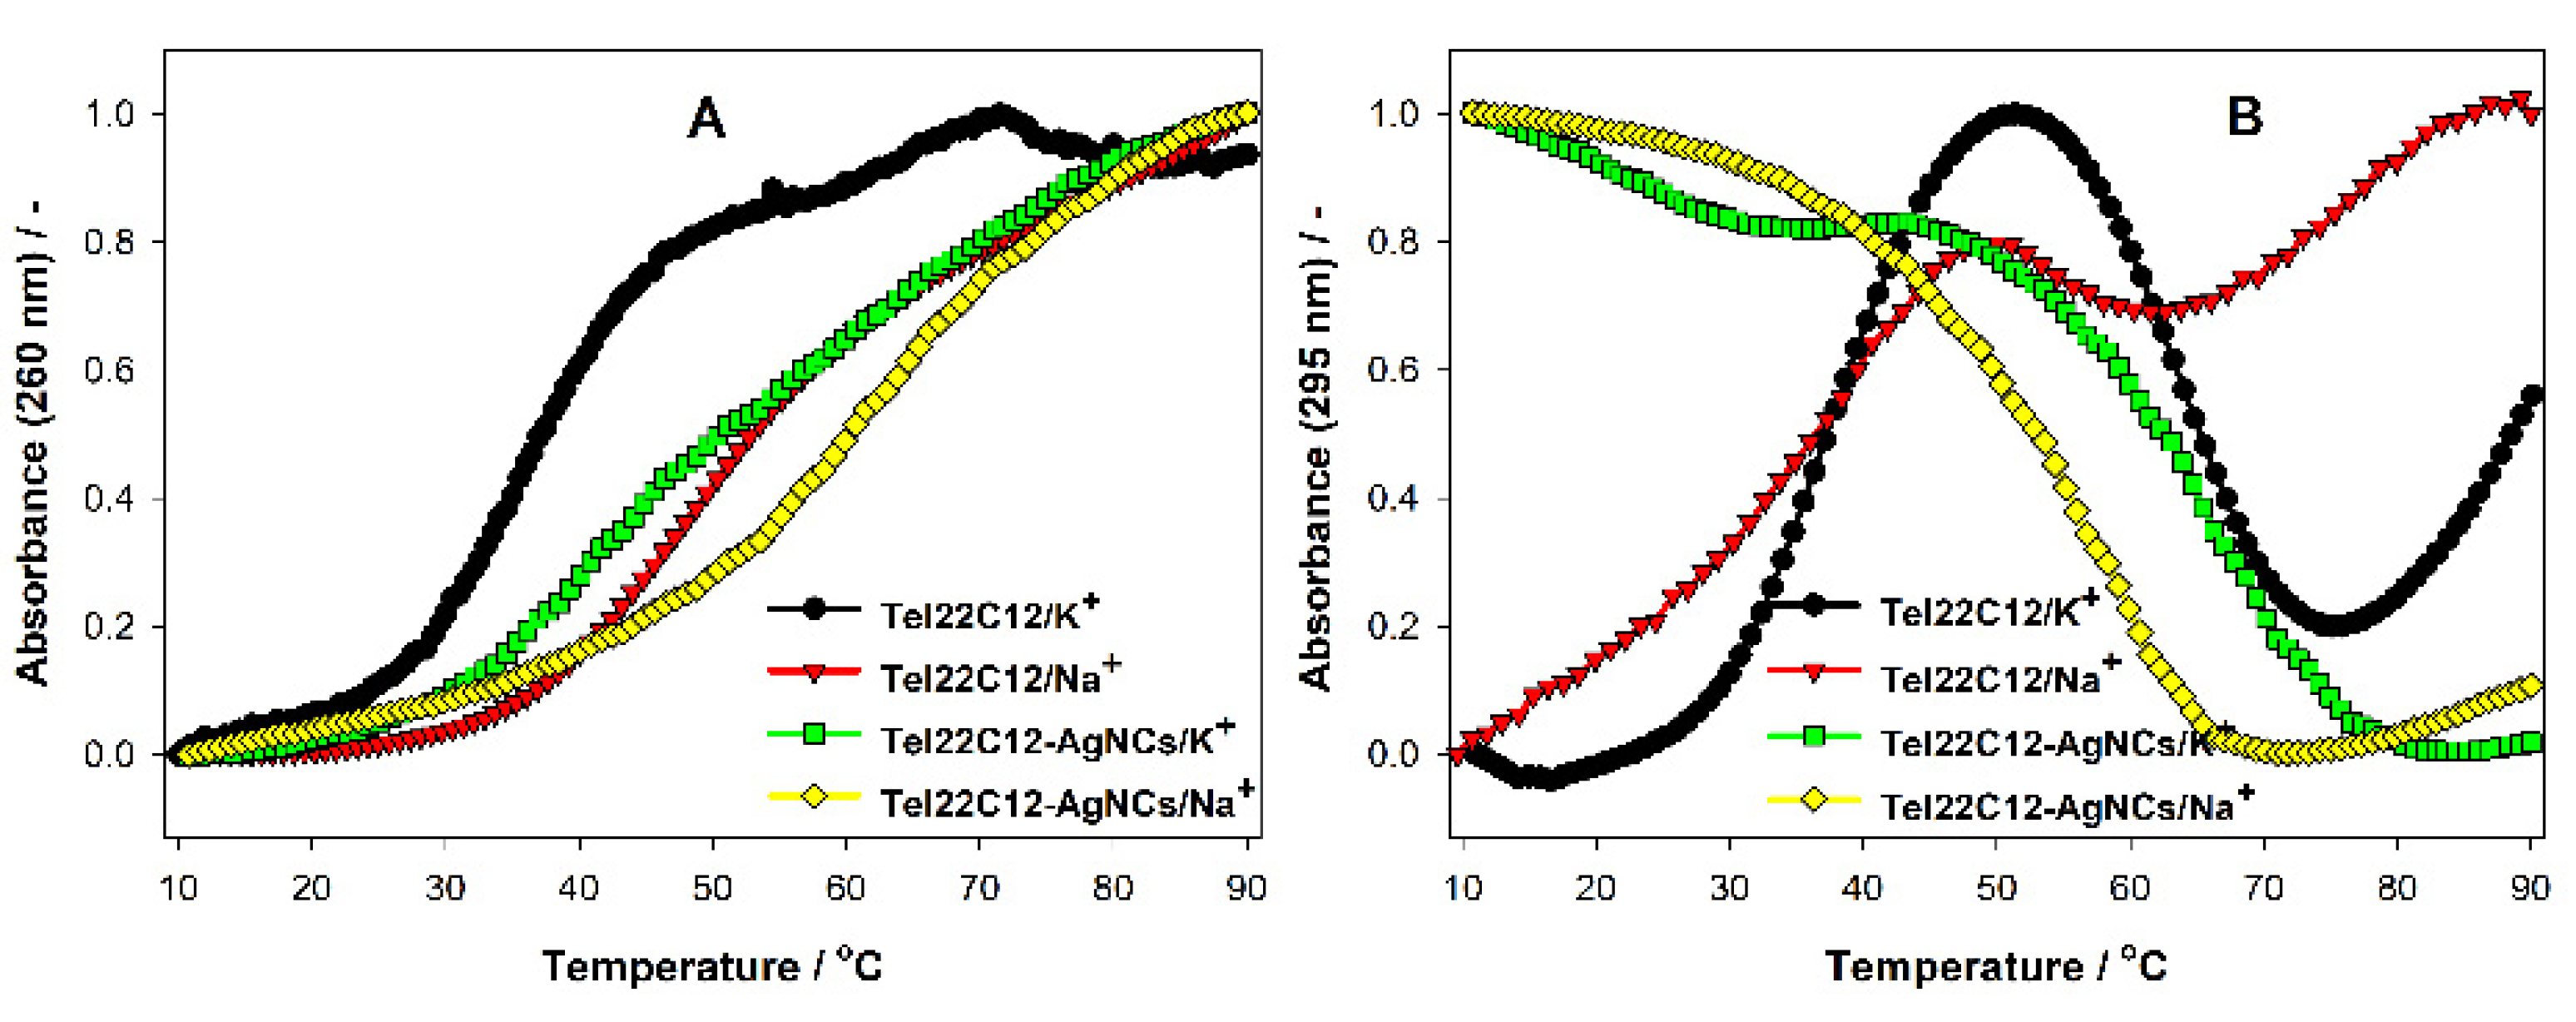
3.4. Thermodynamic Stability of GQ Integrated with C12 Scaffold for AgNCs

The G-quadruplex structures, despite lower binding constants, also provide a well-defined matrix for the formation of silver nanoclusters [7]. In our case, we focus on studies on the effect of the formed AgNCs on melting temperature Tm of the Tel22-GQ DNA quadruplex or TBA-GQ DNA. The literature melting temperatures of TBA in the presence of Na+ and K+ are 24.0 °C and 53.0 °C, respectively [38,39]. The literature Tm for an oligonucleotide based on a 22-mer human telomeric DNA sequence (Tel22) in the presence of K+ and Na+ ions is equal to 62.0 °C and 55.0 °C, respectively [40]. Thermal stability and kinetics of G-quadruplex folding for Tel22C12-AgNCs nanoclusters and TBAC12-AgNCs nanoclusters synthesized in the presence of K+ (100 mM) or Na+ (100 mM) ions were evaluated using denaturation profiles recorded with absorbance at 295 nm as well as at 260 nm. Temperatures at half transition (Tm) for all probes in the presence of K+ and Na+ ions can be found in Table 2. As an example, Figure 4 shows the normalized denaturation profiles for G-quadruplexes formed by the Tel22C12 oligonucleotide in the presence of K+ and Na+ ions and GQ DNA/K+ and GQ DNA/Na+ formed on Tel22C12-AgNCs nanoclusters recorded at 260 nm (Figure 4A) and 295 nm (Figure 4B).
The denaturation profiles monitored at λ = 260 nm were difficult to interpret, because in this spectral range hyperchromic effects were observed for duplex as well as for GQ DNA structure denaturation. The monotonically increasing absorbance suggests that dsDNA and G4 DNA forms may coexist in the studied system (Figure 4A). The melting profiles determined at the diagnostic wavelength for G-quadruplexes (295 nm) allow the determination of two Tm values for Tel22C12/K+ (37.5 °C and 65.0 °C). The lower Tm (37.5 °C) could be interpreted as a result of an interaction between the Tel22 guanine base rich sequence and the C12 cytosine base rich fragment, which probably formed an incomplete duplex. In contrast, a melting point of 65.0 °C suggests that the additional C12 sequence stabilizes the GQ DNA structure by ~3 °C. Studies involving Na+ ions confirm the concept of incomplete duplex with Tm = 36.0 °C and G-quadruplex with Tm = 55.0 °C. The latter value practically does not differ from Tm Tel22/Na+ (55.0 °C).
Table 2 shows the Tm values determined for GQ quadruplexes in the presence and absence of silver nanoclusters templated on DNA in solutions containing different cations. The melting temperatures of the four-stranded GQ DNA structures determined in the presence of the formed AgNCs structures practically do not differ from the Tm for Tel22C12-GQ DNA in both cases (with K+ or Na+) but for TBAC12-GQ DNA only in the presence of K+. What is interesting is that the folding GQ structure by TBAC12 in the presence of Na+ was not observed, whereas the TBA fragment folded into an even more stable GQ after formation TBAC12-AgNCs than free TBA in the presence of 100 mM NaCl (Figure S7). The complexity of TBAC12/Na+ and TBAC12-AgNCs/Na+ systems is not clear for us. It is worth noting that for Tel22C12 as well as TBAC12 oligonucleotides, after serving as template for AgNCs, only Tm for GQ DNA is observed, since the DNA segment rich in cytosine bases (C12) is fully involved in the stabilization of silver nanoclusters and is not able to interact with guanine-rich oligonucleotide (Tel22 or TBA).

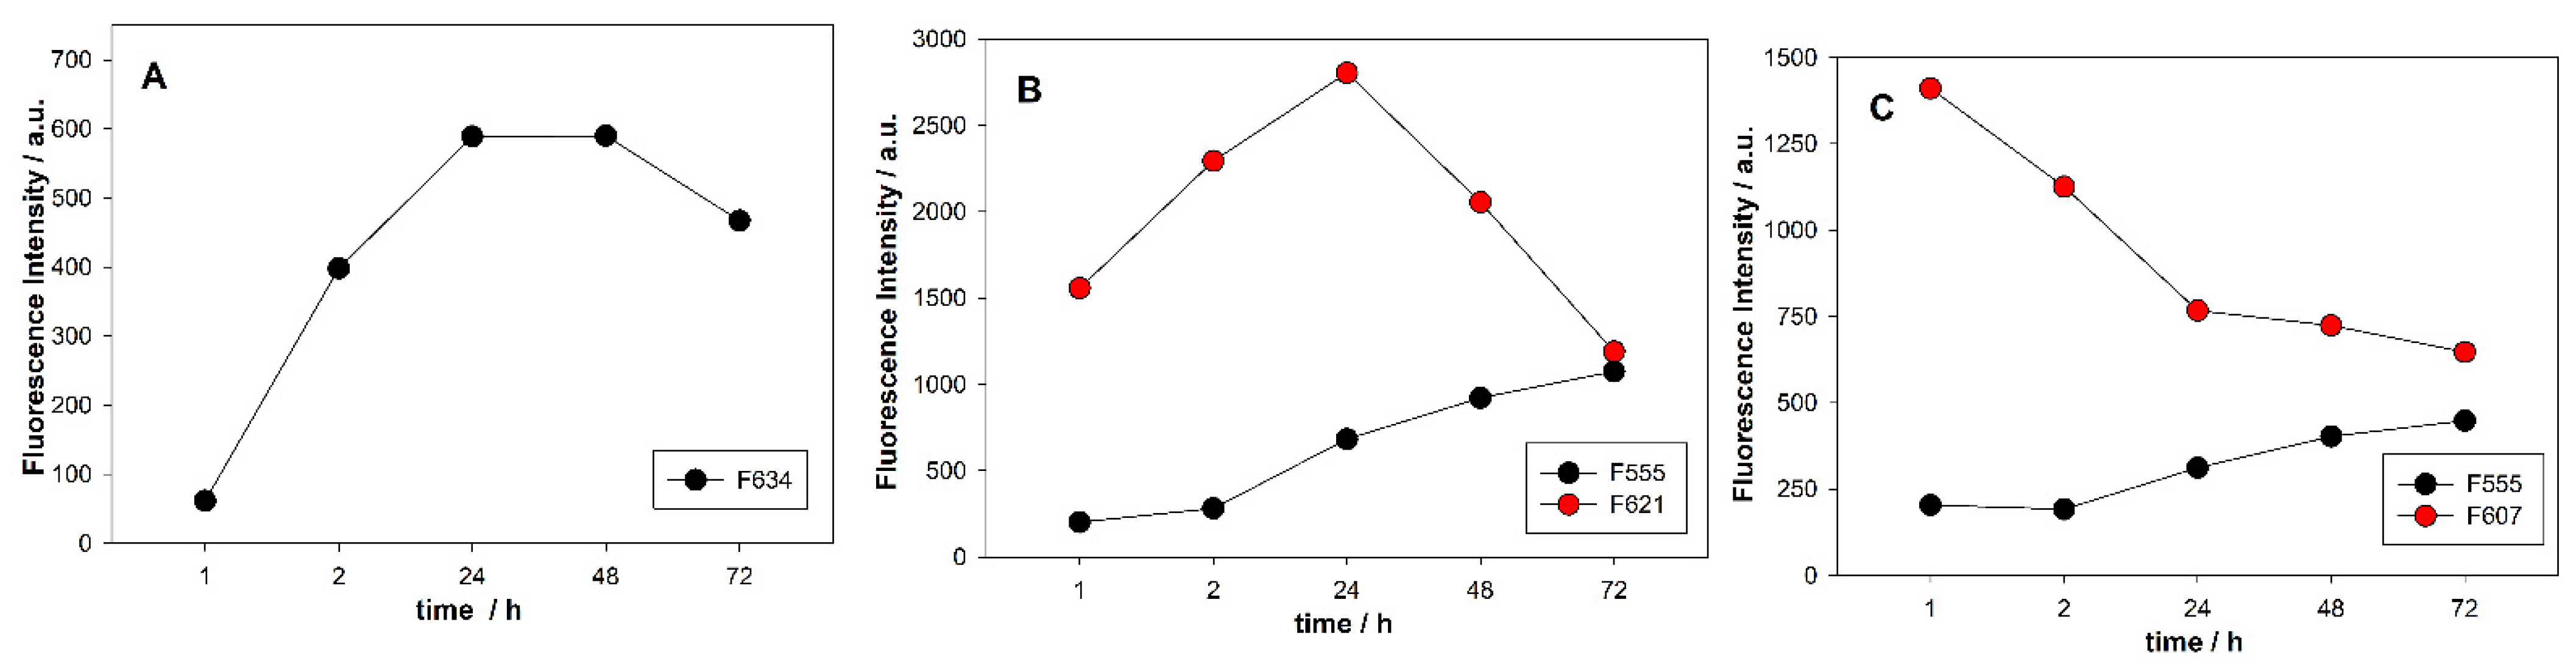
3.5. Temporal Stability of Fluorescent AgNCs Templated on C12 Integrated with GQ

One of the most important properties of DNA-AgNCs is their good spectral stability over a relatively long time. This is essential for the use of AgNCs as fluorescent labels, e.g., in bioimaging [12,41]. The emission spectra of silver nanoclusters as well as absorption spectra, are complex and change over time, as shown earlier.
The full fluorescence spectra recorded from 1 h to 1 week after NaBH4 reduction for the tested systems are shown in Figures S8–S12. Figure 5 shows the dependence of the intensity of the emission bands in their maximum as a function of time for C12-AgNCs (Figure 5A), Tel22C12-AgNCs (Figure 5B) and TBAC12-AgNCs (Figure 5C), respectively. For C12-AgNCs nanoclusters, fluorescence reached its maximum at λmax = 634 nm after 24 h from the addition of NaBH4 and remained at a similar level for the next 24 h (Figure 5A). In the case of Tel22C12-AgNCs and TBAC12-AgNCs nanoclusters, the situation is more complicated because two emission bands have to be analyzed. For Tel22C12-agNCs, the highest value of fluorescence intensity at λmax = 621 nm (λex = 570 nm) (red circles, Figure 5B) was obtained after 24 h from the reduction, then it rapidly decreased, whereas the band with λmax = 555 nm (black circles, Figure 5B) for this nanosystem shows an inverse relationship in time. The signal with low intensity after 1 h is gradually amplified and reaches its maximum value after 72 h from reduction. In the case of TBAC12-AgNCs, the highest value of red emission was obtained after 1 h from reduction; however, it was gradually decreasing in time contrary to green emission, which slightly increased in time. Studies of the temporal stability of the fluorescence spectra indicate that fluorescence intensity gradually increases and reaches its maximum after 24 h from reduction by NaBH4 in the case of C12-AgNCs and Tel22C12-AgNCs.

3.6. Effect of Potassium and Sodium Ions on AgNCs Templated on C12 Integrated with GQ

Knowing that G-quadruplexes have a high affinity for alkali metal ions, especially for K+ ions, it is therefore expected that competing potassium ions will modulate the fluorescence of AgNCs. Figure 6 and Figure 7 show the effect of K+ (upper panels) and Na+ ions (lower panels) on the emission spectra of Tel22C12-AgNCs and TBAC12-AgNCs, which were recorded at two different excitation wavelengths (470 nm and 560 or 570 nm). Upon excitation of Tel22C12-AgNCs at λex = 470 nm, green fluorescence is active with a maximum of λem = 560 nm. Changing the excitation wavelength to 570 nm causes red emission with λem = 620 nm to become active.
Subsequent additions of K+ ions cause a gradual decrease in the Tel22C12-AgNCs fluorescence signal regardless of the excitation wavelength used. For both emission bands (λem = 560 nm and λem = 620 nm), fluorescence intensity drops sharply with increasing concentrations of K+ from 1 to 10 mM and much slower in the range of higher K+ concentrations (10–150 mM) (Figure 6A,B). On the other hand, the additions of Na+ ions cause less radical changes in Tel22C12-AgNCs fluorescence (Figure 6C,D).
In the 1–50 mM Na+ range, slight and non-linear changes in the red fluorescence intensity of Tel22C12-AgNCs and a sharp decrease in red emission in the presence of 100–150 mM Na+ were observed (Figure 6C,D). In the case of the TBAC12-AgNCs system, the influence of K+ and Na+ ions on its emission is comparable. In both cases, we observed decreasing fluorescence intensity at 617 nm when increasing the metal ion concentration in the 1–50 mM range. However, by analyzing the long-wave emission spectra (λem = 617 nm) of TBAC12-AgNCs in the presence of alkali metal ions, there is a blue shift of maximum in the presence of 100–150 mM K+ or Na+ ions (Figure 7A,C), which suggest the clear redistribution of AgNCs on TBAC12 template. On the contrary, the green emission band (λem = 551 nm) of TBAC12-AgNCs indicates a slight enhancement in the presence of alkali metal ions (black dots in Figure 7B,D).
In the experiments aimed at studying the effect of cations, the additions of KCl and NaCl salts were used; however, it is known that Cl ions can interact with Ag+ cations to form an AgCl precipitate with very low solubility in water (Ιr = 1.8 × 10⁻¹⁰) or they can adsorb on silver nanoclusters. In order to check whether the type of salt counter-ion reduces the fluorescence of Tel22C12-AgNCs, additional measurements were carried out with the use of KNO3 salt. Tel22C12-AgNCs emission was quenched by K+ ions coming from KNO3 salt. It turned out that the type of salt counter-ion did not affect the efficiency of this process, as the obtained F620 vs. Cl/NO3 profiles practically overlap (Figure S13).
The quenching properties of K+ and Na+ ions were also verified by measuring the absorption spectra recorded under analogous experimental conditions. The effect of K+ ions is shown in Figures S14a and S15a, and the effect of Na+ is shown in Figures S14b and S15b for Tel22C12-AgNCs and TBAC12-AgNCs, respectively. It can be observed that both cations cause a decrease in the absorption bands below 500 nm and practically quench the absorption at 580 nm in the presence of 100 mM salt. The strong quenching of the absorbance at 580 nm suggests that the decrease in AgNCs fluorescence at 620 nm upon addition of K+ (or Na+) ions is mainly due to the disappearance of the electronic transition at this wavelength.
Circular dichroism spectra should confirm the formation of the K+/G-quadruplex complex in the DNA-AgNCs system as a result of the addition of K+ (or Na+) ions. Figure S16 show the CD spectra of the Tel22C12-AgNCs system in the presence of increasing concentrations of KCl and NaCl. The synthesis of silver nanoclusters on the Tel22C12 results in DNA-AgNCs possessing a CD spectrum with a positive signal at 290 nm and two negative signals at 265 nm and 240 nm. Contrary to expectations, the gradual addition of K+ or Na+ ions in the concentration range of 1–150 mM has no significant effect on the band pattern in CD spectra. The analogous results were obtained for the CD spectra of TBAC12-AgNCs system in the presence of increasing concentrations of KCl and NaCl, as shown in Figure S17.
These results suggest that both DNA-AgNCs systems probably contain Ag(I)/G-quadruplex complexes, which are transformed into a GQ form stabilized by potassium or sodium ions, but this process does not cause significant changes in the CD band characteristic of GQ DNA at approximately 290 nm.

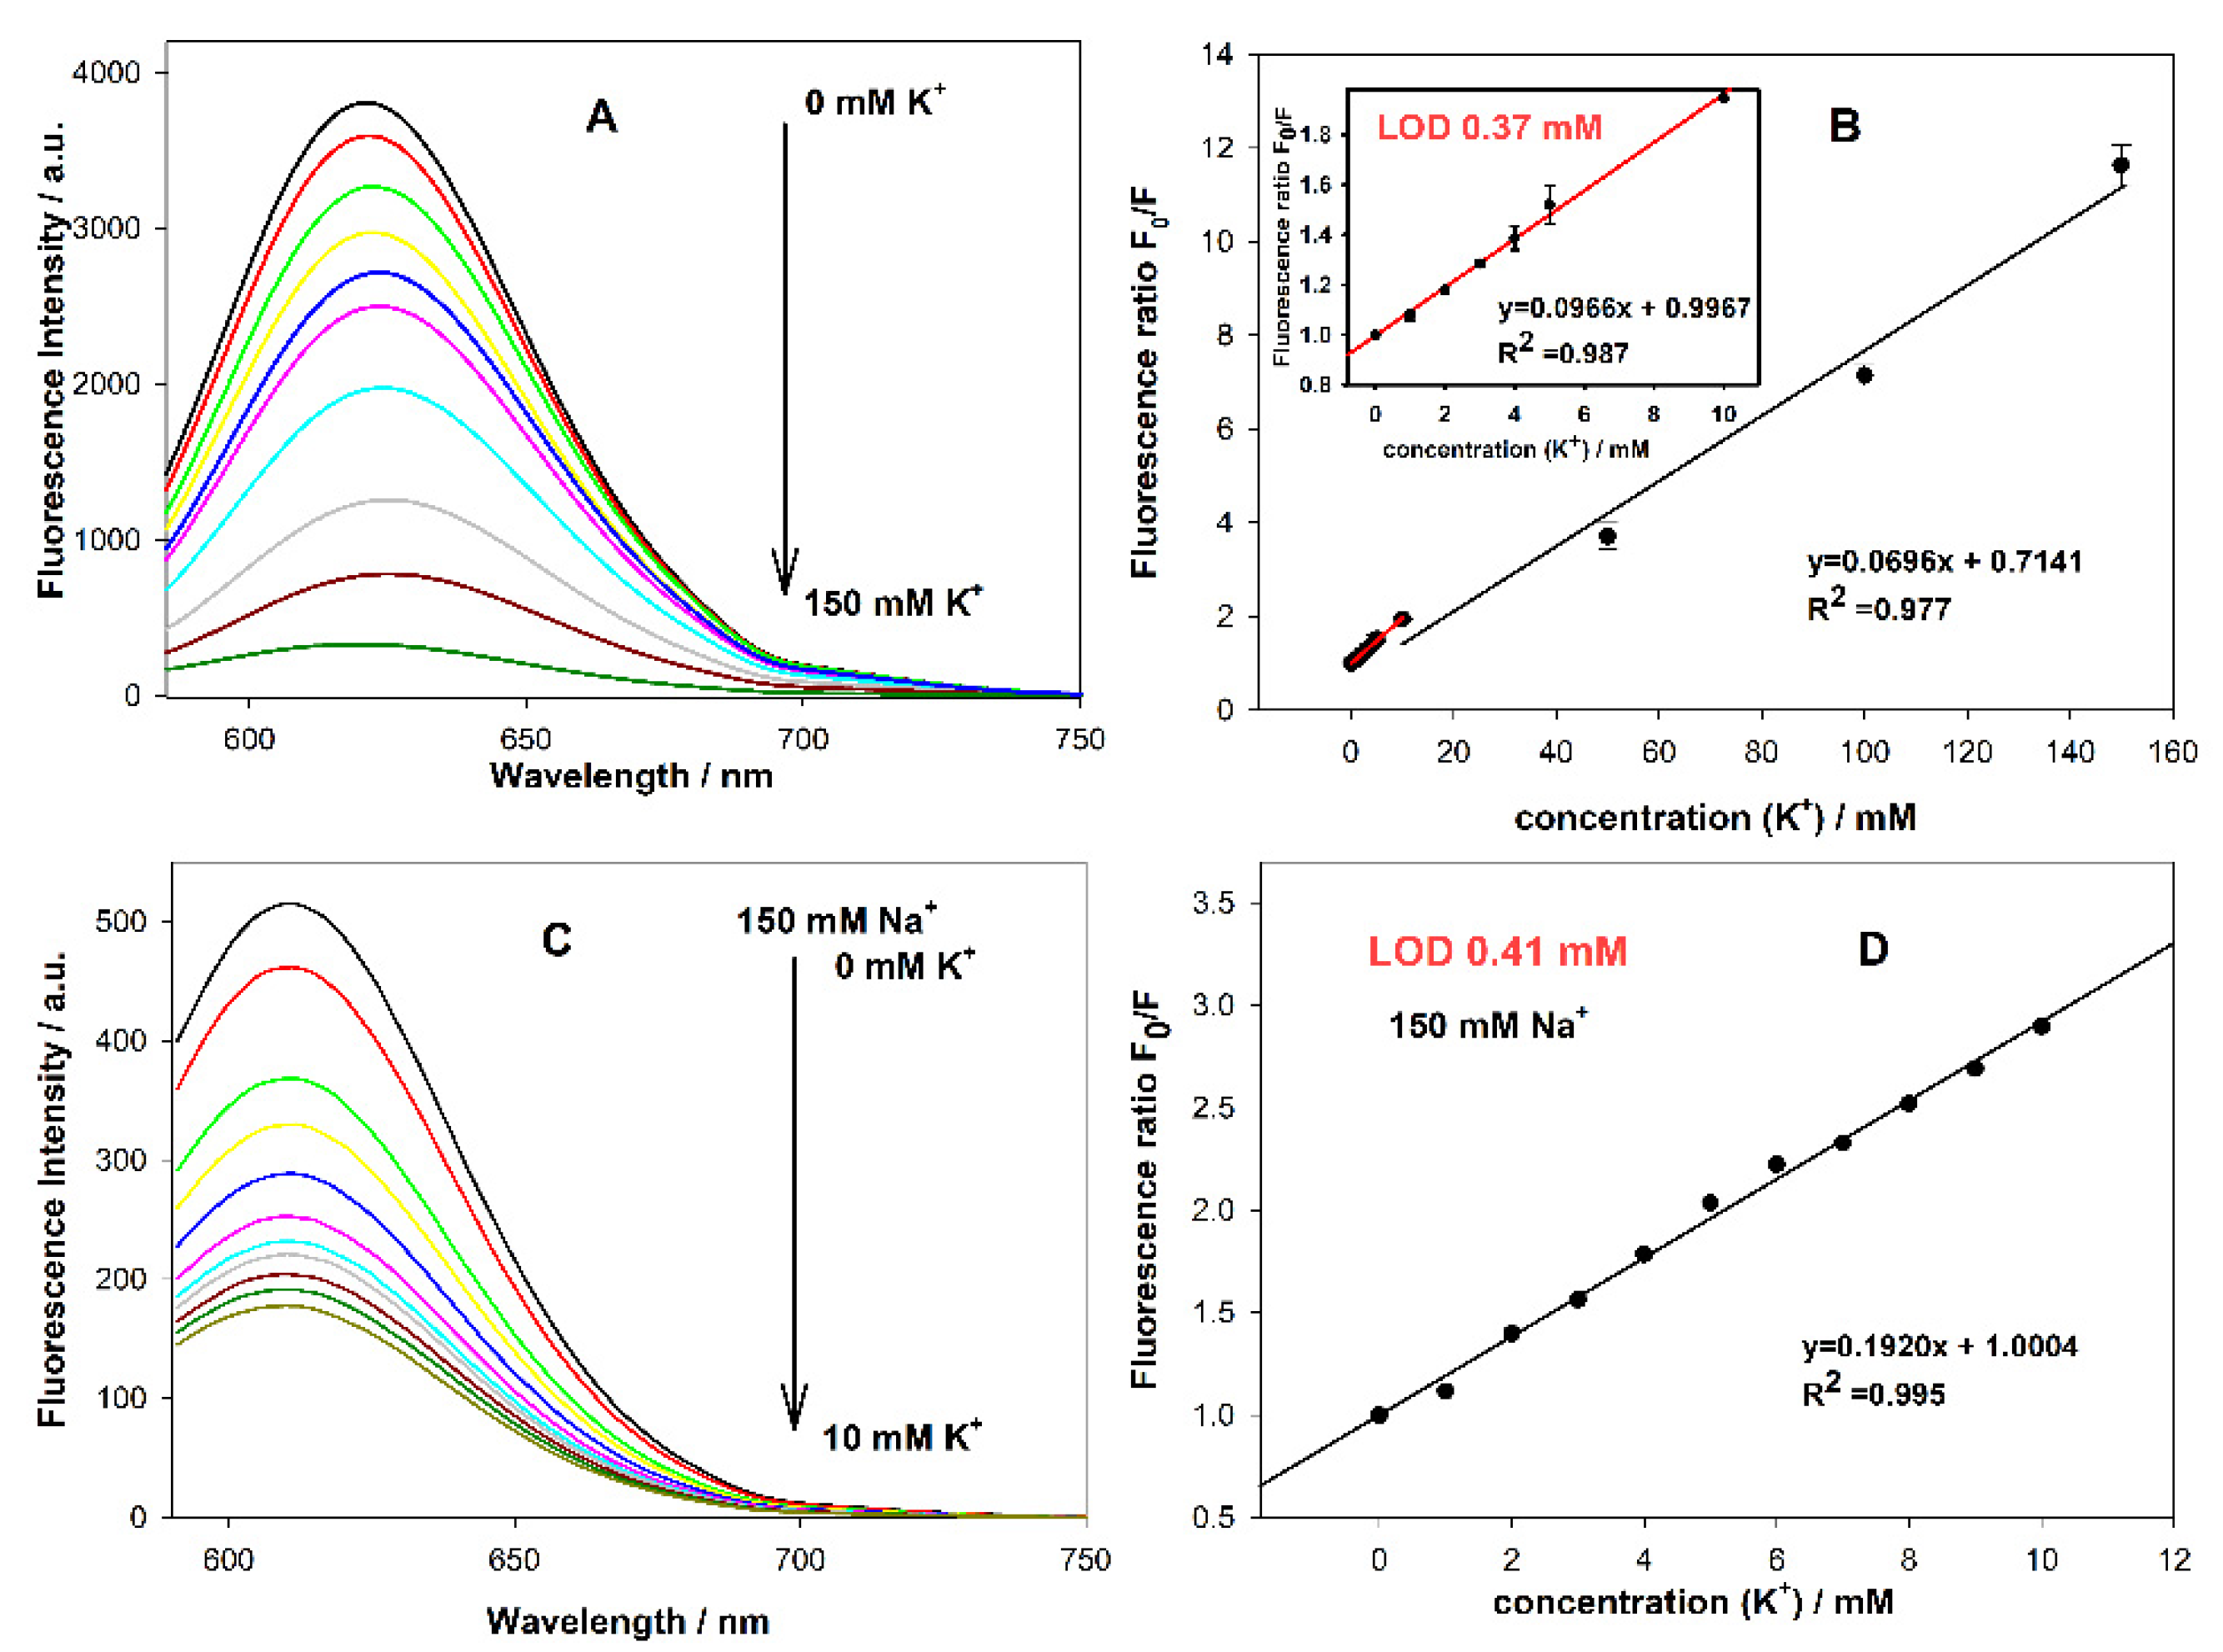
3.7. Feasibility of Proposed Systems to Detect K+ Ions

The studies on the effect of potassium and sodium cations on spectral properties of Tel22C12 and TBAC12 helped us to select the potentially better sensors in terms of sensitivity and selectivity towards potassium ions. Thus, the feasibility of the proposed system to detect K+ ions in extracellular conditions was further evaluated for Tel22C12-AgNCs. First, in order to assess the analytical parameters of the K+ ion detection system, the Tel22C12-AgNCs probe response (fluorescence intensity) was tested at different concentrations of the analyte (K+ ions) in the concentration range of 0–150 mM at λem = 620 nm (λex = 570 nm). As shown in Figure 8A, fluorescence intensity gradually decreases with increasing K+ ion concentrations. Based on emission spectra, we constructed the Stern–Volmer plot, which illustrates the quenching effect of K+ ions on the emission of Tel22C12-AgNCs (Figure 8B, where F0 means fluorescence intensity of Tel22C12-AgNCs without K+ ions and F—fluorescence intensity after addition of potassium ions). A good linear relationship of Tel22C12-AgNCs fluorescence with K+ concentration was observed over the entire tested range from 1 to 10 mM (R2 = 0.987) and from 10 to 150 mM K+ (R2 = 0.977) and the limit of detection (LOD) was calculated—0.37 mM.
These parameters indicate the potential usefulness of the developed probe Tel22C12-AgNCs for measuring and monitoring the gradient of potassium ions in cell systems; however, for the sensor to be useful to monitor K+ levels in extracellular conditions, it is essential to distinguish small variations in K+ concentration in the presence of 150 mM Na+ concentration. Therefore, we added 150 mM NaCl to the Tel22C12-AgNCs prepared 24 h earlier in buffer without metal cations. Next, we measured the changes in the fluorescence spectra of Tel22C12-AgNCs in the presence of 150 mM Na+ upon titration with K+ ions in the 1–10 mM concentration range (as shown in Figure 8C). As stated previously, the Stern–Volmer curve was plotted using ratio of F0/F versus potassium concentration, where F0 was fluorescence intensity of Tel22C12-AgNCs in the presence of 150 mM NaCl, and F was the fluorescence intensity after the addition of potassium ions under the same conditions. As shown in Figure 8D, the linear range of the analytical response of Tel22C12-AgNCs ranges from 1 to 10 mM K+ concentration (R2 0.995) with LOD established at 0.4 mM and a sensitivity of 0.19 mM−1. In the literature, potassium probes with detection limit below 1 μM and even equal to 2.37 pM can be found ([42] and cited herein). For us, it is important that the Tel22C12-AgNCs probe shows a linear working range for K+ detection from 1 to 10 mM (with LOD 0.4 mM) in the presence of 150 mM Na+, which covers a clinically important concentration region of K+ (3.5 to 5.5 mM) under extracellular conditions [43].

4. Discussion

DNA-AgNCs silver nanoclusters were synthesized on single-stranded DNA templates with two integrated domains: cytosine-rich DNA template (C12) attached to 3’ end of G-quadruplex forming sequence. For our purposes, we used human telomeric-related sequence and TBA sequence, both of which are widely explored to compose potassium sensing probes. First, the formation of nanoclusters during the reduction step was evident due to the appearance of a yellow color as the main distinguishing feature of silver nanoclusters in the presence of an intense narrow band at a wavelength of approximately 440 nm [30]. On the other hand, the absorption spectra of dark silver nanoparticles (˃10 nm) show only one wide peak at λmax = 405 nm. As expected, in the case of examined silver nanoclusters, an intense narrow band was observed at approximately 440 nm, and a few others bands were also observed: at 350 nm, 500 nm and 650 nm for C12-AgNCs (or at 355 nm and 590 nm for Tel22C12-AgNCs as well as 355 nm and 520 nm for TBAC12-AgNCs). These bands are considered to be an indicator of the formation of AgNCs nanoclusters. The intensity of bands changes over time, which indicates the presence of the several types of AgNCs that differ in size/shape and number of silver atoms. These conclusions were supported by TEM images. The amount of AgNO3 used for the synthesis of silver nanoclusters affects the absorption spectra as well as CD and emission spectra. In the latter one, the excitation at 260 nm reveals that red emission was observed and dominant at least 1 h from the reduction step. However, the overall emission was higher in the case of Tel22C12-AgNCs as well as TBAC12-AgNCs obtained at a ratio of 1:1 (Ag+/C) in comparison with nanoclusters obtained at a ratio of 1:1 (Ag+/CG). Moreover, it should be noted that the fluorescence comes from the formed nanoclusters and not from the DNA-Ag+ complexes, as evidenced by the lack of emission in the solutions without NaBH4 reduction agent.
In order to investigate the conformational changes in the Tel22C12-AgNCs or TBAC12-AgNCs systems and in reference C12-AgNCs, CD spectra of the oligonucleotides were measured. The main difference between the CD spectra of these systems and reference is the presence of a positive band at approximately 290 nm for Tel22C12 and TBAC12, which may indicate the formation of a G-quadruplex stabilized with silver ions. Moreover, the lack of changes in CD spectra after further addition of KCl (or NaCl) to Tel22C12-AgNCs or TBAC12-AgNCs solutions suggests that the displacement of silver ions from the GQ complex by K+ (or Na+) may have occurred. On the other hand, the performed studies on the stability of G-quadruplexes created by the Tel22C12 or TBAC12 oligonucleotide prior to the formation silver nanoclusters informed that the formed AgNCs had no destabilizing effect on the studied GQ DNA structures.
Taking into account the possible application of our systems (Tel22C12-AgNCs and TBAC12-AgNCs) as fluorescent probes for monitoring potassium ions in extracellular conditions, we focused on investigating their fluorescent properties without and in the presence of K+ or/and Na+ cations. As we mentioned, the obtained fluorescence spectra indicate that the emission wavelength of DNA-AgNCs nanoclusters synthesized in aqueous solutions is strongly dependent on the sequence of DNA oligonucleotides, which is also confirmed by the literature data [44]. The both studied systems emit stronger fluorescence in comparison with silver nanoclusters templated on reference C12 oligonucleotide. It was found that a matrix based on intramolecular G-quadruplexes with anti-parallel topology results in AgNCs with higher fluorescence efficiency compared to GQ DNA with parallel and hybrid topology. The loops connecting G-tetrads also influence the photoemission properties of AgNCs; thus, the best effect was obtained when the loops were rich in adenine bases, not thymine, which is consistent with their Ag+ binding affinity. The K+-stabilized human telomeric GQ DNA has a hybrid structure with two lateral loops and one sidewise loop [16,17], whereas sodium-stabilized antiparallel basket-type human telomeric G-quadruplex structure possesses one diagonal and two lateral loops [18]. The potassium-stabilized anti-parallel chair-type TBA GQ structure consists of two G-tetrads linked by an edge-wise loop and two lateral loops [20]. However, in our case, the overall fluorescence of Tel22C12-AgNCs is stronger than that of TBAC12-AgNCs. These results suggest the predominant role of the C-rich domain, attached to the 3’ terminus of TBA or Tel22, in the formation of fluorescent silver nanoclusters.
The N (3) positions of the cytosine and the N (7) guanine are usually involved in silver interactions with DNA bases [2,5,45]. For G-quadruplex structures, Ag ions compete for guanine N (7) sites because these positions are also involved in the bond formation of Hoogsteen-type hydrogen in the G-quartet [3]. Taking into account that GQs have a high affinity for alkali metal ions, the effect of potassium and sodium ions was studied. The most pronounced quenching effect of K+ or Na+ ions was observed on red emission (with a maximum above 600 nm for Tel22-related or TBA-related probes). In the case of green emission emitted by TBAC12-AgNCs, we observed a slight increase in fluorescence upon metal ion addition. In the case of Tel22C12-AgNCs, the influences of Na+ ions on the emission bands are less visible compared to the effect of potassium ions. It is known that Na+ ions also stabilize four-stranded structures; however, the stability constant of the GQ-DNA-Na+ complex is much lower than that of the potassium quadruplex. The observed quenching effects may be explained by the process of creating K+ or Na+/G-quadruplex complexes by Tel22 or TBA strands. Pre-generated AgNCs are stabilized not only by interaction with the cytosines in C12 but also by the guanines in the Tel22 or TBA fragment. The competitive formation of the G-quadruplex, in the presence of K+ or Na+ ions, reduces the stabilizing effect of guanines, which is manifested by the quenching of AgNCs fluorescence. This assumption is consistent with the affinity of potassium and sodium ions for GQ DNA and with the comparable fluorescence intensity values for C12-AgNCs and Tel22C12-AgNCs or TBAC12-AgNCs in the presence of 150 mM KCl.
Although the red fluorescence emission of both systems (Tel22C12-AgNCs or TBAC12-AgNCs) was quenched by sodium or potassium ions, only in the case of Tel22C12-AgNCs were the observed changes clearly regular. Thus, the gradual decrease in Tel22C12-AgNCs fluorescence as well as a good linear relationship between quenching efficiency and K+ concentration in the range of 1–150 mM encouraged us to check the feasibility of this system in order to detect changes in K+ concentration in the access of Na+ ions. In the presence of 150 mM NaCl, we obtained a Stern–Volmer plot with linear behavior in the range from 1 to10 mM K+ (R2 = 0.995) and with an LOD value established at 0.4 mM. These results clearly indicate that Tel22C12-AgNCs exhibit the potential to monitor transmembrane potassium transfer. One should remember that the intracellular potassium concentration is approximately forty-fold greater than the extracellular concentration, and any maneuver that would result in the release of a small amount of intracellular potassium will erroneously raise serum potassium. The normal range for serum potassium is narrow (3.5 to 5.5 mM), and a minor departure from this range (by less than 1.0 mM) is associated with significant morbidity and mortality [43].

5. Conclusions

Dual-emitting clusters of Ag atoms can be successfully obtained on a bifunctional oligonucleotide consisting of cytosine-rich DNA template (C12) attached to 3’ end of G-quadruplex forming sequence. Our studies indicate that the competitive formation of G-quadruplex structure as a result of the complexation of potassium or sodium ions has a significant impact on the emission properties of silver nanoclusters. The proper choice of G-quadruplex forming sequence makes it possible to obtain a silver nanocluster system that not only shows a higher binding preference for K+ over Na+ but also is able to monitor small changes in K+ concentration in the extracellular conditions (high content of Na+ ions). In our case, Tel22C12-AgNCs including the human telomeric sequence known to form GQ exhibit the potential to monitor transmembrane potassium transfer. The limit of detection for the Tel22C12-AgNCs K+ sensor is at a value of 4.0 × 10⁻⁴, with the linear range between 1.0 × 10⁻³ and 1.0 × 10⁻² M in the 1.5 × 10⁻¹ M solution of Na+ ions. The further integration Tel22C12-AgNCs with a cholesterol moiety is planned in order to create a new sensing probe with the ability to anchor to the living cell membrane and, as a consequence, to serve as bioimaging tool for the visualization of transmembrane transport of K+ cation.

Supplementary Materials

The following are available online at https://0-www-mdpi-com.brum.beds.ac.uk/article/10.3390/chemosensors9120349/s1, Figure S1: Absorption spectra of C12-AgNCs with cytosine to Ag+ ratio 1:0.5 (a), 1:1 (b) and 1:2 (c) (Ag+/C). Changes in time of absorbance value at λ=440 nm (d); Figure S2: Absorption spectra of Tel22C12-AgNCs with cytosine to Ag+ ratio 1:1 (Ag+/C) (a) or cytosine and guanine to Ag+ ratio 1:1 (Ag+/CG) (b); Figure S3: Absorption spectra of TBAC12-AgNCs with cytosine to Ag+ ratio 1:1 (Ag+/C) (a) or cytosine and guanine to Ag+ ratio 1:1 (Ag+/CG) (b); Figure S4: Circular dichroism spectra of Tel22C12-AgNCs with cytosine to Ag+ ratio 1:1 (Ag+/C) (a) or cytosine and guanine to Ag+ ratio 1:1 (Ag+/CG) (b); Figure S5: Circular dichroism spectra of TBAC12-AgNCs with cytosine to Ag+ ratio 1:1 (Ag+/C) (a) or cytosine and guanine to Ag+ ratio 1:1 (Ag+/CG) (b); Figure S6: Transmission electron microscopy (TEM) images of the nanoclusters C12-AgNCs (A,B) and Tel22C12-AgNCs (C,D). Scale bar 10 nm (A,C), 2 nm (B,D); Figure S7: UV melting profiles of TBAC12 and TBAC12-AgNCs (2µM) in 10 mM Tris-acetate buffer (pH= 7.5) containing 100 mM NaCl or 100 mM KCl; monitored at 260 nm (a) or 295 nm (b); Figure S8: Excitation spectra at λem=630 nm (a) and emission spectra at λex=580 nm (b) of C12-AgNCs with cytosine to Ag+ ratio 1:1(Ag+/C); Figure S9: Excitation spectra at λem=550 nm (a) and emission spectra at λex=470 nm (b) of Tel22C12-AgNCs with cytosine to Ag+ ratio 1:1 (Ag+/C); Figure S10: Excitation spectra at λem=620 nm (a) and emission spectra at λex=570 nm (b) of Tel22C12-AgNCs with cytosine to Ag+ ratio 1:1 (Ag+/C); Figure S11: Excitation spectra at λem=550 nm (a) and emission spectra at λex=470 nm (b) of TBAC12-AgNCs with cytosine to Ag+ ratio 1:1 (Ag+/C); Figure S12: Excitation spectra at λem=610 nm (a) and emission spectra at λex=560 nm (b) of TBAC12-AgNCs with cytosine to Ag+ ratio 1:1 (Ag+/C); Figure S13: Influence of K+ ions on red emission spectra of TelC22-AgNCs upon addition of KCl or KNO3; Figure S14: Absorption spectra of Tel22C12-AgNCs with cytosine to Ag+ ratio 1:1 (Ag+/C) upon titration with KCl (a) and NaCl (b); Figure S15: Absorption spectra of TBAC12-AgNCs with cytosine to Ag+ ratio 1:1 (Ag+/C) upon titration with KCl (a) and NaCl (b); Figure S16: Circular dichroism spectra of Tel22C12-AgNCs with cytosine to Ag+ ratio 1:1 (Ag+/C) upon titration with KCl (a) and NaCl (b); Figure S17: Circular dichroism spectra of TBAC12-AgNCs with cytosine to Ag+ ratio 1:1 (Ag+/C) upon titration with KCl (a) and NaCl (b).

Author Contributions

A.Ś. and A.D. conceived and designed the study. A.Ś. and P.F. carried out the experiments and processed data. G.N. took TEM images. All authors analyzed the data. A.D. wrote the manuscript. P.F., J.K. and A.D. revised manuscript, which was edited by A.D., A.Ś. and P.F. All authors have read and agreed to the published version of the manuscript.

Funding

This research was financially supported by the National Science Centre of Poland, Grant No. 2015/19/N/ST4/00407. Grzegorz Nowaczyk was supported by a grant No. 41/E-336/SPUB/SP/2019 from the Polish Ministry of Science and Higher Education.

Institutional Review Board Statement

Not applicable.

Informed Consent Statement

Not applicable.

Data Availability Statement

Data are provided in the manuscript.

Acknowledgments

The authors thank Bernard Juskowiak for mentoring and fruitful discussions.

Conflicts of Interest

The authors declare no conflict of interest.

References

  1. Zhang, Q.; Yang, M.; Zhu, Y.; Mao, C. Metallic Nanoclusters for Cancer Imaging and Therapy. Curr. Med. Chem. 2018, 25, 1379–1396. [Google Scholar] [CrossRef] [PubMed]
  2. Ono, A.; Cao, S.; Togashi, H.; Tashiro, M.; Fujimoto, T.; Machinami, T.; Oda, S.; Miyake, Y.; Okamoto, I.; Tanaka, Y. Specific Interactions between Silver (i) Ions and Cytosine–Cytosine Pairs in DNA Duplexes. Chem. Commun. 2008, 39, 4825–4827. [Google Scholar] [CrossRef] [PubMed]
  3. Wu, J.; Fu, Y.; He, Z.; Han, Y.; Zheng, L.; Zhang, J.; Li, W. Growth Mechanisms of Fluorescent Silver Clusters Regulated by Polymorphic DNA Templates: A DFT Study. J. Phys. Chem. B 2012, 116, 1655–1665. [Google Scholar] [CrossRef] [PubMed]
  4. Petty, J.T.; Zheng, J.; Hud, N.V.; Dickson, R.M. DNA-Templated Ag Nanocluster Formation. J. Am. Chem. Soc. 2004, 126, 5207–5212. [Google Scholar] [CrossRef]
  5. Berti, L.; Burley, G.A. Nucleic acid and nucleotide-mediated synthesis of inorganic nanoparticles. Nat. Nanotechnol. 2008, 3, 81–87. [Google Scholar] [CrossRef]
  6. Shukla, S.; Sastry, M. Probing Differential Ag+–Nucleobase Interactions with Isothermal Titration Calorimetry (ITC): Towards Patterned DNA Metallization. Nanoscale 2009, 1, 122–127. [Google Scholar] [CrossRef]
  7. Li, W.; Liu, L.; Fu, Y.; Sun, Y.; Zhang, J.; Zhang, R. Effects of Polymorphic DNA on the Fluorescent Properties of Silver Nanoclusters. Photochem. Photobiol. Sci. 2013, 12, 1864–1872. [Google Scholar] [CrossRef]
  8. Chen, Y.; Phipps, L.M.; Werner, J.H.; Chakraborty, S.; Martinez, J.S. DNA Templated Metal Nanoclusters: From Emergent Properties to Unique Applications. Acc. Chem. Res. 2008, 51, 12756–12763. [Google Scholar] [CrossRef] [PubMed]
  9. New, S.Y.; Lee, S.T.; Su, X.D. DNA-templated silver nanoclusters: Structural correlation and fluorescence modulation. Nanoscale 2016, 8, 17729–17746. [Google Scholar] [CrossRef]
  10. Zhou, Z.; Du, Y.; Dong, S. DNA-Ag nanoclusters as fluorescence probe for turn-on aptamer sensor of small molecules. Biosens. Bioelectron. 2011, 28, 33–37. [Google Scholar] [CrossRef]
  11. Alipour, M.; Jalili, S.; Shirzad, H.; Dezfouli, E.A.; Fouani, M.H.; Sadeghan, A.A.; Bardania, H.; Hosseinkhani, S. Development of dual-emission cluster of Ag atoms for genetically modified organisms detection. Mikrochim. Acta 2020, 187, 628, Erratum in 2020, 187, 662. [Google Scholar] [CrossRef]
  12. Han, G.M.; Jia, Z.Z.; Zhu, Y.J.; Jiao, J.J.; Kong, D.M.; Feng, X.Z. Biostable L-DNA-Templated Aptamer-Silver Nanoclusters for Cell-Type-Specific Imaging at Physiological Temperature. Anal. Chem. 2016, 88, 10800–10804. [Google Scholar] [CrossRef] [PubMed]
  13. Reyes-Reyes, E.M.; Teng, Y.; Bates, P. A new paradigm for aptamer therapeutic AS1411 action: Uptake by macropinocytosis and its stimulation by a nucleolin-dependent mechanism. J. Cancer Res. 2010, 70, 8617–8629. [Google Scholar] [CrossRef] [PubMed] [Green Version]
  14. Soundararajan, S.; Chen, W.; Spicer, E.K.; Courtenay-Luck, N.; Fernandes, D. The nucleolin targeting aptamer AS1411 destabilizes Bcl-2 messenger RNA in human breast cancer cells. J. Cancer Res. 2008, 68, 2358–2365. [Google Scholar] [CrossRef] [PubMed] [Green Version]
  15. Sharma, J.; Yeh, H.-C.; Yoo, H.; Werner, J.H.; Martinez, J.S. DNA Silver nanocluster aptamers: In situ generation of intrinsically fluorescent recognition ligands for protein detection. ChemComm 2011, 47, 2294–2296. [Google Scholar]
  16. Luu, K.N.; Phan, A.T.; Kuryavyi, V.; Lacroix, L.; Patel, D.J. Structure of the human telomere in K⁺ solution: An intramolecular (3+1) G-quadruplex scaffold. J. Am. Chem. Soc. 2006, 128, 9963–9970. [Google Scholar] [CrossRef] [Green Version]
  17. Phan, A.T.; Kuryavyi, V.; Luu, K.N.; Patel, D.J. Structure of two intramolecular G-quadruplexes formed by natural human telomere sequences in K⁺ solution. Nucleic Acids Res. 2007, 35, 6517–6525. [Google Scholar] [CrossRef] [Green Version]
  18. Wang, Y.; Patel, D.J. Solution structure of the human telomeric repeat d[AG(3)(T2AG3)3] G-tetraplex. Structure 1993, 1, 263–282. [Google Scholar] [CrossRef]
  19. Bock, L.C.; Griffin, L.C.; Latham, J.A.; Vermaas, E.H.; Toole, J.J. Selection of single-stranded-DNA molecules that bind and inhibit human thrombin. Nature 1992, 355, 564–566. [Google Scholar] [CrossRef]
  20. Schultze, P.; Macaya, R.F.; Feigon, J. 3-Dimensional solution structure of the thrombin-binding DNA aptamer d (GGTTGGTGTGGTTGG). J. Mol. Biol. 1994, 235, 1532–1547. [Google Scholar] [CrossRef]
  21. Wang, K.Y.; Krawczyk, S.H.; Bischofberger, N.; Swaminathan, S.; Bolton, P.H. The tertiary structure of a DNA aptamer which binds to and inhibits thrombin determines activity. Biochemistry 1993, 32, 11285–11292. [Google Scholar] [CrossRef] [PubMed]
  22. Nagatoishi, S.; Nojima, T.; Juskowiak, B.; Takenaka, S. A Pyrene-labeled G-quadruplex oligonucleotide as a fluorescence probe for potassium ions detection in biological applications. Angew. Chem. 2005, 44, 5067–5070. [Google Scholar] [CrossRef]
  23. He, F.; Tang, Y.; Wang, S.; Li, Y.; Zhu, D. Fluorescent Amplifying Recognition for DNA G-Quadruplex Folding with a Cationic Conjugated Polymer:  A Platform for Homogeneous Potassium Detection. J. Am. Chem. Soc. 2005, 127, 12343–12346. [Google Scholar] [CrossRef] [PubMed]
  24. Nagatoishi, S.; Nojima, T.; Galezowska, E.; Juskowiak, B.; Takenaka, S. G-quadruplex-based FRET probes with the thrombin-binding aptamer (TBA) sequence designed for the efficient fluorometric detection of the potassium ion. ChemBioChem 2006, 7, 1730–1737. [Google Scholar] [CrossRef] [PubMed]
  25. Kong, D.; Guo, J.; Yang, W.; Ma, Y.; Shen, H. Crystal violet-G-quadruplex complexes as fluorescent sensors for homogeneous detection of potassium ion. Biosens. Bioelectron. 2009, 25, 88–93. [Google Scholar] [CrossRef]
  26. Ohtsuka, S.K.; Sato, S.; Sato, Y.; Sota, K.; Ohzawa, S.; Matsuda, T.; Takemoto, K.; Takamune, N.; Juskowiak, B.; Nagaib, T.; et al. Fluorescence imaging of potassium ions in living cells using a fluorescent probe based on a thrombin binding aptamer–peptide conjugate. Chem. Commun. 2012, 48, 4740–4742. [Google Scholar] [CrossRef] [PubMed]
  27. Switalska, A.; Dembska, A.; Fedoruk-Wyszomirska, A.; Juskowiak, B. Cholesterol-Bearing Fluorescent G-Quadruplex Potassium Probes for Anchoring at the Langmuir Monolayer and Cell Membrane. Sensors 2018, 18, 2201–2219. [Google Scholar] [CrossRef] [Green Version]
  28. Takenaka, S. Detection of tetraplex DNA and detection by tetraplex DNA. Anal. Sci. 2021, 37, 9–15. [Google Scholar] [CrossRef]
  29. Tietz, N.W. Fundamentals of Clinical Chemistry; W.B. Saunders Company: Philadelphia, PA, USA, 1976; pp. 875–877. [Google Scholar]
  30. Ritchie, C.M.; Johnsen, K.R.; Kiser, J.R.; Antoku, Y.; Dickson, R.M.; Petty, J.T. Ag Nanocluster Formation Using a Cytosine Oligonucleotide Template. J. Phys. Chem. C 2007, 111, 175–181. [Google Scholar] [CrossRef] [Green Version]
  31. Dembska, A.; Switalska, A.; Fedoruk-Wyszomirska, A.; Juskowiak, B. Development of fluorescence oligonucleotide probes based on cytosine- and guanine-rich sequences. Sci. Rep. 2020, 10, 11006–11018. [Google Scholar] [CrossRef]
  32. Richards, C.I.; Choi, S.; Hsiang, J.C.; Antoku, Y.; Vosch, T.; Bongiorno, A.; Tzeng, Y.L.; Dickson, R.M. Oligonucleotide stabilized Ag nanocluster fluorophore. J. Am. Chem. Soc. 2008, 130, 5038–5039. [Google Scholar] [CrossRef] [Green Version]
  33. Daune, M.; Dekker, C.A.; Schachman, H.K. Complexes of Silver Ion with Natural and Synthetic Polynucleotides. Biopolymers 1966, 4, 51–76. [Google Scholar] [CrossRef]
  34. Petty, J.T.; Story, S.P.; Hsiang, J.C.; Dickson, R.M. DNA-Templated Molecular Silver Fluorophores. J. Phys. Chem. Lett. 2013, 4, 1148–1155. [Google Scholar] [CrossRef] [PubMed] [Green Version]
  35. Soto-Verdugo, V.; Metiu, H.; Gwinn, E. The Properties of Small Ag Clusters Bound to DNA Bases. J. Chem. Phys. 2010, 132, 195102. [Google Scholar] [CrossRef] [PubMed]
  36. Manzini, G.; Yathindra, N.; Xodo, L.E. Evidence for intramolecularly folded i-DNA structures in biologically relevant CCCrepeat sequences. Nucleic Acids Res. 1994, 22, 4634–4640. [Google Scholar] [CrossRef] [PubMed] [Green Version]
  37. Simonsson, T.; Pribylova, M.; Vorlickova, M. A Nuclease Hypersensitive Element in the Human c-myc Promoter Adopts Several Distinct i-Tetraplex Structures. Biochem. Biophys. Res. Commun. 2000, 278, 158–166. [Google Scholar] [CrossRef] [PubMed]
  38. Pagano, B.; Martino, L.; Randazzo, A.; Giancola, C. Stability and binding properties of a modified thrombin binding aptamer. Biophys. J. 2008, 94, 562–569. [Google Scholar] [CrossRef] [Green Version]
  39. Nagatoishi, S.; Isono, N.; Tsumoto, K.; Sugimoto, N. Loop residues of thrombin-binding DNA aptamer impact G-quadruplex stability and thrombin binding. Biochimie 2011, 93, 1231–1238. [Google Scholar] [CrossRef] [PubMed]
  40. Sacca, B. The Effect of Chemical Modifications on the Thermal Stability of Different G-Quadruplex-Forming Oligonucleotides. Nucleic Acids Res. 2005, 33, 1182–1192. [Google Scholar] [CrossRef] [Green Version]
  41. Tao, Y.; Li, M.; Ren, J.; Qu, X. Metal nanoclusters: Novel probes for diagnostic and therapeutic applications. Chem. Soc. Rev. 2015, 44, 8636–8663. [Google Scholar] [CrossRef] [PubMed]
  42. Chen, Z.; Tan, L.; Hu, L.; Luan, Y. Superior fluorescent probe for detection of potassium ion. Talanta 2015, 144, 247–251. [Google Scholar] [CrossRef] [PubMed]
  43. Rastegar, A. Serum Potassium. In Clinical Methods: The History, Physical, and Laboratory Examinations, 3rd ed.; Walker, H.K., Hall, W.D., Hurst, J.W., Eds.; Butterworths: Boston, MA, USA, 1990; Chapter 195. Available online: https://0-www-ncbi-nlm-nih-gov.brum.beds.ac.uk/books/NBK307/ (accessed on 30 October 2021).
  44. Gwinn, E.G.; O’Neill, P.; Guerrero, A.J.; Bouwmeester, D.; Fygenson, D.K. Sequence-Dependent Fluorescence of DNA-Hosted Silver Nanoclusters. Adv. Mater. 2008, 20, 279–283. [Google Scholar] [CrossRef]
  45. Sengupta, B.; Ritchie, C.M.; Buckman, J.G.; Johnsen, K.R.; Goodwin, P.M.; Petty, J.T. Base-Directed Formation of Fluorescent Silver Clusters. J. Phys. Chem. C 2008, 112, 18776–18782. [Google Scholar] [CrossRef] [PubMed]
Figure 1. The demonstrative illustration shows the working idea of Tel22C12-AgNCs as potassium sensor.
Chemosensors 09 00349 g001
Figure 2. Emission spectra of studied DNA-AgNCs obtained by using different amounts of silver ions: (A) cytosine to Ag+ ratio 1:1 (Ag+/C); (B) sum of cytosine and guanine to Ag+ ratio 1:1 (Ag+/CG) for bifunctional templates and cytosine to Ag+ ratio 2:1 (Ag+/C) for C12 template. Conditions: 2 μM probe in 10 mM Tris-acetate (pH = 7.5) after 24 h since silver reduction.
Chemosensors 09 00349 g002
Figure 3. Circular dichroism spectra of studied systems before and after formation of C12AgNCs (A) or Tel22C12-AgNCs (B). Conditions: 2 μM probe, 10 mM Tris-acetate (pH = 7.5), [Ag+] = [BH4] = 24 µM.
Chemosensors 09 00349 g003
Figure 4. Normalized UV melting profiles of Tel22C12 and Tel22C12-AgNCs (2µM) in 10 mM Tris-acetate buffer (pH = 7.5) containing 100 mM NaCl or 100 mM KCl; monitored at 260 nm (A) or 295 nm (B).
Chemosensors 09 00349 g004
Figure 5. The evaluation emission properties of studied DNA-AgNCs in time: (A) C12AgNCs; (B) Tel22C12-AgNCs; (C) TBAC12-AgNCs. Conditions: 2 μM probe in 10 mM Tris-acetate (pH = 7.5).
Chemosensors 09 00349 g005
Figure 6. Effect of cations on fluorescence properties of Tel22C12-AgNCs: (A) emission spectra in presence of increasing K+ concentration; (B) changes in maximum intensity of green and red fluorescence upon K+ addition; (C) emission spectra in presence of increasing Na+ concentration; (D) changes in maximum intensity of green and red fluorescence upon Na+ addition. Conditions: 2 μM probe in 10 mM Tris-acetate (pH = 7.5) after 24 h from silver reduction.
Chemosensors 09 00349 g006
Figure 7. Effect of cations on fluorescence properties of TBAC12-AgNCs: (A) emission spectra in presence of increasing K+ concentration; (B) changes in maximum intensity of green and red fluorescence upon K+ addition; (C) emission spectra in presence of increasing Na+ concentration; (D) changes in maximum intensity of green and red fluorescence upon Na+ addition. Conditions: 2 μM probe in 10 mM Tris-acetate (pH = 7.5) after 24 h since silver reduction.
Chemosensors 09 00349 g007
Figure 8. Fluorescence response of the Tel22C12-AgNCs in buffers w/o and with sodium ions at different K+ concentrations: (A) the emission spectra of Tel22C12-AgNCs upon adding increasing concentrations of K+ ions (0–150 mM) and (B) corresponding Stern–Volmer plot showing K+ quenching effect on Tel22C12-AgNCs emission spectra with λmax = 620 nm in the absence of sodium ions. Insert showing linear relationship in concentration ranges from 0 to 10 mM K+; (C) the emission spectra of Tel22C12-AgNCs in buffer with 150 mM NaCl upon adding increasing concentrations of K+ ions (0–10 mM) and (D) corresponding Stern–Volmer plot showing K+ quenching effect on Tel22C12-AgNCs emission spectra with λmax = 610 nm in the presence of sodium ions. Conditions: 2 μM probe in 10 mM Tris-acetate (pH = 7.5) after 24 h from silver reduction in buffer w/o metal cations.
Chemosensors 09 00349 g008
Table 1. The DNA oligonucleotide sequences used in this research.
NameOligonucleotide SequenceCompany
C125’-CCC CCC CCC CCC-3’IBA
Tel22C12
TBAC12
5’-AGG GTT AGG GTT AGG GTT AGG G CC CCC CCC CCC C-3’
5’-GGT TGG TGT GGT TGG CCC CCC CCC CCC-3’
Genomed
Genomed
Table 2. Melting temperatures (Tm) of G-quadruplex-forming oligonucleotide probes determined from the melting profiles monitored at 295 nm in the presence of K+ and Na+ ions.
Abbreviation of ProbesTm/K+ (°C)Tm/Na+ (°C)
Tel2262.0 155.0 1
Tel22C1237.5/65.036.0/55.0
Tel22C12-AgNCs64.556.0
TBA53.0 124.0 1
TBAC1218.2/52.0-
TBA C12-AgNCs51.042.0
1 Determined by us in 10 mM cacodylic buffer (pH 7.5).
Publisher’s Note: MDPI stays neutral with regard to jurisdictional claims in published maps and institutional affiliations.

