Article

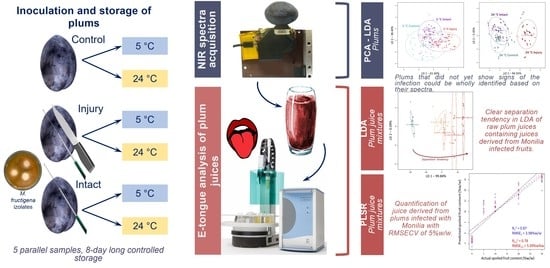
Detection of Monilia Contamination in Plum and Plum Juice with NIR Spectroscopy and Electronic Tongue

1
Institute of Food Science and Technology, Hungarian University of Agriculture and Life Sciences, 1118 Budapest, Hungary
2
Department of Biosystems-MeBioS, KU Leuven, Kasteelpark Arenberg 30, 3001 Leuven, Belgium
3
Department of Food Science and Technology, Kwame Nkrumah University of Science and Technology (KNUST), Kumasi 00233, Ghana
*
Author to whom correspondence should be addressed.
Submission received: 1 November 2021 / Revised: 6 December 2021 / Accepted: 9 December 2021 / Published: 11 December 2021
(This article belongs to the Special Issue Chemosensors and Biosensors for Food Quality and Safety)

Abstract

:
Plums are one of the commercially important stone fruits that are available on the market in both fresh and processed form and the most sought-after products are prunes, cans, jams, and juices. Maturity, harvest, and post-harvest technologies fundamentally determine the relatively short shelf life of plums which is often threatened by Monilinia spp. Causing brown rot worldwide. The aim of the present research was to use advanced analytical techniques, such as hand-held near infrared spectroscopy (NIRS) and electronic tongue (e-tongue) to detect M. fructigena fungal infection on plums and quantify this fungal contamination in raw plum juices. For this purpose, plums were inoculated with fungal mycelia in different ways (control, intact, and through injury) and stored under different conditions (5 °C, and 24 °C) for eight days. The results obtained with the two instruments were analyzed with chemometric methods, such as linear discriminant analysis (LDA) and partial least squares regression (PLSR). The NIRS-based method proved successful when detectability before the appearance of visible signs of the infection was studied. E-tongue was able to detect and quantify the concentration of juice derived from plum developed with M. fructigena with RMSECV lower than 5% w/w. Overall, the two methods proved to be suitable for discriminating between the treatment groups, however, the classification accuracy was higher for samples stored at 24 °C. The research results show both NIRS and e-tongue are beneficial methods to reduce food waste by providing rapid determination of fruit quality.

Graphical Abstract

1. Introduction

The genus Prunus includes a number of economically important stone fruits, such as peaches, cherries, and plums. Among these, plums have become increasingly important with valued commercial significance, especially for the European (Prunus domestica) and Japanese (Prunus salicina) varieties. The world’s leading plum producer is China, followed by Romania, Serbia, and the United States [1]. Approximately 2000 species of plums are known worldwide with varying shapes where terminologies such as tiny, round, large, and oval are used to describe their appearance. In terms of color, they can range from pale yellow to red fruit flesh and yellow to black skin [2,3]. Plums are commercially available in both fresh and processed forms and the most sought-after products are prunes, cans, jams, and juices [4]. Nutritionally, fruits are good sources of water-soluble and insoluble fibers that have a regulatory function and selection of gut microflora [5,6]. The flesh is the major and edible part of the plum fruit that is characterized by a low-calorie content. After water, carbohydrates are the main component of fruits that represent more than 90% of their dry matter. Stone fruits, such as plums, have also been important sources of an array of phytochemicals (e.g., flavonoids, flavanols, and flavonols) that may reduce the risk of cardiovascular diseases [7]. Plum products, among others, contribute to ease dejection, increase bone health, and improve cognition [8]. Plums and their products, in particular, have been recognized as functional foods as they contain a number of compounds that have beneficial health effects upon consumption [9].
Generally, maturity, harvest, and post-harvest technologies fundamentally determine the shelf life of plums, which is 2–6 weeks depending on the species. Even when stored at 0 °C [10], a significant proportion of the production loss of up to 50% is due to fruit diseases [11], among which the most substantial is the Monilinia spp. Monilinia spp. are especially known for causing brown rot worldwide [12,13]. In Europe, M. fructicola and M. laxa are best known for their ability to secrete cell wall-degrading enzymes to infect pome and stone fruits. M. fructigena spp. are also known for spreading readily through contact after contamination via mechanical injury [14,15,16]. To counter post-harvest losses, it is essential to sort suspected or infected fruits from the lot as soon as possible to maintain the quality of fruit products expected by consumers. In this way, further fungal contamination and processing of spoiled fruits may be abated to improve agricultural profits.
To date, there is no objective method based on the measurement of parameters that could exhaustively describe the physiological status of fruits. Only a finite number of characteristics can be determined at a time, but the so-called fingerprint methods provide a solution in a fast and non-destructive manner. Near infrared (NIR) spectroscopy with its 100-year history is one of the most suitable techniques to determine the internal quality indices and safety of fruits (e.g., defects, and decays) [17,18,19]. During a storage test on plums, Li et al. [20] applied visible-NIR spectroscopy coupled with Pearson correlation, principal component analysis (PCA), and partial least squares regression (PLSR) to predict soluble solid content (SSC), pH, titratable acid (TA), sugar-acid ratio (SSC/TA), flesh color (L *, a *, and b *), and firmness during low-temperature storage (5 °C) of black skinned “Friar” plums. According to their results, flesh color proved to be a crucial factor to consider when assessing the quality of post-ripening. Pérez-Marín et al. [21] studied the utility of a diode-array Vis-NIR (400–1700 nm) and a handheld micro-electro-mechanical system (1600–2400 nm) spectrometer to assess SSC and firmness of plum varieties stored at 0 °C for 9 d. Promising results were obtained when it was examined how accurately six varieties and three storage periods (0, 6, and 9 d) could be classified using PLS discriminant analysis (DA). In another research, almost 100% correct classification was achieved by using NIRS and back propagation-artificial neural networks (BP-ANN) when detecting flesh-browning of intact plums [22]. Regarding the fungal infection of fruits, Siedliska et al. [23] got similarly good results when employing Vis-NIR, small wavelength IR hyperspectral imaging (HSI) and BNN to detect Botrytis cinerea and Collatotrichum acutatum in strawberries. In a study on citruses, Vis-NIR HSI and N-way PLS-DA models were developed for the discrimination of sound and green mold (Penicillium digitatum) infected orange and mandarin varieties [24]. Liu et al. [25] also used Vis-NIR HSI (400–1000 nm) to predict the fungal colony count in peaches infected with Botrytis cinerea, Rhizopus stolonifera, and Monilinia fructicola. They additionally performed PCA evaluation which showed successful discrimination of fruits at different levels of infection (acceptable, moldy, and highly moldy) during storage.
Due to the sharply growing consumer demand for minimally processed fruit products, fruit juices are also frequent targets for various forms of food fraud, since they can be easily manipulated across the production line. The adulteration covered by this concept can be quite simple or sophisticated, e.g., when industrial slops, by-products, or lower quality juices are added [26]. The verification of food authenticity is of paramount importance not only from an economic purview, but also from a food-safety point of view. The use of untargeted methods can be observed more and more in this area as well [27,28]; an outstanding example of these untargeted methods is the electronic tongue (e-tongue). The e-tongue mimics human taste perception and can be effectively used for qualitative and quantitative analysis of liquid samples. It is also often used in cases where human sensory evaluation would not be feasible [18,29]. A commercial multi-parameter liquid sensor system based on ISFET technology was employed when the post-harvest ripeness of plums was examined. A significant correlation was found between sensor signals and TA, SSC/TA, and total sugars/TA ratios [30]. Based on the investigations of Rudnitskaya et al. [31], the developed e-tongue was able to discriminate fresh-pressed and concentrate based juices, the dilution by water or sugar syrup. Besides, the degradation of the juices over time and the degrees of spoilage could be effectively traced and detected. Hong et al. have repeatedly used the e-tongue and nose data fusion techniques to the recognition and quantification of fresh cherry tomato juice adulteration with juices of overripe tomatoes [32,33]. The results of a study on the spoilage of apple juices reveal that Zygosaccharomyces rouxii contamination could be detected as early as 12 h after inoculation by LDA on e-tongue data. PLSR for estimating the cell count showed high prediction accuracies for the tested strains [34].
Relatively few scientific results are available on plums and their products with state-of-the-art non-destructive methods, particularly with regard to the monitoring of microbial contamination. To the best of our knowledge, there is no published study to date, that has addressed the use of NIR spectroscopy and e-tongue based classifier and predictor models to detect Monilinia spp. infection in plums and contamination in raw fruit juices. This preliminary study aims to detect Monilinia fructigena in stored plums by NIR spectroscopy, also to qualify and quantify raw plum juices with e-tongue.

2. Materials and Methods

2.1. Fruit Samples and Fungal Isolates

European plums used for the experiment were collected at the Újpest Market and Fair Hall, Budapest, during the late autumn season. Fruits from the Stanley variety were pre-selected according to their size and integrity. The fruits were fully matured, colored, and free of any visible damage.
Isolation of Monilinia ssp. from different fruits (e.g., apples, quinces, and plums) showing signs of brown rot was performed. A small slice of the fruit was aseptically cut and plated onto malt extract agar (Biolab, 1% yeast extract, 2% malt, 4% glucose, and 1.5% agar), followed by incubation for 7 d at 21 °C. Naturally infected quince isolates were identified as Monilia fructigena by PCR and DNA sequencing based on the sequence analysis of the ribosomal ITS (Internal Transcribed Spacer) region of isolates [35]. The sequences were compared to similar fungal sequences available from GenBank using BLAST (Basic Local Alignment Search Tool) [36]. Fresh inoculations were performed weekly from the margins of the cultures onto malt extract agar, and propagated at 24 °C. The edges of fungal mycelia developed on the culture media were used for infection.

2.2. Sample Preparation

The surface of the plums was disinfected with 76% ethyl alcohol, and artificially infected with M. fructigena as summarized in Table 1. Subsequently, half of the samples prepared were exposed to controlled storage in refrigerator (−5.3 ± 0.7 °C; 58.5 ± 3.6% RH) or at room temperature (24.5 ± 1.0 °C; 66.4 ± 3.8% RH) for 8 d. The storage at about 5 °C simulated refrigerated storage conditions that befit for both home and industrial storage temperature, while the storage at about 24.5 °C, which is the optimum temperature of M. fructigena, simulated a practical storage condition on the shelf. Storage conditions were monitored with a data logger. The following six groups of plums were obtained by storage in different conditions: “5 °C Control”, “5 °C Injury”, “5 °C Intact”, “24 °C Control”, “24 °C Injury”, and “24 °C Intact”. To ensure a sufficient sample quantity for the measurements, five parallel plums were infected in each sample group and were examined in a non-destructive manner with NIR spectroscopy.
After 8 d of storage, raw juices were extracted from each of the six groups of plums stored in different ways by a fruit centrifuge (Philips HR 1851). In addition to raw juices of the “Injury” fruits stored at 24 °C for 8 d and had developed M. fructigena on their surface were mixed in 5, 10, 20, and 30% with raw juices from the “24 °C Control” samples to simulate juice production that does not conform to good manufacturing practice. By mixing “Control” and “Injury” samples stored at 24 °C in different ratios, the following four groups of samples were obtained: “24 °C Control + Injury 5%”, “24 °C Control + Injury 10%”, “24 °C Control + Injury 20%”, and “24 °C Control + Injury 30%”. Three parallel samples were prepared (centrifuged and mixed) simultaneously for each sample group of raw plum juices of different compositions (six sample groups and four mixtures), giving a total of 30 samples which were further analyzed with e-tongue.

2.3. Methods

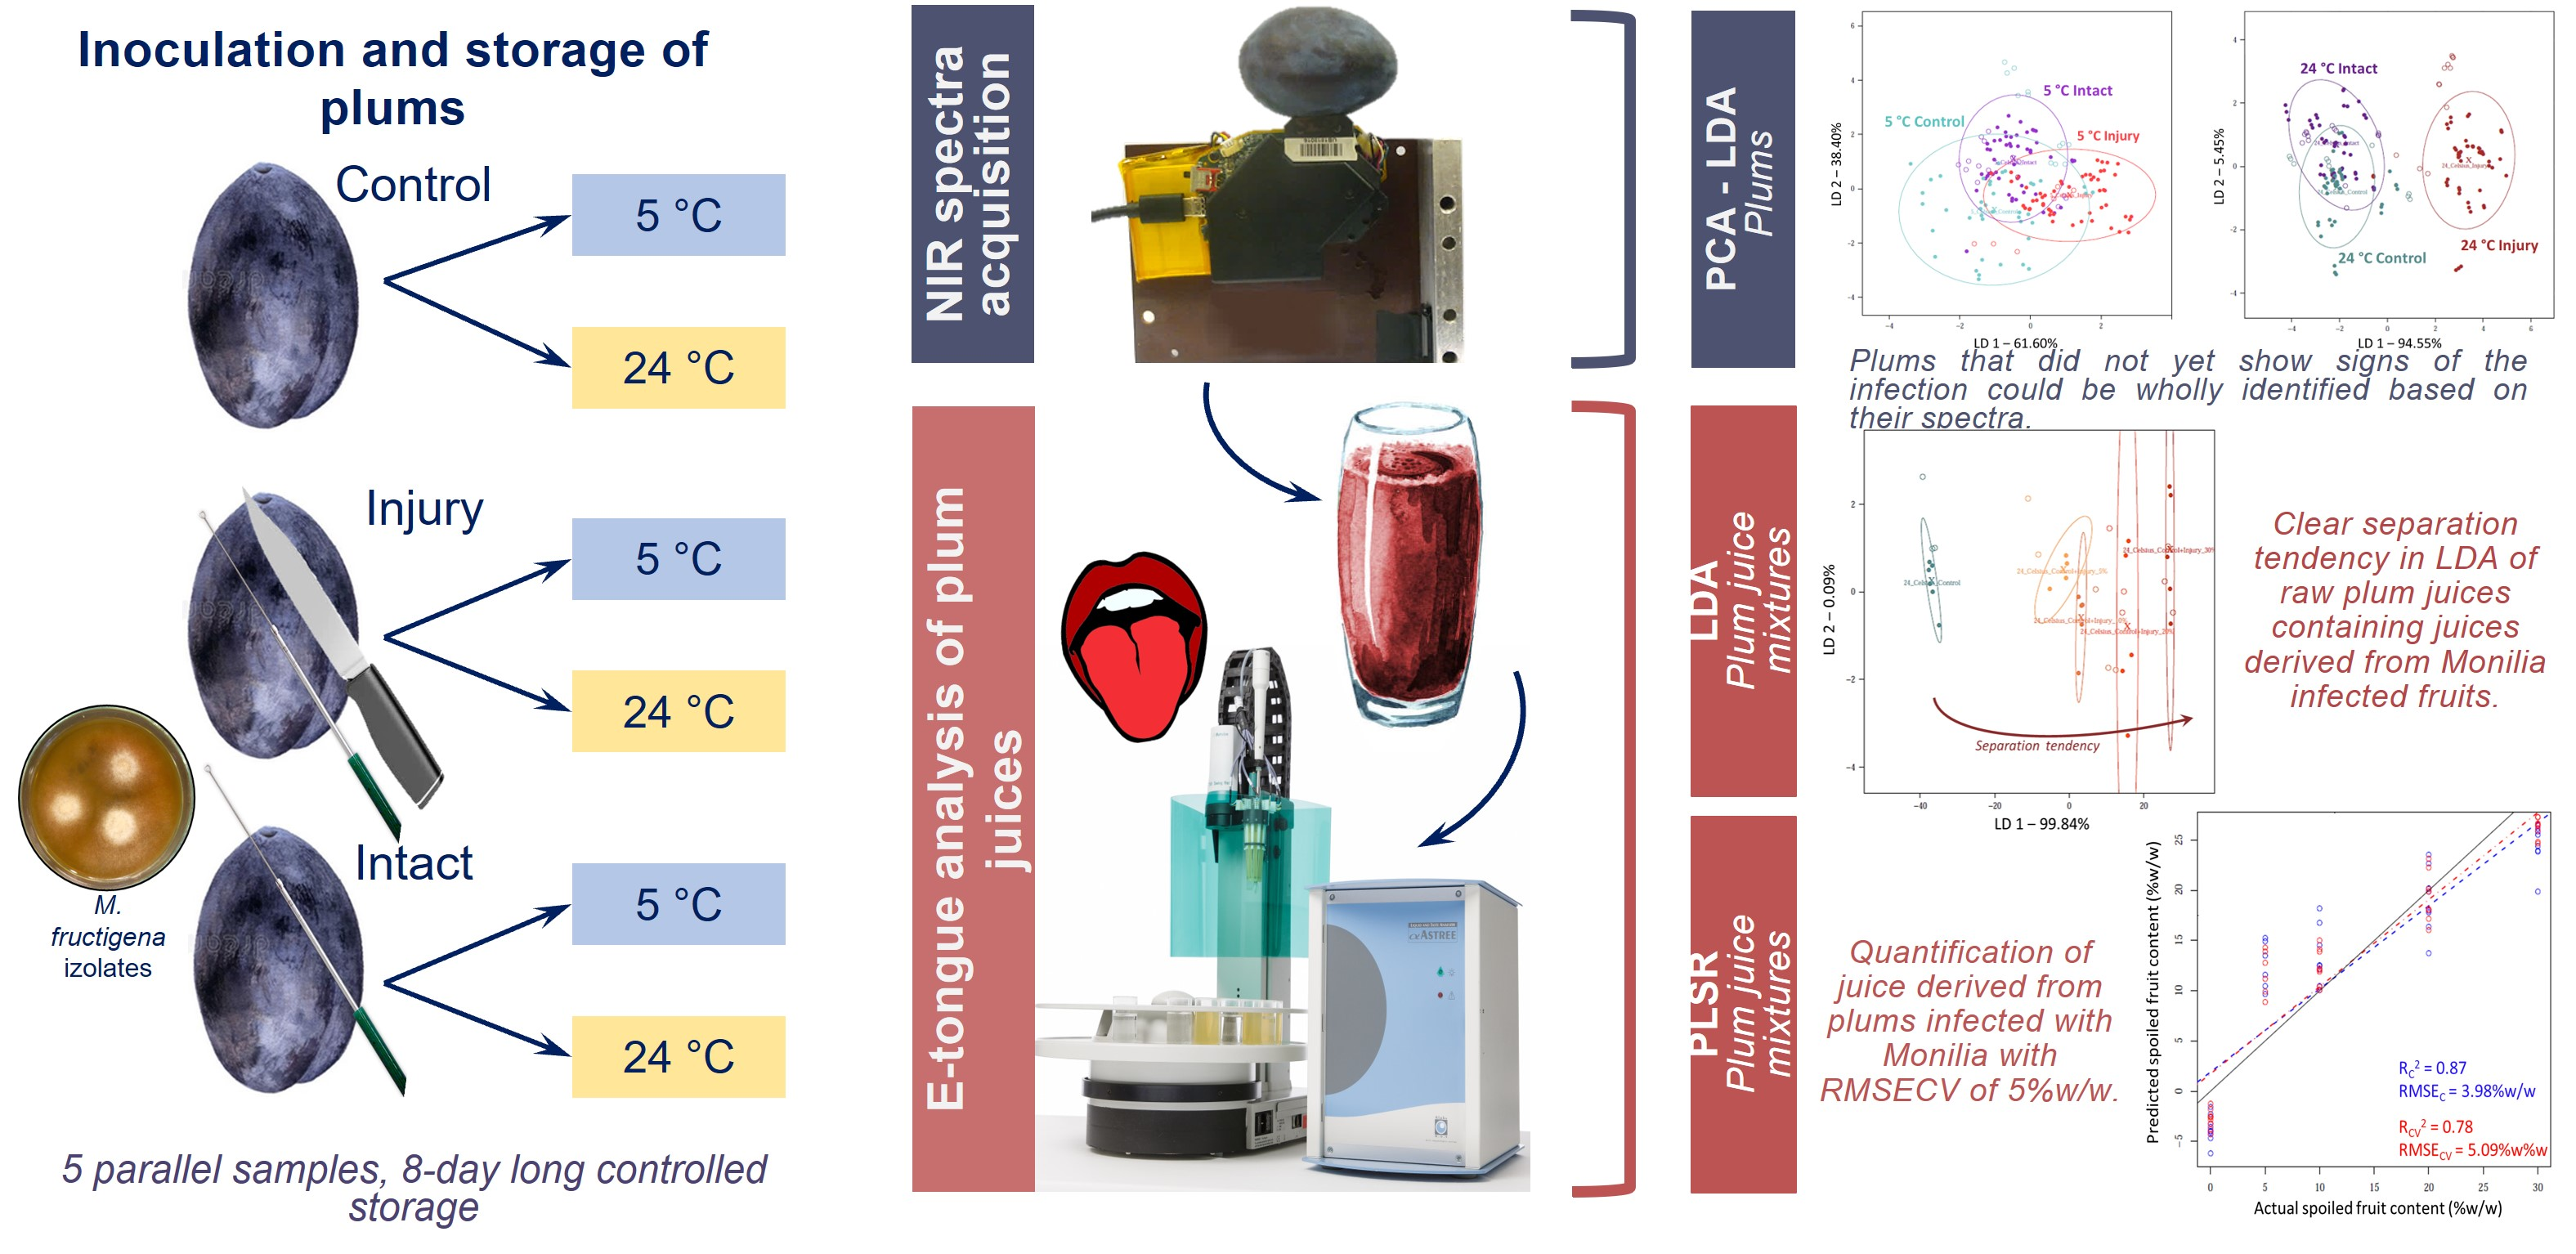
2.3.1. Spectral Acquisition of the Plum Samples with Hand-Held Spectrometer

For non-destructive examination of plums stored and infected in different ways, 30 whole fruits (six sample groups × five parallel samples) were subjected to near infrared scanning using a NIR-S-G1 (InnoSpectra Co., Hsinchu, Taiwan) hand-held reflectance spectrometer. The spectral data was collected in the wavelength range of 900–1700 nm. The spectra were recorded along the vertical axis of the fruits (from stalk to apex) at five measurement positions. Three consecutive scans were recorded at each measurement position. After each measurement, the instrument contact surface was disinfected with 76% ethyl alcohol. The spectra acquisition was performed twice per day during 8 d of storage, except for day 8, when there was only one measurement, thus, there were a total of 15 measurement occasions. A total of 450 spectra were collected per occasions (i.e., 30 samples × five positions × three consecutives).

2.3.2. Electronic Tongue Analysis of the Plum Juice Samples

The Alpha Astree potentiometric electronic tongue (Alpha M.O.S., Toulouse, France) was used to study the taste profile of plum juices and mixtures. A measuring head with an Ag/AgCl reference electrode and seven ISFET sensors specially developed for food analysis immersed in the liquids at once with continuous stirring. Beside the seven sensors, a pH electrode (SevenMulti, Mettler Toledo, Greifensee, Switzerland) was also included in the measuring system. Before starting the measurements, the instrument was prepared in accordance with the manufacturer’s instructions [37]. The raw fruit juices and mixtures were 50-fold diluted and filtered with pleated paper filters with a pore size of 30 µm and diameter of 125 mm (Macherey-Nagel GmbH. and Co., Düren, Germany). The amount of sample solution tested by the e-tongue was 100 mL, measuring time was 120 s, the sampling frequency was 1 s, and the cleaning time with distilled water was 15 s between measurements. All three parallel samples in the 10 different sample groups were measured four times. Thus, for the subsequent data analysis, a total data set of 120 observations was obtained (10 sample groups × three parallel samples × four measurement repetition).

2.3.3. Data Analysis

Multivariate Analysis of the NIR Spectra

The NIR spectra were evaluated in the 950–1630 nm wavelength range. Principal component analysis (PCA) was applied to compress highly autocorrelated NIR data into variables (principal components) that no longer correlated. This also enabled sorting of outliers by identifying data points that fall outside the 95% confidence interval. Outliers were detected per sample group, and 6049 of the 6750 spectra were further evaluated.
Besides Savitzky-Golay smoothing (second order polynomial, 21 points), various spectral pretreatments were used to optimize later statistical modeling. The following treatments were applied: detrending (elimination of polynomial baseline tendencies), multiplicative scatter correction (baseline shift reduction), standard normal variate (correction of linear and additive effects), first derivative (removal of constant offsets), and second derivative (removal of linear offsets) with different data point frames (13; 17; 21). The article summarizes the best models obtained with different pretreatments.
Principal component analysis based linear discriminant analysis (PCA-LDA) was performed to classify samples according to mode of inoculation (“Control”, “Injury”, and “Intact”), storage conditions (“5 °C”, and “24 °C”), different treatment groups (“5 °C Control”, “5 °C Injury”, “5 °C Intact”, “24 °C Control”, “24 °C Injury”, and “24 °C Intact”), and signs of visible Monilia infection (“−”, and “+”). In these analyses, principal component scores were used as input for the LDA models. The optimal number of principal components (NrPCs) were determined on the model training set (with the exclusion of data corresponding to one of the five parallelly prepared samples) by omitting the consecutive scans. The R-based algorithm collected and compared LDA training and cross-validation accuracies up to the predefined 40 NrPCs. The NrPCs providing the smallest difference between the accuracies of model building and cross-validation as well as the highest validation accuracy was used to build the final model using the 4/5 of data involved in the optimization. During the validation, the external set, the 1/5 of data (corresponding to previously omitted parallelly prepared samples) was projected into the model built in this way. To examine the early detectability of M. fructigena, independent LDA prediction was employed. In this case, a classification model was built with three-fold cross-validation on the data of “24 °C Injury” samples measured on the third, fourth, fifth, and sixth measurement days and was tested by projecting the results of fruits that soon showed signs of infection (day 1, and day 2). The training set included 600 spectra (550 after outlier deletion) and 300 spectra in the validation set. In this way, it was possible to determine where samples that did not yet show visible signs of infection in the first few days could actually be classified according to their spectra (infection “−”, or “+”).

Multivariate Analysis of the E-Tongue Data

The evaluation of the e-tongue results used the average of the sensor signals measured in the last 10 s on each sensor separately, then drift correction was performed to improve e-tongue sensor signals [38,39]. The results of the first three measuring cycles were excluded from the initial dataset, since then the sensors were still conditioning to the sample solutions. Then PCA was applied whose sole purpose was to detect possible outliers which were manually sorted. After this, a total of 81 datapoints were further analyzed.
LDA was employed to classify each group of raw plum juice samples. The LDA models were built by omitting the sensor signals belonging to one of the three parallelly prepared samples. During the external validation, the previously left-out sample data was projected into the LDA models.
Partial least square regression (PLSR) was used to predict “24 °C Injury” raw fruit juice content in authentic plum juices. The predictive model was validated with leave-one-out cross-validation (“LOO”), which is a generally accepted validation procedure in e-tongue data analysis [40]. In this case, model construction was done with the omission of one case, and model testing was done with the previously omitted one. This cycle was executed as many times as all the cases were included during model building and validation. The fit accuracy of the PLSR model was given by the coefficient of determination (R2) and the root mean square error (RMSE) during calibration (C) and validation (CV). The R-based algorithm tested the number of latent variables (NrLV) optimal for the model construction and selected the one with minimal RMSE values.
The data systematization and analysis were implemented in MS Excel and R-project (3.6.3) software and “aquap 2” package [41].

3. Results and Discussion

3.1. Results of Near Infrared Spectroscopy

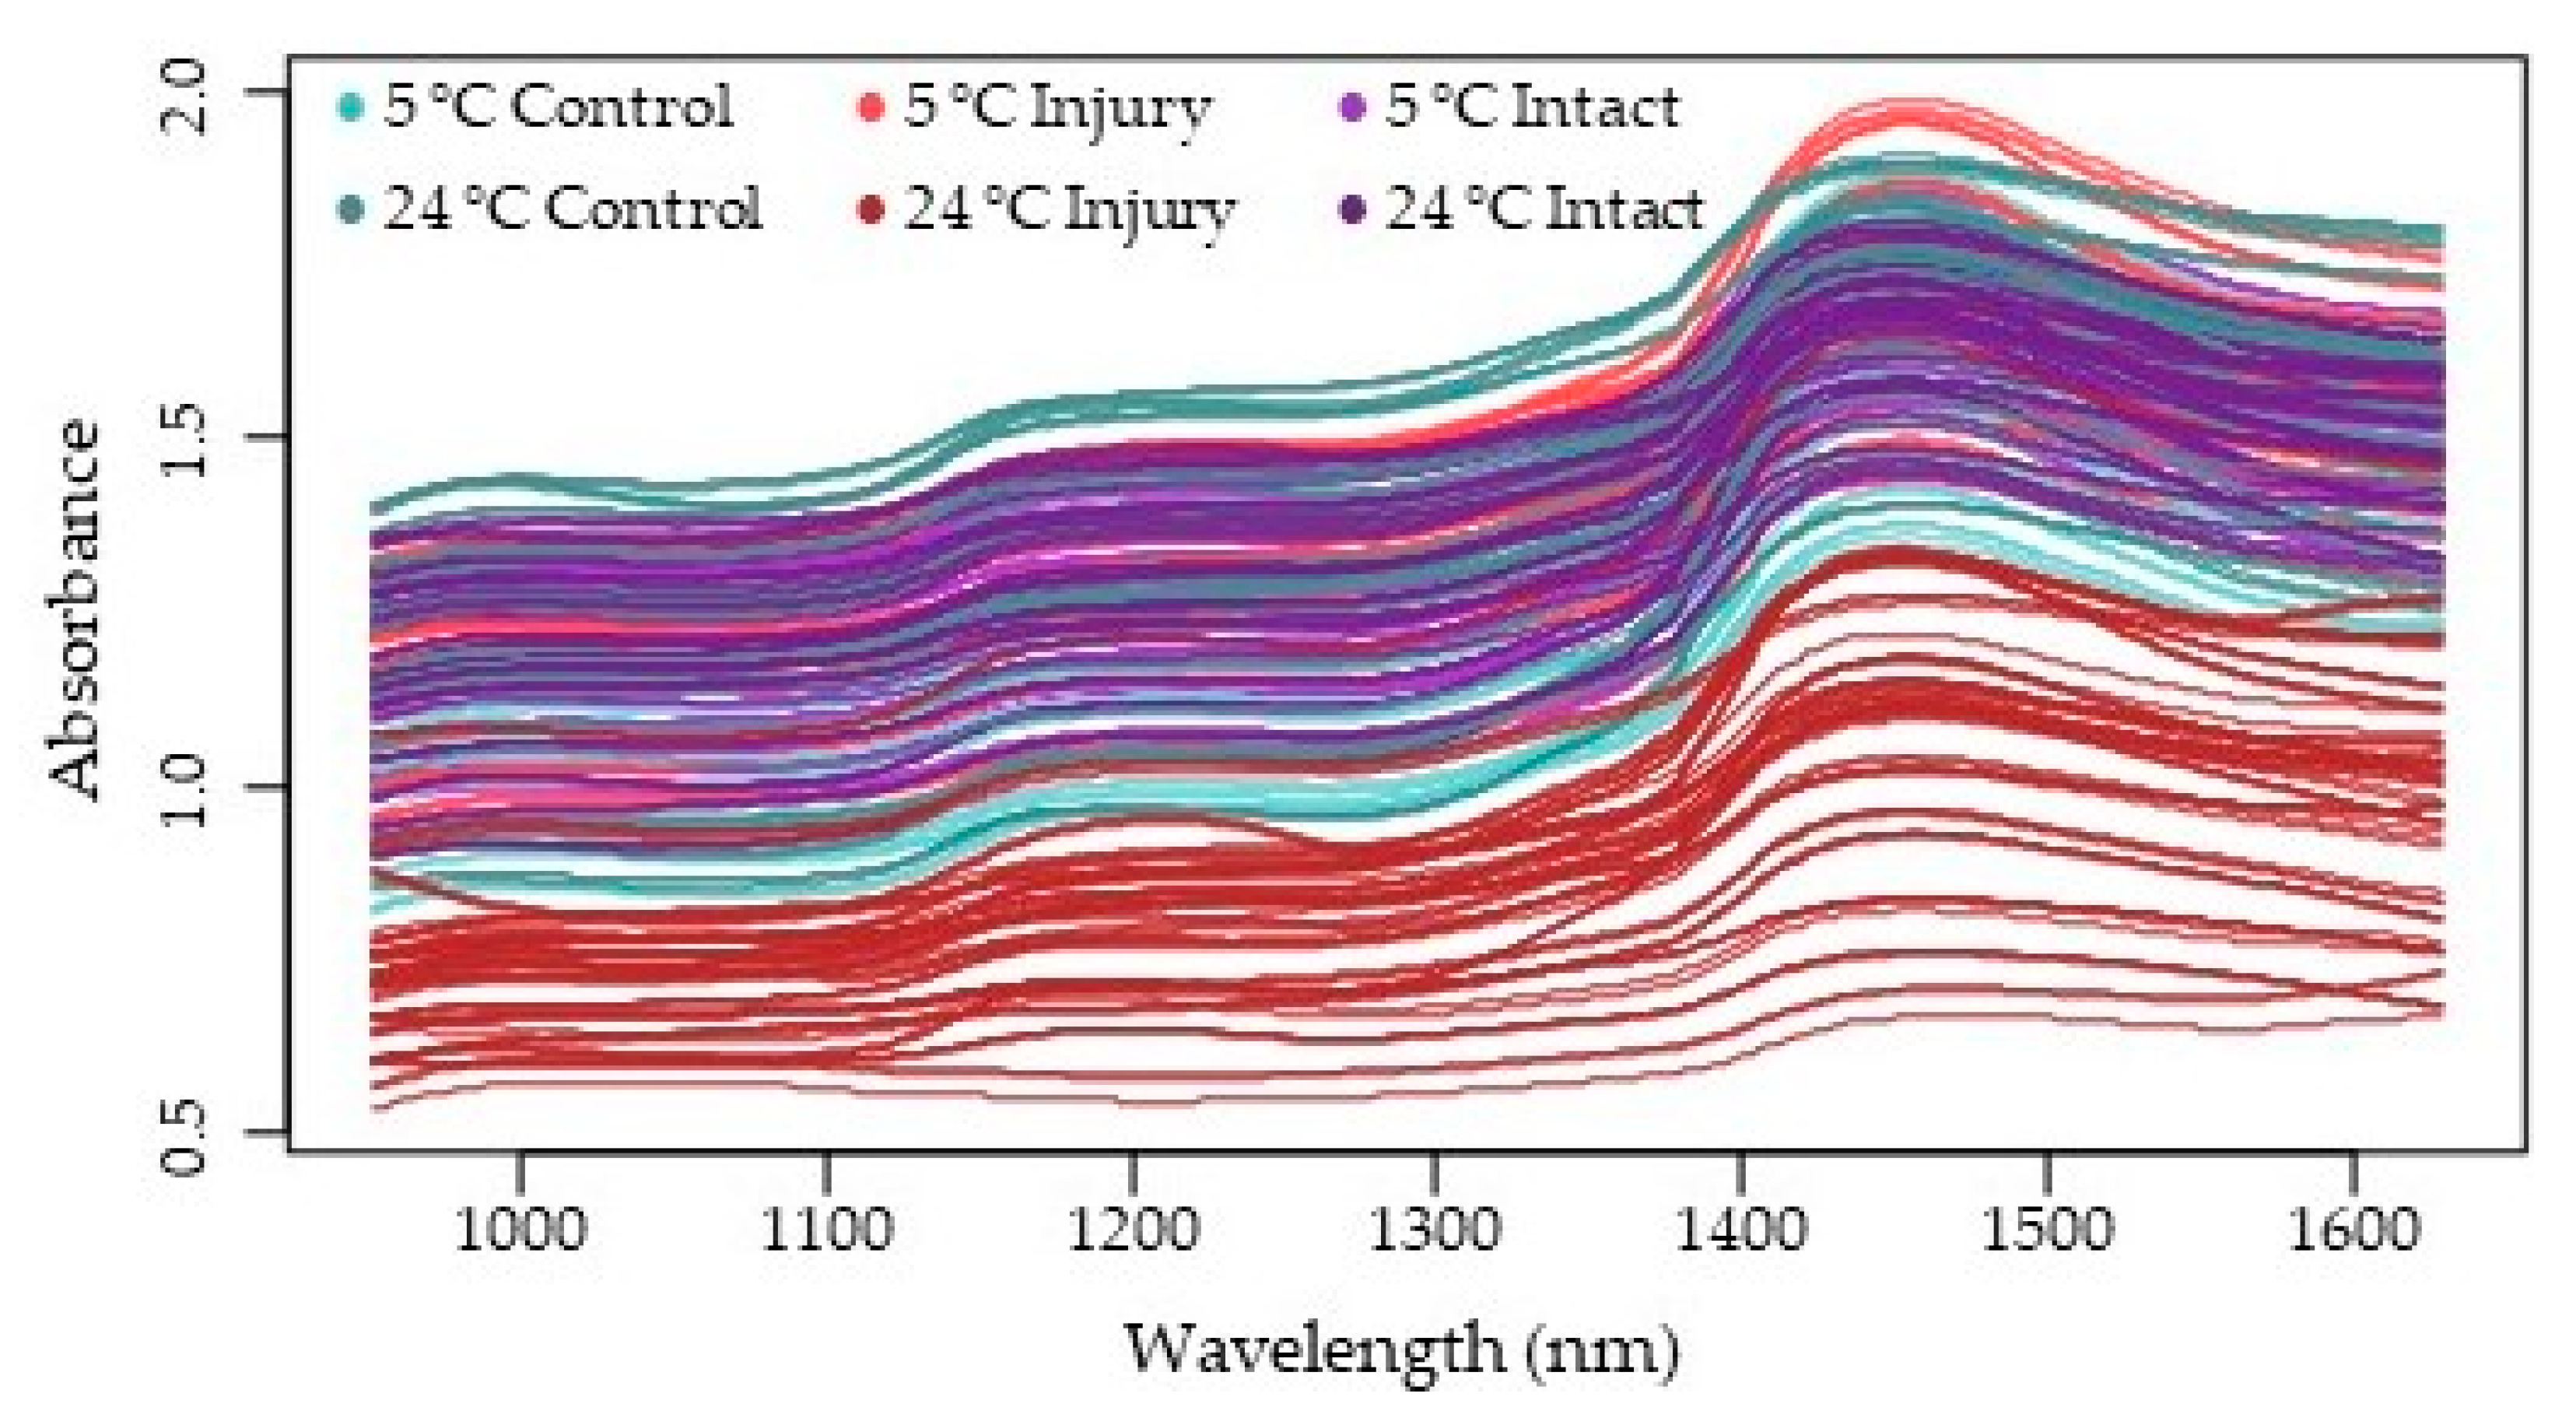
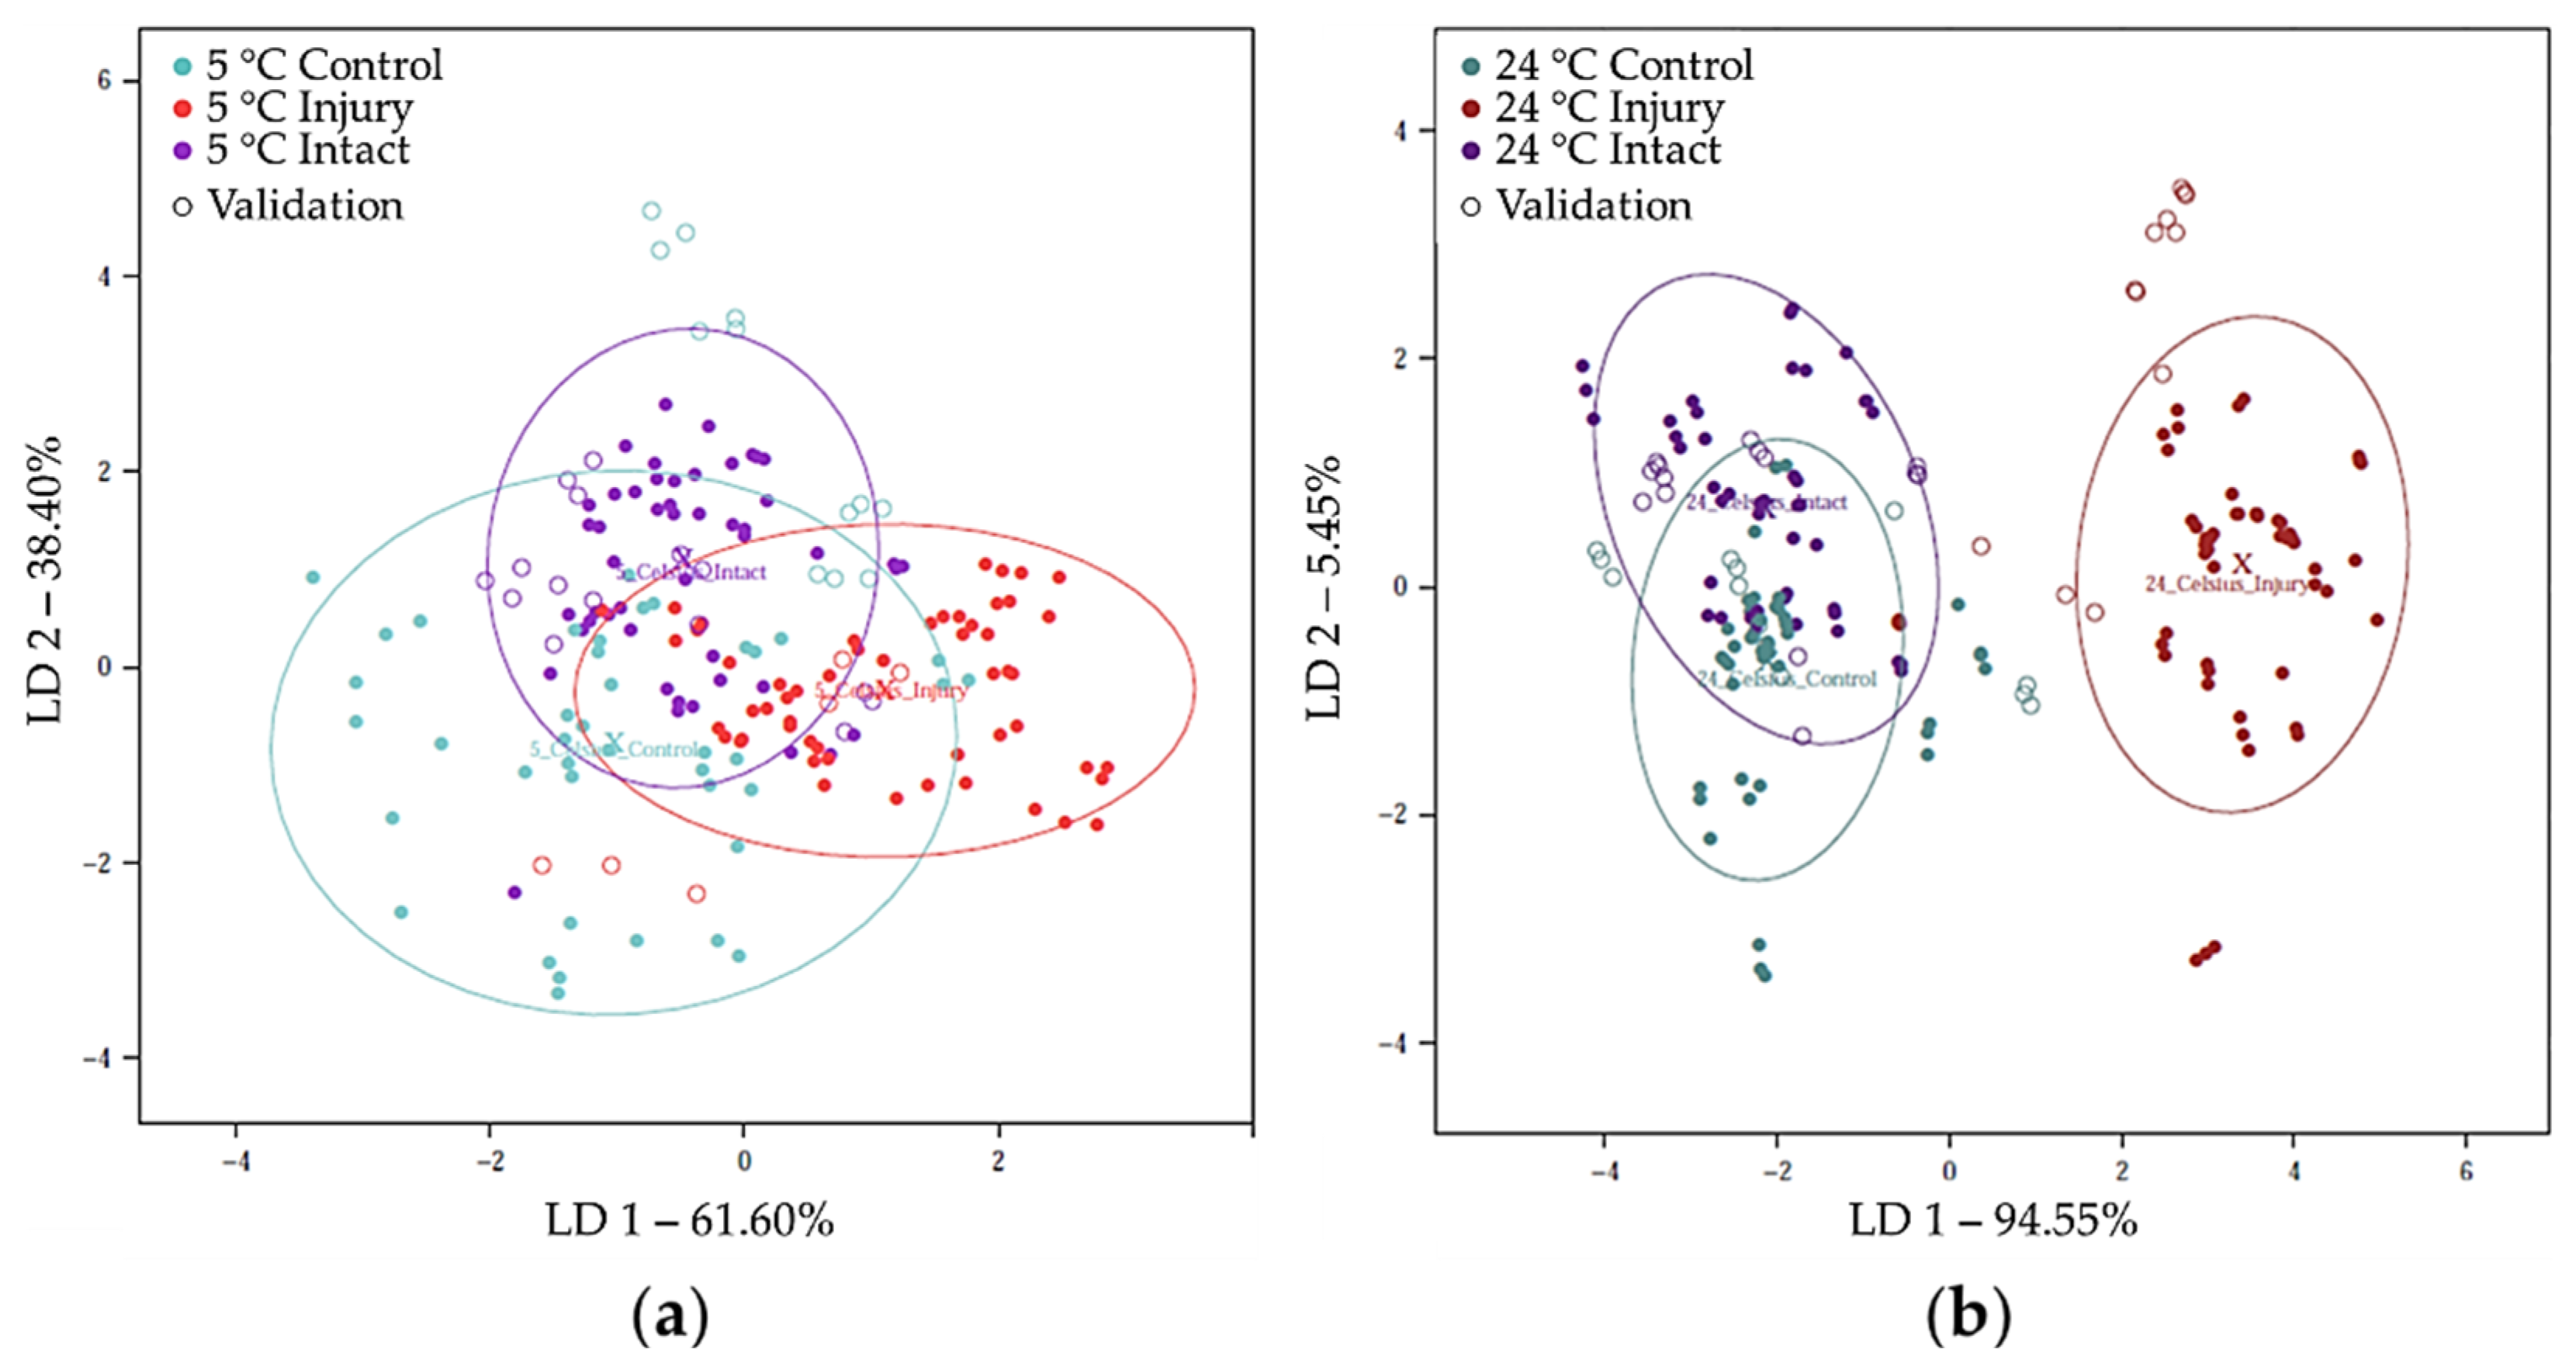
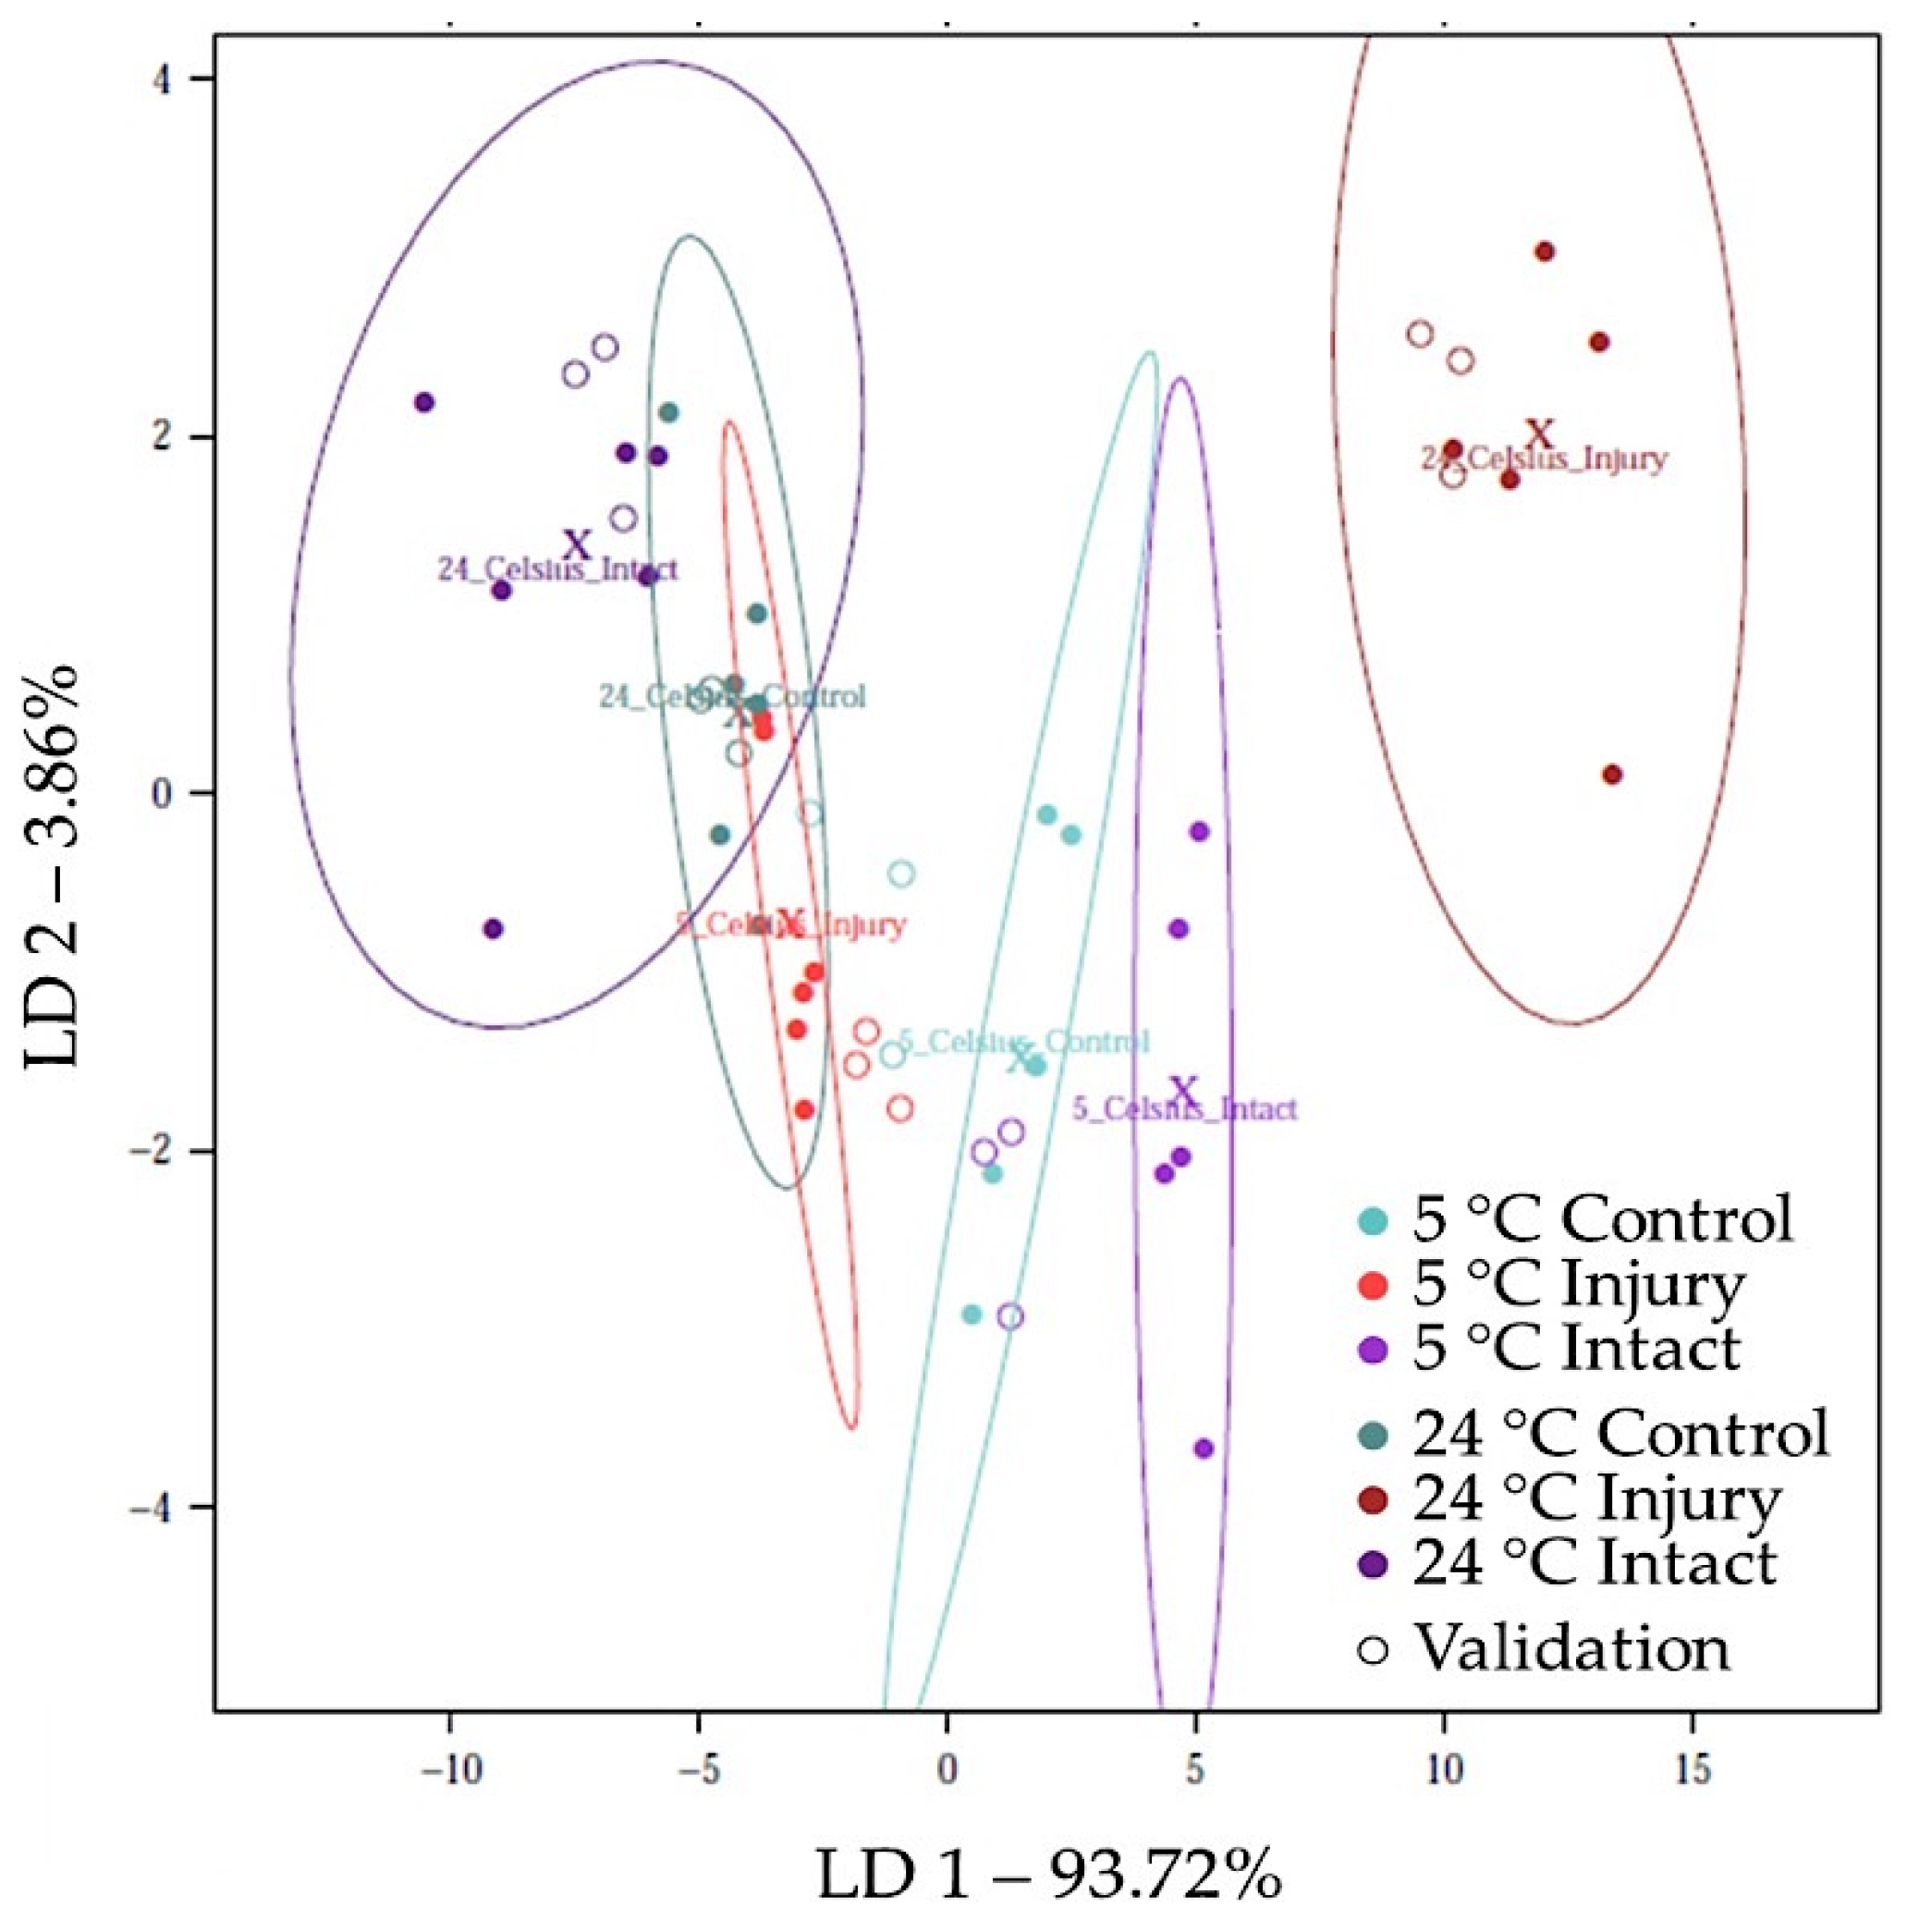
3.1.1. Discrimination of the Different Treatment Groups of the Plum Samples with the Hand-Held Spectrometer

The smoothed NIR spectra recorded on the eighth storage day with the hand-held spectrometer is shown in Figure 1. It was observed that the spectra of different sample groups overlap significantly. Around 1400–1500 nm, the samples show high light absorption, suggesting differences in water structure patterns. Based on the figure, the spectra of the “24 °C Injury” samples were characterized by lower absorbance values compared to the other sample groups. This is also due to the appearance of Monilinia conidia on the surface of fruits and a significant decrease in the water content of these samples. The highly overlapping spectra supported the need for statistical analyzes to show the differences hidden in the data.
Figure 2 reports the first two linear discriminant variables of the PCA-LDA model, calculated to discriminate the different sample groups on the eighth day of storage. The groups of control and differently infected samples stored at 5 °C were almost completely overlapping in the presented discriminant space. The groups of “Control” and “Intact” samples stored at 24 °C were separated relatively close to this. Data of fruits inoculated via injured surface clearly formed a distinct group. Table 2 summarizes the prediction classification for the different treatment groups during model building and external validation (72.29%, and 56.67%). Based on the above mentioned, it was expected that the classification of the samples, especially of the injured fruits stored at 24 °C was more accurate than that of the samples stored at 5 °C. As external validation, projecting the data of every first parallel sample into the training model showed that “5 °C Control” and “5 °C Injury” samples were classified equally during model validation. For the samples “24 °C Intact” the validation accuracy was relatively low, misclassification was mostly to the “5 °C Control” group. The significant segregation of data points belonging to the “24 °C Injury” group can be attributed to the fact that Monilia was able to obtain the optimal developmental circumstances under such conditions. Conidia developing on the surface of the fruits contributed to the large scattering of light, besides, the water content of the fruits also decreased greatly in this treatment group. This resulted in 100% prediction classification during validation. This was typical for the “24 °C Injury” samples.
It was worthwhile to split the data according to storage conditions because there was considerable overlap between sample groups at each of the temperature levels. Thereby, we were able to get a more accurate picture of the effect of the Monilia inoculation mode on the spectra. Figure 3. exemplifies how the data points of differently infected plums in the discriminant space were separated. Storage at 5 °C for 8 d did not result in significant spectral differences; the data points of the different treatment groups significantly overlap (Figure 3a). Classification accuracies for the discrimination of the three groups stored at 5 °C were 74.41 and 43.33% during recognition and validation, respectively. The projection of data of every fifth sample resulted that the method classified the “5 °C Intact” samples most inaccurately, with the highest misclassification being done for the “5 °C Injury” samples (Table 3). As mentioned above, there were no visible signs of Monilia growth in this sample group because the storage conditions were not optimal for the fungus, the classification of the “Control” samples was the most accurate. This was almost completely classified as “Intact”. This can be attributed to the very similar surface properties, since there was no wound on the surface of these fruits.
For the samples stored at 24 °C, the “24 °C Control” and “24 °C Intact” sample groups presented more overlapping pattern with each other than with the “24 °C Injury” group on the PCA-LDA (Figure 3b). Using the data of every fourth parallel samples as external validation resulted in the classification accuracies summarized in Table 4. The correct classification during model building and testing were 85.21 and 66.82%, respectively. The most accurate classification was found for the “24 °C Injury” samples, with minimal misclassification for the “24 °C Intact” ones. The other two groups, especially in the case of the “Control” samples, there was higher misclassification observed into each other’s groups (Table 4).

3.1.2. Early Detection of Monilia fructigena Contamination on Plums with the Hand-Held Spectrometer

During the 8 d of storage visible signs of M. fructigena infection was observed only in the cases of plum samples stored at 24 °C and infected by injury (“24 °C Injury”). Table 5 summarizes when M. fructigena infection was visually noticed on the five test samples of the “24 °C Injury”sample group. In order to achieve early detection of these samples with the NIR technique, we built a PCA-LDA model on the spectra of the “24 °C Injury” samples from the third, fourth, fifth, and sixth measurement days (N = 550, and NrPCs = 20), which classified the samples according to the visible signs of infection. The spectra of the first 2 d of the “24 °C Injury” samples (N = 300, and NrPCs = 20) were projected into this model for independent prediction. According to our results, the method classified all the “24 °C Injury” samples as positive for Monilia infection based on the data of the first two measurement days. Due to the dark skin color of the Stanley variety, signs of infection could only be seen when some form of fungal mycelium and/or conidia have developed. Generally, all of the five measurement positions on the fruit surface contributed to the successful identification. Such obligate aerobic fungal infections are characterized by the fact that they spread rapidly through the fruit tissue after infection, whilst the fruit itself collapses, and proliferating from the outside inwards [14]. As a result of this process, the infection may be detected at measurement positions where it is not yet visible. The fact that a cut was applied on the fruit surface also might have contributed to the distinction on the first 2 d.

3.2. Results of Electronic Tongue

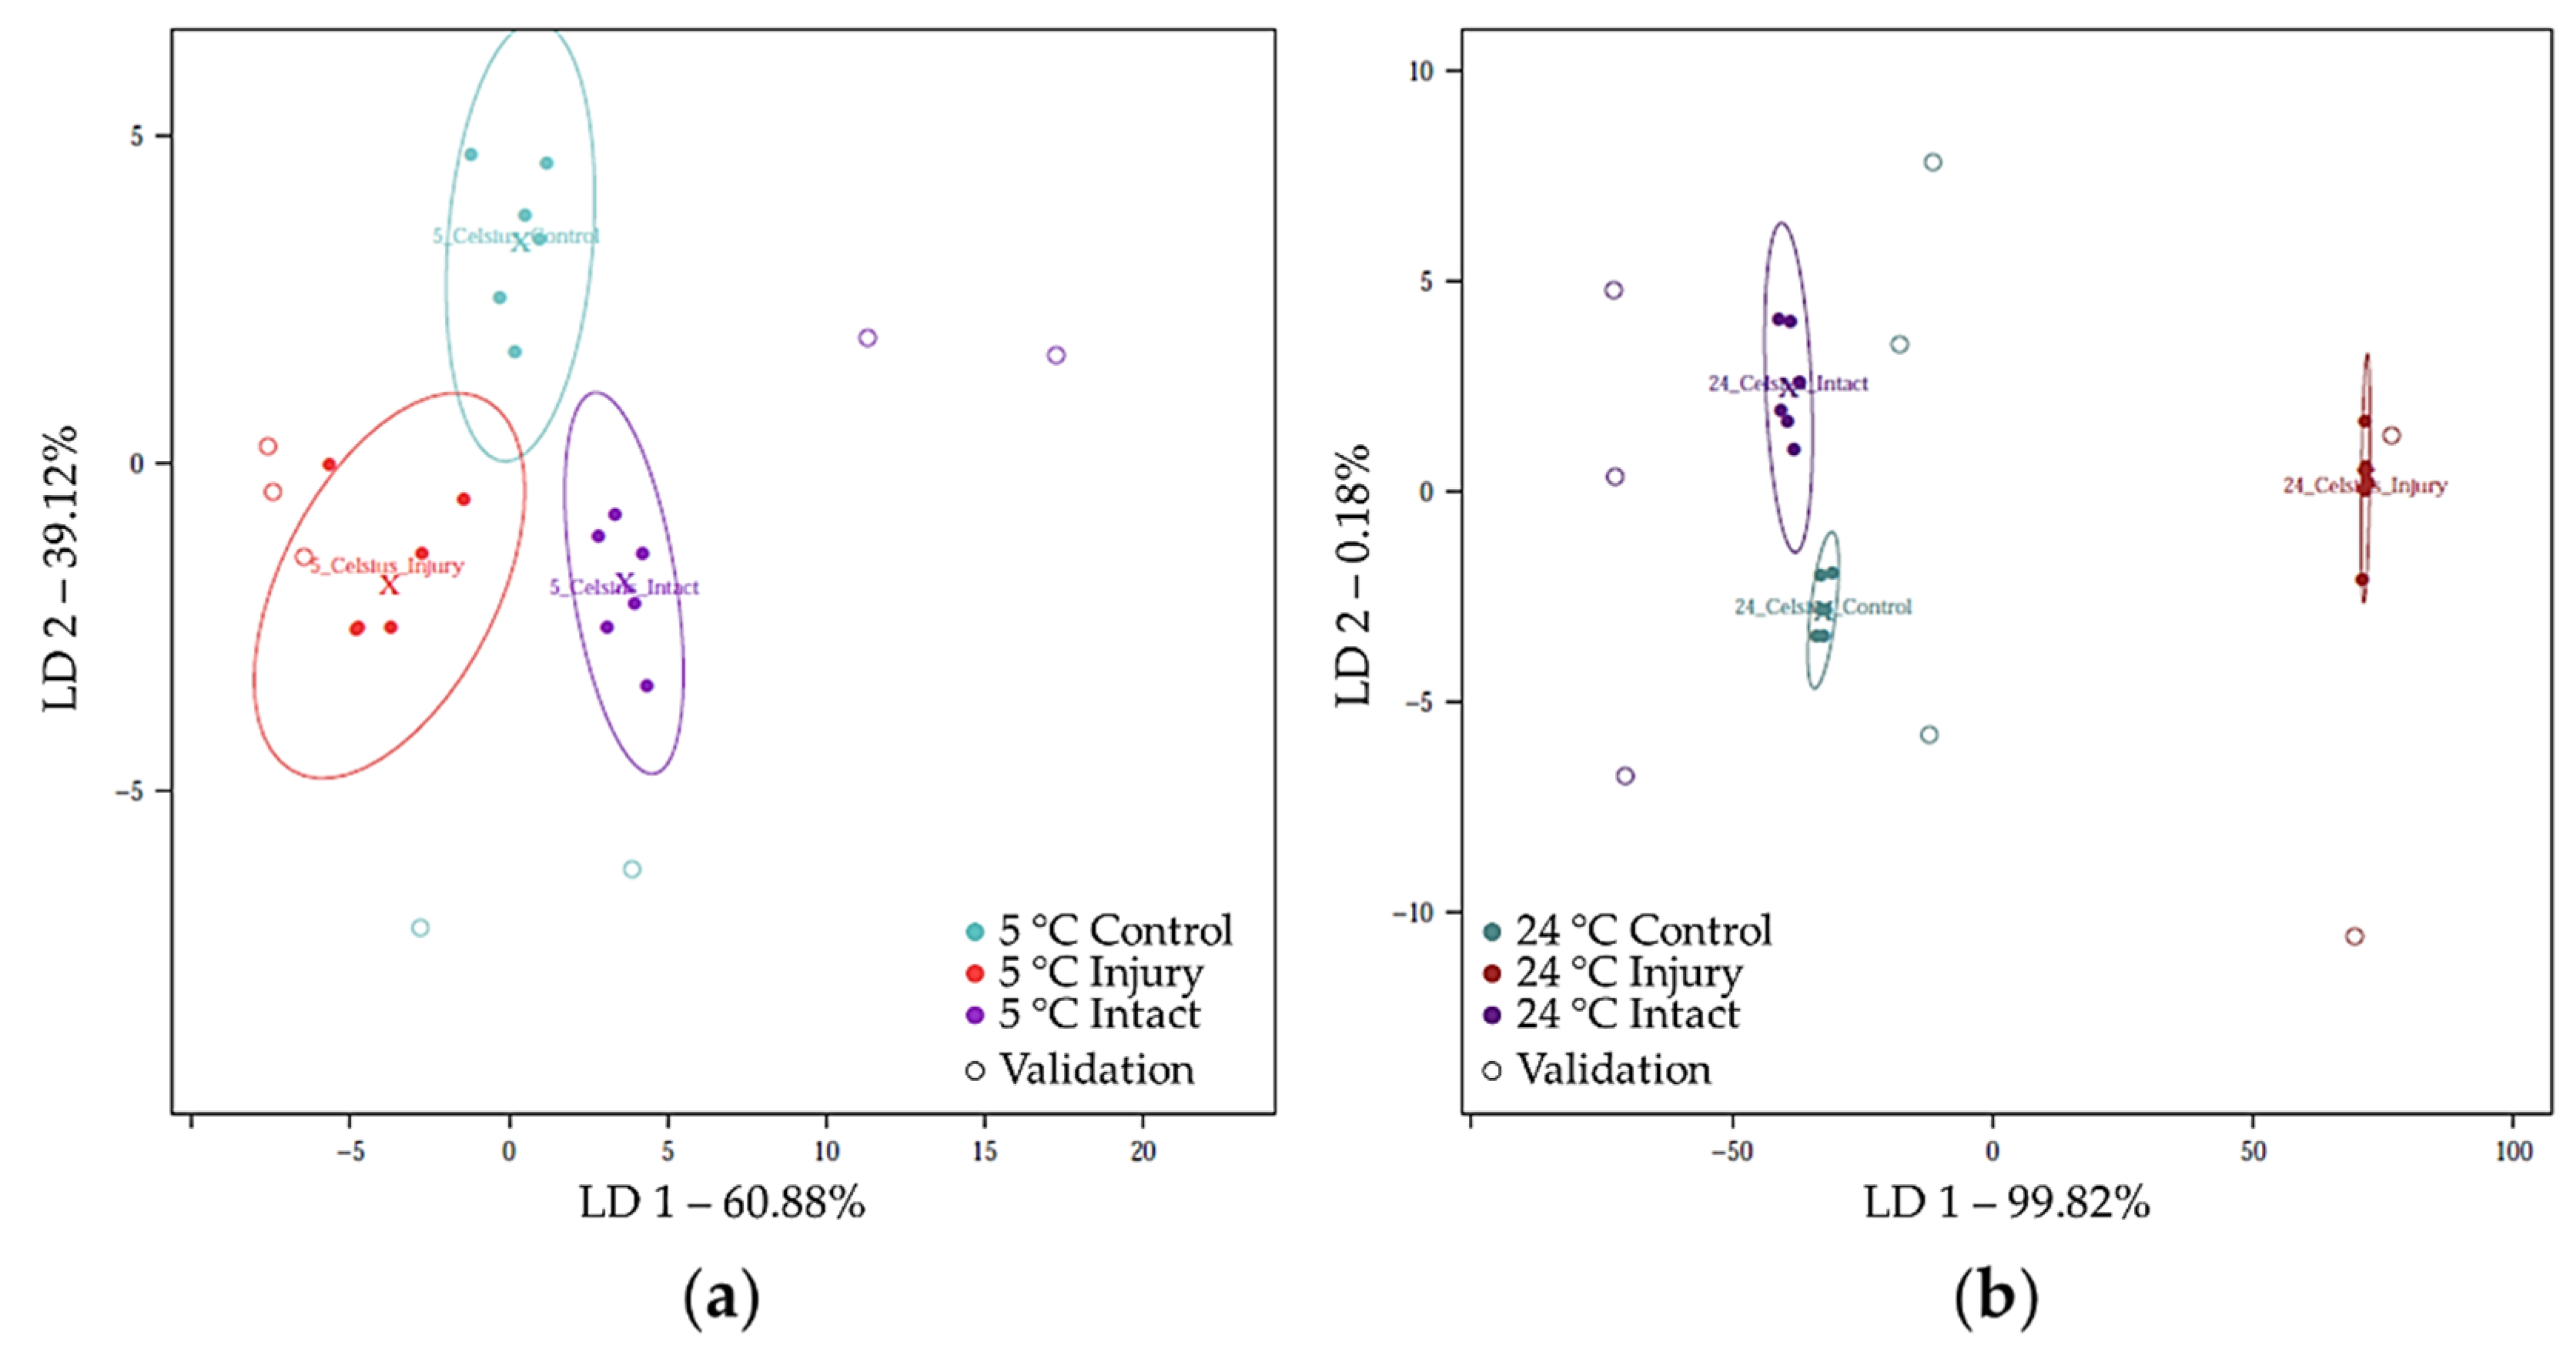
3.2.1. Discrimination of the Different Treatment Groups of the Plum Samples with E-Tongue

Figure 4 reports the first two linear discriminant variables of the LDA model calculated to observe detectable trends in the control and mixed raw plum juices based on the e-tongue sensor signals. Building the LDA model on the first and third parallel sample set and projecting the result of second sample set resulted in a fairly well separation of the groups of juices along the first discriminant factor. Interestingly, the data points corresponding to “24 °C Intact”, “24 °C Control”, and “5 °C Injury” treatment groups were partly overlapping, while “5 °C Control” and “5 °C Intact” samples not. The data points of “24 °C Injury” samples were clearly separated. Only the “24 °C Injury” samples showed Monilia activity, which intrinsically digested the fruits, greatly altering their chemical composition. This change was effectively detectable with e-tongue. Interestingly, the “5 °C Control”, “5 °C Injury”, and “24 °C Control” samples were grouped in cluster, presumably due to similar sensorial characteristics. Table 6 contains the correct classification values of the different sample groups during LDA modelling and validation (88.89%, and 63.89%). Even in this analysis, it was true that the classification accuracy of the samples stored at 24 °C was better. During validation, the prediction classification of “24 °C Control” and “24 °C Intact” samples were equal. Raw fruit juices of the “5 °C Control” group were completely misclassified as “5 °C Injury” or “5 °C Intact”. As the figure implied, there was 100% correct classification of the “24 °C Injury” samples during model building and validation.
Analyzing separately how each group of samples can be distinguished at the different temperatures, a notable overlap between the inoculation modes at 5 °C was observed (Figure 5a). When projecting the data of the second parallel samples, this was supported. As Table 7 shows, the misclassification of raw “Control” juices into the other two sample groups was absolute. For samples stored at 24 °C, when the first parallel samples were used in the validation, the different inoculation modes could be distinguished completely during model building and testing (Figure 5b, Table 8).
Comparing the NIR spectroscopy and e-tongue results, it can be observed that the e-tongue proved to be slightly more accurate in the discrimination according to the mode of inoculation. Chemical and pH-related differences could be described with high accuracy, especially for samples stored at 24 °C.

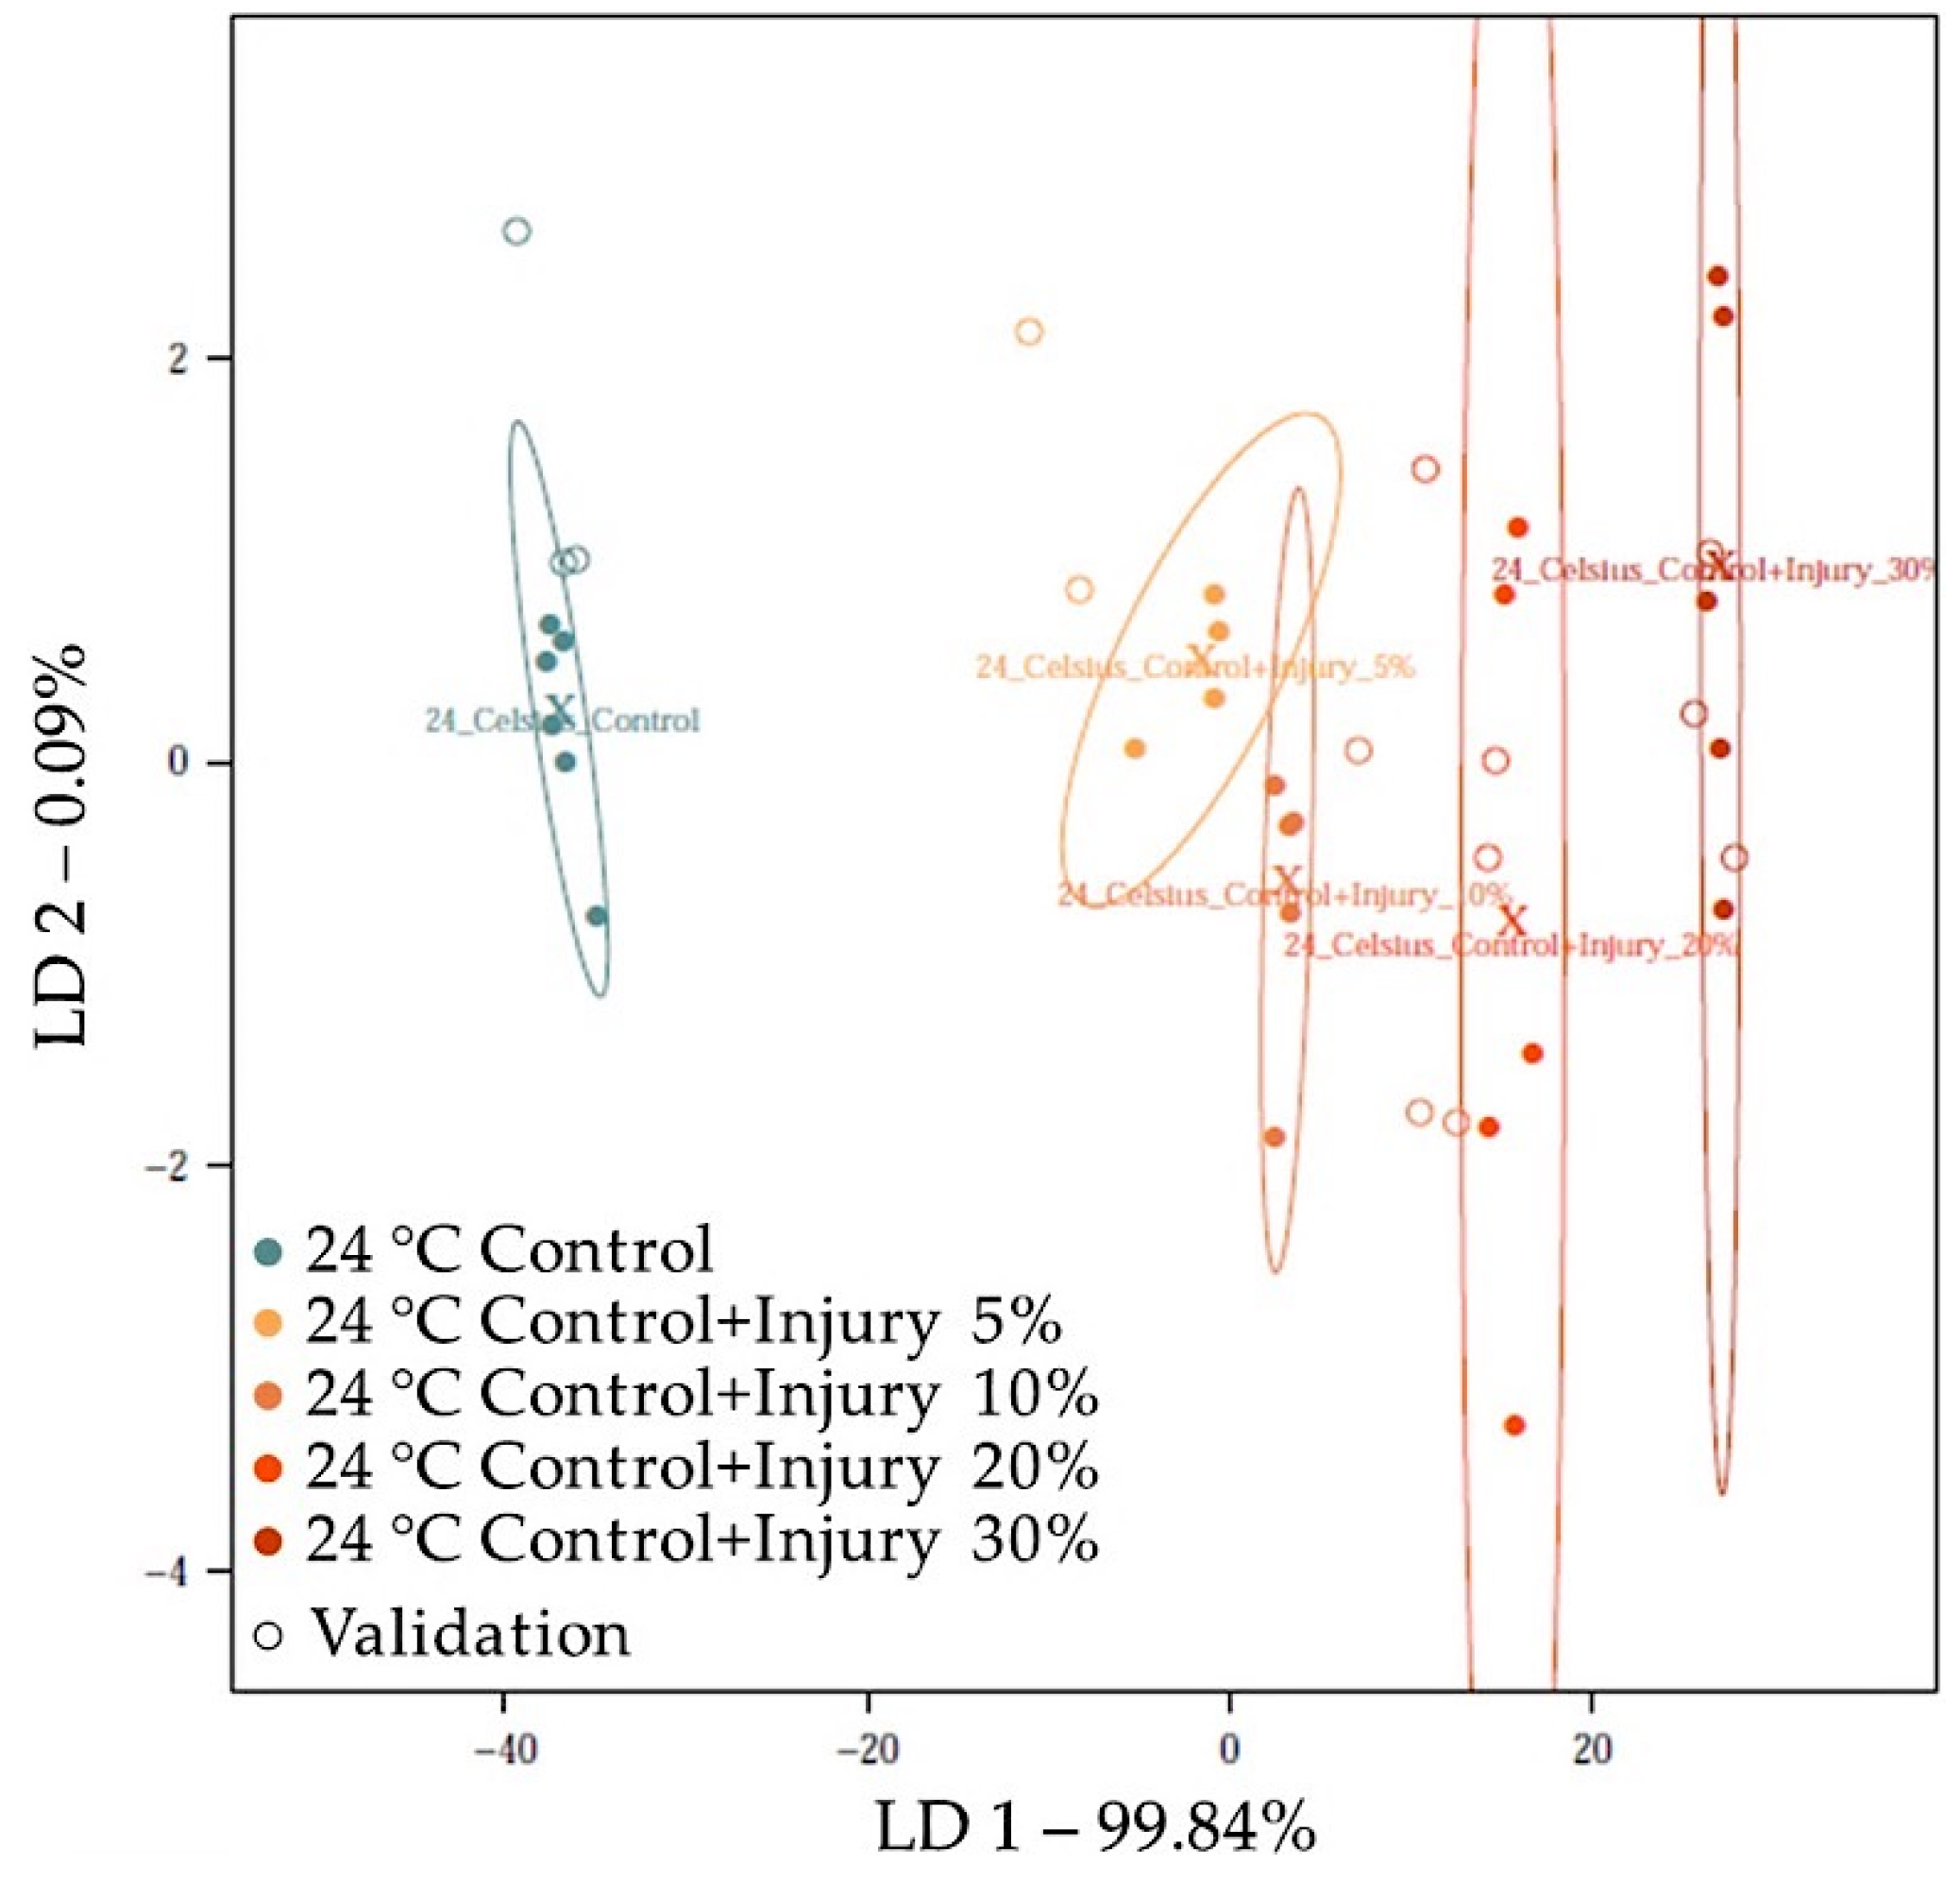
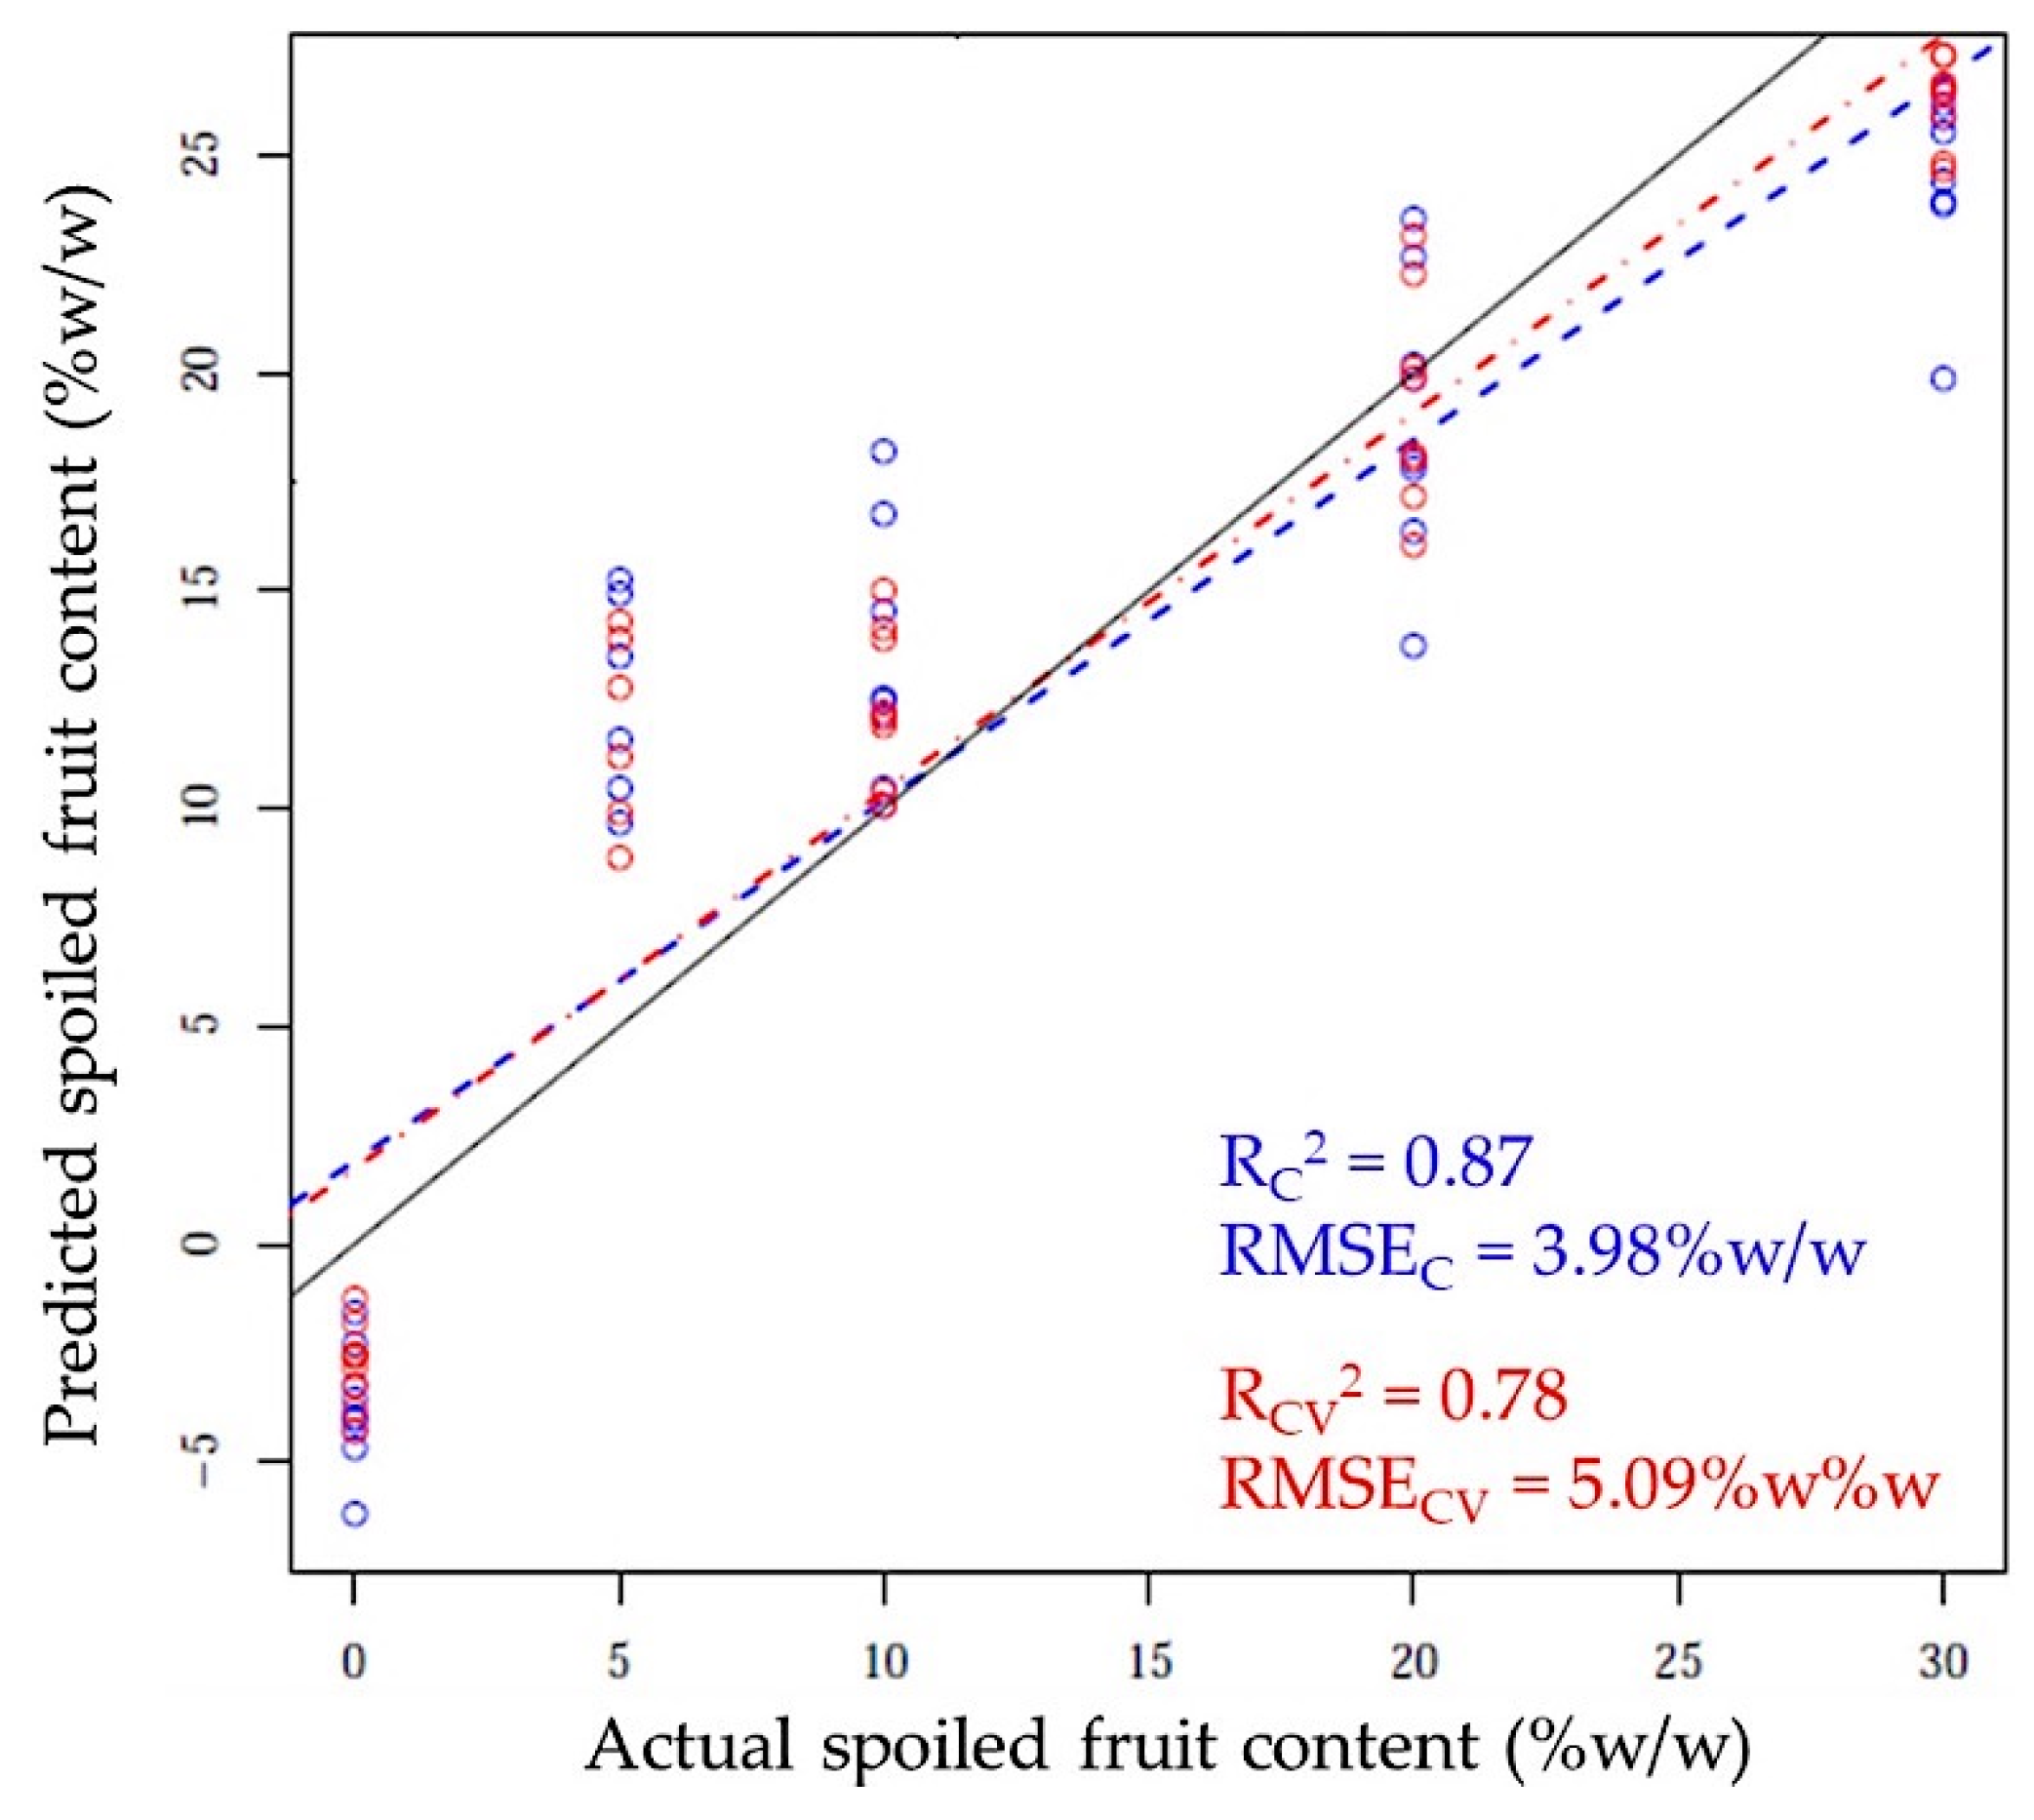
3.2.2. Detection and Quantification of Spoiled Fruit Content in Raw Plum Juices with E-Tongue

Figure 6 shows how effectively the Monilia infected fruit content (“24 °C Injury”) added to the raw juices from the “24 °Control” samples at different concentrations can be separated with LDA based on the results of e-tongue. The increasing concentration level showed an increasing segregation trend along the first discriminant factor from the group of the juice not containing juice from the “24 °C Injury” group. The addition of strikingly different chemical composition of the juices from the spoiled “24 °C Injury” samples allowed an accurate classification. Differentiation of 0, 5, 20, and 30% mixing was achieved with 100% and 86.67% accuracy during model building and validation. During the detection of 10% spoiled fruit content, there was 66.67% misclassification to the 20% group (Table 9).
The PLSR model, constructed to predict the M. fructigena infected fruit content (“24 °C Injury”) in raw “24 °C Control” plum juices (N = 39, and NrLV = 7) estimated the spoiled fruit content with coefficients of determination of 0.87 and 0.78, and root mean square errors of 3.98 and 5.09% w/w during calibration and validation, respectively (Figure 7).

4. Conclusions

The results highlight that the advanced analytical techniques, NIR spectroscopy, and e-tongue combined with chemometrics generally distinguished between infection modes with acceptable accuracy when external sample sets were involved in the validation process. However, it is important to mention that for some sample groups, the results were meagre and storage temperature dependent. Storage conditions generally resulted in a clear difference, so it was worth examining the data separately accordingly. Classification accuracy was typically better for samples stored at 24 °C. By independent LDA prediction, plums that did not yet show signs of M. fructigena infection could be unequivocally identified based on their spectral characteristics. Based on the e-tongue results, plums storage at different temperatures resulted in significant differences in the “Injury” samples. The method distinguished with considerable precision between raw juices containing different percentages of juices from “24 °C Injury” samples when external validation was applied. The predictive PLSR model estimated the spoiled fruit content in plum juices with an error of 5% w/w. This result may be somewhat arguable because cross-validation was used here in the absence of external validation. It should be emphasized that these applications are preliminary, only relatively distant conclusions can be drawn from the results that would be expected for a larger sample size and commercially available fruit juices. The applications and results provide a basis for extending the investigations to commercially available samples.

Author Contributions

All authors contributed to this research. Conceptualization, Z.K.; Data curation, F.V., D.T.N., B.A., J.P.A.B., Z.B., J.-L.Z.Z., V.Z.-M. and Z.G.; Formal analysis, F.V., D.T.N., B.A., J.P.A.B., Z.B., J.-L.Z.Z., Z.G. and Z.K.; Funding acquisition, T.K., V.Z.-M. and Z.K.; Investigation, F.V., D.T.N., B.A., J.P.A.B., Z.B., J.-L.Z.Z., T.K. and V.Z.-M.; Methodology, T.K., Z.G. and Z.K.; Project administration, F.V., J.P.A.B., Z.B., J.-L.Z.Z. and Z.K.; Resources, Z.K.; Software, J.-L.Z.Z., Z.G. and Z.K.; Supervision, Z.G.; Validation, Z.K.; Visualization, F.V. and D.T.N.; Writing—original draft, F.V. and D.T.N.; Writing—review and editing, Z.K. All authors have read and agreed to the published version of the manuscript.

Funding

This research was supported by the European Union and co-financed by the European Social Fund (grant agreement no. EFOP-3.6.3-VEKOP-16-2017-00005) and by the European Union and co-financed by the European Regional Development Fund and the Hungarian Government (grant agreement no. GINOP-2.2.1-18-2020-00025) and by the Thematic Excellence Programme awarded by the Ministry for Innovation and Technology (grant agreement no. NKFIH-831-10/2019). This research was also supported by the Doctoral School of Food Science, MATE (J.P.A.B., B.A., Z.B. and F.V.) and the ÚNKP-21-3-I-MATE/44 (F.V.) New National Excellence Program of the Ministry for Innovation and Technology from the source of the National Research, Development and Innovation Fund.

Institutional Review Board Statement

Not applicable.

Informed Consent Statement

Not applicable.

Data Availability Statement

The data presented in this study are available on request from the corresponding author. The data are not publicly available due to privacy concerns.

Conflicts of Interest

The authors declare no conflict of interest.

References

  1. FAOSTAT Plums and Sloes. Available online: http://data.un.org/Data.aspx?d=FAO&f=itemCode%3A536 (accessed on 22 September 2021).
  2. Mühlbauer, W.; Müller, J. Chapter 9.11—Plum (Prunus Domestica Subsp. Domestica). In Drying Atlas; Mühlbauer, W., Müller, J.B.T.-D.A., Eds.; Woodhead Publishing: Sawston, UK, 2020; pp. 355–363. ISBN 978-0-12-818162-1. [Google Scholar]
  3. Birwal, P.; Deshmukh, G.; Saurabh, S. Plums: A Brief Introduction. J. Food Nutr. Popul. Heal. 2017, 1, 1–5. [Google Scholar]
  4. Sinha, N.K. Handbook of Fruits and Fruit Processing, 2nd ed.; Wiley-Blackwell: Hoboken, NJ, USA, 2012; ISBN 9780813808949. [Google Scholar]
  5. Padayachee, A.; Day, L.; Howell, K.; Gidley, M.J. Complexity and health functionality of plant cell wall fibers from fruits and vegetables. Crit. Rev. Food Sci. Nutr. 2017, 57, 59–81. [Google Scholar] [CrossRef] [PubMed]
  6. Cui, J.; Lian, Y.; Zhao, C.; Du, H.; Han, Y.; Gao, W.; Xiao, H.; Zheng, J. Dietary fibers from fruits and vegetables and their health benefits via modulation of gut microbiota. Compr. Rev. Food Sci. Food Saf. 2019, 18, 1514–1532. [Google Scholar] [CrossRef] [PubMed] [Green Version]
  7. Lara, M.V.; Bonghi, C.; Famiani, F.; Vizzotto, G.; Walker, R.P.; Drincovich, M.F. Stone fruit as biofactories of phytochemicals with potential roles in human nutrition and health. Front. Plant Sci. 2020, 11, 1323. [Google Scholar] [CrossRef]
  8. Igwe, E.O.; Charlton, K.E. A systematic review on the health effects of plums (Prunus domestica and Prunus salicina). Phyther. Res. 2016, 30, 701–731. [Google Scholar] [CrossRef]
  9. Topp, B.L.; Russell, D.M.; Neumüller, M.; Dalbó, M.A.; Liu, W. Plum. In Fruit Breeding; Springer: Berlin, Germany, 2012; pp. 571–621. [Google Scholar]
  10. Miranda-Castro, S.P. Chapter 3—Application of Chitosan in Fresh and Minimally Processed Fruits and Vegetables. In Chitosan in the Preservation of Agricult Application of Chitosan in Fresh and Minimally Processed Fruits and Vegetablesural Commodities; Academic Press: Cambridge, MA, USA, 2016; pp. 67–113. ISBN 9780128027356. [Google Scholar]
  11. Elik, A.; Yanik, D.K.; Istanbullu, Y.; Guzelsoy, N.A.; Yavuz, A.; Gogus, F. Strategies to reduce post-harvest losses for fruits and vegetables. Strategies 2019, 5, 29–39. [Google Scholar]
  12. Aiello, D.; Restuccia, C.; Stefani, E.; Vitale, A.; Cirvilleri, G. Postharvest biocontrol ability of Pseudomonas synxantha against Monilinia fructicola and Monilinia fructigena on stone fruit. Postharvest Biol. Technol. 2019, 149, 83–89. [Google Scholar] [CrossRef]
  13. Singh, D.; Sharma, R.R. Postharvest Diseases of Fruits and Vegetables and Their Management; Elsevier Inc.: Amsterdam, The Netherlands, 2018. [Google Scholar]
  14. Oliveira Lino, L.; Pacheco, I.; Mercier, V.; Faoro, F.; Bassi, D.; Bornard, I.; Quilot-Turion, B. Brown Rot Strikes Prunus Fruit: An Ancient Fight Almost Always Lost. J. Agric. Food Chem. 2016, 64, 4029–4047. [Google Scholar] [CrossRef] [PubMed] [Green Version]
  15. Petróczy, M.; Szigethy, A.; Palkovics, L. Monilinia species in Hungary: Morphology, culture characteristics, and molecular analysis. Trees Struct. Funct. 2012, 26, 153–164. [Google Scholar] [CrossRef]
  16. Barkai-Golan, R. Postharvest Diseases of Fruits and Vegetables: Development and Control; Elsevier: Amsterdam, The Netherlands, 2001; ISBN 0080539297. [Google Scholar]
  17. Xie, L.; Wang, A.; Xu, H.; Fu, X.; Ying, Y. Applications of near-infrared systems for quality evaluation of fruits: A review. Trans. ASABE 2016, 59, 399–419. [Google Scholar]
  18. Aouadi, B.; Zaukuu, J.-L.Z.; Vitális, F.; Bodor, Z.; Fehér, O.; Gillay, Z.; Bazar, G.; Kovacs, Z. Historical evolution and food control achievements of near infrared spectroscopy, electronic nose, and electronic tongue—Critical overview. Sensors 2020, 20, 5479. [Google Scholar] [CrossRef] [PubMed]
  19. Chandrasekaran, I.; Panigrahi, S.S.; Ravikanth, L.; Singh, C.B. Potential of Near-Infrared (NIR) Spectroscopy and Hyperspectral Imaging for Quality and Safety Assessment of Fruits: An Overview. Food Anal. Methods 2019, 12, 2438–2458. [Google Scholar] [CrossRef]
  20. Li, M.; Lv, W.; Zhao, R.; Guo, H.; Liu, J.; Han, D. Non-destructive assessment of quality parameters in ‘Friar’ plums during low temperature storage using visible/near infrared spectroscopy. Food Control 2017, 73, 1334–1341. [Google Scholar] [CrossRef]
  21. Pérez-Marín, D.; Paz, P.; Guerrero, J.-E.; Garrido-Varo, A.; Sánchez, M.-T. Miniature handheld NIR sensor for the on-site non-destructive assessment of post-harvest quality and refrigerated storage behavior in plums. J. Food Eng. 2010, 99, 294–302. [Google Scholar] [CrossRef]
  22. Zhao, Z.L.; Wang, Y.W.; Gong, D.J.; Niu, X.Y.; Cheng, W.; Gu, Y.H. Discrimination of plum browning with near infrared spectroscopy. Guang Pu Xue Yu Guang Pu Fen Xi 2016, 36, 2089–2093. [Google Scholar] [PubMed]
  23. Siedliska, A.; Baranowski, P.; Zubik, M.; Mazurek, W.; Sosnowska, B. Detection of fungal infections in strawberry fruit by VNIR/SWIR hyperspectral imaging. Postharvest Biol. Technol. 2018, 139, 115–126. [Google Scholar] [CrossRef]
  24. Folch-Fortuny, A.; Prats-Montalbán, J.M.; Cubero, S.; Blasco, J.; Ferrer, A. VIS/NIR hyperspectral imaging and N-way PLS-DA models for detection of decay lesions in citrus fruits. Chemom. Intell. Lab. Syst. 2016, 156, 241–248. [Google Scholar] [CrossRef] [Green Version]
  25. Liu, Q.; Zhou, D.; Tu, S.; Xiao, H.; Zhang, B.; Sun, Y.; Pan, L.; Tu, K. Quantitative visualization of fungal contamination in peach fruit using hyperspectral imaging. Food Anal. Methods 2020, 13, 1262–1270. [Google Scholar] [CrossRef]
  26. Everstine, K.; Spink, J.; Kennedy, S. Economically Motivated Adulteration (EMA) of Food: Common Characteristics of EMA Incidents. J. Food Prot. 2013, 76, 723–735. [Google Scholar] [CrossRef]
  27. Xu, L.; Xu, Z.; Liao, X. A review of fruit juice authenticity assessments: Targeted and untargeted analyses. Crit. Rev. Food Sci. Nutr. 2021, 1–22. [Google Scholar] [CrossRef] [PubMed]
  28. Ellis, D.I.; Brewster, V.L.; Dunn, W.B.; Allwood, J.W.; Golovanov, A.P.; Goodacre, R. Fingerprinting food: Current technologies for the detection of food adulteration and contamination. Chem. Soc. Rev. 2012, 41, 5706–5727. [Google Scholar] [CrossRef] [PubMed]
  29. Peris, M.; Escuder-Gilabert, L. Electronic noses and tongues to assess food authenticity and adulteration. Trends Food Sci. Technol. 2016, 58, 40–54. [Google Scholar] [CrossRef] [Green Version]
  30. Bengtsson, G.B.; Lundby, F.; Haugen, J.-E. Rapid analytical techniques for measurement of plum ripeness postharvest. In Proceedings of the VIII International Symposium on Plum and Prune Genetics, Breeding and Pomology 734, Lofthus, Norway, 5 September 2004; pp. 211–216. [Google Scholar]
  31. Rudnitskaya, A.; Legin, A.; Makarychev-Mikhailov, S.; Goryacheva, O.; Vlasov, Y. Quality monitoring of fruit juices using an electronic tongue. Anal. Sci. 2002, 17, i309–i312. [Google Scholar]
  32. Hong, X.; Wang, J.; Qiu, S. Authenticating cherry tomato juices—Discussion of different data standardization and fusion approaches based on electronic nose and tongue. Food Res. Int. 2014, 60, 173–179. [Google Scholar] [CrossRef]
  33. Hong, X.; Wang, J. Detection of adulteration in cherry tomato juices based on electronic nose and tongue: Comparison of different data fusion approaches. J. Food Eng. 2014, 126, 89–97. [Google Scholar] [CrossRef]
  34. Wang, H.; Sun, H. Potential use of electronic tongue coupled with chemometrics analysis for early detection of the spoilage of Zygosaccharomyces rouxii in apple juice. Food Chem. 2019, 290, 152–158. [Google Scholar] [CrossRef]
  35. Poniatowska, A.; Michalecka, M.; Bielenin, A. Characteristic of Monilinia spp. fungi causing brown rot of pome and stone fruits in Poland. Eur. J. Plant Pathol. 2013, 135, 855–865. [Google Scholar] [CrossRef]
  36. NCBI Basic Local Alignment Search Tool. Available online: https://blast.ncbi.nlm.nih.gov/Blast.cgi (accessed on 16 September 2021).
  37. Alpha, M.O.S. αAstree Electronic Tongue User Manual. Available online: https://www.alpha-mos.com/astree-taste-analysis (accessed on 5 July 2020).
  38. Kovács, Z. Módszer Elektronikus Nyelvvel Végzett Méréseknél Fellépő Zavaró Hatások Csökkentésére = Method to Decrease the Disturbing Effects Occurring by the Electronic Tongue Measurement; Budapesti Corvinus Egyetem: Budapest, Hungary, 2012. [Google Scholar]
  39. Kovacs, Z.; Szöllosi, D.; Zaukuu, J.-L.Z.; Bodor, Z.; Vitális, F.; Aouadi, B.; Zsom-Muha, V.; Gillay, Z. Factors influencing the long-term stability of electronic tongue and application of improved drift correction methods. Biosensors 2020, 10, 74. [Google Scholar] [CrossRef] [PubMed]
  40. de Morais, T.C.B.; Rodrigues, D.R.; de Carvalho Polari Souto, U.T.; Lemos, S.G. A simple voltammetric electronic tongue for the analysis of coffee adulterations. Food Chem. 2019, 273, 31–38. [Google Scholar] [CrossRef] [PubMed]
  41. Kovacs, Z.; Pollner, B. Aquaphotomics-Software R-Package “aquap2“. In Proceedings of the Understanding Water in Biology 2nd International Symposium, Kobe, Japan, 26–29 November 2016; pp. 26–29. [Google Scholar]
Figure 1. NIR spectra of control and infected plums samples from measurement day 8 (N = 357).
Chemosensors 09 00355 g001
Figure 2. PCA-LDA classification model on the NIRS data of control and infected plums from measurement day 8 with first parallel sample data validation when the different treatment groups were used as class variable (N = 357, NrPCs = 12).
Chemosensors 09 00355 g002
Figure 3. PCA-LDA classification model on the NIRS data of control and infected plums from measurement day 8 with external validation when the inoculation mode was used as class variable: (a) PCA-LDA of samples stored at 5 °C (N = 177, and NrPCs = 16); (b) PCA-LDA of samples stored at 24 °C (N = 180, and NrPCs = 10).
Chemosensors 09 00355 g003
Figure 4. LDA classification model on the e-tongue data of control and infected raw plum juices with second parallel sample validation when the different treatment groups were used as class variables (N = 51).
Chemosensors 09 00355 g004
Figure 5. LDA classification model on the e-tongue data of control and infected plum juices with external validation when the inoculation mode was used as class variable: (a) LDA of samples stored at 5 °C (N = 25); and (b) LDA of samples stored at 24 °C (N = 26).
Chemosensors 09 00355 g005
Figure 6. LDA classification models on the e-tongue data of raw plum juice mixtures with second parallel sample validation when the “24 °C Injury” fruit content was used as class variable (N = 39).
Chemosensors 09 00355 g006
Figure 7. PLSR prediction of “24 °C Injury” fruit content in raw plum juices with “LOO” cross-validation (N = 39).
Chemosensors 09 00355 g007
Table 1. Infection of plums with Monilia fructigena.
Sample NameSample CountMode of Inoculation
Control2 × 5There was no infection.
Injury2 × 5A cut of about −1 cm was applied to the fruit surface with a sterile knife tip. The plums were infected via this wound with culture medium edge interlaced with fungal mycelia by using sterile inoculation loops.
Intact2 × 5The sound fruit surface was inoculated in a circle about 1 cm in diameter with culture medium edge interlaced with fungal mycelia by using sterile inoculation loops.
Table 2. PCA-LDA classification model on the NIRS data of control and infected plums from measurement day 8 with first parallel sample data validation when the different treatment groups were used as class variable (N = 357, NrPCs = 12).
Accuracy%24 °C
Control
24 °C
Injury
24 °C
Intact
5 °C
Control
5 °C
Injury
5 °C
Intact
Correct
Classification
Recognition
N = 289
24 °C Control67.395.2622.4506.67072.29%
24 °C Injury6.5294.740000
24 °C Intact17.39077.5510.4200
5 °C Control00050.0026.6716.33
5 °C Injury8.70012.5064.444.08
5 °C Intact00027.082.2279.59
Validation
N = 68
24 °C Control100033.33020.0013.3356.67%
24 °C Injury01000000
24 °C Intact0033.33000
5 °C Control00040.0040.0040.00
5 °C Injury000040.0020.00
5 °C Intact0033.3360026.67
Table 3. PCA-LDA classification model on the NIRS data of control and infected plums stored at 5 °C with 5th parallel sample data validation when the inoculation mode was used as class variable (N = 177, and LV = 16).
Accuracy%5 °C
Control
5 °C
Injury
5 °C
Intact
Correct
Classification
Recognition
N = 144
5 °C Control68.297.4112.2474.41%
5 °C Injury9.7681.4814.29
5 °C Intact21.9511.1173.47
Validation
N = 33
5 °C Control050.00043.33%
5 °C Injury8.3350.0020.00
5 °C Intact91.67080.00
Table 4. PCA-LDA classification model on the NIRS data of control and infected plums stored at 24 °C with 4th parallel sample data validation when the inoculation mode was used as class variable (N = 180, and NrPCs = 10).
Accuracy%24 °C
Control
24 °C
Injury
24 °C
Intact
Correct
Classification
Recognition
N = 145
24 °C Control93.025.5631.8285.21%
24 °C Injury094.440
24 °C Intact6.98068.18
Validation
N = 35
24 °C Control23.08014.2966.82%
24 °C Injury23.0891.670
24 °C Intact53.858.3385.71
Table 5. Appearance of visible signs of M. fructigena infection on “24 °C Injury” plums stored for 8 d (― plums with no visible sign of infection; and + plums with the visible sign of infection) and the early detectability (*) of the infection with NIR spectroscopy.
Sample Sets Storage DayPlum 1.Plum 2.Plum 3.Plum 4.Plum 5.
VisNIRVisNIRVisNIRVisNIRVisNIR
Independent prediction setDay 1.+ *+ *+ *+ *+ *
Day 2.+ *+ *+ *+ *+ *
Model building setDay 3.+++
Day 4.+++
Day 5.++++
Day 6.+++++
Day 7.+++++
Day 8.+++++
Table 6. LDA classification model on the e-tongue data of control and infected raw plum juices with second parallel sample validation when the different treatment groups were used as class variable (N = 51).
Accuracy 24 °C
Control
24 °C
Injury
24 °C
Intact
5 °C
Control
5 °C
Injury
5 °C
Intact
Correct
Classification
Recognition
N = 35
24 °C Control83.330016.6716.67088.89%
24 °C Injury01000000
24 °C Intact00100000
5 °C Control00066.6700
5 °C Injury16.670016.6783.330
5 °C Intact00000100
Validation
N = 16
24 °C Control66.67033.3300063.89%
24 °C Injury010000050.00
24 °C Intact0066.67000
5 °C Control000000
5 °C Injury33.330050.001000
5 °C Intact00050.00050.00
Table 7. LDA classification model on the e-tongue data of control and infected plum juices stored at 5 °C with second parallel sample validation when the inoculation mode was used as class variable (N = 25).
Accuracy 5 °C
Control
5 °C
Injury
5 °C
Intact
Correct
Classification
Recognition
N = 18
5 °C Control10000100%
5 °C Injury01000
5 °C Intact00100
Validation
N = 7
5 °C Control00066.67%
5 °C Injury501000
5 °C Intact500100
Table 8. LDA classification model on the e-tongue data of control and infected plum juices stored at 24 °C with first parallel sample validation when the inoculation mode was used as class variable (N = 26).
Accuracy 24 °C
Control
24 °C
Injury
24 °C
Intact
Correct
Classification
Recognition
N = 18
24 °C Control10000100%
24 °C Injury01000
24 °C Intact00100
Validation
N = 8
24 °C Control10000100%
24 °C Injury01000
24 °C Intact00100
Table 9. LDA classification models on the e-tongue results of raw plum juice mixtures with second parallel sample validation when the “24 °C Injury” fruit content was used as class variable (N = 39).
Accuracy 24 °C
Control
24 °C
Control + Injury 5%
24 °C
Control + Injury 10%
24 °C
Control + Injury 20%
24 °C
Control + Injury 30%
Correct
Classification
Recognition
N = 25
24 °C Control1000000100%
24 °C Control + Injury 5%0100000
24 °C Control + Injury 10%0010000
24 °C Control + Injury 20%0001000
24 °C Control + Injury 30%0000100
Validation
N = 14
24 °C Control100000086.67%
24 °C Control + Injury 5%01000 00
24 °C Control + Injury 10%0033.3300
24 °C Control + Injury 20%0066.671000
24 °C Control + Injury 30%0000100
Publisher’s Note: MDPI stays neutral with regard to jurisdictional claims in published maps and institutional affiliations.

