
Recent Progress in the Correlative Structured Illumination Microscopy

 , , ,
, , ,
Abstract
:1. Introduction
2. Principle of Structured Illumination Microscopy
3. Research Progress in Correlative Structural Illumination Super-Resolution Microscopic Techniques
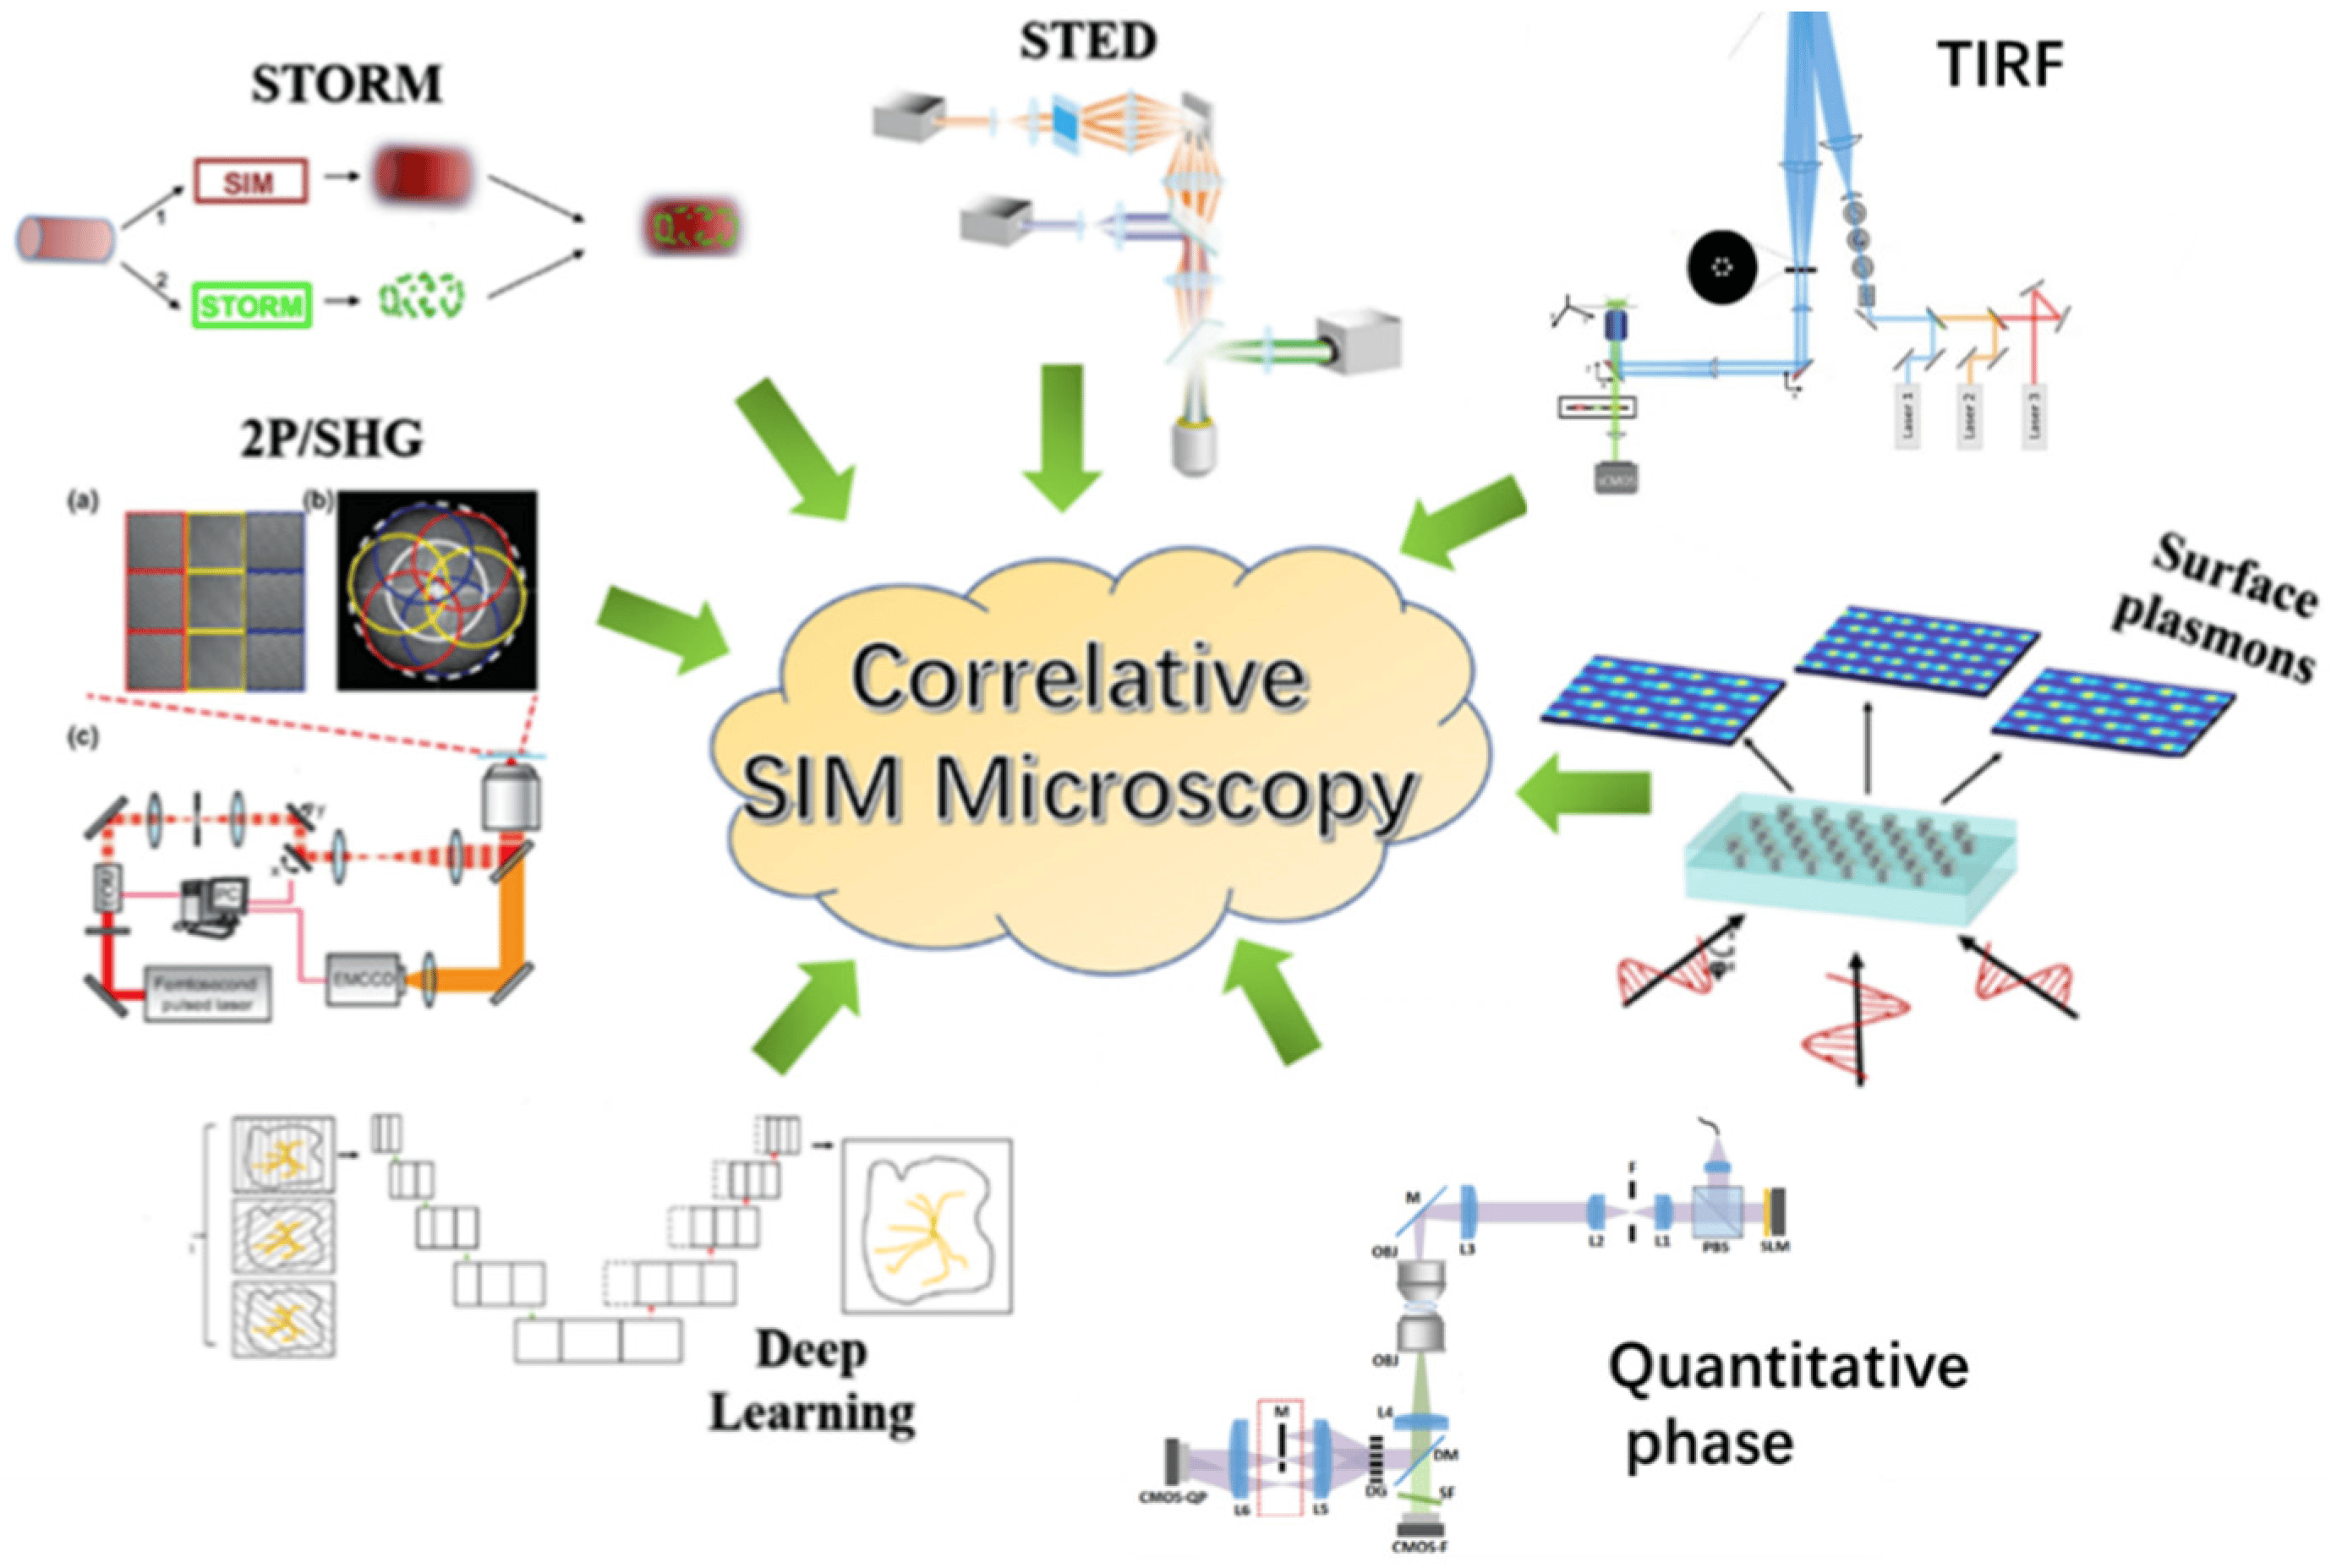
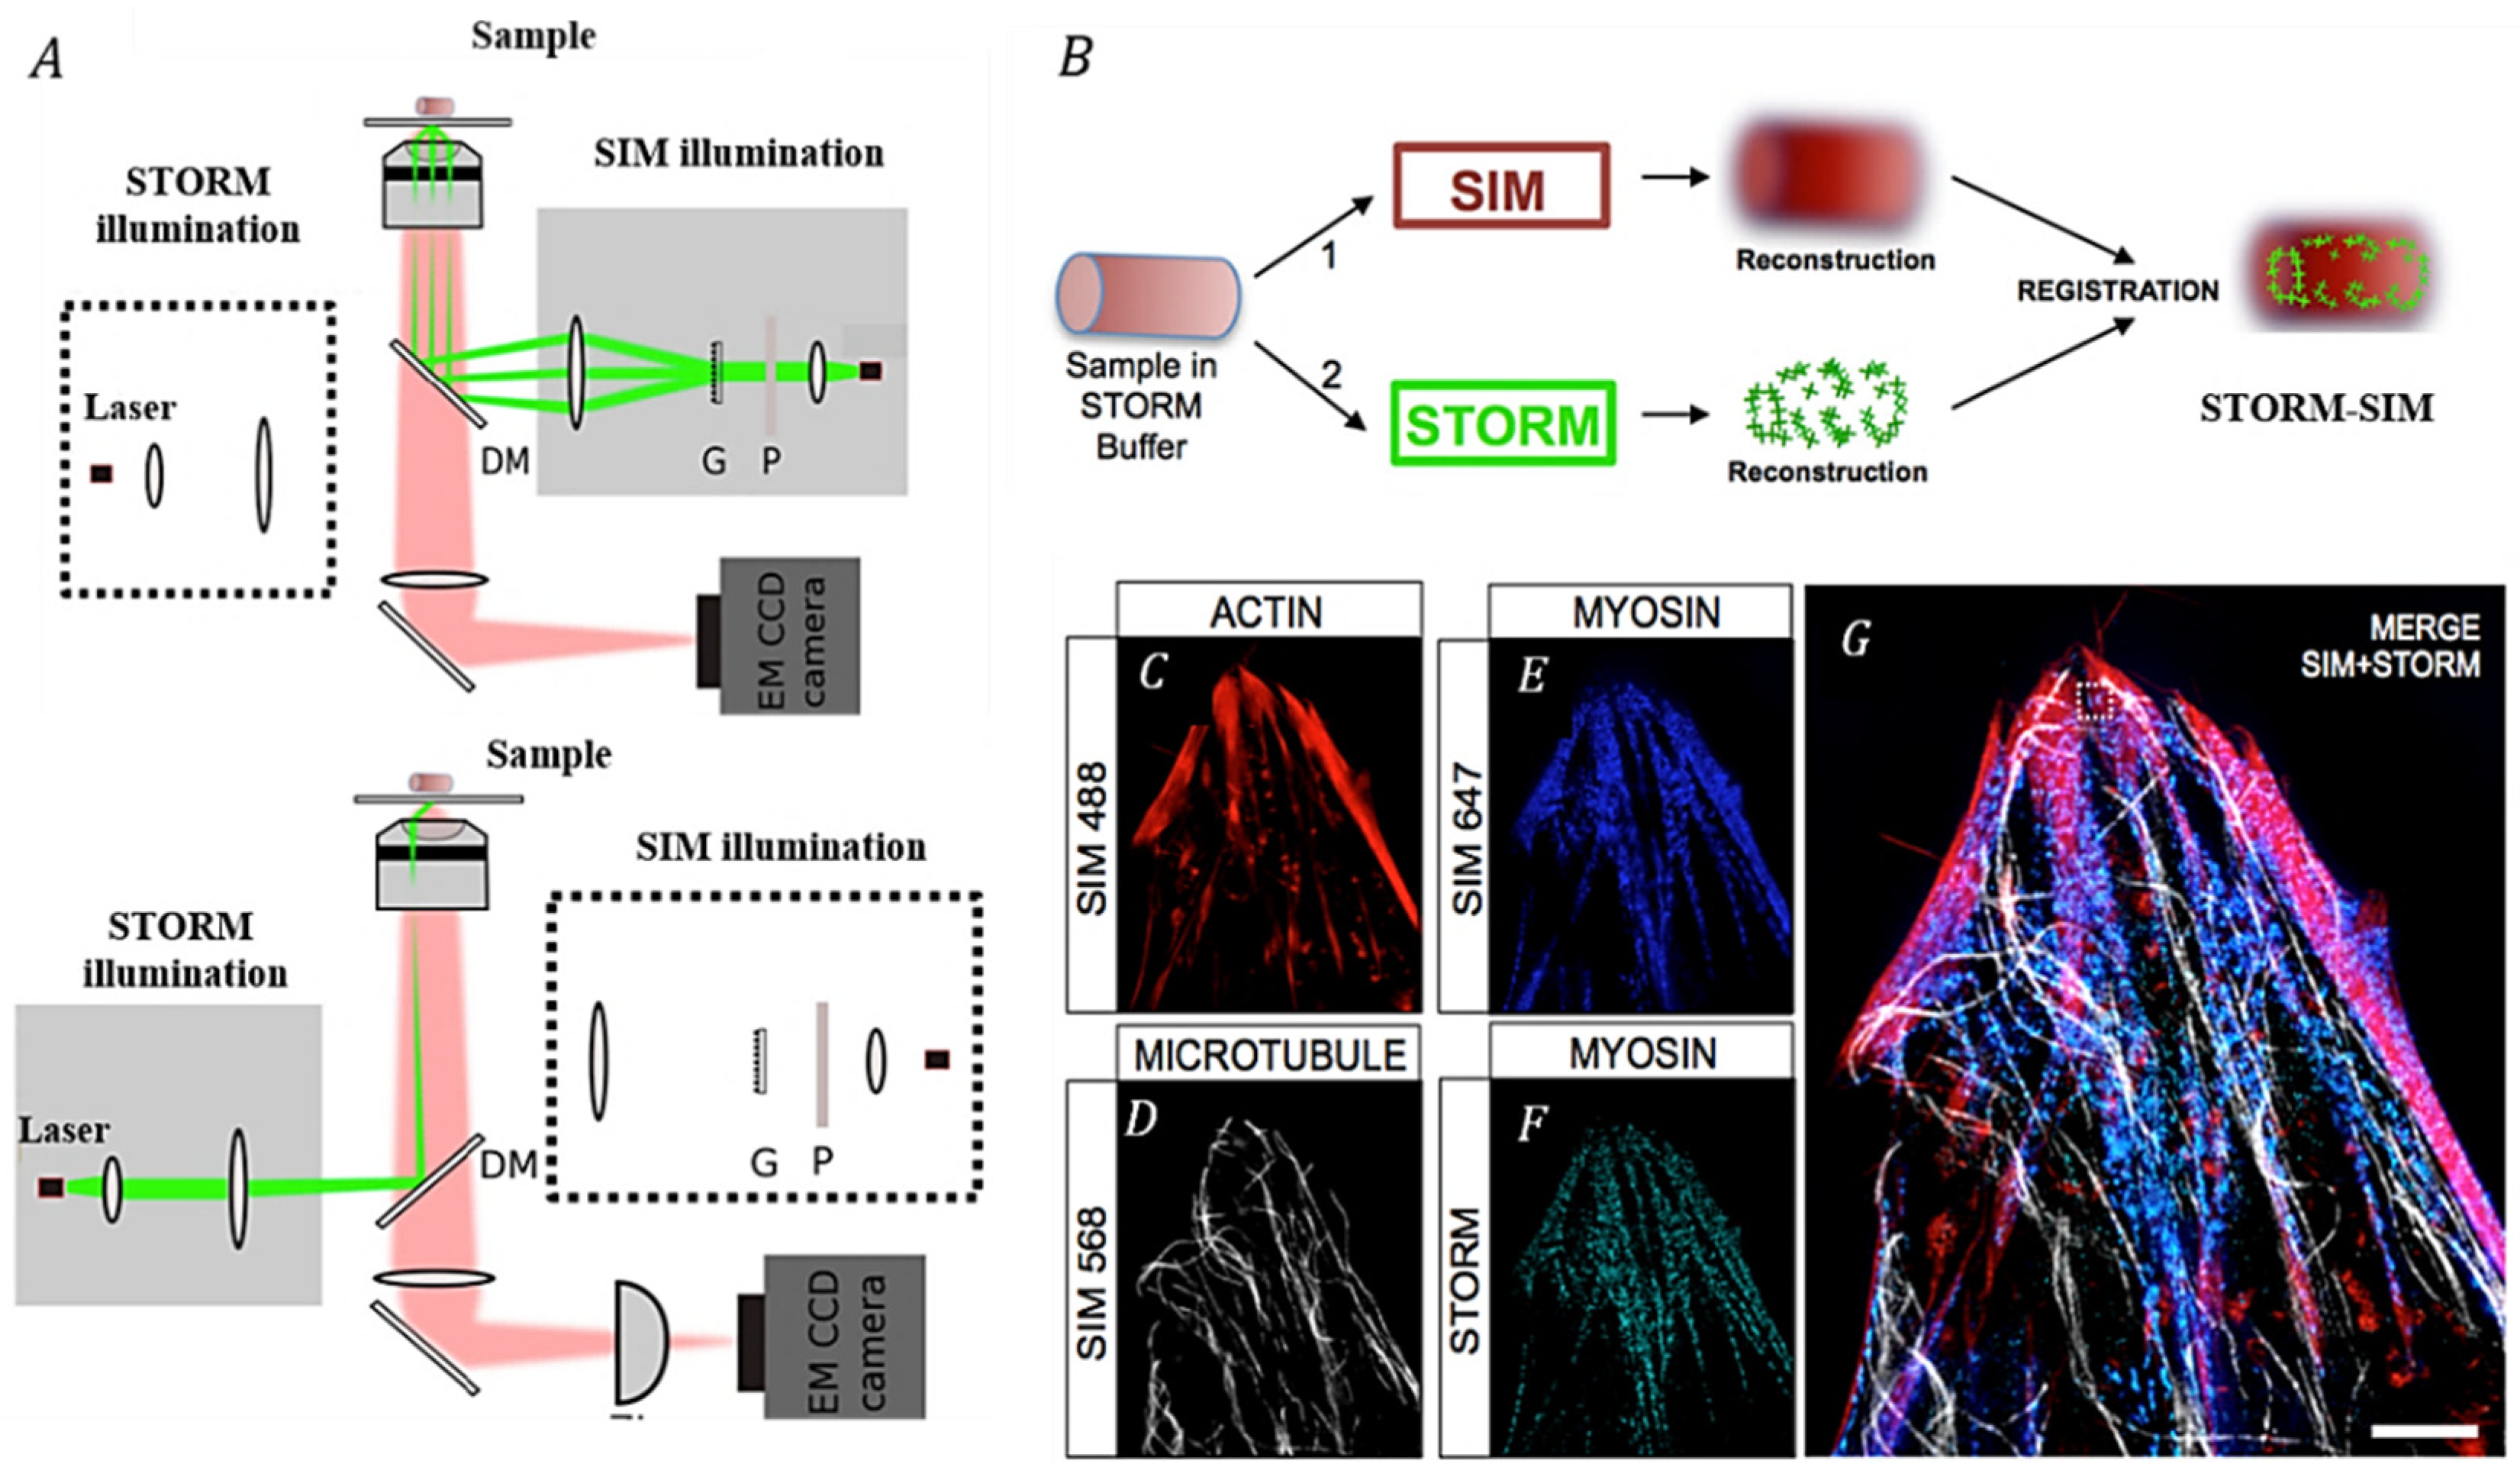
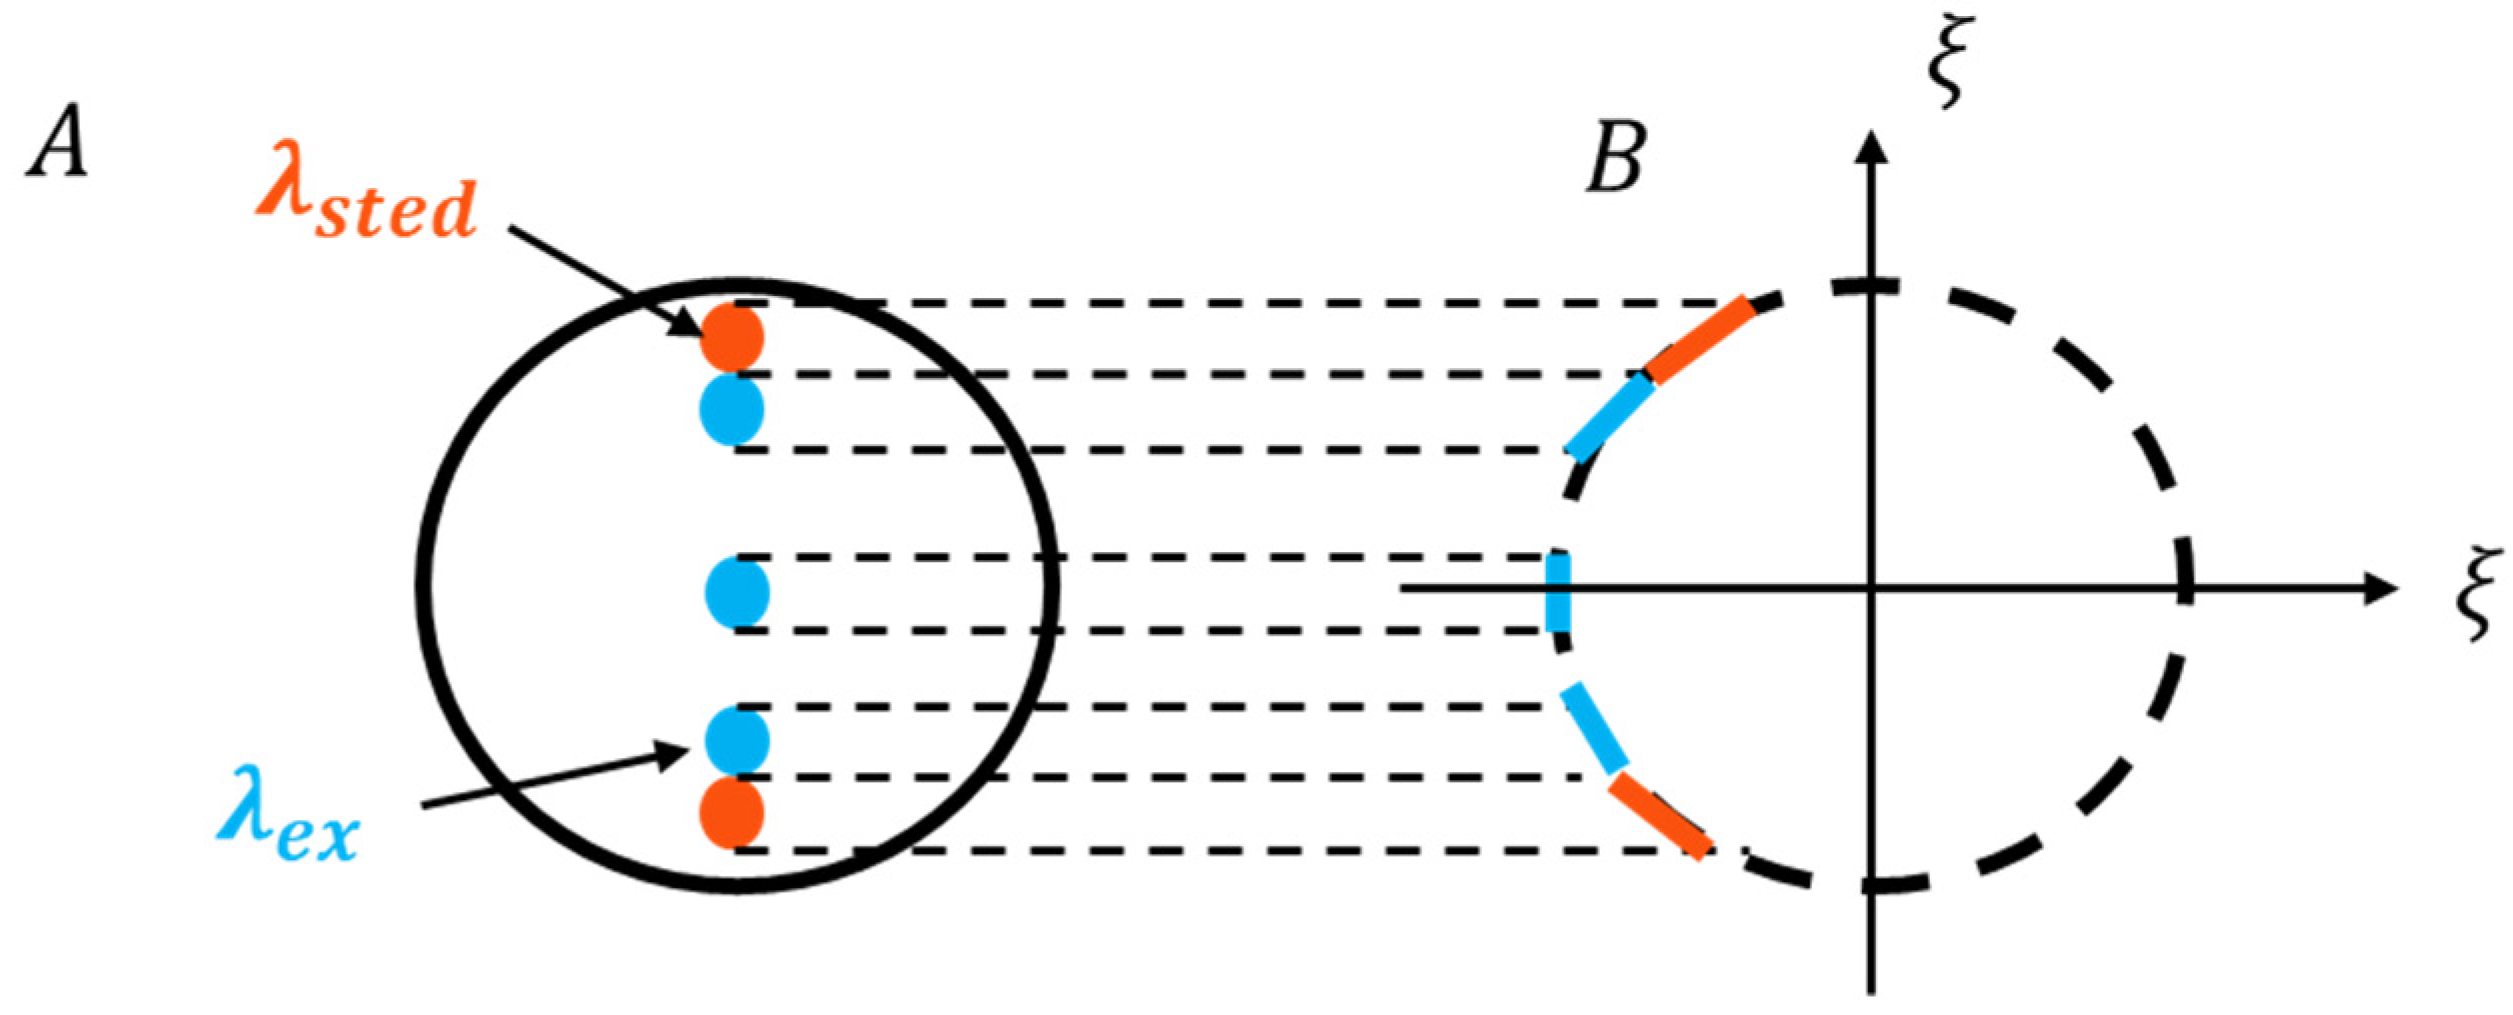
3.1. Correlating SIM with Other SRM Techniques
3.2. Correlating SIM with Other Microscopy Techniques
3.2.1. Correlating SIM with Total Internal Reflection Fluorescence Microscopy Techniques
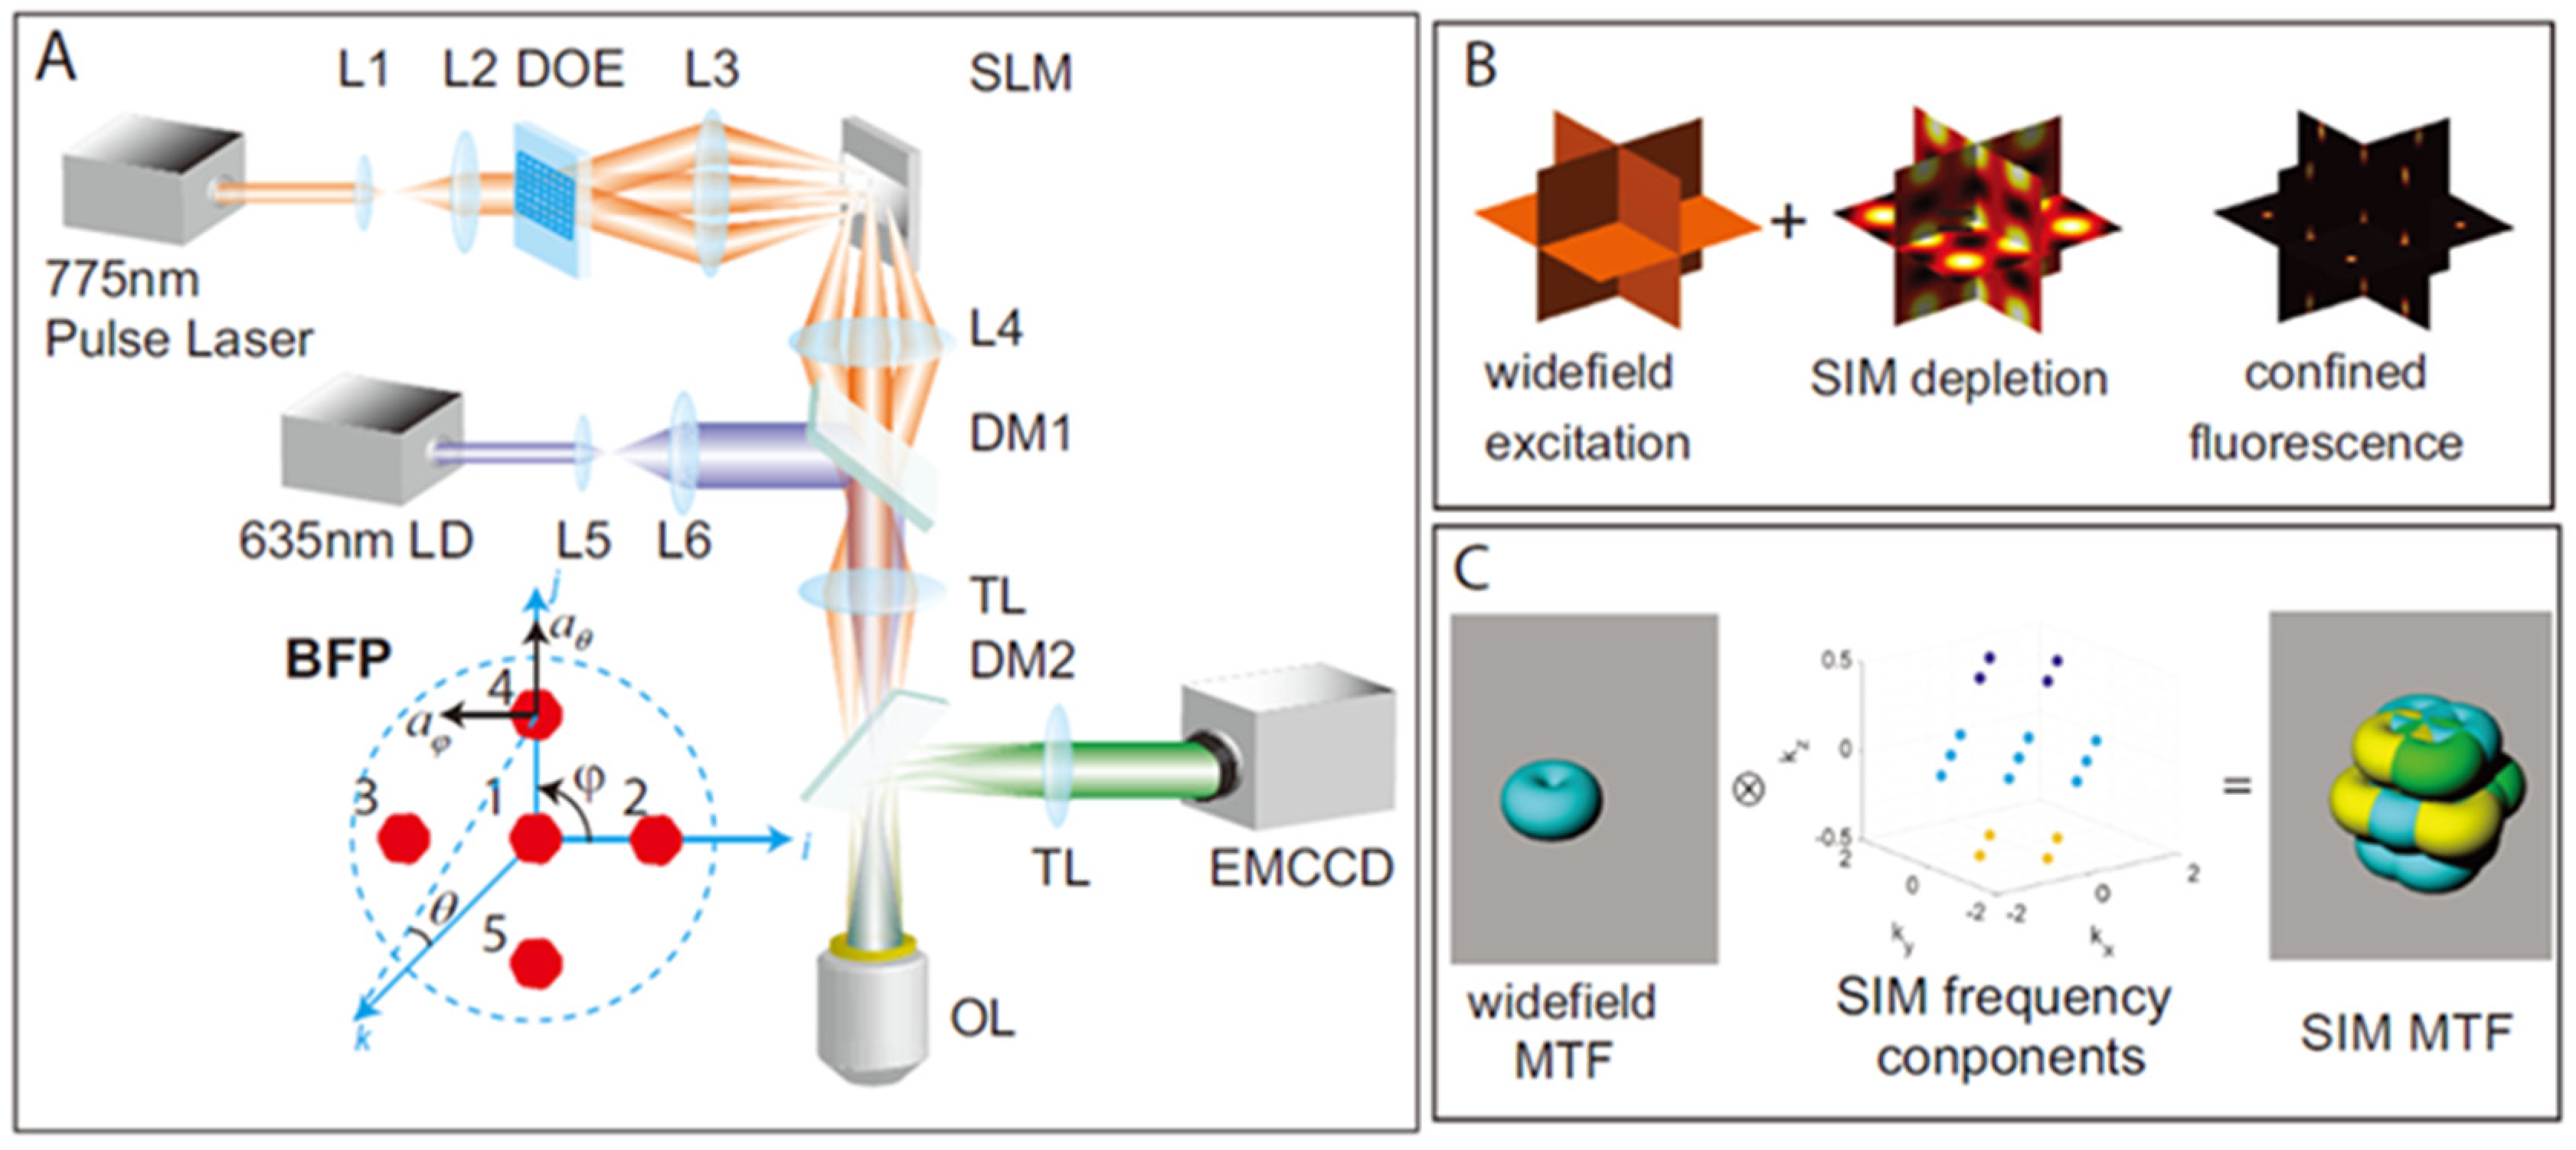
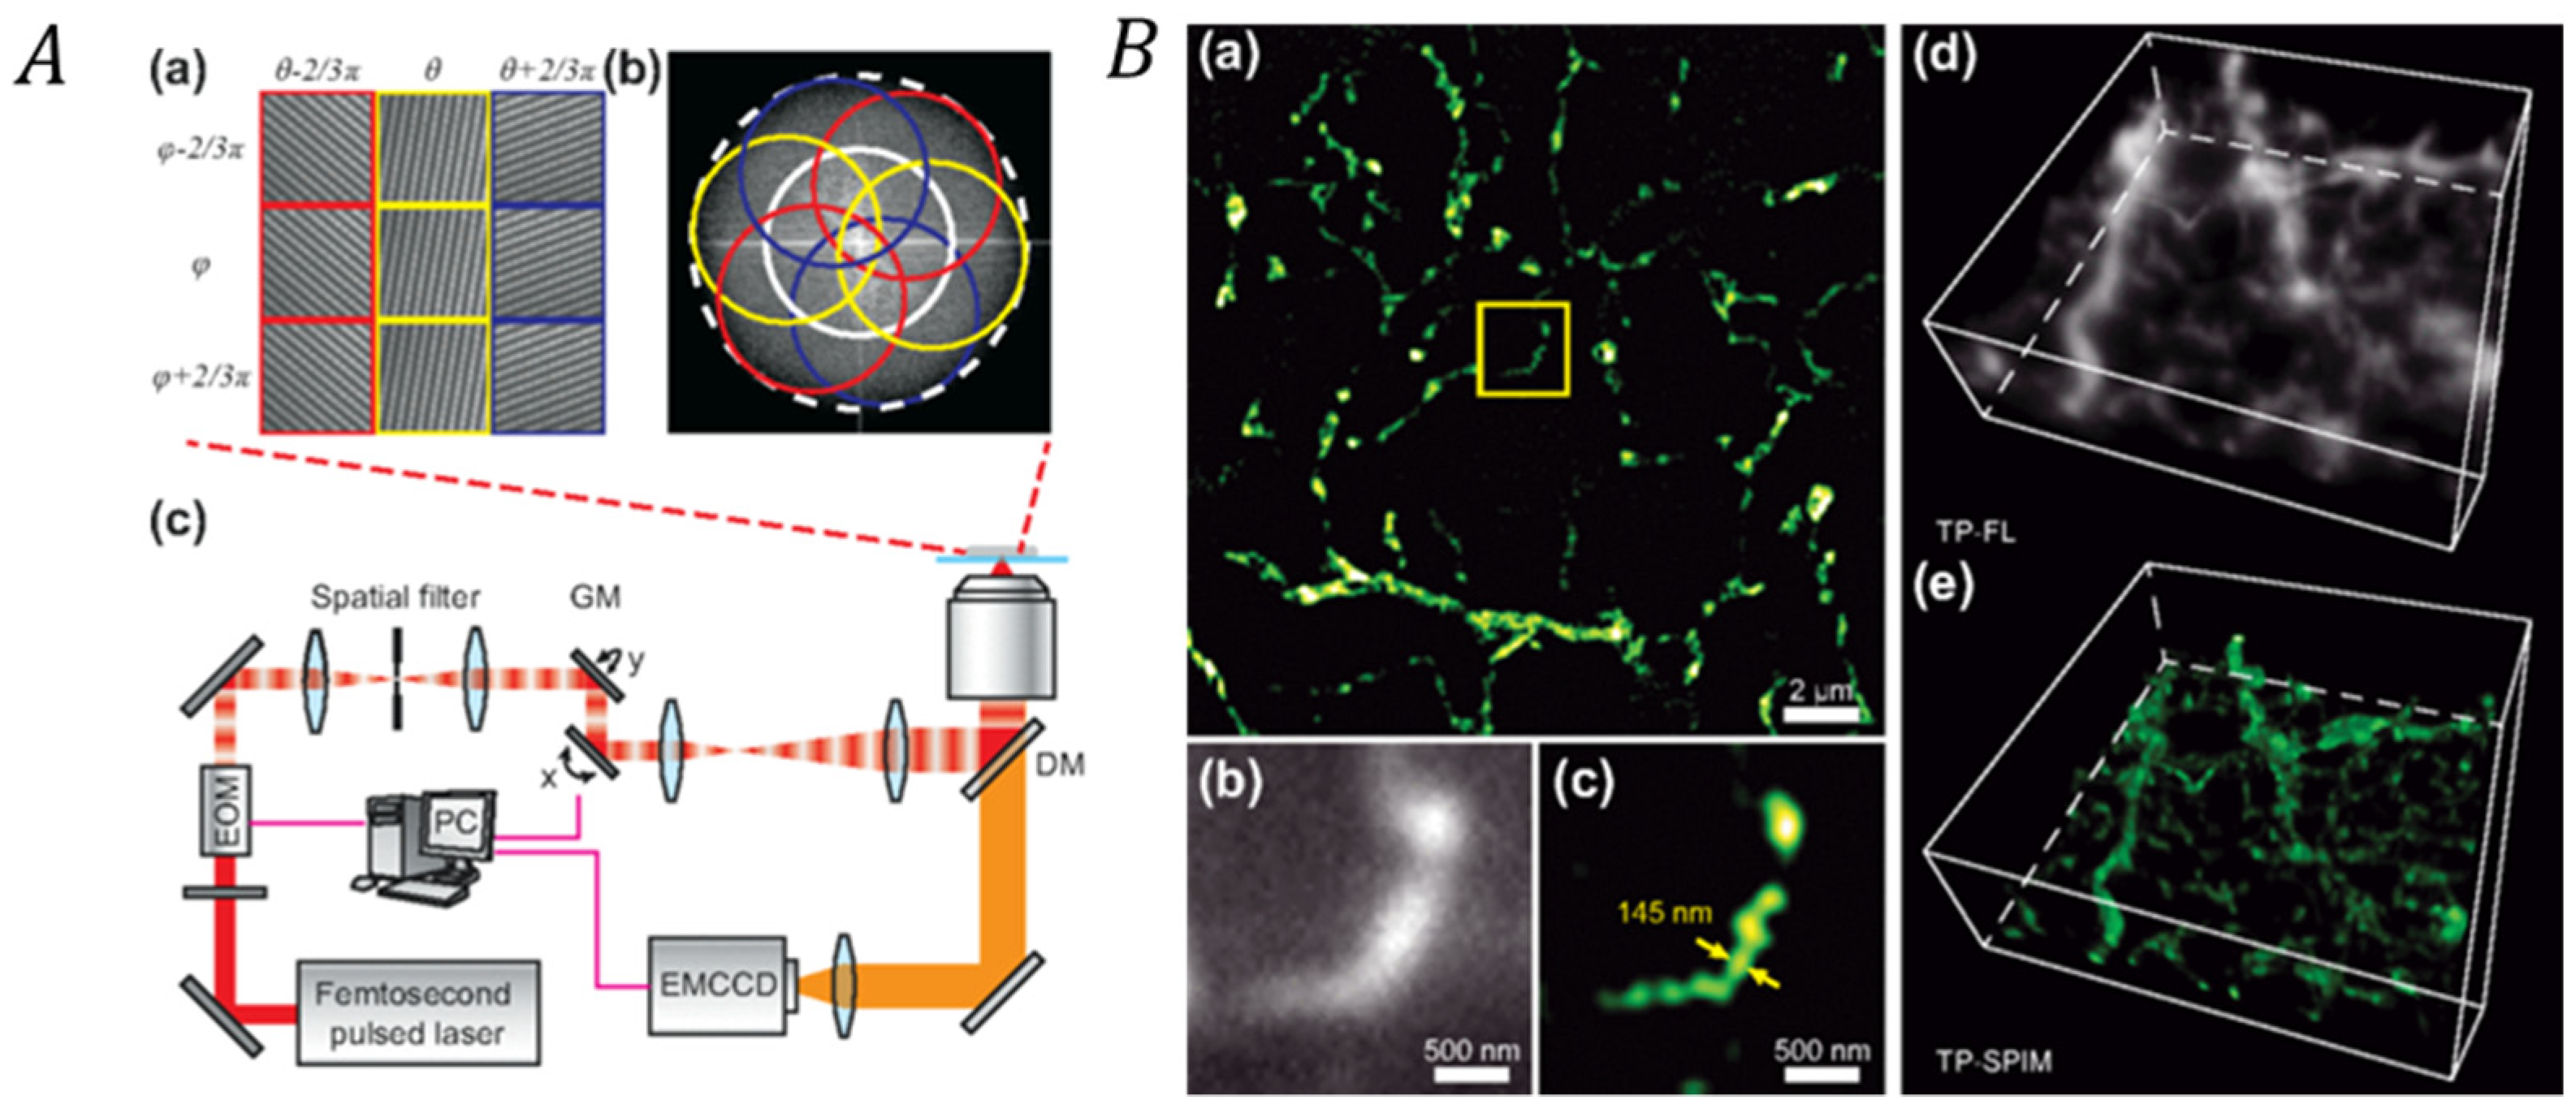
3.2.2. Correlating SIM with Two-Photon/Second Harmonic Generation Microscopy Techniques
3.3. Correlating SIM with Other Techniques
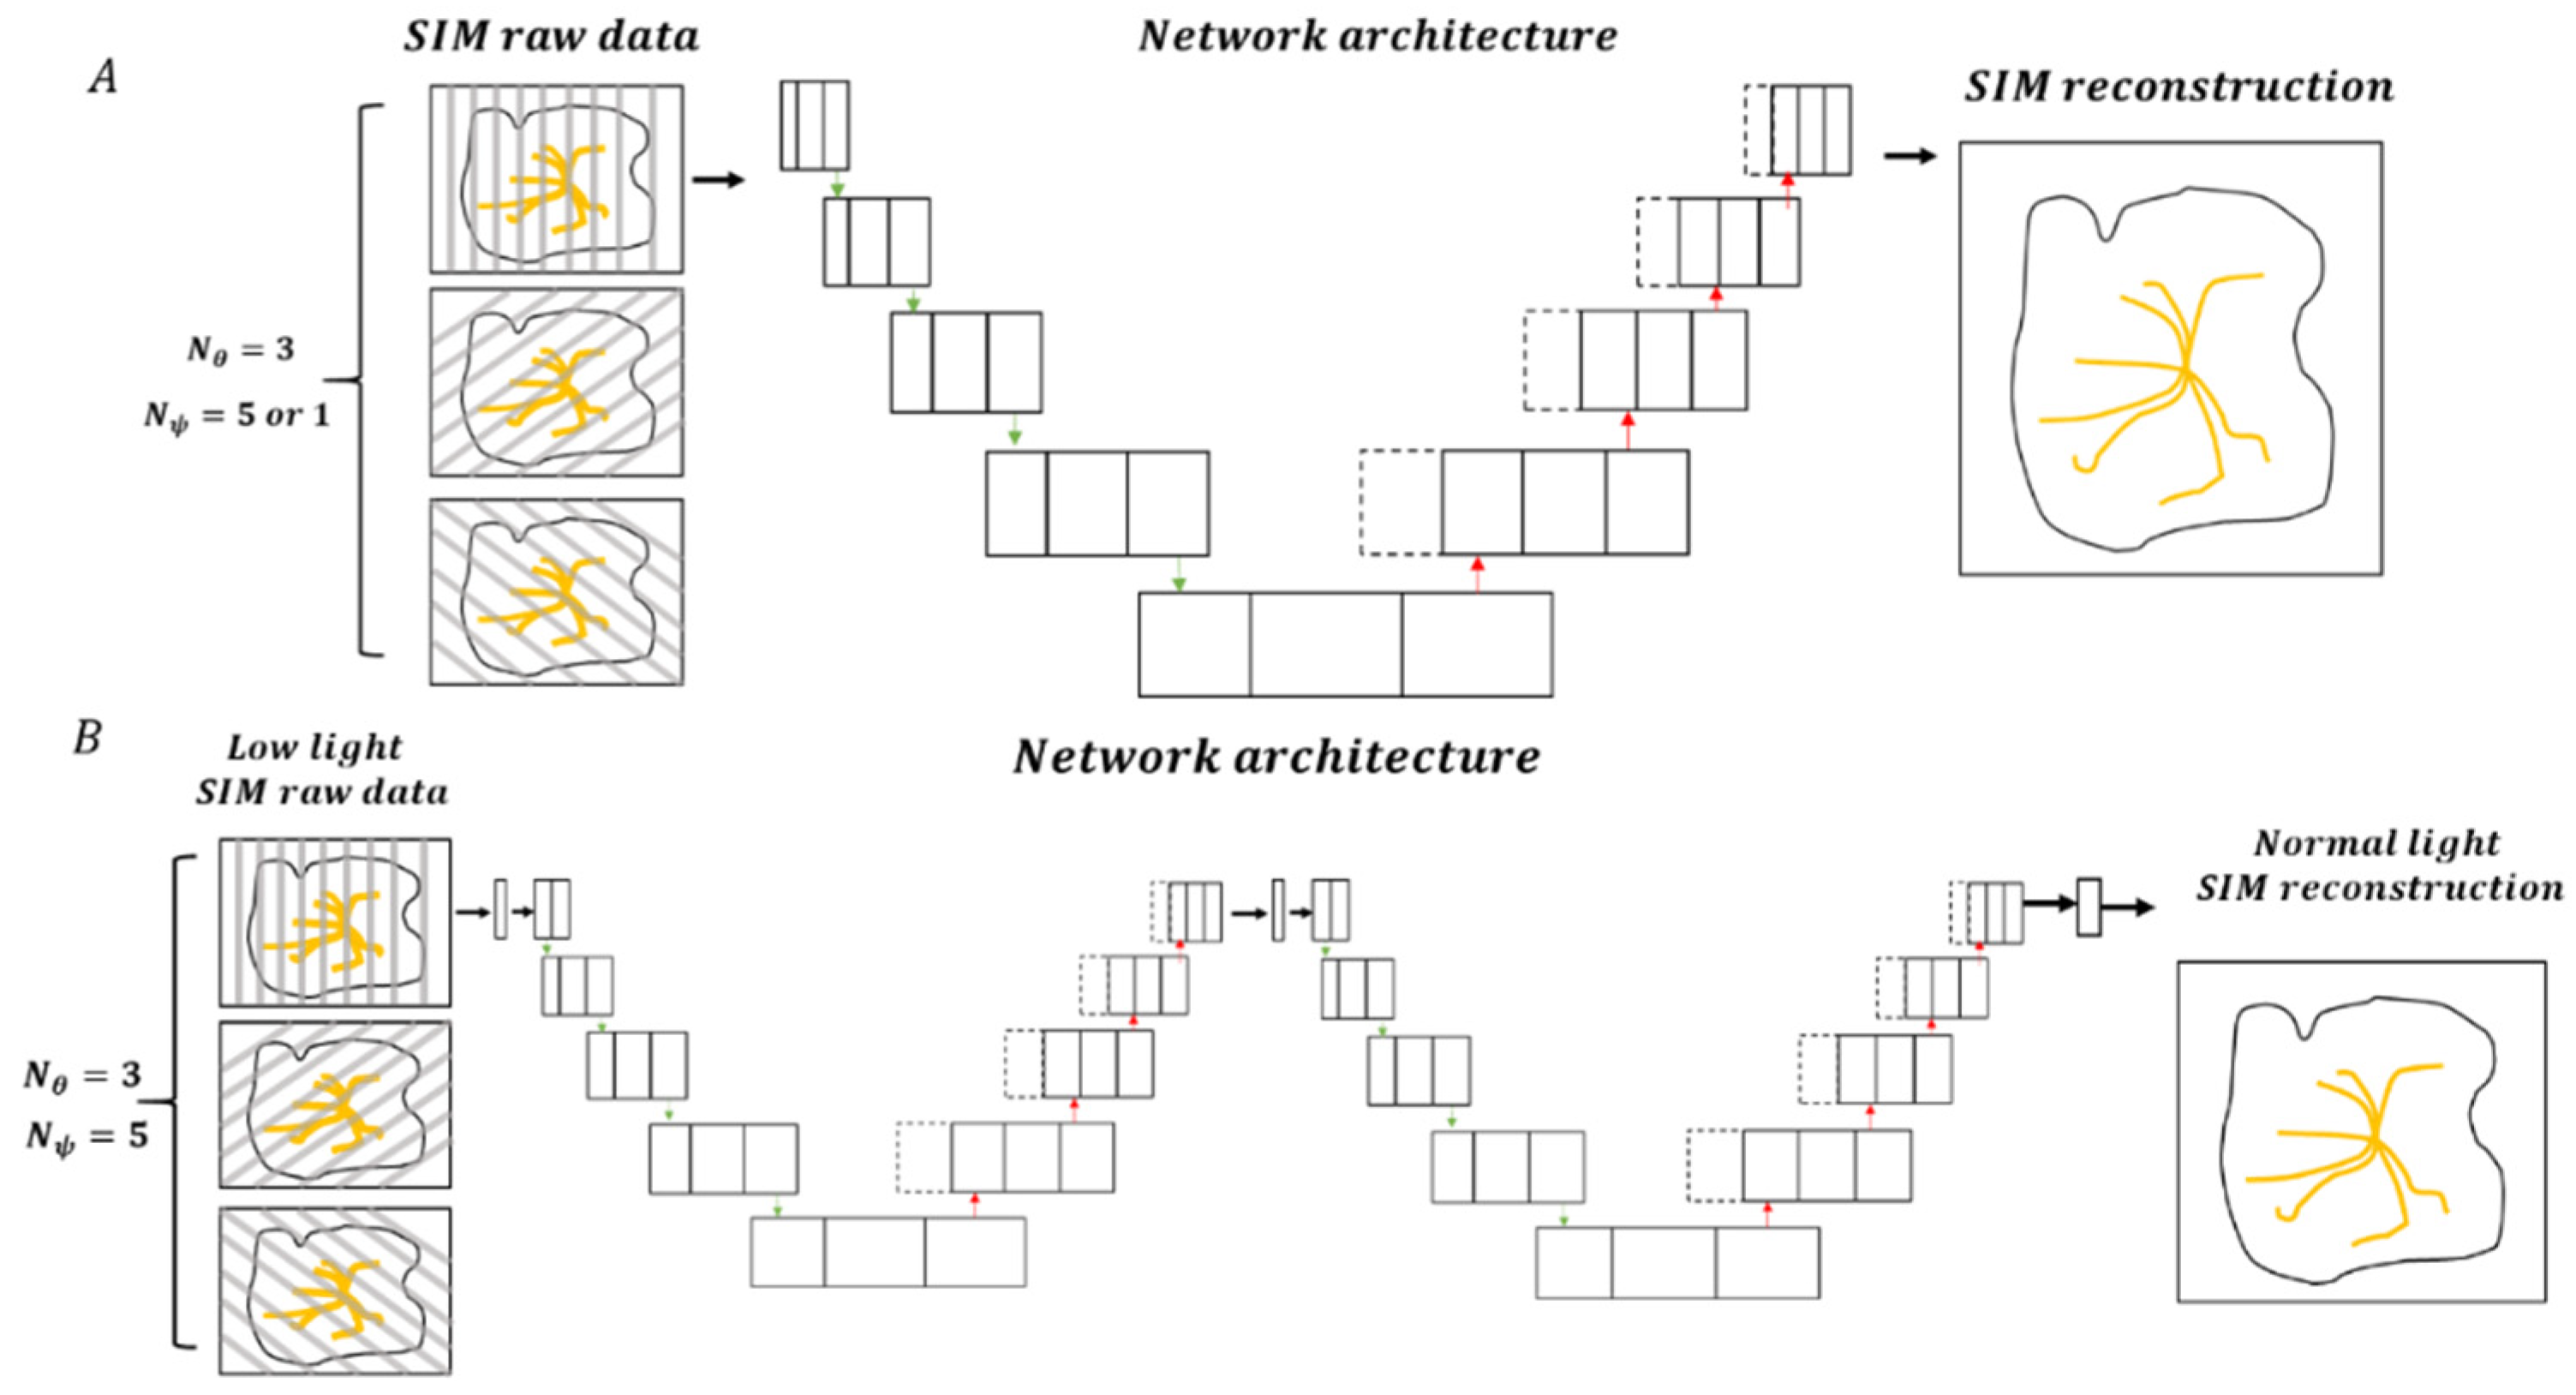
3.3.1. Correlating SIM with Deep Learning (DL-SIM)
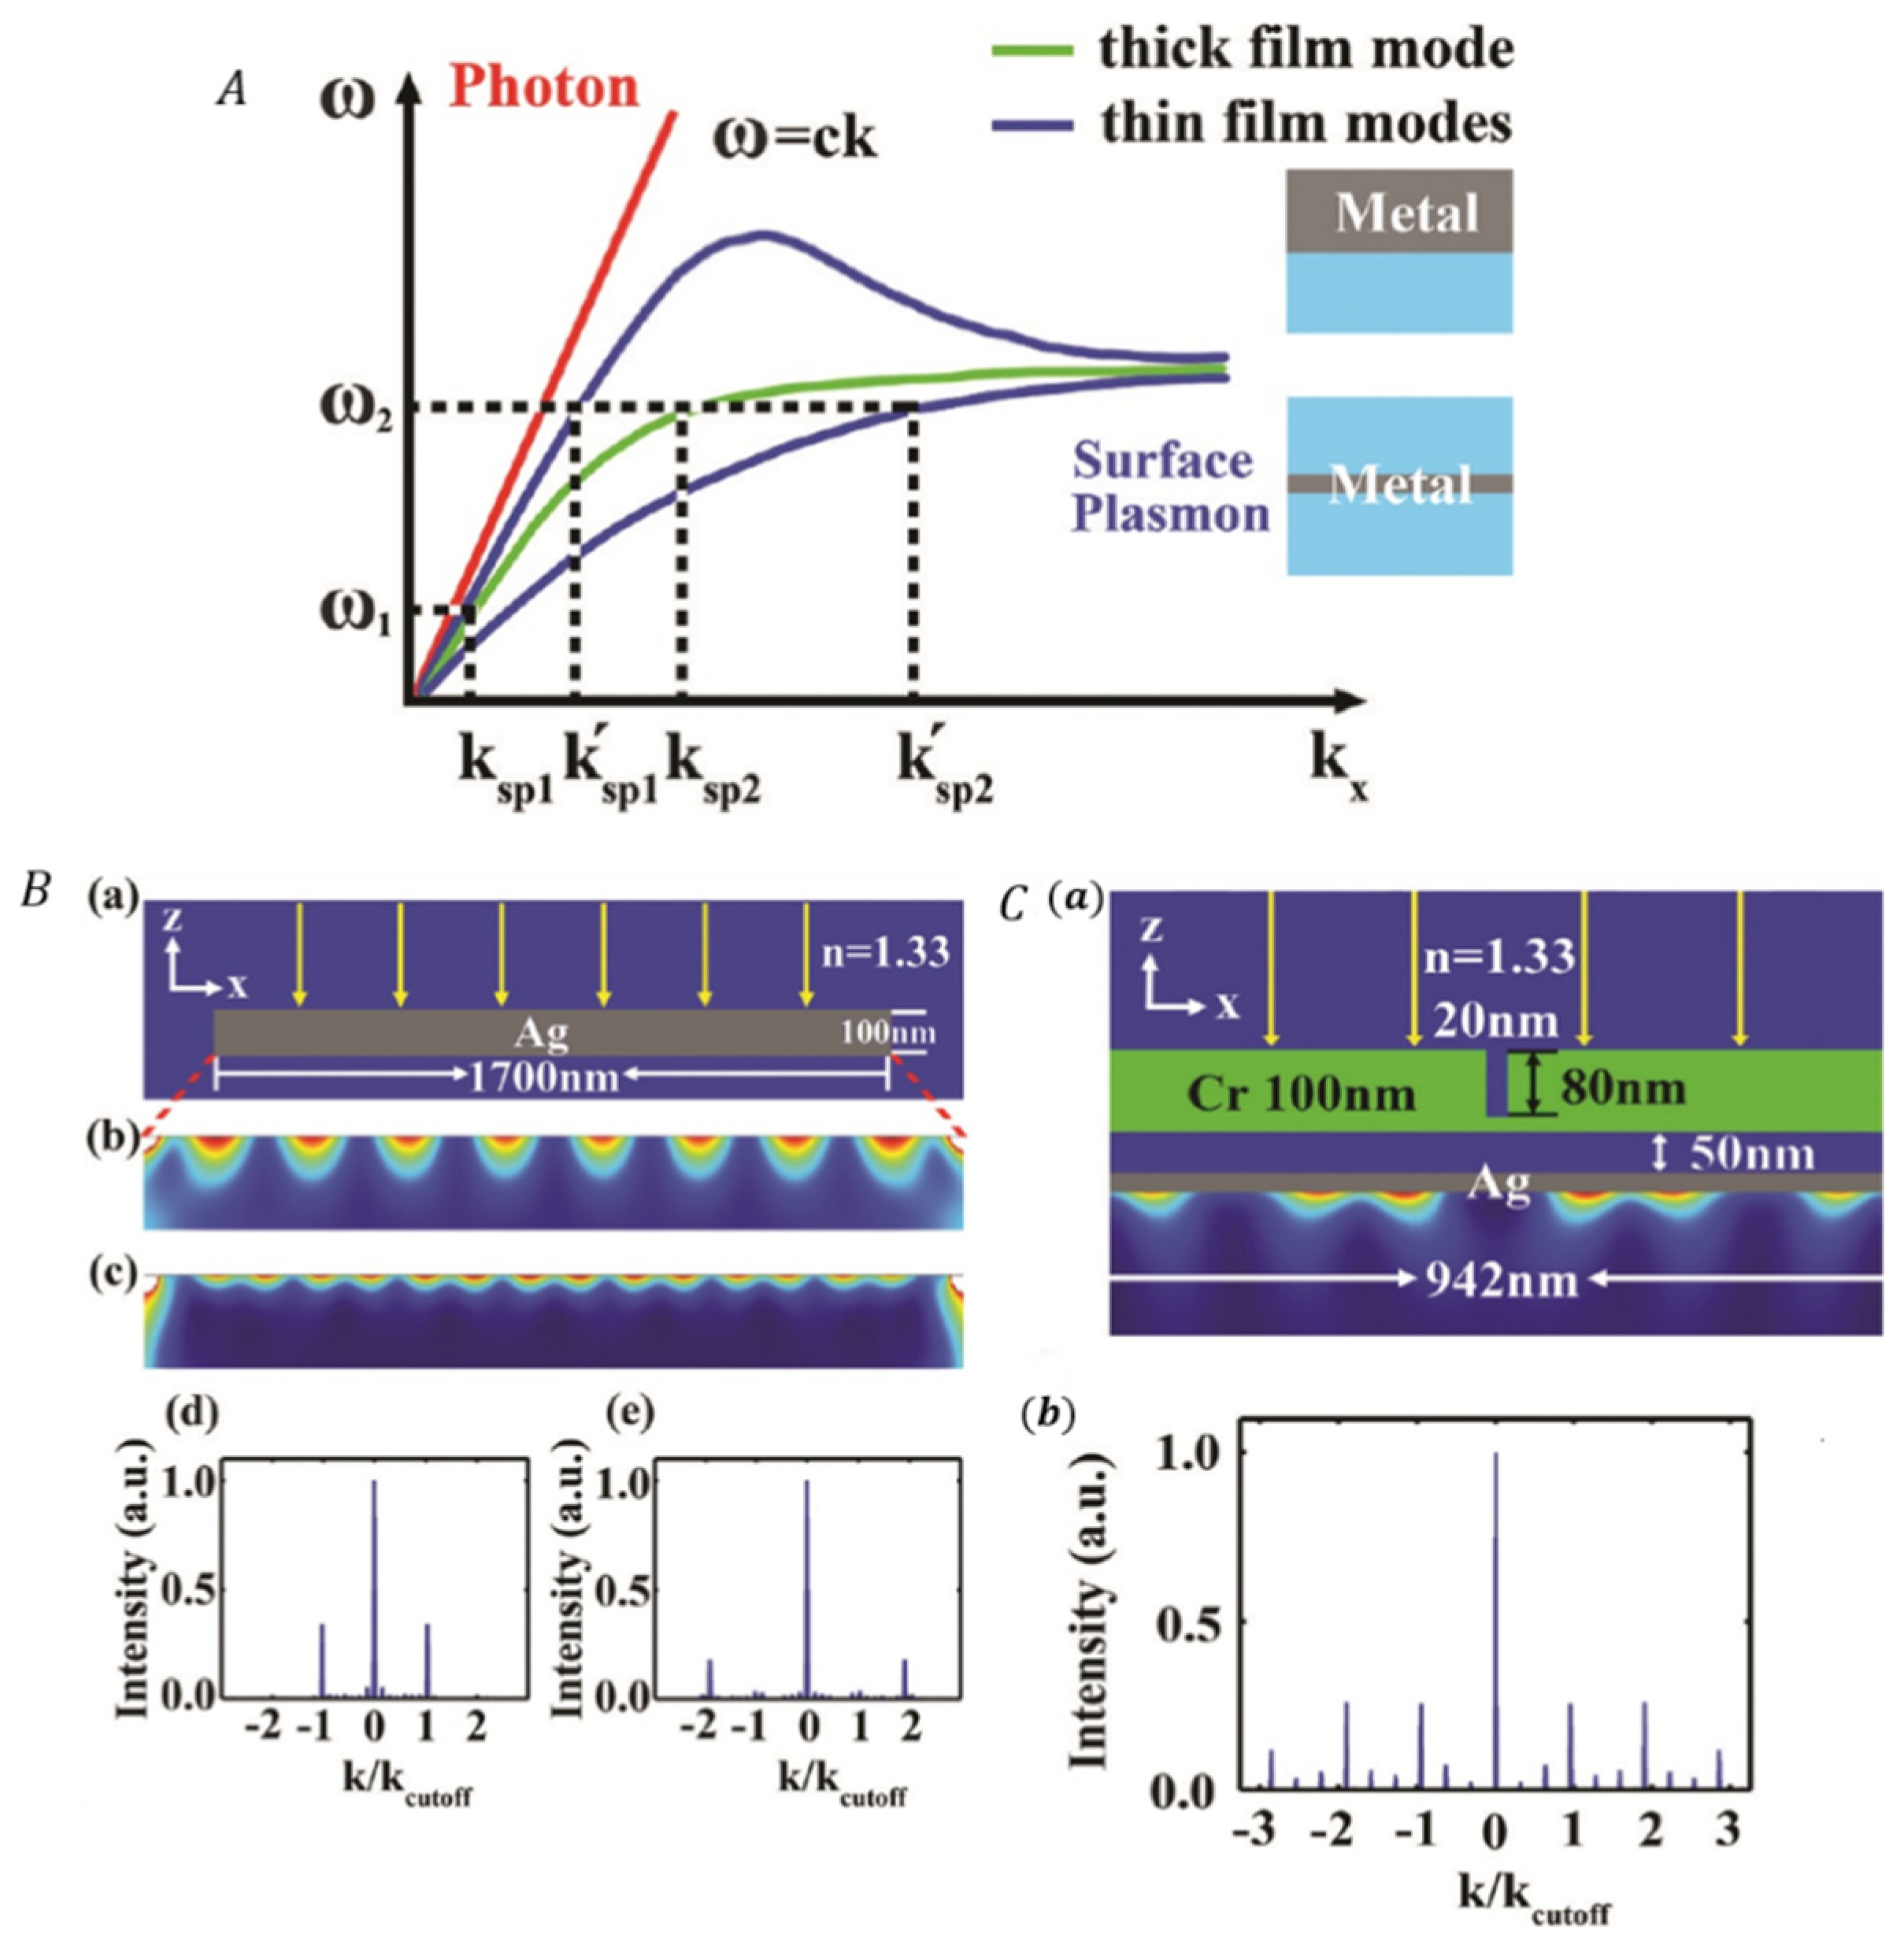
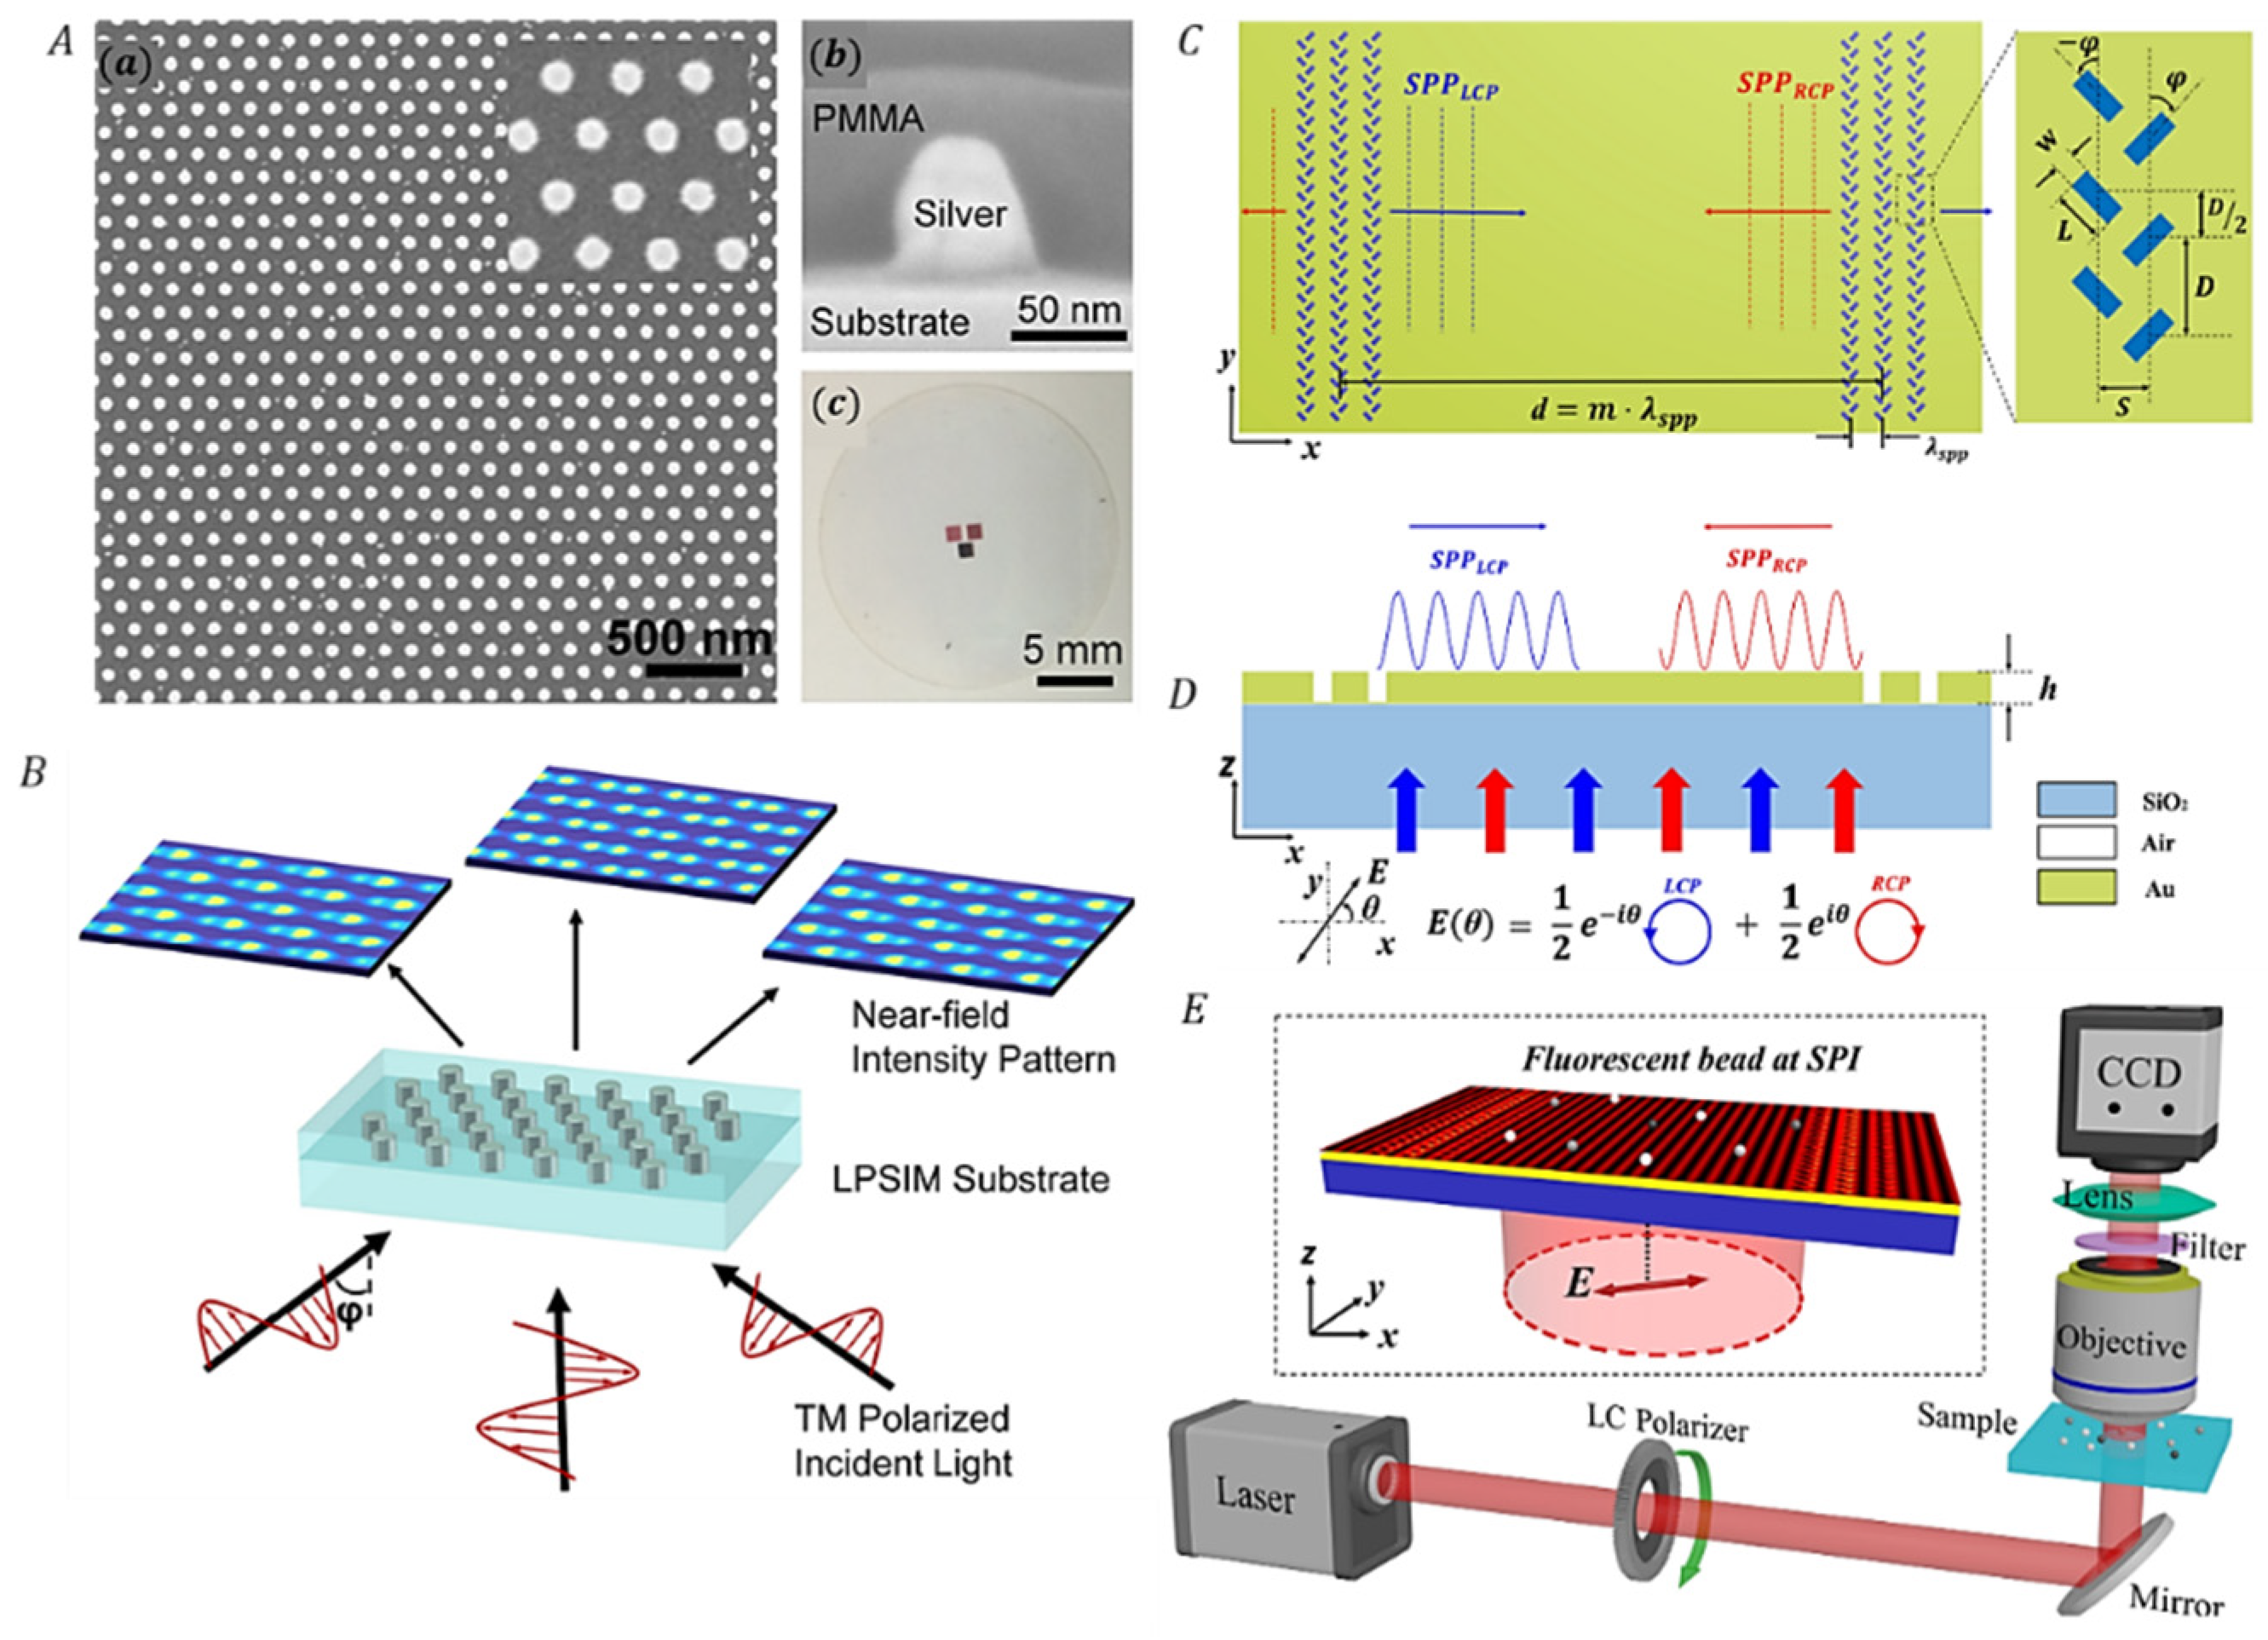
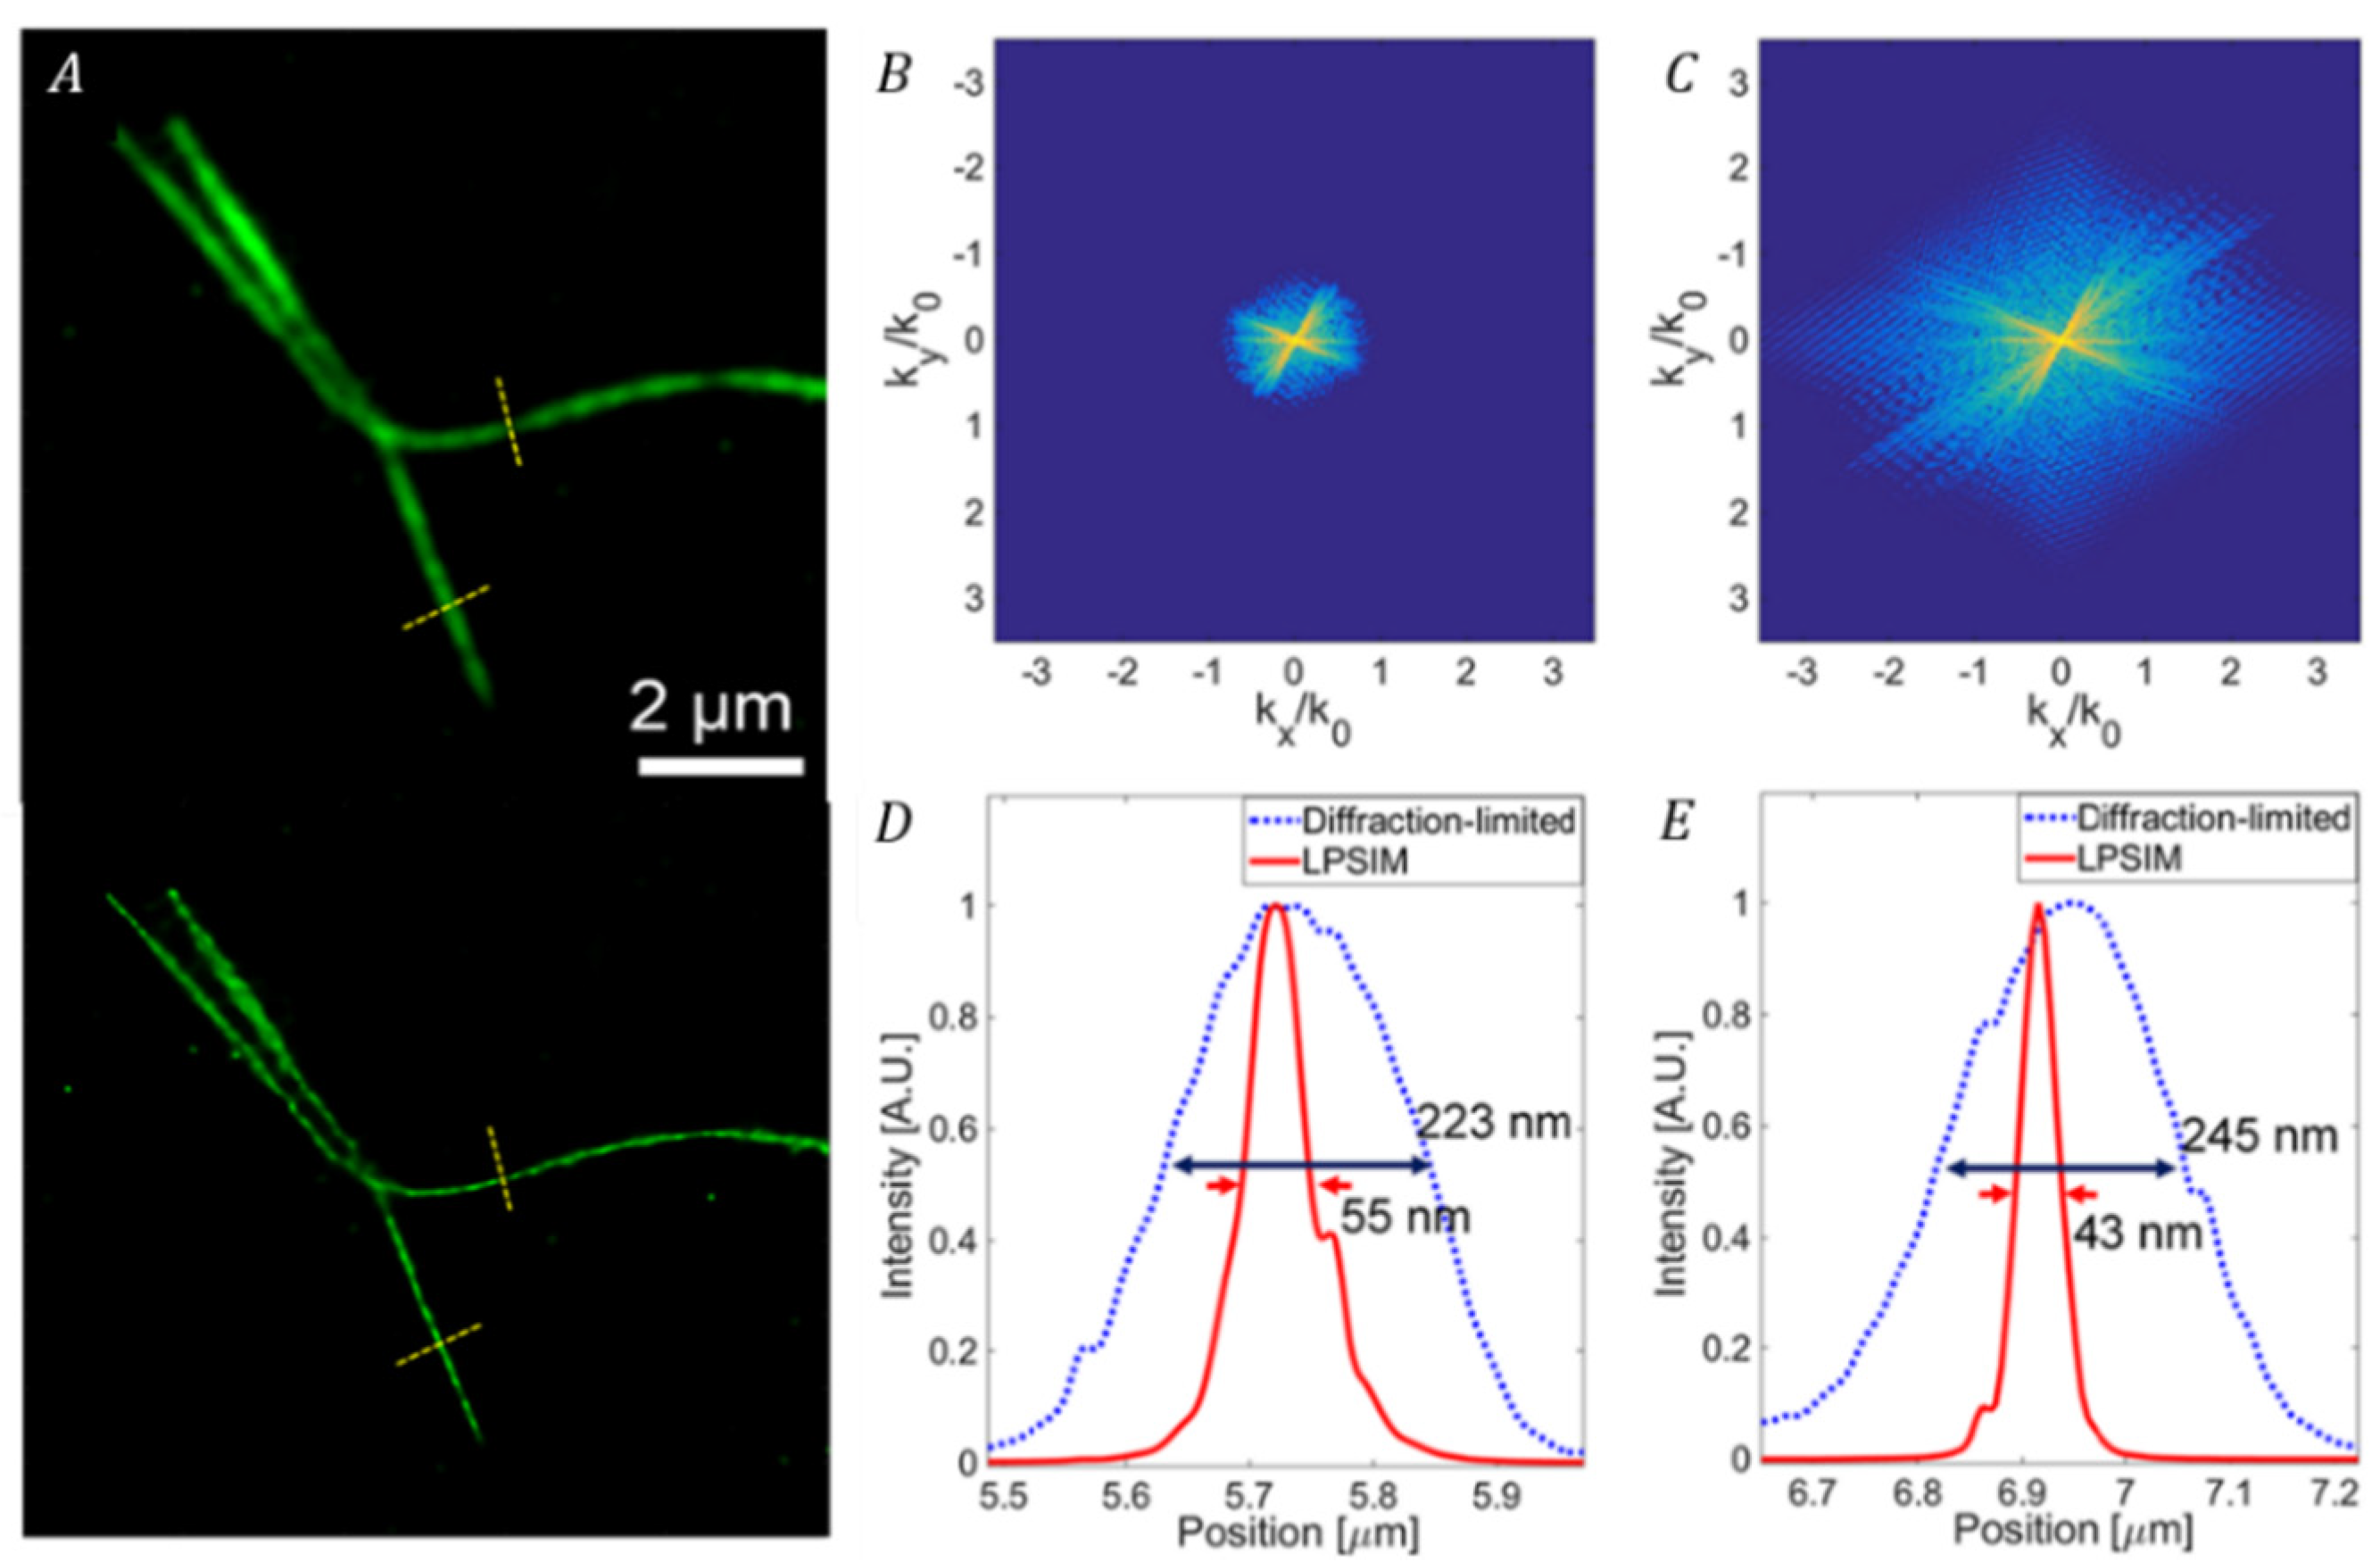
3.3.2. Correlating SIM with Surface Plasmons Interference (PSIM)
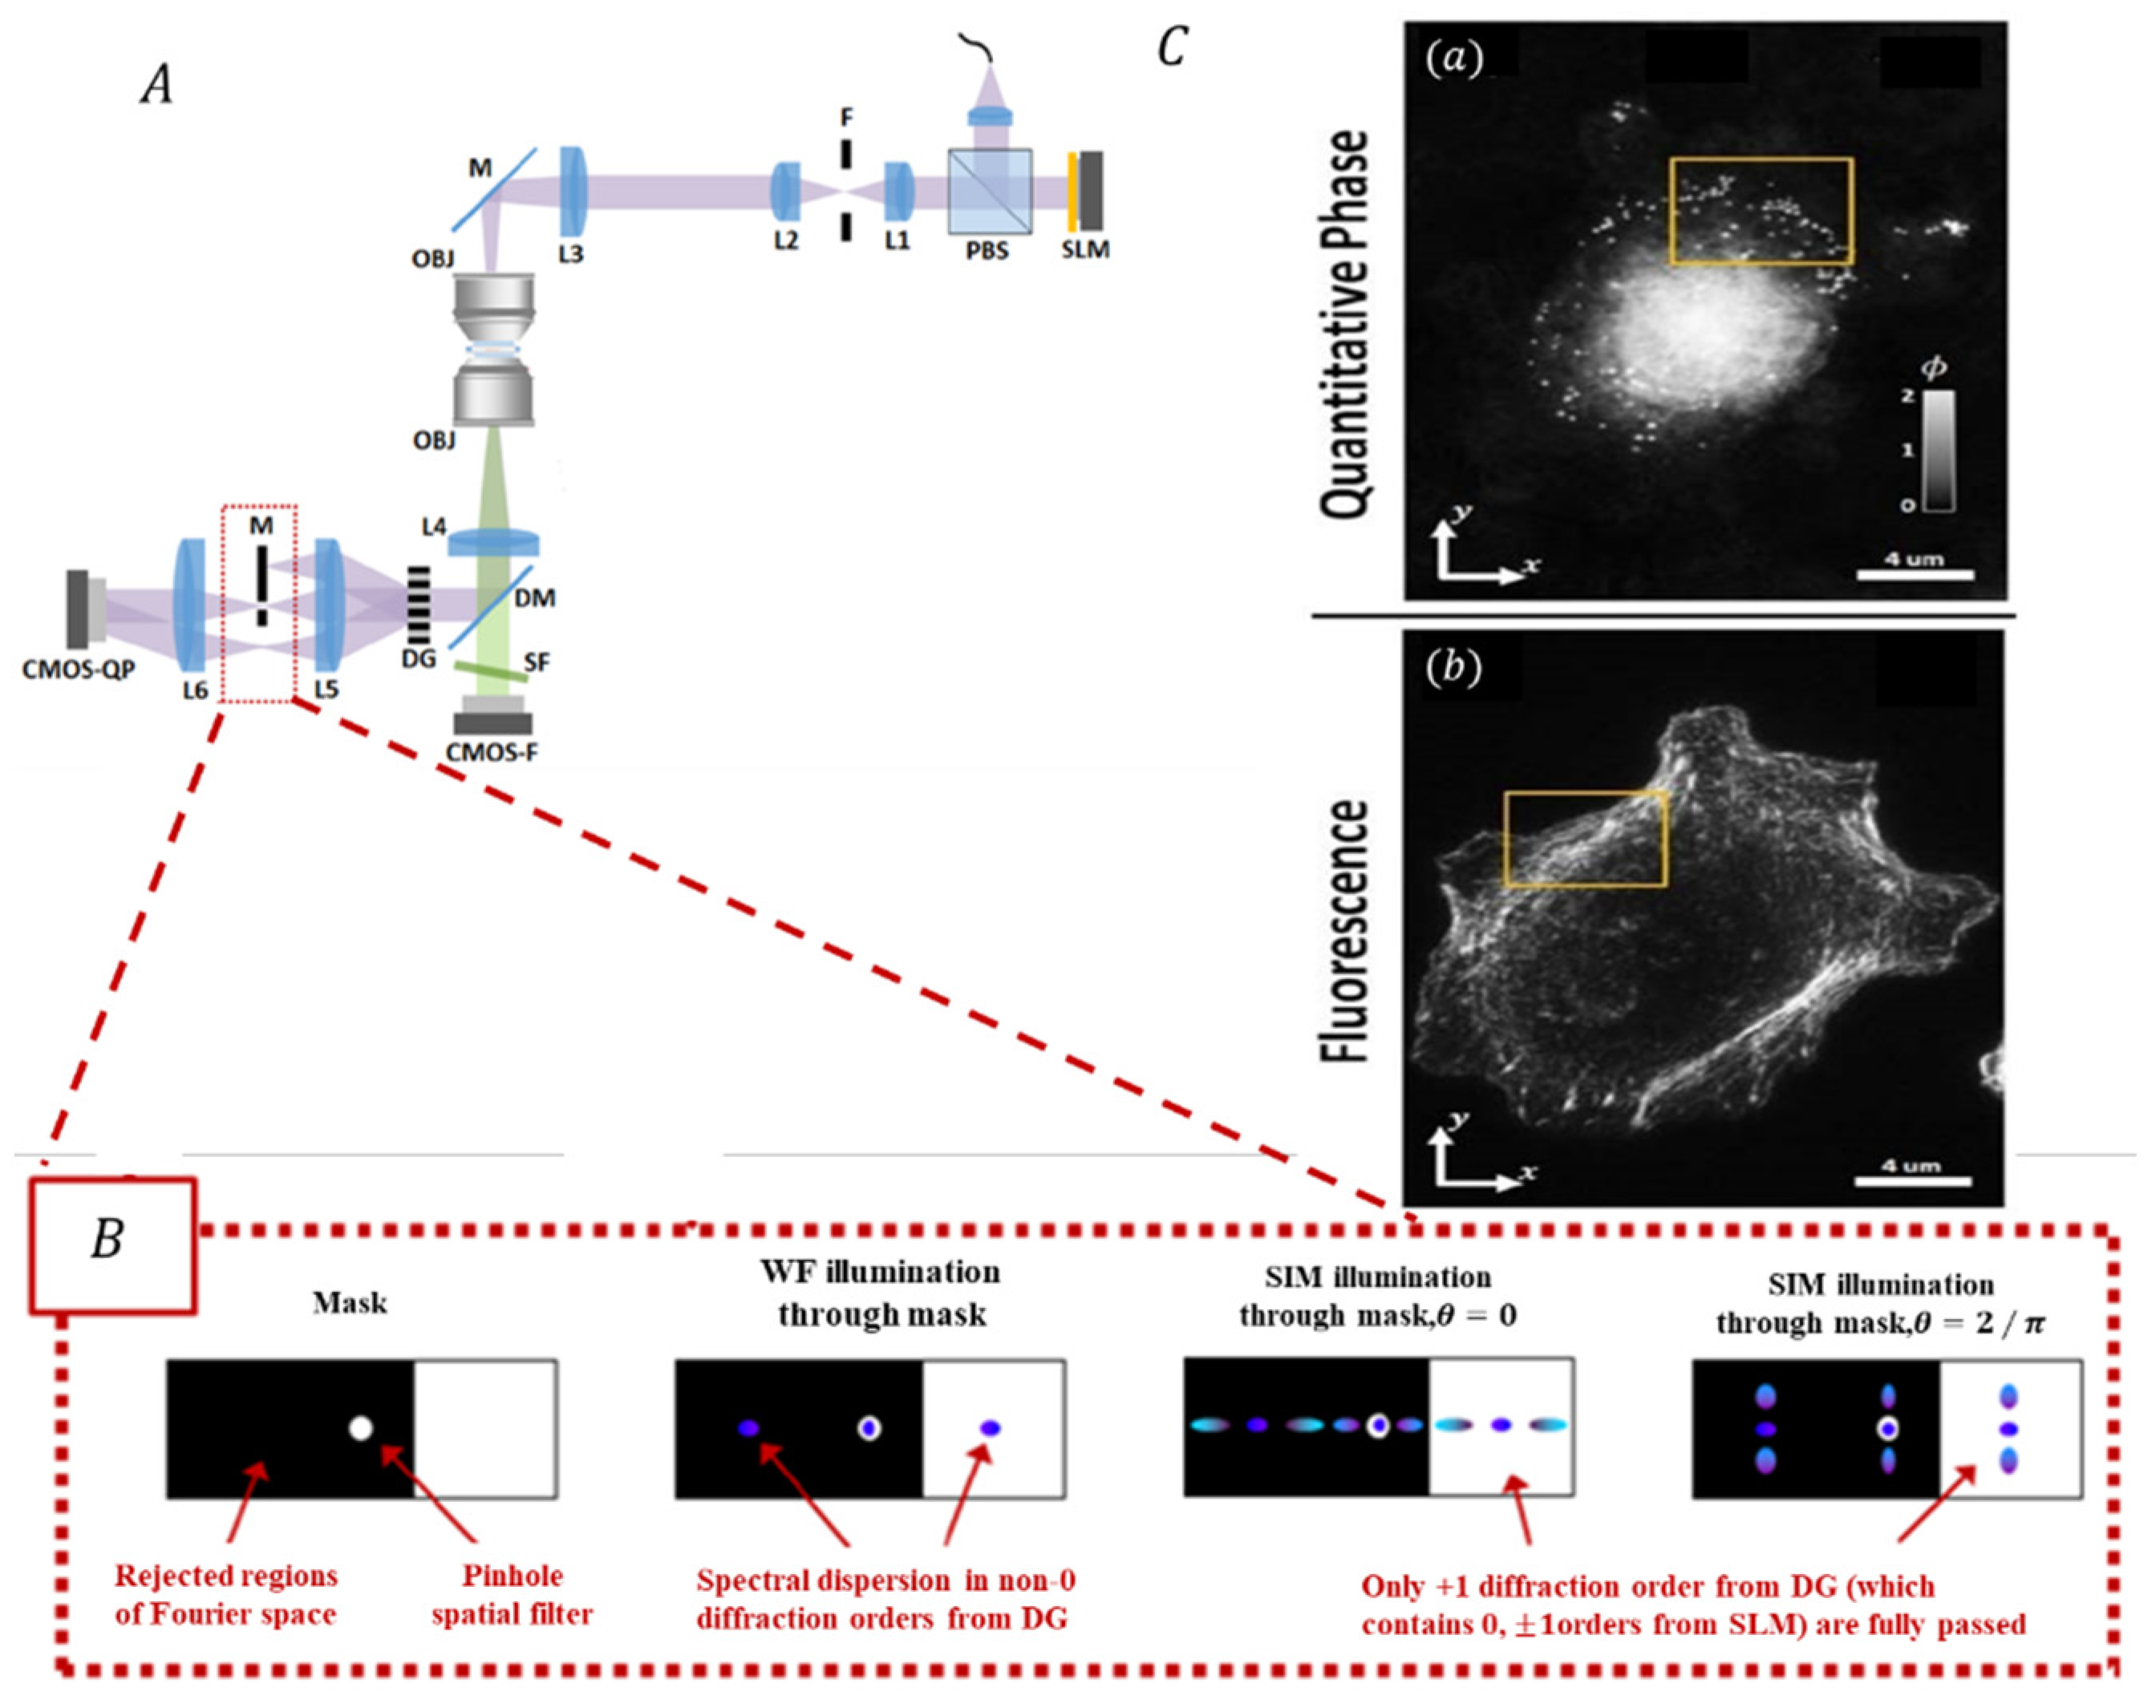
3.3.3. Correlative SIM with Quantitative Phase Imaging Techniques
4. Summary and Prospects
Author Contributions
Funding
Institutional Review Board Statement
Informed Consent Statement
Data Availability Statement
Conflicts of Interest
References
- Glasgow, B.J. Conventional fluorescence microscopy below the diffraction limit with simultaneous capture of two fluorophores. Proc. Spie 2016, 9714, 986–1001. [Google Scholar]
- Wang, Y.; Fei, J.Y. Continuous active development of super-resolution fluorescence microscopy. Phys. Biol. 2020, 17, 21–25. [Google Scholar] [CrossRef]
- Bates, M.; Huang, B.; Dempsey, G.T.; Zhuang, X.W. Multicolor super-resolution imaging with photo-switchable fluorescent probes. Science 2007, 317, 1749–1753. [Google Scholar] [CrossRef] [PubMed] [Green Version]
- Lin, D.Y.; Qu, J.L. Recent progress on super-resolution imaging and correlative super-resolution microscopy. Acta Phys. Sin. 2017, 66, 85–90. [Google Scholar]
- Moraru, C.; Amann, R. Crystal ball: Fluorescence in situ hybridization in the age of super-resolution microscopy. Syst. Appl. Microbiol. 2012, 35, 549–552. [Google Scholar] [CrossRef]
- Wang, B.K.; Barbiero, M.; Zhang, Q.M.; Gu, M. Super-resolution optical microscope: Principle, instrumentation, and application. Front. Inf. Technol. Electron. Eng. 2019, 20, 608–630. [Google Scholar] [CrossRef]
- Nicovich, P.R.; Owen, D.M.; Gaus, K. Turning single-molecule localization microscopy into a quantitative bioanalytical tool. Nat. Protoc. 2017, 12, 453–460. [Google Scholar] [CrossRef] [PubMed]
- Vangindertael, J.; Camacho, R.; Sempels, W.; Mizuno, H.; Dedecker, P.; Janssen, K.P.F. An introduction to optical super-resolution microscopy for the adventurous biologist. Methods Appl. Fluores 2018, 6, 65–80. [Google Scholar] [CrossRef]
- Zeng, Z.P.; Xi, P. Advances in three-dimensional super-resolution nanoscopy. Microsc. Res. Tech. 2016, 79, 893–898. [Google Scholar] [CrossRef]
- Hell, S.W.; Wichmann, J. Breaking the diffraction resolution limit by stimulated-emission-depletion fluorescence microscopy. Opt. Lett. 1994, 19, 780–782. [Google Scholar] [CrossRef]
- Sharma, R.; Singh, M.; Sharma, R. Recent advances in STED and RESOLFT super-resolution imaging techniques. Spectrochim. Acta A 2020, 231, 778–792. [Google Scholar] [CrossRef]
- Yan, W.; Yang, Y.L.; Tan, Y.; Chen, X.; Li, Y.; Qu, J.L.; Ye, T. Coherent optical adaptive technique improves the spatial resolution of STED microscopy in thick samples. Photonics Res. 2017, 5, 176–181. [Google Scholar] [CrossRef] [PubMed] [Green Version]
- Schermelleh, L.; Carlton, P.M.; Haase, S.; Shao, L.; Winoto, L.; Kner, P.; Burke, B.; Cardoso, M.C.; Agard, D.A.; Gustafsson, M.G.L.; et al. Subdiffraction multicolor imaging of the nuclear periphery with 3D structured illumination microscopy. Science 2008, 320, 1332–1336. [Google Scholar] [CrossRef] [PubMed] [Green Version]
- Dyba, M.; Hell, S.W. Focal spots of size lambda/23 open up far-field florescence microscopy at 33 nm axial resolution. Phys. Rev. Lett. 2002, 88, 66–76. [Google Scholar] [CrossRef] [Green Version]
- Bates, M.; Rust, M.J.; Huang, B.; Zhuang, X.W. Sub-diffraction-limit imaging by stochastic optical reconstruction microscopy. Biophys. J. 2007, 79, 196–200. [Google Scholar]
- Pfender, M.; Aslam, N.; Waldherr, G.; Neumann, P.; Wrachtrup, J. Single-spin stochastic optical reconstruction microscopy. Proc. Natl. Acad. Sci. USA 2014, 111, 14669–14674. [Google Scholar] [CrossRef] [PubMed] [Green Version]
- Huang, B.; Wang, W.Q.; Bates, M.; Zhuang, X.W. Three-dimensional super-resolution imaging by stochastic optical reconstruction microscopy. Science 2008, 319, 810–813. [Google Scholar] [CrossRef] [Green Version]
- Herbert, S.; Soares, H.; Zimmer, C.; Henriques, R. Single-molecule localization super-resolution microscopy: Deeper and faster. Microsc. Microanal. 2012, 18, 1419–1429. [Google Scholar] [CrossRef]
- Dong, B.Q.; Almassalha, L.; Urban, B.E.; Nguyen, T.Q.; Khuon, S.; Chew, T.L.; Backman, V.; Sun, C.; Zhang, H.F. Super-resolution spectroscopic microscopy via photon localization. Nat. Commun. 2016, 7, 315–333. [Google Scholar] [CrossRef]
- Tam, J.; Merino, D. Stochastic optical reconstruction microscopy (STORM) in comparison with stimulated emission depletion (STED) and other imaging methods. J. Neurochem. 2015, 135, 643–658. [Google Scholar] [CrossRef]
- Sun, Y. Potential quality improvement of stochastic optical localization nanoscopy images obtained by frame by frame localization algorithms. Sci. Rep. 2020, 10, 7–19. [Google Scholar] [CrossRef]
- Betzig, E.; Patterson, G.H.; Sougrat, R.; Lindwasser, O.W.; Olenych, S.; Bonifacino, J.S.; Davidson, M.W.; Lippincott-Schwartz, J.; Hess, H.F. Imaging intracellular fluorescent proteins at nanometer resolution. Science 2006, 313, 1642–1645. [Google Scholar] [CrossRef] [Green Version]
- Hess, S.T.; Girirajan, T.P.K.; Mason, M.D. Ultra-high resolution imaging by fluorescence photoactivation localization microscopy. Biophys. J. 2006, 91, 4258–4272. [Google Scholar] [CrossRef] [Green Version]
- Leung, B.O.; Chou, K.C. Review of super-resolution fluorescence microscopy for biology. Appl. Spectrosc. 2011, 65, 967–980. [Google Scholar] [CrossRef] [PubMed] [Green Version]
- Lee, M.Y.; Chen, X.Q.; Gustavsson, A.K.; Chang, H.Y.; Moerner, W.E. In situ imaging of spatial organization of accessible chromatin at the nanoscale with ATAC-see and single-molecule super-resolution fluorescence microscopy. Biophys. J. 2018, 114, 539–550. [Google Scholar] [CrossRef]
- Roubinet, B.; Weber, M.; Shojaei, H.; Bates, M.; Bossi, M.L.; Beloy, V.N.; Irie, M.; Hell, S.W. Fluorescent photoswitchable diarylethenes for biolabeling and single-molecule localization microscopies with optical superresolution. J. Am. Chem. Soc. 2017, 139, 6611–6620. [Google Scholar] [CrossRef] [Green Version]
- Eggeling, C.; Willig, K.I.; Sahl, S.J.; Hell, S.W. Lens-based fluorescence nanoscopy. Q. Rev. Biophys. 2015, 48, 178–243. [Google Scholar] [CrossRef] [PubMed]
- Lippincott-Schwartz, J.; Patterson, G.H. Development and use of fluorescent protein markers in living cells. Science 2003, 300, 87–91. [Google Scholar] [CrossRef] [Green Version]
- Moerner, W.E.; Orrit, M. Illuminating single molecules in condensed matter. Science 1999, 283, 1670–1682. [Google Scholar] [CrossRef] [PubMed]
- Yildiz, A.; Forkey, J.N.; McKinney, S.A.; Ha, T.; Goldman, Y.E.; Selvin, P.R. Myosin V walks hand-over-hand: Single fluorophore imaging with 1.5-nm localization. Science 2003, 300, 2061–2065. [Google Scholar] [CrossRef] [Green Version]
- Shcherbakova, D.M.; Baloban, M.; Emelyanov, A.V.; Brenowitz, M.; Guo, P.; Verkhusha, V.V. Bright monomeric near-infrared fluorescent proteins as tags and biosensors for multiscale imaging. Nat. Commun. 2003, 7, 12405. [Google Scholar] [CrossRef] [PubMed]
- Wolter, H.; Born, M. Principles of optics electromagnetic theory of propagation interference and diffraction of light. Z Angew. Phys. 1966, 21, 565–570. [Google Scholar]
- Miks, A.; Pokorny, P. Explicit calculation of Point Spread Function of optical system. Optik 2021, 239, 166885. [Google Scholar] [CrossRef]
- Bellec, M.; Royon, A.; Bousquet, B.; Bourhis, K.; Treguer, M.; Cardinal, T.; Richardson, M.; Canioni, L. Beat the diffraction limit in 3D direct laser writing in photosensitive glass. Opt. Express 2009, 17, 10304–10318. [Google Scholar] [CrossRef] [PubMed]
- Wang, X.; Zhou, W.X.; Xu, D.D.; Yin, J.H. Analysis and verification of fluorescence super-resolution microscopy via polarization modulation in reciprocal space. J. Opt. Soc. Am. A 2021, 38, 337–343. [Google Scholar] [CrossRef]
- Heintzmann, R.; Gustafsson, M.G.L. Subdiffraction resolution in continuous samples. Nat. Photonics 2009, 3, 362–364. [Google Scholar] [CrossRef]
- Gustafsson, M.G.L. Surpassing the lateral resolution limit by a factor of two using structured illumination microscopy. J. Microsc.-Oxf. 2000, 198, 82–87. [Google Scholar] [CrossRef] [Green Version]
- Tu, S.; Liu, Q.; Liu, X.; Liu, W.; Zhang, Z.; Luo, T.; Kuang, C.; Liu, X.; Hao, X. Fast reconstruction algorithm for structured illumination microscopy. Opt. Lett. 2020, 45, 1567–1570. [Google Scholar] [CrossRef]
- Karras, C.; Smedh, M.; Förster, R.; Deschout, H.; Fernandez-Rodriguez, J.; Heintzmann, R. Successful optimization of reconstruction parameters in structured illumination microscopy–A practical guide. Opt. Commun. 2019, 436, 69–75. [Google Scholar] [CrossRef]
- Neil, M.A.A.; Juskaitis, R.; Wilson, T. Method of obtaining optical sectioning by using structured light in a conventional microscope. Opt. Lett. 1997, 22, 1905–1907. [Google Scholar] [CrossRef] [PubMed]
- Zhuang, J.; Wang, Z.W.; Zheng, Q.Q.; Liao, X.B. Scanning electrochemical cell microscopy stable imaging method with a backpressure at the back of its nanopipet. IEEE Sens. J. 2021, 21, 5240–5248. [Google Scholar] [CrossRef]
- Wang, W.B.; Zhang, B.Y.; Wu, B.W.; Li, X.J.; Ma, J.; Sun, P.Y.; Zheng, S.H.; Tan, J.B. Image scanning microscopy with a long depth of focus generated by an annular radially polarized beam. Opt. Express 2020, 28, 88–96. [Google Scholar] [CrossRef]
- Nadrigny, F.; le Meur, K.; Schomburg, E.D.; Safavi-Abbasi, S.; Dibaj, P. Two-photon laser-scanning microscopy for single and repetitive imaging of dorsal and lateral spinal white matter in vivo. Physiol. Res. 2017, 66, 531–537. [Google Scholar] [CrossRef] [PubMed]
- Aarholt, T.; Frodason, Y.K.; Prytz, O. Imaging defect complexes in scanning transmission electron microscopy: Impact of depth, structural relaxation, and temperature investigated by simulations. Ultramicroscopy 2020, 209, 125–141. [Google Scholar] [CrossRef]
- Abad, J.M.; Tesio, A.Y.; Martinez-Perinan, E.; Pariente, F.; Lorenzo, E. Imaging resolution of biocatalytic activity using nanoscale scanning electrochemical microscopy. Nano Res. 2018, 11, 4232–4244. [Google Scholar] [CrossRef]
- Allgeier, S.; Bartschat, A.; Bohn, S.; Peschel, S.; Reichert, K.M.; Sperlich, K.; Walckling, M.; Hagenmeyer, V.; Mikut, R.; Stachs, O.; et al. 3D confocal laser-scanning microscopy for large-area imaging of the corneal subbasal nerve plexus. Sci. Rep. 2018, 8, 66–71. [Google Scholar] [CrossRef]
- Zheng, X.M.; Li, X.; Lin, Q.; Chen, J.J.; Gu, Y.Q.; Shao, Y.H. Multi-laser scanning confocal fluorescent endoscopy scheme for subcellular imaging. Prog. Electromagn. Res. 2020, 169, 17–23. [Google Scholar] [CrossRef]
- Mandula, O.; Kielhorn, M.; Wicker, K.; Krampert, G.; Kleppe, I.; Heintzmann, R. Line scan-structured illumination microscopy super-resolution imaging in thick fluorescent samples. Opt. Express 2012, 20, 24167–24174. [Google Scholar] [CrossRef]
- Everall, N. The influence of out-of-focus sample regions on the surface specificity of confocal Raman microscopy. Appl. Spectrosc. 2008, 62, 591–598. [Google Scholar] [CrossRef] [PubMed]
- Yeh, C.H.; Chen, S.Y. Resolution enhancement of two-photon microscopy via intensity-modulated laser scanning structured illumination. Appl. Opt. 2015, 54, 2309–2317. [Google Scholar] [CrossRef]
- Urban, B.E.; Xiao, L.; Chen, S.Y.; Yang, H.L.; Dong, B.Q.; Kozorovitskiy, Y.; Zhang, H.F. In vivo superresolution imaging of neuronal structure in the mouse brain. IEEE Trans. Biomed. Eng. 2018, 65, 232–238. [Google Scholar] [CrossRef] [PubMed]
- Hamel, V.; Guichard, P.; Fournier, M.; Guiet, R.; Fluckiger, I.; Seitz, A.; Gonczy, P. Correlative multicolor 3D SIM and STORM microscopy. Biomed. Opt. Express 2014, 5, 3326–3336. [Google Scholar] [CrossRef] [Green Version]
- Thevenaz, P.; Ruttimann, U.E.; Unser, M. A pyramid approach to subpixel registration based on intensity. IEEE Trans. Image Process. 1998, 7, 27–41. [Google Scholar] [CrossRef] [Green Version]
- Vogel, M.; Yang, Z.; Kessel, A.; Kranitzky, C.; Faber, C.; Hausler, G. Structured-illumination microscopy on technical surfaces: 3D metrology with nanometer sensitivity. Opt. Meas. Syst. Ind. Insp. VII 2011, 8082, 80820S. [Google Scholar]
- Gustafsson, M.G.L.; Shao, L.; Carlton, P.M.; Wang, C.J.R.; Golubovskaya, I.N.; Cande, W.Z.; Agard, D.A.; Sedat, J.W. Three-dimensional resolution doubling in wide-field fluorescence microscopy by structured illumination. Biophys. J. 2008, 94, 4957–4970. [Google Scholar] [CrossRef] [PubMed] [Green Version]
- Shao, L.; Kner, P.; Rego, E.H.; Gustafsson, M.G.L. Super-resolution 3D microscopy of live whole cells using structured illumination. Nat. Methods 2011, 8, 1044–1055. [Google Scholar] [CrossRef]
- Gustafsson, M.G.L. Nonlinear structured-illumination microscopy: Wide-field fluorescence imaging with theoretically unlimited resolution. Proc. Natl. Acad. Sci. USA 2005, 102, 13081–13086. [Google Scholar] [CrossRef] [PubMed] [Green Version]
- Heintzmann, R.; Jovin, T.M.; Cremer, C. Saturated patterned excitation microscopy-a concept for optical resolution improvement. J. Opt. Soc. Am. A 2002, 19, 1599–1609. [Google Scholar] [CrossRef] [Green Version]
- Hirvonen, L.; Mandula, O.; Wicker, K.; Heintzmann, R. Structured illumination microscopy using photoswitchable fluorescent proteins. Proc. Spie 2008, 6861, 991–1002. [Google Scholar]
- Rego, E.H.; Shao, L.; Macklin, J.J.; Winoto, L.; Johansson, G.A.; Kamps-Hughes, N.; Davidson, M.W.; Gustafsson, M.G.L. Nonlinear structured-illumination microscopy with a photoswitchable protein reveals cellular structures at 50-nm resolution. Proc. Natl. Acad. Sci. USA 2012, 109, 135–143. [Google Scholar] [CrossRef] [Green Version]
- Zyss, J.; Ledoux, I. Nonlinear optics in multipolar media: Theory and experiments. Chem. Rev. 1994, 94, 77–105. [Google Scholar] [CrossRef]
- Grotjohann, T.; Testa, I.; Reuss, M.; Brakemann, T.; Eggeling, C.; Hell, S.W.; Jakobs, S. rsEGFP2 enables fast RESOLFT nanoscopy of living cells. Elife 2012, 1, 56–64. [Google Scholar] [CrossRef] [PubMed]
- Hofmann, M.; Eggeling, C.; Jakobs, S.; Hell, S.W. Breaking the diffraction barrier in fluorescence microscopy at low light intensities by using reversibly photoswitchable proteins. Proc. Natl. Acad. Sci. USA 2005, 102, 17565–17569. [Google Scholar] [CrossRef] [Green Version]
- Dake, F. Theoretical assessment of optical resolution enhancement and background fluorescence reduction by three-dimensional nonlinear structured illumination microscopy using stimulated emission depletion. Opt. Rev. 2016, 23, 587–595. [Google Scholar] [CrossRef]
- Xue, Y.; So, P.T.C. Three-dimensional super-resolution high-throughput imaging by structured illumination STED microscopy. Opt. Express 2018, 26, 20920–20928. [Google Scholar] [CrossRef]
- So, P.T.C.; Kwon, H.S.; Dong, C.Y. Resolution enhancement in standing-wave total internal reflection microscopy: A point-spread-function engineering approach. J. Opt. Soc. Am. A 2001, 18, 2833–2845. [Google Scholar] [CrossRef] [PubMed]
- Truskey, G.A.; Burmeister, J.S.; Grapa, E.; Reichert, W.M. Total Internal-reflection fluorescence microscopy topographical mapping of relative cell substratum separation distances. J. Cell Sci. 1992, 103, 491–499. [Google Scholar] [CrossRef]
- Tzannes, A.P.; Mooney, J.M. Measurement of the modulation transfer-function of infrared cameras. Opt. Eng. 1995, 34, 1808–1817. [Google Scholar]
- Rossberger, S.; Best, G.; Baddeley, D.; Heintzmann, R.; Birk, U.; Dithmar, S.; Cremer, C. Combination of structured illumination and single molecule localization microscopy in one setup. J. Opt. 2013, 15, 23–39. [Google Scholar] [CrossRef] [Green Version]
- Zhang, H.; Zhao, M.; Peng, L.L. Nonlinear structured illumination microscopy by surface plasmon enhanced stimulated emission depletion. Opt. Express 2011, 19, 24–32. [Google Scholar] [CrossRef] [PubMed]
- Schneckenburger, H. Total internal reflection fluorescence microscopy: Technical innovations and novel applications. Curr. Opin. Biotech. 2005, 16, 13–18. [Google Scholar] [CrossRef] [PubMed]
- Axelrod, D. Total internal reflection fluorescence microscopy in cell biology. Method Enzymol. 2003, 361, 1–33. [Google Scholar]
- Kuhn, J.R.; Pollard, T.D. Real-time measurements of actin filament polymerization by total internal reflection fluorescence microscopy. Biophys. J. 2005, 88, 1387–1402. [Google Scholar] [CrossRef] [PubMed] [Green Version]
- Kner, P.; Chhun, B.B.; Griffis, E.R.; Winoto, L.; Gustafsson, M.G. Super resolution video microscopy of live cells by structured illumination. Howard Hughes Med. Inst. 2009, 6, 339–342. [Google Scholar] [CrossRef] [Green Version]
- Roth, J.; Mehl, J.; Rohrbach, A. Fast TIRF-SIM imaging of dynamic, low-fluorescent biological samples. Biomed. Opt. Express 2020, 11, 4008–4026. [Google Scholar] [CrossRef] [PubMed]
- Richter, V.; Lanzerstorfer, P.; Weghuber, J.; Schneckenburger, H. Super-resolution live cell microscopy of membrane-proximal fluorophores. Int. J. Mol. Sci. 2020, 21, 7099. [Google Scholar] [CrossRef]
- Young, L.J.; Strohl, F.; Kaminski, C.F. A guide to structured illumination TIRF microscopy at high speed with multiple colors. J. Vis. Exp. 2016, 111, 1–16. [Google Scholar] [CrossRef]
- Foerster, R.; Lu-Walther, H.W.; Jost, A.; Kielhorn, M.; Wicker, K.; Heintzmann, R. Simple structured illumination microscope setup with high acquisition speed by using a spatial light modulator. Opt. Express 2014, 22, 20663–20677. [Google Scholar] [CrossRef] [PubMed]
- Chung, E.; Kim, D.K.; So, P.T.C. Extended resolution wide-field optical imaging: Objective-launched standing-wave total internal reflection fluorescence microscopy. Opt. Lett. 2006, 31, 945–947. [Google Scholar] [CrossRef] [PubMed]
- Furst, J.E.; Yu, D.H.; Hayes, P.A.; DSouza, C.M.; Williams, J.F. Liquid crystal variable retarders in atomic scattering. Rev. Sci. Instrum. 1996, 67, 3813–3817. [Google Scholar] [CrossRef]
- Ramirez, C.N.; Montes-Gonzalez, I.; Bruce, N.C.; Lopez-Tellez, J.M.; Rodriguez-Herrera, O.G.; Rosete-Aguilar, M. Characterization of retardance spatial variations over the aperture of liquid-crystal variable retarders. Appl. Opt. 2021, 60, 2998–3005. [Google Scholar] [CrossRef]
- Schnoor, N.P.; Niemeier, R.C.; Woods, A.L.; Rogers, J.D. Calibration of liquid crystal variable retarders using a common-path interferometer and fit of a closed-form expression for the retardance curve. Appl. Opt. 2020, 59, 10673–10679. [Google Scholar] [CrossRef]
- Trachtenberg, S.; Gilad, R.; Geffen, N. The bacterial linear motor of Spiroplasma melliferum BC3: From single molecules to swimming cells. Mol. Microbiol. 2003, 47, 671–697. [Google Scholar] [CrossRef] [PubMed]
- Junger, F.; Rohrbach, A. Strong cytoskeleton activity on millisecond timescales upon particle binding revealed by ROCS microscopy. Cytoskeleton 2019, 75, 410–424. [Google Scholar] [CrossRef] [PubMed]
- Helle, O.I.; Dullo, F.T.; Lahrberg, M.; Tinguely, J.C.; Helleso, O.G.; Ahluwalia, B.S. Structured illumination microscopy using a photonic chip. Nat. Photonics 2020, 14, 431–485. [Google Scholar] [CrossRef]
- Fiolka, R. Clearer view for TIRF and oblique illumination microscopy. Opt. Express 2016, 24, 29556–29567. [Google Scholar] [CrossRef] [PubMed]
- Wittig, R.; Richter, V.; Wittig-Blaich, S.; Weber, P.; Strauss, W.S.L.; Bruns, T.; Dick, T.P.; Schneckenburger, H. Biosensor-Expressing Spheroid Cultures for Imaging of Drug-Induced Effects in Three Dimensions. J. Biomol. Screen 2013, 18, 736–743. [Google Scholar] [CrossRef] [Green Version]
- Zhang, C.Y.; Shao, H.R.; Zhang, J.; Guo, X.Y.; Liu, Y.; Song, Z.G.; Liu, F.; Ling, P.X.; Tang, L.G.; Wang, K.N.; et al. Long-term live-cell lipid droplet-targeted biosensor development for nanoscopic tracking of lipid droplet-mitochondria contact sites. Theranostics 2021, 11, 7767–7778. [Google Scholar] [CrossRef]
- Svoboda, K.; Yasuda, R. Principles of two-photon excitation microscopy and its applications to neuroscience. Neuron 2006, 50, 823–839. [Google Scholar] [CrossRef] [Green Version]
- Helmchen, F.; Denk, W. Deep tissue two-photon microscopy. Nat. Methods 2005, 2, 932–940. [Google Scholar] [CrossRef]
- Wang, M.; Wang, L.; Zheng, X.; Zhou, J.; Chen, J.; Zeng, Y.; Qu, J.; Shao, Y.; Gao, B.Z. Nonlinear scanning structured illumination microscopy based on nonsinusoidal modulation. J. Innov. Opt. Health Sci. 2021, 14, 1793–5458. [Google Scholar] [CrossRef]
- Zheng, Y.; Chen, J.J.; Shi, X.; Zhu, X.P.; Wang, J.H.; Huang, L.M.; Si, K.; Sheppard, C.J.R.; Gong, W. Two-photon focal modulation microscopy for high-resolution imaging in deep tissue. J. Biophotonics 2019, 12, 8–15. [Google Scholar] [CrossRef] [PubMed] [Green Version]
- Urban, B.E.; Yi, J.; Chen, S.Y.; Dong, B.Q.; Zhu, Y.L.; DeVries, S.H.; Backman, V.; Zhang, H.F. Super-resolution two-photon microscopy via scanning patterned illumination. Phys. Rev. E 2015, 91, 33–51. [Google Scholar] [CrossRef] [Green Version]
- Winter, P.W.; York, A.G.; Nogare, D.D.; Ingaramo, M.; Christensen, R.; Chitnis, A.; Patterson, G.H.; Shroff, H. Two-photon instant structured illumination microscopy improves the depth penetration of super-resolution imaging in thick scattering samples. Optica 2014, 1, 181–191. [Google Scholar] [CrossRef] [PubMed] [Green Version]
- Ingaramo, M.; York, A.G.; Wawrzusin, P.; Milberg, O.; Hong, A.; Weigert, R.; Shroff, H.; Patterson, G.H. Two-photon excitation improves multifocal structured illumination microscopy in thick scattering tissue. Proc. Natl. Acad. Sci. USA 2014, 111, 5254–5259. [Google Scholar] [CrossRef] [PubMed] [Green Version]
- Campagnola, P.J.; Millard, A.C.; Terasaki, M.; Hoppe, P.E.; Malone, C.J.; Mohler, W.A. Three-dimensional high-resolution second-harmonic generation imaging of endogenous structural proteins in biological tissues. Biophys. J. 2012, 103, 627–630. [Google Scholar] [CrossRef] [Green Version]
- Lim, H.; Danias, J. Label-free morphometry of retinal nerve fiber bundles by second-harmonic-generation microscopy. Opt. Lett. 2012, 37, 2316–2318. [Google Scholar] [CrossRef]
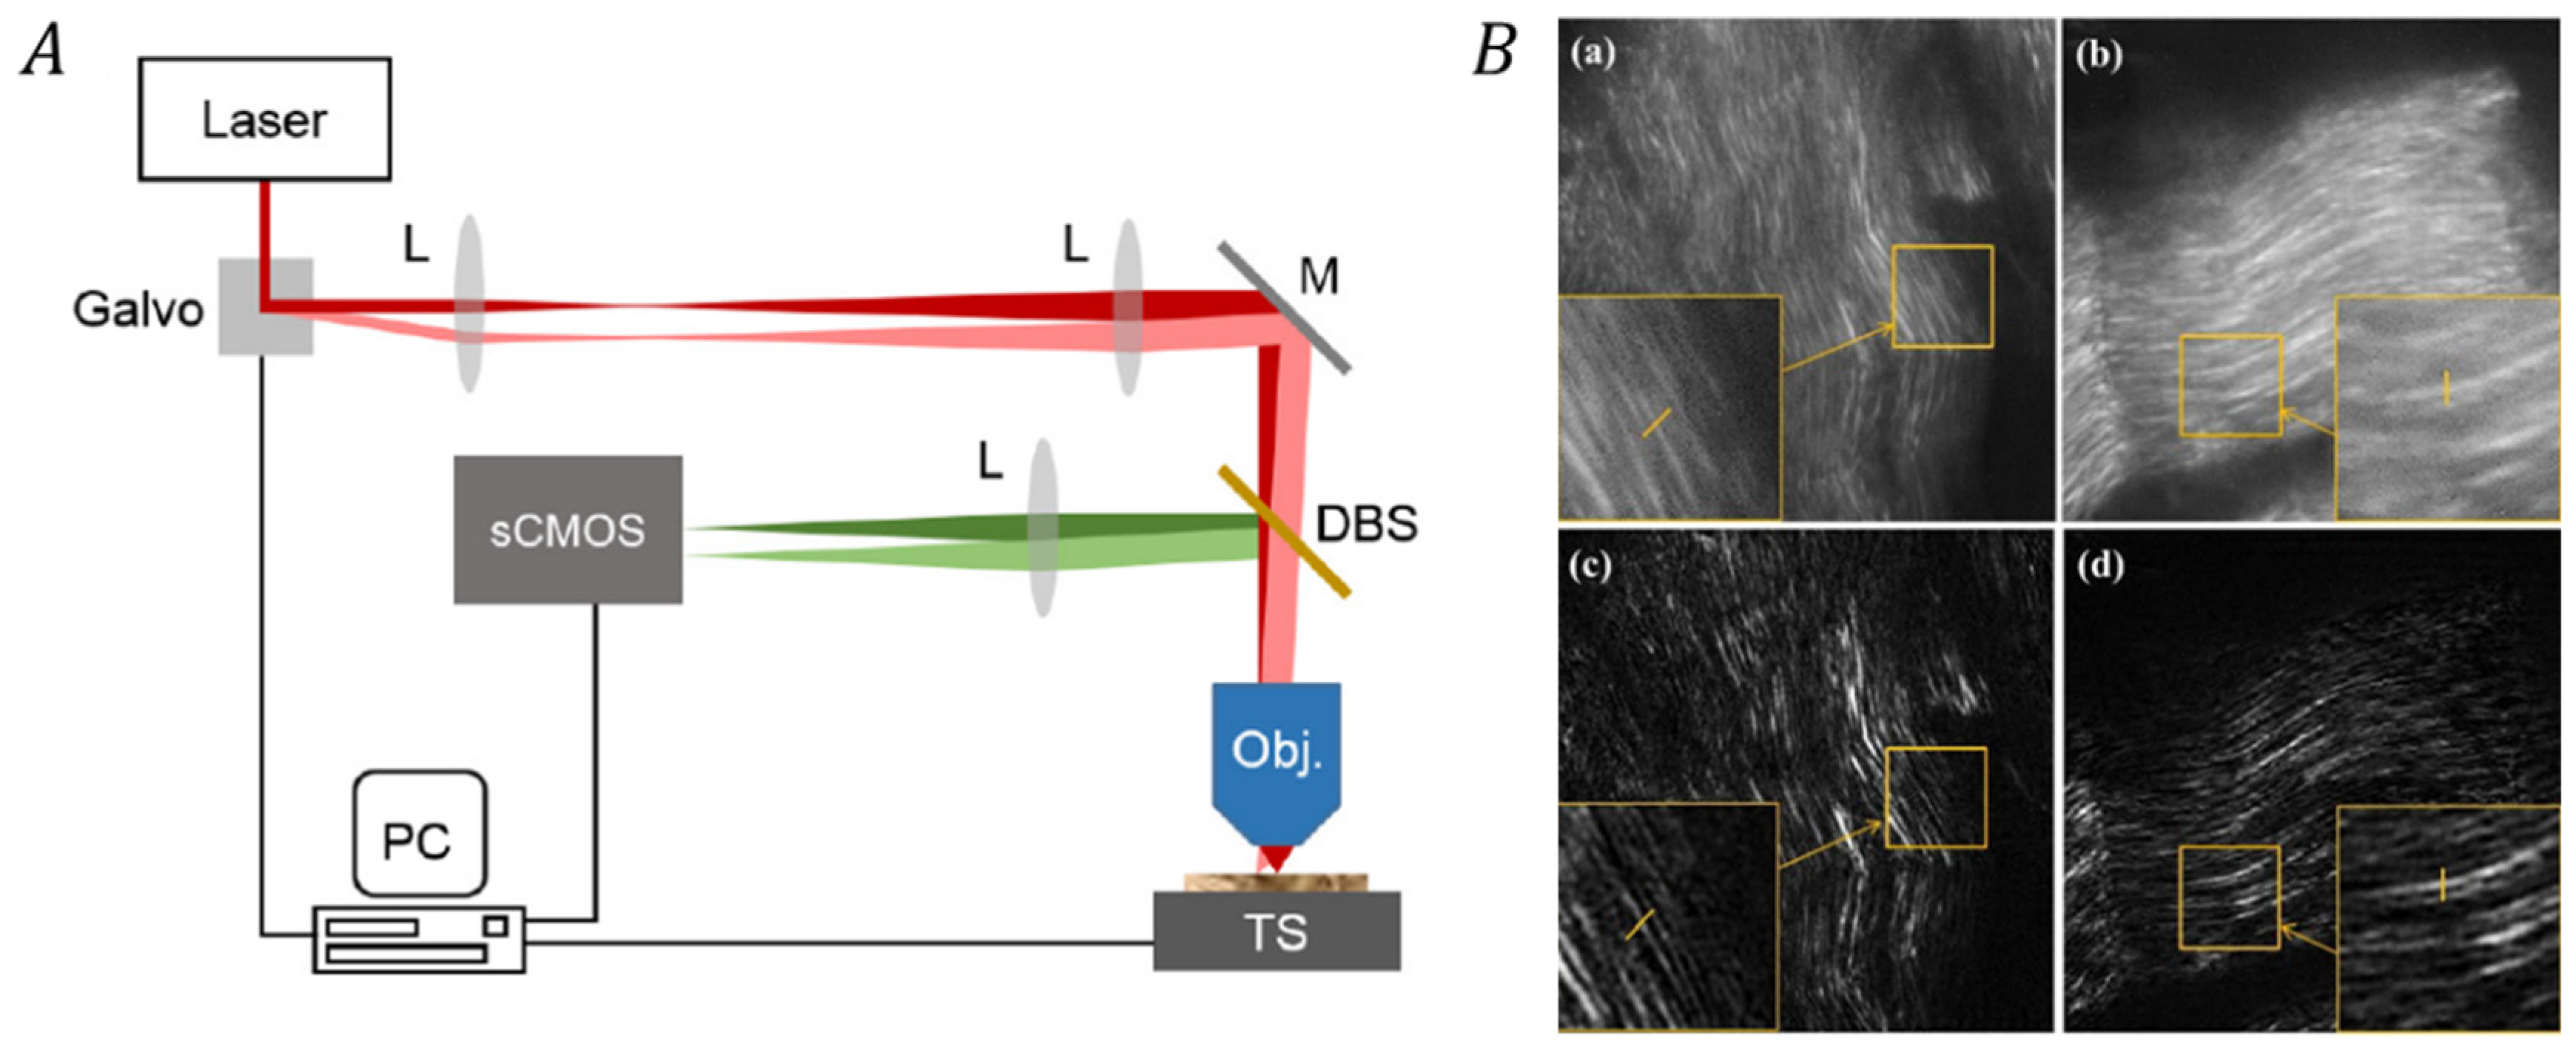
- Yeh, C.H.; Tan, C.Z.; Cheng, C.H.A.; Hung, J.T.; Chen, S.Y. Improving resolution of second harmonic generation microscopy via scanning structured illumination. Biomed. Opt. Express 2018, 9, 6081–6089. [Google Scholar] [CrossRef]
- Chen, B.C.; Legant, W.R.; Wang, K.; Shao, L.; Milkie, D.E.; Davidson, M.W.; Janetopoulos, C.; Wu, X.F.S.; Hammer, J.A.; Liu, Z.; et al. Lattice light-sheet microscopy: Imaging molecules to embryos at high spatiotemporal resolution. Science 2014, 346, 439–450. [Google Scholar] [CrossRef] [Green Version]
- Li, D.; Shao, L.; Chen, B.C.; Zhang, X.; Zhang, M.S.; Moses, B.; Milkie, D.E.; Beach, J.R.; Hammer, J.A.; Pasham, M.; et al. Extended-resolution structured illumination imaging of endocytic and cytoskeletal dynamics. Science 2015, 349, 1425–1436. [Google Scholar] [CrossRef] [Green Version]
- Cao, Z.L.; Zhai, C.J.; Li, J.H.; Xian, F.L.; Pei, S.X. Light sheet based on one-dimensional Airy beam generated by single cylindrical lens. Opt. Commun. 2017, 393, 11–16. [Google Scholar] [CrossRef]
- Schneider, J.; Aegerter, C.M. Dynamic light sheet generation and fluorescence imaging behind turbid media. J. Eur. Opt. Soc.-Rapid 2018, 14, 1024–1030. [Google Scholar] [CrossRef] [Green Version]
- Gu, P.; Huang, Z.; Ping, M.; Li, W.; Xiang, M.; Feng, X.; Kuang, D. Thinner and longer working distance light sheet illumination and microscopic imaging. IEEE J. Sel. Top. Quant. 2021, 27, 1–7. [Google Scholar] [CrossRef]
- Görlitz, F.; Corcoran, D.; Garcia Castano, E.; Leitinger, B.; Neil, M.; Dunsby, C.; French, P. Mapping molecular function to biological nanostructure: Combining structured illumination microscopy with fluorescence lifetime Imaging (SIM + FLIM). Photonics 2017, 4, 40. [Google Scholar] [CrossRef] [Green Version]
- Xu, H.F.; Abe, T.; Liu, J.K.H.; Zalivina, I.; Hohenester, E.; Leitinger, B. Normal activation of discoidin domain receptor 1 mutants with disulfide cross-links, insertions, or deletions in the extracellular juxtamembrane region. J. Biol. Chem. 2014, 289, 13565–13574. [Google Scholar] [CrossRef] [Green Version]
- Mihai, C.; Chotani, M.; Elton, T.S.; Agarwal, G. Mapping of DDR1 distribution and oligomerization on the cell surface by FRET microscopy. J. Mol. Biol. 2013, 425, 1842–1846. [Google Scholar] [CrossRef]
- Carafoli, F.; Bihan, D.; Stathopoulos, S.; Konitsiotis, A.D.; Kvansakul, M.; Farndale, R.W.; Leitinger, B.; Hohenester, E. Crystallographic insight into collagen recognition by discoidin domain receptor. Structure 2009, 17, 1573–1581. [Google Scholar] [CrossRef] [Green Version]
- Lleres, D.; James, J.; Swift, S.; Norman, D.G.; Lamond, A.I. Quantitative analysis of chromatin compaction in living cells using FLIM-FRET. J. Cell Biol. 2009, 187, 481–496. [Google Scholar] [CrossRef] [PubMed] [Green Version]
- Kouwenberg, J.J.M.; Kremers, G.J.; Slotman, J.A.; Wolterbeek, H.T.; Houtsmuller, A.B.; Denkova, A.G.; Bos, A.J.J. Alpha particle spectroscopy using FNTD and SIM super-resolution microscopy. J. Microsc. 2018, 270, 326–334. [Google Scholar] [CrossRef] [PubMed] [Green Version]
- Moen, E.; Bannon, D.; Kudo, T.; Graf, W.; Covert, M.; Van Valen, D. Deep learning for cellular image analysis. Nat. Methods 2019, 16, 1233–1246. [Google Scholar] [CrossRef] [PubMed]
- Belthangady, C.; Royer, L.A. Applications, promises, and pitfalls of deep learning for fluorescence image reconstruction. Nat. Methods 2019, 16, 1215–1225. [Google Scholar] [CrossRef] [PubMed]
- Wang, H.D.; Rivenson, Y.; Jin, Y.Y.; Wei, Z.S.; Gao, R.; Gunaydin, H.; Bentolila, L.A.; Kural, C.; Ozcan, A. Deep learning enables cross-modality super-resolution in fluorescence microscopy. Nat. Methods 2019, 16, 103–109. [Google Scholar] [CrossRef]
- Jin, L.; Liu, B.; Zhao, F.; Hahn, S.; Dong, B.; Song, R.; Elston, T.C.; Xu, Y.; Hahn, K.M. Deep learning enables structured illumination microscopy with low light levels and enhanced speed. Nat. Commun. 2020, 11, 1934–1940. [Google Scholar] [CrossRef] [PubMed] [Green Version]
- Schultz, T.; Puig, A.; Kainz, B. Foreword to the special section on the eurographics workshop on visual computing for biology and medicine (VCBM) at medical image computing and computer assisted intervention (MICCAI). Comput. Graph-Uk 2019, 83, 5–6. [Google Scholar] [CrossRef]
- Falk, T.; Mai, D.; Bensch, R.; Cicek, O.; Abdulkadir, A.; Marrakchi, Y.; Bohm, A.; Deubner, J.; Jackel, Z.; Seiwald, K.; et al. U-Net: Deep learning for cell counting, detection, and morphometry. Nat. Methods 2019, 16, 351–367. [Google Scholar] [CrossRef]
- Ahn, H.; Yim, C. Convolutional neural networks using skip connections with layer groups for super-resolution image reconstruction based on deep learning. Appl. Sci. 2020, 10, 1959. [Google Scholar] [CrossRef] [Green Version]
- Qiao, C.; Li, D.; Guo, Y.; Liu, C.; Jiang, T.; Dai, Q.; Li, D. Evaluation and development of deep neural networks for image super-resolution in optical microscopy. Nat. Methods 2021, 18, 194–202. [Google Scholar] [CrossRef]
- Zhang, Y.L.; Li, K.P.; Li, K.; Wang, L.C.; Zhong, B.N.; Fu, Y. Image super-resolution using very deep residual channel attention networks. Lect. Notes Comput. Sci. 2018, 11211, 294–310. [Google Scholar]
- Ding, L.; Wang, Y.; Laganiere, R.; Luo, X.B.; Huang, D.; Zhang, H.L. Learning efficient single stage pedestrian detection by squeeze-and-excitation network. Neural Comput. Appl. 2021, 15, 40–43. [Google Scholar] [CrossRef]
- Wu, C.; Zou, Y.X.; Zhan, J.H. DA-U-Net: Densely connected convolutional networks and decoder with attention gate for retinal vessel segmentation. In IOP Conference Series: Materials Science and Engineering; IOP Publishing: Bristol, UK, 2019; Volume 533, pp. 57–81. [Google Scholar]
- Ran, C.Y.; Liu, P.; Qian, Y.L.; He, Y.C.; Wang, Q. U-shaped densely connected convolutional networks for automatic 3D cardiovascular MR segmentation. Robio 2018, 85, 1010–1015. [Google Scholar]
- Gomides, M.D.A.; Oliveira, A.O.S.M.; de Araujo, C.C.Q.; Resende, N.P. Learning based on medical training problems: An integrative literature review. Rev. Edapeci 2019, 19, 27–41. [Google Scholar] [CrossRef]
- Essa, I.; Kang, S.B.; Pollefeys, M. Guest editors’ introduction to the special section on award-winning papers from the ieee conference on computer vision and pattern recognition. IEEE T Pattern Anal. 2011, 33, 2339–2340. [Google Scholar] [CrossRef] [PubMed]
- Goodfellow, I.J.; Pouget-Abadie, J.; Mirza, M.; Xu, B.; Warde-Farley, D.; Ozair, S.; Courville, A.; Bengio, Y. Generative adversarial nets. Adv. Neural Inf. Process. Syst. 2014, 27, 2672–2680. [Google Scholar]
- Bezryadina, A.; Zhao, J.; Xia, Y.; Zhang, X.; Liu, Z. High spatiotemporal resolution imaging with localized plasmonic structured illumination microscopy. ACS Nano 2018, 12, 8248–8254. [Google Scholar] [CrossRef] [Green Version]
- Liang, H.M.; Wang, J.Q. Simulation of interference nanolithography of second-exciting surface-plasmon polartions for metal nanograting fabrication. Chin. Phys. Lett. 2011, 28, 16–20. [Google Scholar] [CrossRef]
- Krishnamurthi, V.; BenItzhak, I.; Carnes, K.D. Projectile charge dependence of ionization and fragmentation of CO in fast collisions. J. Phys. B At. Mol. Opt. Phys. 1996, 29, 287–297. [Google Scholar] [CrossRef]
- Song, W.B.; Qi, Y.; Zhang, X.P.; Wan, M.L.; He, J.N. Controlling the interference between localized and delocalized surface plasmons via incident polarization for optical switching. Int. J. Mod. Phys. B 2018, 32, 72–80. [Google Scholar] [CrossRef]
- Wei, F.; Liu, Z. Plasmonic structured illumination microscopy. Nano Lett. 2010, 10, 2531–2536. [Google Scholar] [CrossRef] [PubMed]
- Wang, Q.; Bu, J.; Tan, P.S.; Yuan, G.H.; Teng, J.H.; Wang, H.; Yuan, X.C. Subwavelength-sized plasmonic structures for wide-field optical microscopic imaging with super resolution. Plasmonics 2012, 7, 427–433. [Google Scholar] [CrossRef]
- Fernandez-Dominguez, A.I.; Liu, Z.W.; Pendry, J.B. Coherent fourf fold super-resolution imaging with composite photonic-plasmonic structured illumination. Acs Photonics 2015, 2, 341–348. [Google Scholar] [CrossRef]
- Tan, Q.; Xu, Z.; Zhang, D.H.; Yu, T.; Zhang, S.; Luo, Y. Polarization-controlled plasmonic structured illumination. Nano Lett. 2020, 20, 2602–2608. [Google Scholar] [CrossRef]
- Huang, L.L.; Chen, X.Z.; Bai, B.F.; Tan, Q.F.; Jin, G.F.; Zentgraf, T.; Zhang, S. Helicity dependent directional surface plasmon polariton excitation using a metasurface with interfacial phase discontinuity. Light Sci. Appl. 2013, 2, 33–35. [Google Scholar] [CrossRef] [Green Version]
- Robles, F.E.; Wax, A. Separating the scattering and absorption coefficients using the real and imaginary parts of the refractive index with low-coherence interferometry. Opt. Lett. 2010, 35, 2843–2845. [Google Scholar] [CrossRef] [PubMed] [Green Version]
- Wang, R.; Wang, Z.; Millet, L.; Gillette, M.U.; Levine, A.J.; Popescu, G. Dispersion-relation phase spectroscopy of intracellular transport. Opt. Express 2011, 19, 20571–20579. [Google Scholar] [CrossRef] [Green Version]
- Eldridge, W.J.; Sheinfeld, A.; Rinehart, M.T.; Wax, A. Imaging deformation of adherent cells due to shear stress using quantitative phase imaging. Opt. Lett. 2016, 41, 352–355. [Google Scholar] [CrossRef] [PubMed]
- Sung, Y.J.; Choi, W.; Fang-Yen, C.; Badizadegan, K.; Dasari, R.R.; Feld, M.S. Optical diffraction tomography for high resolution live cell imaging. Opt. Express 2009, 17, 266–277. [Google Scholar] [CrossRef]
- Ohno, S.; Iida, D.; Toge, K.; Manabe, T. High-resolution measurement of differential mode delay of few-mode fiber using phase reference technique for swept-frequency interferometry. Opt. Fiber Technol. 2018, 40, 56–61. [Google Scholar] [CrossRef]
- Gorecki, C. Phase-correlation techniques for quasi-real-time measurement of deformations with digital speckle interferometry. Appl. Opt. 1994, 33, 2933–2938. [Google Scholar] [CrossRef]
- Mehta, D.S.; Sharma, A.; Dubey, V.; Singh, V.; Ahmad, A. Quantitative phase imaging of biological cells and tissues using singleshot white light interference microscopy and phase subtraction method for extended range of measurement. Quant. Phase Imaging II 2016, 9718, 18–28. [Google Scholar]
- Mehta, D.S.; Singh, V.; Tayal, S.; Bhatt, S.; Dubey, V.K. Speckle-free quantitative phase microscopy using pseudo-thermal light source for label-free imaging of biological cells and tissues with high temporal phase stability and spatial phase sensitivity. Label-Free. Biomed. Imaging Sens. (LBIS) 2020, 11251, 77–86. [Google Scholar]
- Liebling, M.; Blu, T.; Unser, M. Complex-wave retrieval from a single off-axis hologram. J. Opt. Soc. Am. A 2004, 21, 367–377. [Google Scholar] [CrossRef] [Green Version]
- Reddy, B.L.; Ramachandran, P.; Nelleri, A. Compressive complex wave retrieval from a single off-axis digital fresnel hologram for quantitative phase imaging and microlens characterization. Opt. Commun. 2021, 478, 30–48. [Google Scholar]
- Takeda, M.; Ina, H.; Kobayashi, S. Fourier-transform method of fringe-pattern analysis for computer-based topography and interferometry. J. Opt. Soc. Am. 1982, 72, 156–160. [Google Scholar] [CrossRef]
- Chowdhury, S.; Eldridge, W.J.; Wax, A.; Izatt, J.A. Structured illumination multimodal 3D-resolved quantitative phase and fluorescence sub-diffraction microscopy. Biomed. Opt. Express 2017, 8, 2496–2518. [Google Scholar] [CrossRef] [PubMed] [Green Version]
- Kim, K.; Park, W.S.; Na, S.; Kim, S.; Kim, T.; Heo, W.D.; Park, Y. Correlative three-dimensional fluorescence and refractive index tomography: Bridging the gap between molecular specificity and quantitative bioimaging. Biomed. Opt. Express 2017, 8, 5688–5697. [Google Scholar] [CrossRef] [Green Version]
- Schurmann, M.; Cojoc, G.; Girardo, S.; Ulbricht, E.; Guck, J.; Muller, P. Three-dimensional correlative single-cell imaging utilizing fluorescence and refractive index tomography. J. Biophotonics 2018, 11, 64–68. [Google Scholar] [CrossRef] [Green Version]
- Jung, J.; Hong, S.J.; Kim, H.B.; Kim, G.; Lee, M.; Shin, S.; Lee, S.; Kim, D.J.; Lee, C.G.; Park, Y. Label-free non-invasive quantitative measurement of lipid contents in individual microalgal cells using refractive index tomography. Sci. Rep. 2018, 8, 22–45. [Google Scholar] [CrossRef]
- Shin, S.; Kim, D.; Kim, K.; Park, Y. Super-resolution three-dimensional fluorescence and optical diffraction tomography of live cells using structured illumination generated by a digital micromirror device. Sci. Rep. 2018, 8, 9183–9190. [Google Scholar] [CrossRef] [Green Version]
- Calabuig, A.; Mugnano, M.; Miccio, L.; Grilli, S.; Ferraro, P. Investigating fibroblast cells under “safe” and “injurious” blue-light exposure by holographic microscopy. J. Biophotonics 2017, 10, 919–927. [Google Scholar] [CrossRef] [PubMed]
- Lee, K.; Kim, K.; Kim, G.; Shin, S.; Park, Y. Time-multiplexed structured illumination using a DMD for optical diffraction tomography. Opt. Lett. 2017, 42, 999–1002. [Google Scholar] [CrossRef] [PubMed] [Green Version]
- Heintzmann, R.; Huser, T. Super-resolution structured illumination microscopy. Chem. Rev. 2017, 117, 13890–13908. [Google Scholar] [CrossRef] [PubMed]
- Gomez-Varela, A.I.; Stamov, D.R.; Miranda, A.; Alves, R.; Barata-Antunes, C.; Dambournet, D.; Drubin, D.G.; Paiva, S.; De Beule, P.A.A. Simultaneous co-localized super-resolution fluorescence microscopy and atomic force microscopy: Combined SIM and AFM platform for the life sciences. Sci. Rep. 2020, 10, 236–300. [Google Scholar]
- Cainero, I.; Cerutti, E.; Faretta, M.; Dellino, G.I.; Pelicci, P.G.; Diaspro, A.; Lanzano, L. Measuring Nanoscale Distances by Struc tured Illumination Microscopy and Image Cross-Correlation Spectroscopy (SIM-ICCS). Sensors 2021, 21, 2010. [Google Scholar] [CrossRef]
- Kounatidis, I.; Stanifer, M.L.; Phillips, M.A.; Paul-Gilloteaux, P.; Heiligenstein, X.; Wang, H.C.; Okolo, C.A.; Fish, T.M.; Spink, M.C.; Stuart, D.I.; et al. 3D Correlative Cryo-Structured Illumination Fluorescence and Soft X-ray Microscopy Elucidates Reovirus Intracellular Release Pathway. Cell 2020, 182, 515–520. [Google Scholar] [CrossRef]
- Phillips, M.A.; Harkiolaki, M.; Pinto, D.M.S.; Parton, R.M.; Palanca, A.; Garcia-Moreno, M.; Kounatidis, I.; Sedat, J.W.; Stuart, D.I.; Castello, A.; et al. CryoSIM: Super-resolution 3D structured illumination cryogenic fluorescence microscopy for correlated ultrastructural imaging. Optica 2020, 7, 802–812. [Google Scholar] [CrossRef] [PubMed]
- Chowdhury, S.; Izatt, J. Structured illumination quantitative phase microscopy for enhanced resolution amplitude and phase imaging. Biomed. Opt. Express 2013, 4, 1795–1805. [Google Scholar]
- Chowdhury, S.; Izatt, J. Structured illumination diffraction phase microscopy for broadband, subdiffraction resolution, quantitative phase imaging. Opt. Lett. 2014, 39, 1015–1018. [Google Scholar] [CrossRef] [Green Version]
- Gotz, R.; Kunz, T.C.; Fink, J.; Solger, F.; Schlegel, J.; Seibel, J.; Kozjak-Pavlovic, V.; Rudel, T.; Sauer, M. Nanoscale imaging of bacterial infections by sphingolipid expansion microscopy. Nat. Commun. 2020, 11, 66–71. [Google Scholar] [CrossRef]
- Mohammadian, S.; Agronskaia, A.V.; Blab, G.A.; van Donselaar, E.G.; de Heus, C.; Liv, N.; Klumperman, J.; Gerritsen, H.C. Integrated super resolution fluorescence microscopy and transmission electron microscopy. Ultramicroscopy 2020, 215, 112–120. [Google Scholar] [CrossRef]
- Zhang, Z.; Martis, J.; Xu, X.T.; Li, H.K.; Xie, C.L.; Takasuka, B.; Lee, J.; Roy, A.K.; Majumdar, A. Photoabsorption imaging at nanometer scales using secondary electron analysis. Nano Lett. 2021, 21, 1935–1942. [Google Scholar] [CrossRef]
- Wu, Y.C.; Shroff, H. Faster, sharper, and deeper: Structured illumination microscopy for biological imaging. Nat. Methods 2018, 15, 1011–1019. [Google Scholar] [CrossRef]
- Shaw, S.L.; Thoms, D.; Powers, J. Structured illumination approaches for super-resolution in plant cells. Microscopy 2019, 68, 37–44. [Google Scholar] [CrossRef]
- Gokce, M.C.; Baykal, Y.; Ata, Y. Adaptive optics effect on performance of BPSK-SIM oceanic optical wireless communication systems with aperture averaging in weak turbulence. J. Quant. Spectrosc. Radiat. Transf. 2020, 256, 301–313. [Google Scholar] [CrossRef]
- Tamura, K.; Hara-Nishimura, I. The molecular architecture of the plant nuclear pore complex. J. Exp. Bot. 2013, 64, 823–832. [Google Scholar] [CrossRef] [Green Version]
- Zhang, Y.Q.; Li, S.; Zeng, C.; Huang, G.X.; Zhu, X.C.; Wang, Q.F.; Wang, K.P.; Zhou, Q.; Yan, C.Y.; Zhang, W.S.; et al. Molecular architecture of the luminal ring of the Xenopus laevis nuclear pore complex. Cell Res. 2020, 30, 532–540. [Google Scholar] [CrossRef] [PubMed]
- Du, M.T.; Zhu, G.L.; Chen, H.Z.; Han, R. Actin filaments altered distribution in wheat (Triticum aestivum) "Bending Root" to respond to enhanced Ultraviolet-B radiation. Braz. J. Biol. 2021, 81, 684–691. [Google Scholar] [CrossRef]
- Hosokawa, N.; Kuragano, M.; Yoshino, A.; Shibata, K.; Uyeda, T.Q.P.; Tokuraku, K. Unidirectional cooperative binding of fimbrin actin-binding domain 2 to actin filament. Biochem. Biophys. Res. Commun. 2021, 552, 59–65. [Google Scholar] [CrossRef] [PubMed]
- Jia, H.X.; Gao, Z.Y.; Yu, F.; Guo, H.F.; Li, B.Y. Actin-binding protein anillin promotes the progression of hepatocellular carcinoma in vitro and in mice. Exp. Ther. Med. 2021, 21, 99–120. [Google Scholar] [CrossRef]
- Hu, S.H.; Chen, J.X.; Fabry, B.; Numaguchi, Y.; Gouldstone, A.; Ingber, D.E.; Fredberg, J.J.; Butler, J.P.; Wang, N. Intracellular stress tomography reveals stress focusing and structural anisotropy in cytoskeleton of living cells. Am. J. Physiol. Physiol. 2003, 285, C1082–C1090. [Google Scholar] [CrossRef] [PubMed] [Green Version]
- Wang, N.; Naruse, K.; Stamenovic, D.; Fredberg, J.J.; Mijailovich, S.M.; Toric-Norrelykke, I.M.; Polte, T.; Mannix, R.; Ingber, D.E. Mechanical behavior in living cells consistent with the tensegrity model. Proc. Natl. Acad. Sci. USA 2001, 98, 7765–7770. [Google Scholar] [CrossRef] [PubMed] [Green Version]
- Janmey, P.A. The cytoskeleton and cell signaling: Component localization and mechanical coupling. Physiol. Rev. 1998, 78, 763–781. [Google Scholar] [CrossRef] [Green Version]
- Girardeau, V.; Jacquin, O.; Hugon, O.; Riviere, B.; van der Sanden, B.; Lacot, E. Photo-acoustic tomography based on laser optical feedback imaging of surface displacements. Appl. Opt. 2019, 58, 7195–7204. [Google Scholar] [CrossRef] [PubMed]
- Wang, L.H.V.; Wang, X.D.; Ku, G.; Xie, X.Y.; Stoica, G. High-resolution photoacoustic tomography. IEEE Leos Ann. Mtg. 2004, 17, 767–768. [Google Scholar]
- Logothetis, N.K. What we can do and what we cannot do with fMRI. Nature 2008, 453, 869–878. [Google Scholar] [CrossRef] [PubMed]
- Phelps, M.E. Positron computed-tomography studies of cerebral glucose-metabolism in man-theory and application in nuclear-medicine. Semin. Nucl. Med. 1981, 11, 32–49. [Google Scholar] [CrossRef]
- Speir, A.M. Commentary: Computed tomography-based hemodynamic index for aortic dissection: Ciceronian or say what? J. Thorac. Cardiovasc. Surg. 2021, 162, E165–E176. [Google Scholar] [CrossRef]
- Sun, Q.; Xia, Y.D.; Klinger, J.; Seifert, R.; Kane, J.; Thompson, V.; Chen, Q.S. X-ray computed tomography-based porosity analysis: Algorithms and application for porous woody biomass. Powder Technol. 2021, 388, 496–504. [Google Scholar] [CrossRef]
- Deffieux, T.; Demene, C.; Pernot, M.; Tanter, M. Functional ultrasound neuroimaging: A review of the preclinical and clinical state of the art. Curr. Opin. Neurobiol. 2018, 50, 128–135. [Google Scholar] [CrossRef] [PubMed]
- Elmaghrabi, M.R.; Correia, J.J.; Heil, P.J.; Pate, T.M.; Cobb, C.E.; Pilkis, S.J. Tissue distribution, immunoreactivity, and physical-properties of 6-phosphofructo-2-kinase fructose-2,6-bisphosphatase. Proc. Natl. Acad. Sci. USA 1986, 83, 5005–5009. [Google Scholar] [CrossRef] [PubMed] [Green Version]
- Tamura, T.; Hamachi, I. Recentprogress in design of protein-based fluorescent biosensors and their cellular applications. ACS Chem. Biol. 2014, 9, 2708–2717. [Google Scholar] [CrossRef]
- Greenwald, E.C.; Mehta, S.; Zhang, J. Genetically encoded fluorescent biosensors illuminate the spatiotemporal regulation of signaling networks. Chem. Rev. 2018, 118, 11707–11794. [Google Scholar] [CrossRef]
- Algar, W.R.; Hildebrandt, N.; Vogel, S.S.; Medintz, I.L. FRET as a biomolecular research tool-understanding its potential while avoiding pitfalls. Nat. Methods 2019, 16, 815–829. [Google Scholar] [CrossRef] [PubMed]


| Type | Technique | Characteristic | Resolution | Application |
|---|---|---|---|---|
| SRM | STORM-SIM [52] | The accurate position information for cells provided by STORM is placed in the structural light background of SIM. | Lateral: 40 nm (STORM); 150 nm (SIM) | Multicolor imaging |
| STED-SIM [64,65] | Achieving nonlinear effects through STED beams. | Lateral: 59.9 nm Theoretically; Axial: 163.2 nm Theoretically | 3D imaging | |
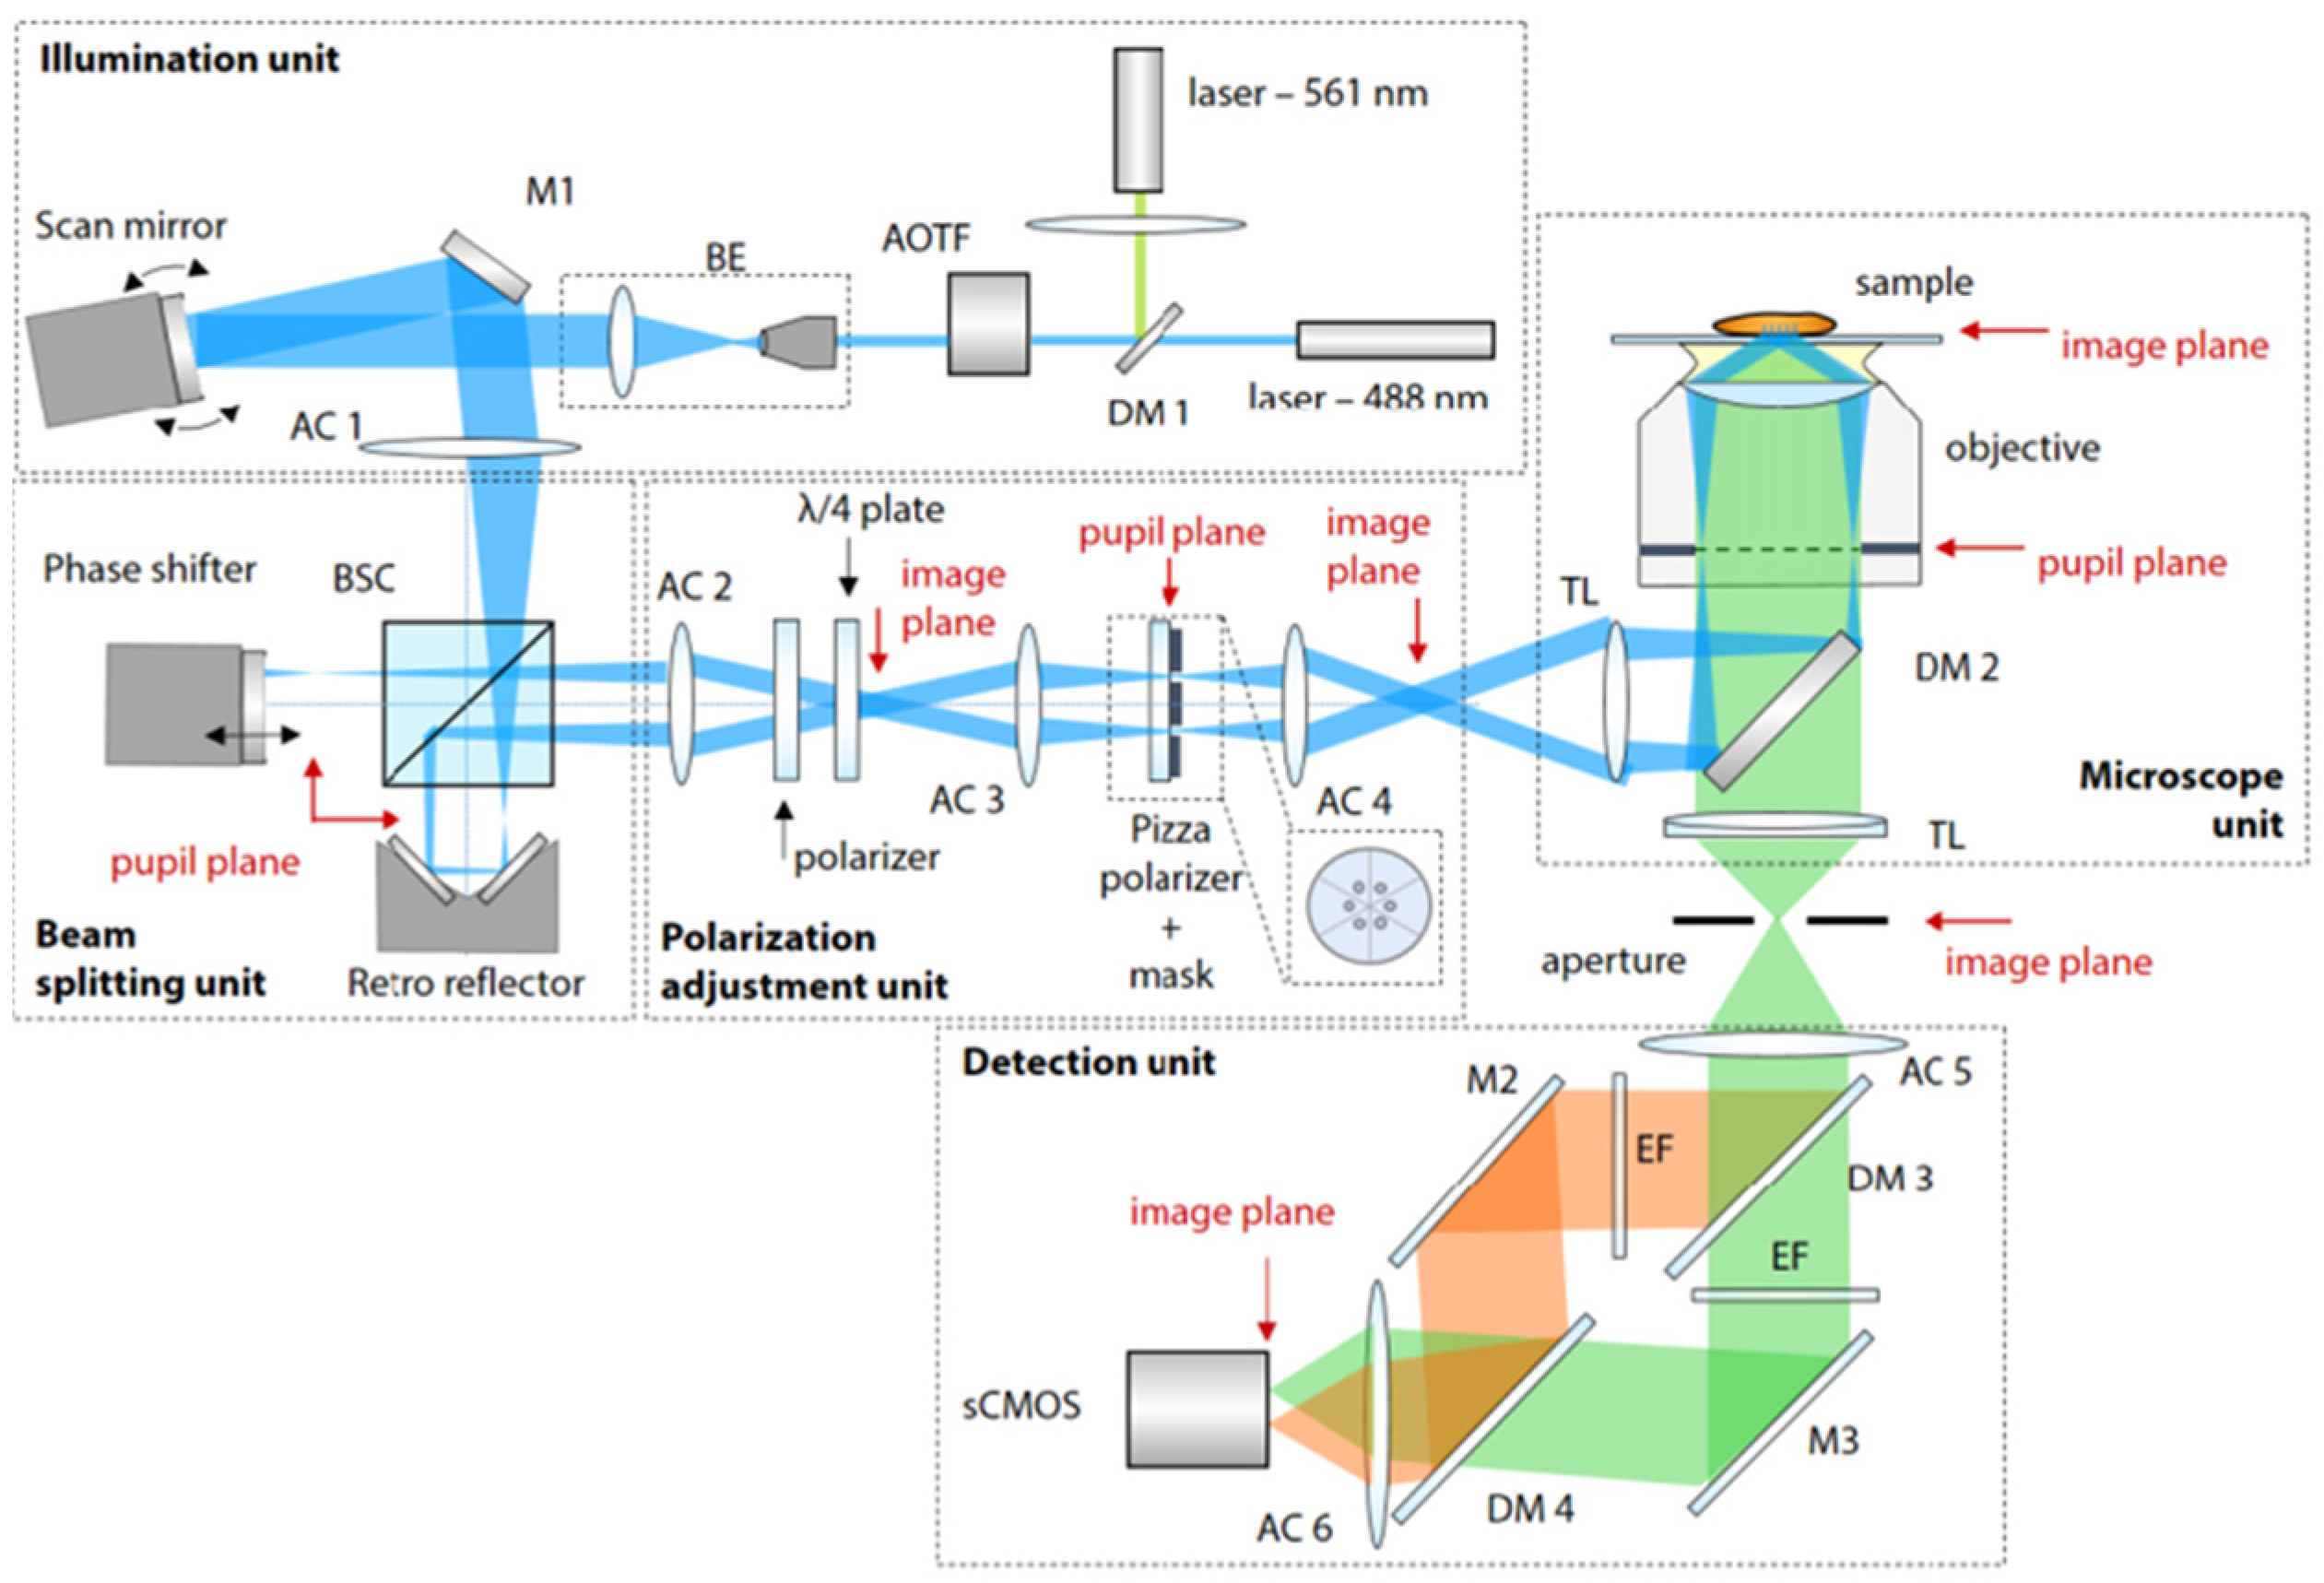
| Other microscopy techniques | SIM-TIRF [75] | Faster imaging speed for live-cell high resolution imaging. | Lateral: 110 nm | Multicolor, live-cell imaging |
| 2P-SIM [93] | Illumination pattern is generated by temporal modulation and spatial scanning of 2P excitation with larger sample penetration depth. | Lateral: 145 nm (imaging depth greater than 100 µm) | Thick sample imaging | |
| SHG-SIM [98] | Enables direct imaging of biological tissues that are non-centrosymmetric. | Lateral: 231 nm; Axial: 693 nm | SHG imaging | |
| Other techniques | DL-SIM [113,117] | Fewer raw images are required to achieve multicolor live-cell SRM under low-light illumination conditions. | Lateral: 160 nm | Multicolor, live-cell imaging |
| PSIM [125,129, 132] | Higher spatial frequency interference patterns is created by near field surface plasmon waves. | Lateral: 75 nm | Near-field 2D imaging | |
| QP-SIM [145,157,158] | Compatible with QP and fluorescence imaging. | Lateral: QP: 230 nm; SIM: 180 nm; Axial: QP: 210 nm | 3D multi-modal imaging |
Publisher’s Note: MDPI stays neutral with regard to jurisdictional claims in published maps and institutional affiliations. |
© 2021 by the authors. Licensee MDPI, Basel, Switzerland. This article is an open access article distributed under the terms and conditions of the Creative Commons Attribution (CC BY) license (https://creativecommons.org/licenses/by/4.0/).
Share and Cite
Wang, M.; Chen, J.; Wang, L.; Zheng, X.; Zhou, J.; Zeng, Y.; Qu, J.; Shao, Y.; Gao, B.Z. Recent Progress in the Correlative Structured Illumination Microscopy. Chemosensors 2021, 9, 364. https://0-doi-org.brum.beds.ac.uk/10.3390/chemosensors9120364
Wang M, Chen J, Wang L, Zheng X, Zhou J, Zeng Y, Qu J, Shao Y, Gao BZ. Recent Progress in the Correlative Structured Illumination Microscopy. Chemosensors. 2021; 9(12):364. https://0-doi-org.brum.beds.ac.uk/10.3390/chemosensors9120364
Chicago/Turabian StyleWang, Meiting, Jiajie Chen, Lei Wang, Xiaomin Zheng, Jie Zhou, Youjun Zeng, Junle Qu, Yonghong Shao, and Bruce Zhi Gao. 2021. "Recent Progress in the Correlative Structured Illumination Microscopy" Chemosensors 9, no. 12: 364. https://0-doi-org.brum.beds.ac.uk/10.3390/chemosensors9120364