Article

Identification of Mint Scents Using a QCM Based E-Nose

1
Institute of Functional Interfaces (IFG), Karlsruhe Institute of Technology (KIT), Hermann-Von-Helmholtz-Platz 1, Eggenstein-Leopoldshafen, 76344 Karlsruhe, Germany
2
Light Technology Institute, Karlsruhe Institute of Technology, Engesserstraße 13, 76131 Karlsruhe, Germany
3
Karlsruhe Institute of Technology, Botanical Institute, Molecular Cell Biology, Fritz-Haber-Weg, 76131 Karlsruhe, Germany
4
Institute of Microstructure Technology, 223, Karlsruhe Institute of Technology, Hermann-von-Helmholtz-Platz 1, Eggenstein-Leopoldshafen, 76344 Karlsruhe, Germany
*
Author to whom correspondence should be addressed.
Submission received: 30 December 2020 / Revised: 29 January 2021 / Accepted: 31 January 2021 / Published: 4 February 2021
(This article belongs to the Special Issue Organic-Inorganic Hybrid Chemo- and Bio-Sensors)

Abstract

:
Mints emit diverse scents that exert specific biological functions and are relevance for applications. The current work strives to develop electronic noses that can electronically discriminate the scents emitted by different species of Mint as alternative to conventional profiling by gas chromatography. Here, 12 different sensing materials including 4 different metal oxide nanoparticle dispersions (AZO, ZnO, SnO2, ITO), one Metal Organic Frame as Cu(BPDC), and 7 different polymer films, including PVA, PEDOT:PSS, PFO, SB, SW, SG, and PB were used for functionalizing of Quartz Crystal Microbalance (QCM) sensors. The purpose was to discriminate six economically relevant Mint species (Mentha x piperita, Mentha spicata, Mentha spicata ssp. crispa, Mentha longifolia, Agastache rugosa, and Nepeta cataria). The adsorption and desorption datasets obtained from each modified QCM sensor were processed by three different classification models, including Principal Component Analysis (PCA), Linear Discriminant Analysis (LDA), and k-Nearest Neighbor Analysis (k-NN). This allowed discriminating the different Mints with classification accuracies of 97.2% (PCA), 100% (LDA), and 99.9% (k-NN), respectively. Prediction accuracies with a repeating test measurement reached up to 90.6% for LDA, and 85.6% for k-NN. These data demonstrate that this electronic nose can discriminate different Mint scents in a reliable and efficient manner.

Graphical Abstract

1. Introduction

As sessile organisms, plants have to rely on chemistry to cope with their biotic environment. As a result, they have evolved an elaborate and proficient secondary metabolism. So far, an estimated 100,000 of compounds specific for plants have already been identified [1]. These compounds include volatile compounds that are signals with the function to steer the interaction of neighboring plants or the interaction with other organisms, such as insects or microorganisms. For instance, in response to an attack by caterpillars, tomato plants warn their neighbors by emitting (Z)-3-hexenol, such that these neighbors can already synthetize defense compounds prior to being attacked [2]. A specific subset of plant volatiles act to inhibit growth or development of their competitors, a phenomenon termed as allelopathy [3,4].
The profile of such volatile compounds can differ even between closely related species of the same genus, indicating a high degree of specificity. A classic example are the Mints (Mentha spec. and neighboring genera of the Mentheae), where each species is endowed with a characteristic and specific bouquet of volatile compounds that are emitted from glandular hairs [5]. This specificity may relate to the fact that the sending plants needs to evade self-inhibition. A given species of Mint does not respond to this signal by itself, while its neighbors are under extreme stress. In case of a signaling compound, one way to evade self-inhibition would be to modify the respective receptor in a way that the ligand cannot bind anymore. However, there are other possible mechanisms, such as sequestered release, or metabolic conversion of the compound. Irrespective of this aspect, the allelopathic effect of Mint scent is well known. For instance, Peppermint (M. x piperita) can block the germination of Mediterranean weeds [6,7]. The effects are often species specific. For instance, a comparative analysis of germination inhibition in combination with activity-guided fractionation revealed that menthone/isomenthone released by Korean Mint (Agastache rugosa) caused a swift and complete breakdown of microtubules in the target plant such that germination (requiring microtubules for cell division and cell expansion) is blocked, while closely related compounds, such as menthol, were ineffective [8]. This specificity of biological action may be valorized for the development of novel, environmentally compatible bioherbicides that specifically affect a certain type of weed without damaging the useful crop [9]. The biological specificity of Mint oil is also of commercial relevance. Peppermint (M. x piperita), Spearmint (M. spicata), and Corn Mint (M. canadensis) differ in their oil composition. For instance, Spearmint is rich in carvone, making it interesting as spice [10], while Corn Mint is commercially relevant as the richest source of natural menthol [11]. The authentication of Mint oil is, therefore, subject to legal regulation, but, so far, has to rely on time-consuming and skill-requiring technology. For instance, to discriminate oil from M. x. piperita and M. arvensis, the Japanese Custom Authorities have established a sophisticated Gas Chromatography GC-MS method [12,13]. The availability of user-friendly, specific, and easy-to-handle alternatives would safeguard a lot of time, labor, and costs.
As arrays of sensors, electronic noses (e-nose) have capability of discrimination of various gasses and their mixtures using machine learning techniques, such as Principal Component Analysis (PCA) [14,15], Linear Discriminant Analysis (LDA) [16], and k-Nearest Neighbor (k-NN) [17,18], using statistical analysis of large number of databases obtained from various sensing materials. Metal-oxides [19,20], semiconductors [21], and conducting polymers [22,23] have been used successfully as sensing films in various e-nose applications. Sensitivity and selectivity of sensing materials for an e-nose system determines the signal to noise ratio around the limits of detection [24,25]. Therefore, the structural and chemical properties of the sensing material are very crucial. Nanoparticles are promising materials for use in e-noses, due to their high surface areas, selectivity, reproducibility, and tunability [26,27]. On the other hand, the diversity of the chemical sensor materials with functional sites enhances the discrimination capability of e-nose sensor arrays and their applications [28,29], since each different sensing element measures a different property of the target chemical materials to be sensed and contributes as an extra fingerprint information.
A QCM-based sensor measures the frequency change due to adsorbed masses of gas molecules as a result of the attractive forces, such as Van der Walls forces, due to induced dipoles and local charge distributions [30]. QCM type electronic noses have been used as a powerful method for discrimination of plant volatiles, including peppermint [31] and spearmint [32], which is of relevance for applications in the plant sciences [33], agriculture [34], forestry [35], and plant biotechnology [36,37].
In the current work, 12 sensing materials including 4 different metal oxide nanoparticle dispersions, one Surface-Anchored Metal-Organic Frameworks (SURMOFs) and 7 different polymer thin films for the modification of QCM sensors to discriminate and identify six different Mint species. These included Pepper Mint M. x piperita (PM), Horse Mint M. longifolia (MLF), Korean Mint Agastache rugosa (AR), Cat Mint Nepeta cataria (NCL), and even two chemotypes of the same species of Spearmint Mentha spicata var. spicata (MS), and Mentha spicata var. crispa (MC). The adsorption and desorption datasets obtained from each sensor were used for the discrimination and prediction of those scents using three different classification methods, i.e., PCA, LDA, and k-NN techniques. We show that this set-up allows for differentiation between essential oils from these species with high accuracy and efficiency, even down to the level of chemotypes belonging to the same species. Our work paves the way for new and versatile applications in quality control and product authentication as alternative to the currently used GC-MS based approaches.

2. Materials and Methods

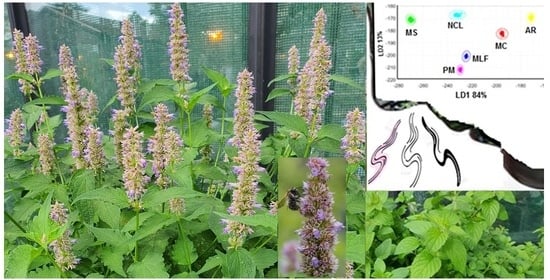
2.1. Plant Material and Extraction of Essential Oils

The study included six species of Mints grown in the Botanical Institute of Karlsruhe Institute of Technology (KIT), Germany (Table 1). Since Mints are chemically diverse and taxonomically demanding, all accessions had been authenticated by morphological and molecular markers [38]. The scents were collected from 1 g weight of freshly collected leaves. Due to the different leaf size, this comprised different numbers of leaves. The data set included members of the genus Mentha, as well as from two neighboring genera of the Mentheae (Agastache rugosa, Nepeta cataria). In addition, for one species (M. spicata), two different chemotypes were tested, whether the approach provided resolution beyond the species level.

2.2. Chemicals and Fabrication of Sensors

The nanoparticles with various sizes and dispersions used in this work were commercially obtained. Zinc Oxide (ZnO) nanoparticles with a size of 10–15 nm with (2.5% w/v. in isopropanol (Avantama AG, Stäfa, Switzerland) were diluted to 1.25%. Al doped ZnO nanoparticles N-21X-Jet (AZO) (Avantama AG, Stäfa, Switzerland) with 2.5% w/v in ethanol were diluted to 1.25% w/v. Thin Oxide (SnO2) nanoparticles 2.5% w/v. in butanol (Avantama AG, Stäfa, Switzerland) were diluted to 1.25% w/v. Indium Tin Oxide (ITO) nanoparticles with the size of less than 100 nm, and with 30% w/v in isopropanol (Sigma-Aldrich Chemie GmbH, Munich, Germany) were diluted to 0.6% w/v. Spiro-based conjugated polymers, such as SPW-111 (SW), SPG-01T (SG), SPB-02T (PB) from Merck KGaA (Darmstadt, Germany), and the conjugated polymer ADS229BE (PFO) from American Dye Source (Quebec, Canada), were selected as sensing thin film material for the QCM array. The sensor polymers were dissolved in toluene to a concentration of 5 g/L. The photophysical properties have been published previously [39,40]. Poly(vinyl alcohol) 99% hydrolyzed (PVA) purchased from Aldrich was dissolved in distilled water. Poly(3,4-ethylenedioxythiophene)-poly(styrenesulfonate) (PEDOT:PSS) 2.8% w/v dispersion in H2O was purchased from Merck. The Cu(BPDC) MOF thin-film (Copper Biphenyl-4,4′-Di-Carboxylic Acid) structures were prepared in a layer-by-layer fashion, following an optimized synthesis protocol published previously [18,41]. Alternatively, the samples were prepared by alternately exposing the substrate to the metal node and to the linker solutions, using a spray method [42]. A MOF thin Cu(BPDC) film [43] was prepared from ethanolic 1 mM copper acetate and ethanolic 0.2 mM biphenyl dicarboxylic acid (BPDC). Prior to SURMOF synthesis, the QCM substrates were functionalized by plasma treatment for 30 min. Cu(BPDC) was prepared in 30 synthesis cycles. The optical micrographs showing the topographical surface profiles of the sensing films were obtained by using a Zeiss Discovery V12 stereo Microscope with x100 zoom with an attached digital camera Axiocam 105 color. See Supplementary Materials Figure S1 in the Supporting Information: (a) bare Ag, (b) Cu(BPDC), (c) ZnO, (d) AZO, (e) SnO2, (f) ITO, (g) PEDOTPSS, (h) PVA, (k) PB, (l) SB, (m) SG, (n) SW. The polymer films show relatively more homogenous and smoother surface structure compared to the films made of nanoparticles. The thicknesses of polymers were obtained around 30 nm. The thicknesses of nanoparticle films varied between 50–200 nm.
Commercially available AT-cut HC-49U type 200 nm silver coated 10 MHz quartz crystals with 8 mm electrode radius produced as an electronic element (JWT, China) were used as QCM electrodes. Before spin coating, the QCM sensors were sonicated in acetone and isopropanol for 10 min sequentially. After drying on a hot plate at 80 °C for 5 min, 10 µL of dispersed nanoparticles were used for spin coating with a spin speed between 1000–2000 rpm with 30 s spinning time. In case of the polymers, all samples were prepared with a solution of 5 g/L for spin coating, and a spin speed between 1300–2100 rpm with 30 s spinning time. Following the coating, the samples were annealed at 80 °C for 10 min on a heating plate. Table 2 shows the frequency shifts after spin coating that ranged between 7–82 kHz, which are related to the mass and thickness of the uploaded film depending on the material. The first harmonics were used to perform the experiments.

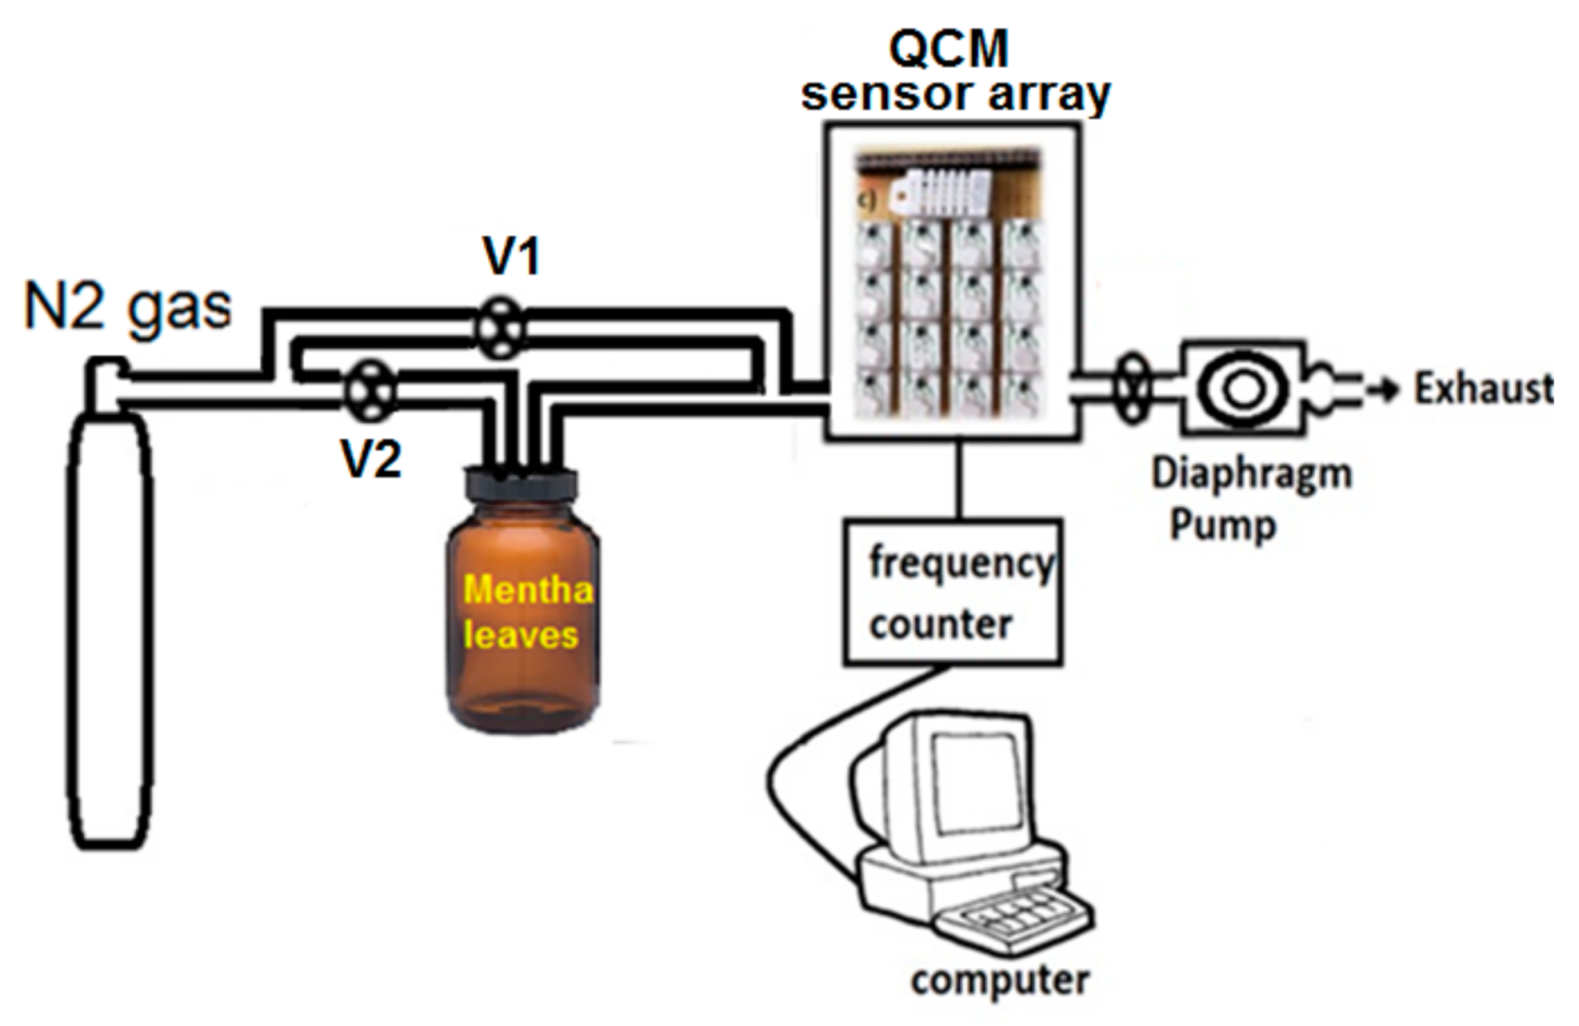
2.3. Data Acquisition with the E-nose

A home-built 12-channel e-nose system [15] was used to perform the experiments. For the QCM data acquisition, 5 V/16 MHz ATMega32U4 microcontrollers and open source Pierce oscillator circuits designed by openQCM have been used [44] to read the frequency change. Temperature and humidity were measured with Adafruit HHTU21D-F temperature & humidity sensor breakout board. MATLAB has been used to record and analyze the data. Figure 1 shows the working principle of the 12-channel homemade E-nose system used for the Mint scent adsorption/desorption process and data collection. A 400 mL stainless cylindrical chamber was used for the sensor array. The chamber was first evacuated for 10 min with a diaphragm pump and then purged with dry N2 gas for 10 min with a flow rate of 10 L/min by keeping V1 open and V2 closed before each measurement. From each Mint accession, 1 g in weight of freshly collected leaves was placed into a 100-mL glass bottles separately for the measurement. The emitted scents from the leaves inside the bottles were transferred to the chamber with 10 mL/min of N2 flowing into the chamber with the sensor array by keeping V2 open and V1 closed. For each Mint accession, the change in resonance frequency was followed with 2 cycles of adsorption over 30 min exposure, and, subsequently, 60 min desorption during cleaning with dry N2 gas. The temperature of the chamber was kept constant at 25 ± 0.5 °C.

2.4. Data Analysis and Classification

The first cycle of the adsorption/desorption curve was used for the discrimination of the scents, while the second cycle was used for testing and prediction or identification of the six different scents emitted from the plant source under investigation. For this purpose, intervals of the frequency curves extending over 10 min were excised from the final range of the adsorption phase (20–30 min after the onset of adsorption, when responses were maximal) and used for the training for the discrimination of the six different Mint samples. Three different classification algorithms were tested: PCA, LDA, and k-NN based on scripts written in MATLAB. A cross-validation threshold of 10-fold was used for classification, using 1800 individual observations. Hereby, 1620 observations were collected during the first cycle and represented the training set, and 180 observations were chosen randomly from the second cycle and represented the identification set. The data sets for training and for identification data sets were obtained by repeating the experiment under the same conditions. For the identification (second cycle), similarly, a time interval of 10 min from the adsorption phase was recorded, when the response was maximal (between 110–120 min from the start of the experiment). This frequency course served for the identification of the specimen.
For the QCM measurements, Sauerbrey’s equation [45] was used to verify the linear dependence of the QCM frequency shift on the mass upload on the piezo electric sensor [15].
PCA was used as one the most effective quantitative methods to discriminate volatile gasses and odors [46]. In PCA, a new set of variables derives as principal components from a linear combination of the original variables, being orthogonal to each other. The criterion to define this pair of variables is that their variance is maximal among all the other possible choices of the first axis. LDA is closely related to PCA and explicitly attempts to maximize the variance difference between data classes while minimizing the variance differences inside each individual class. Hereby, the fitting function estimates the parameters assuming linear boundaries between classes.
In the k-Nearest Neighbor classification, the algorithm searches and classifies an unknown point by counting each number of closest members of already known neighboring classes. Each known object contributes for its class, and the closest class with the highest number of members yields the predictive decision. In this work, for the k-NN discrimination, k was chosen as 10, and the effect of the number of neighbors up to 300 on the discrimination accuracy of k-NN model was estimated based on Euclidean distances.

3. Results and Discussion

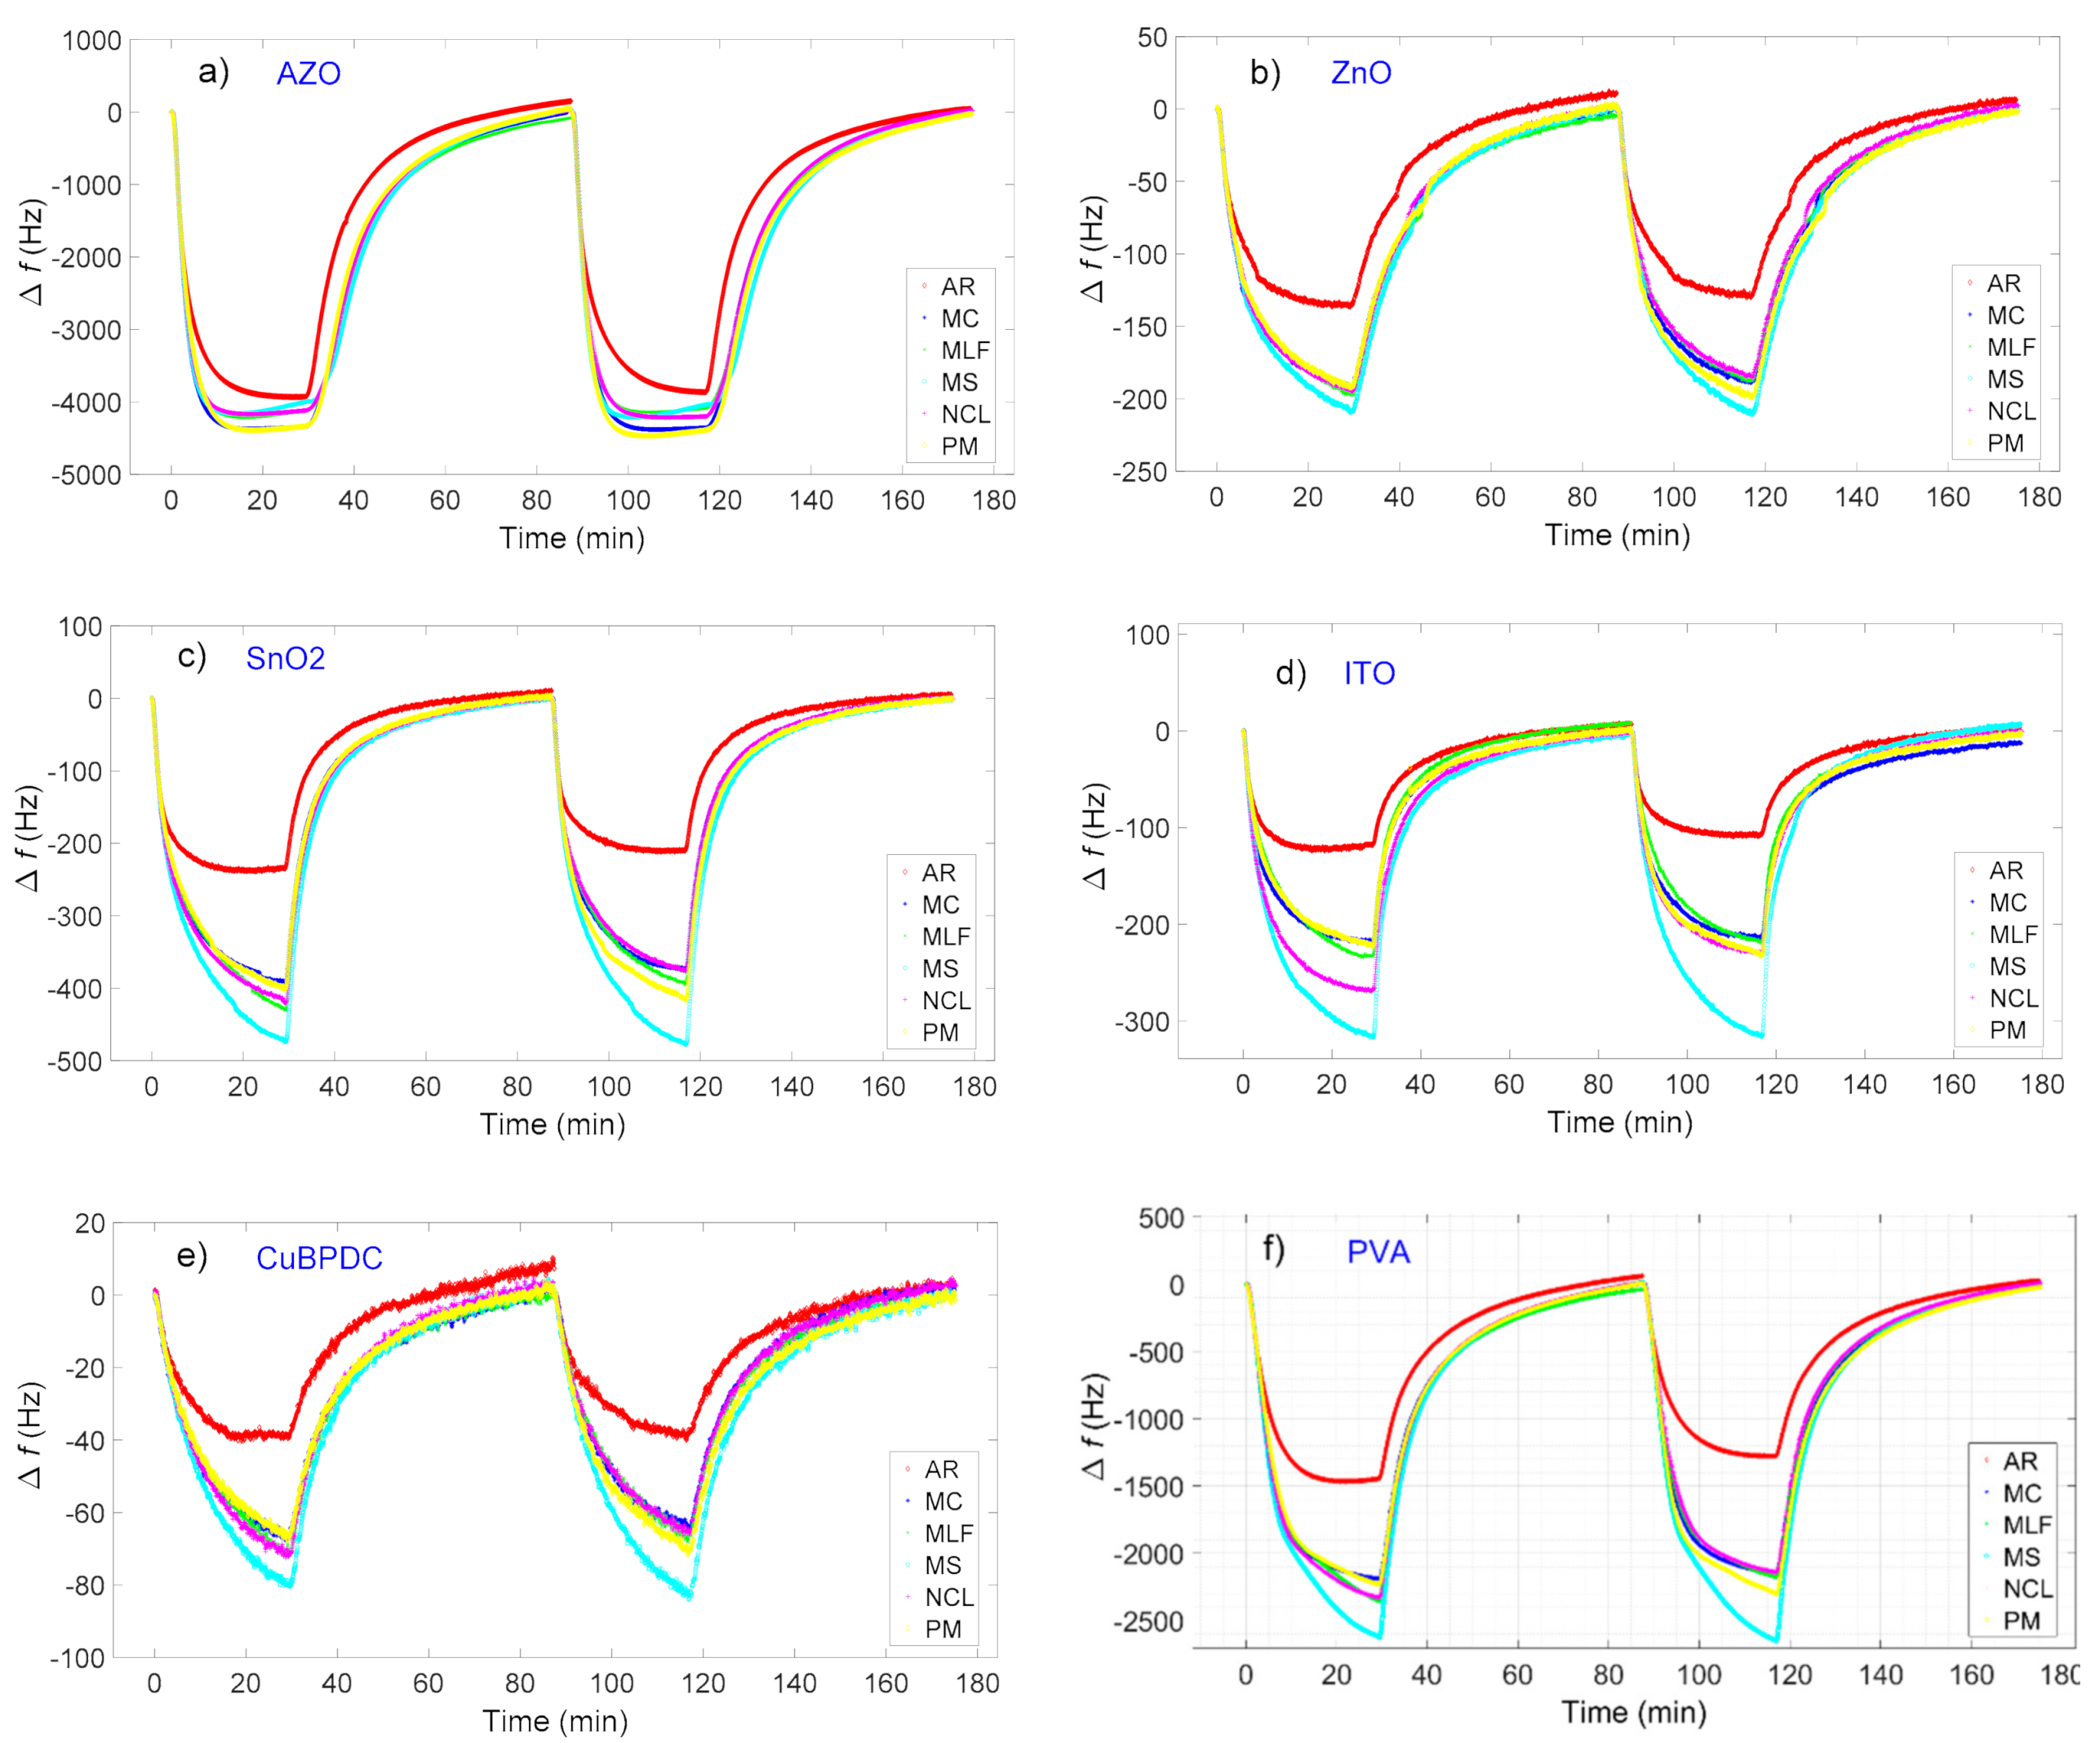
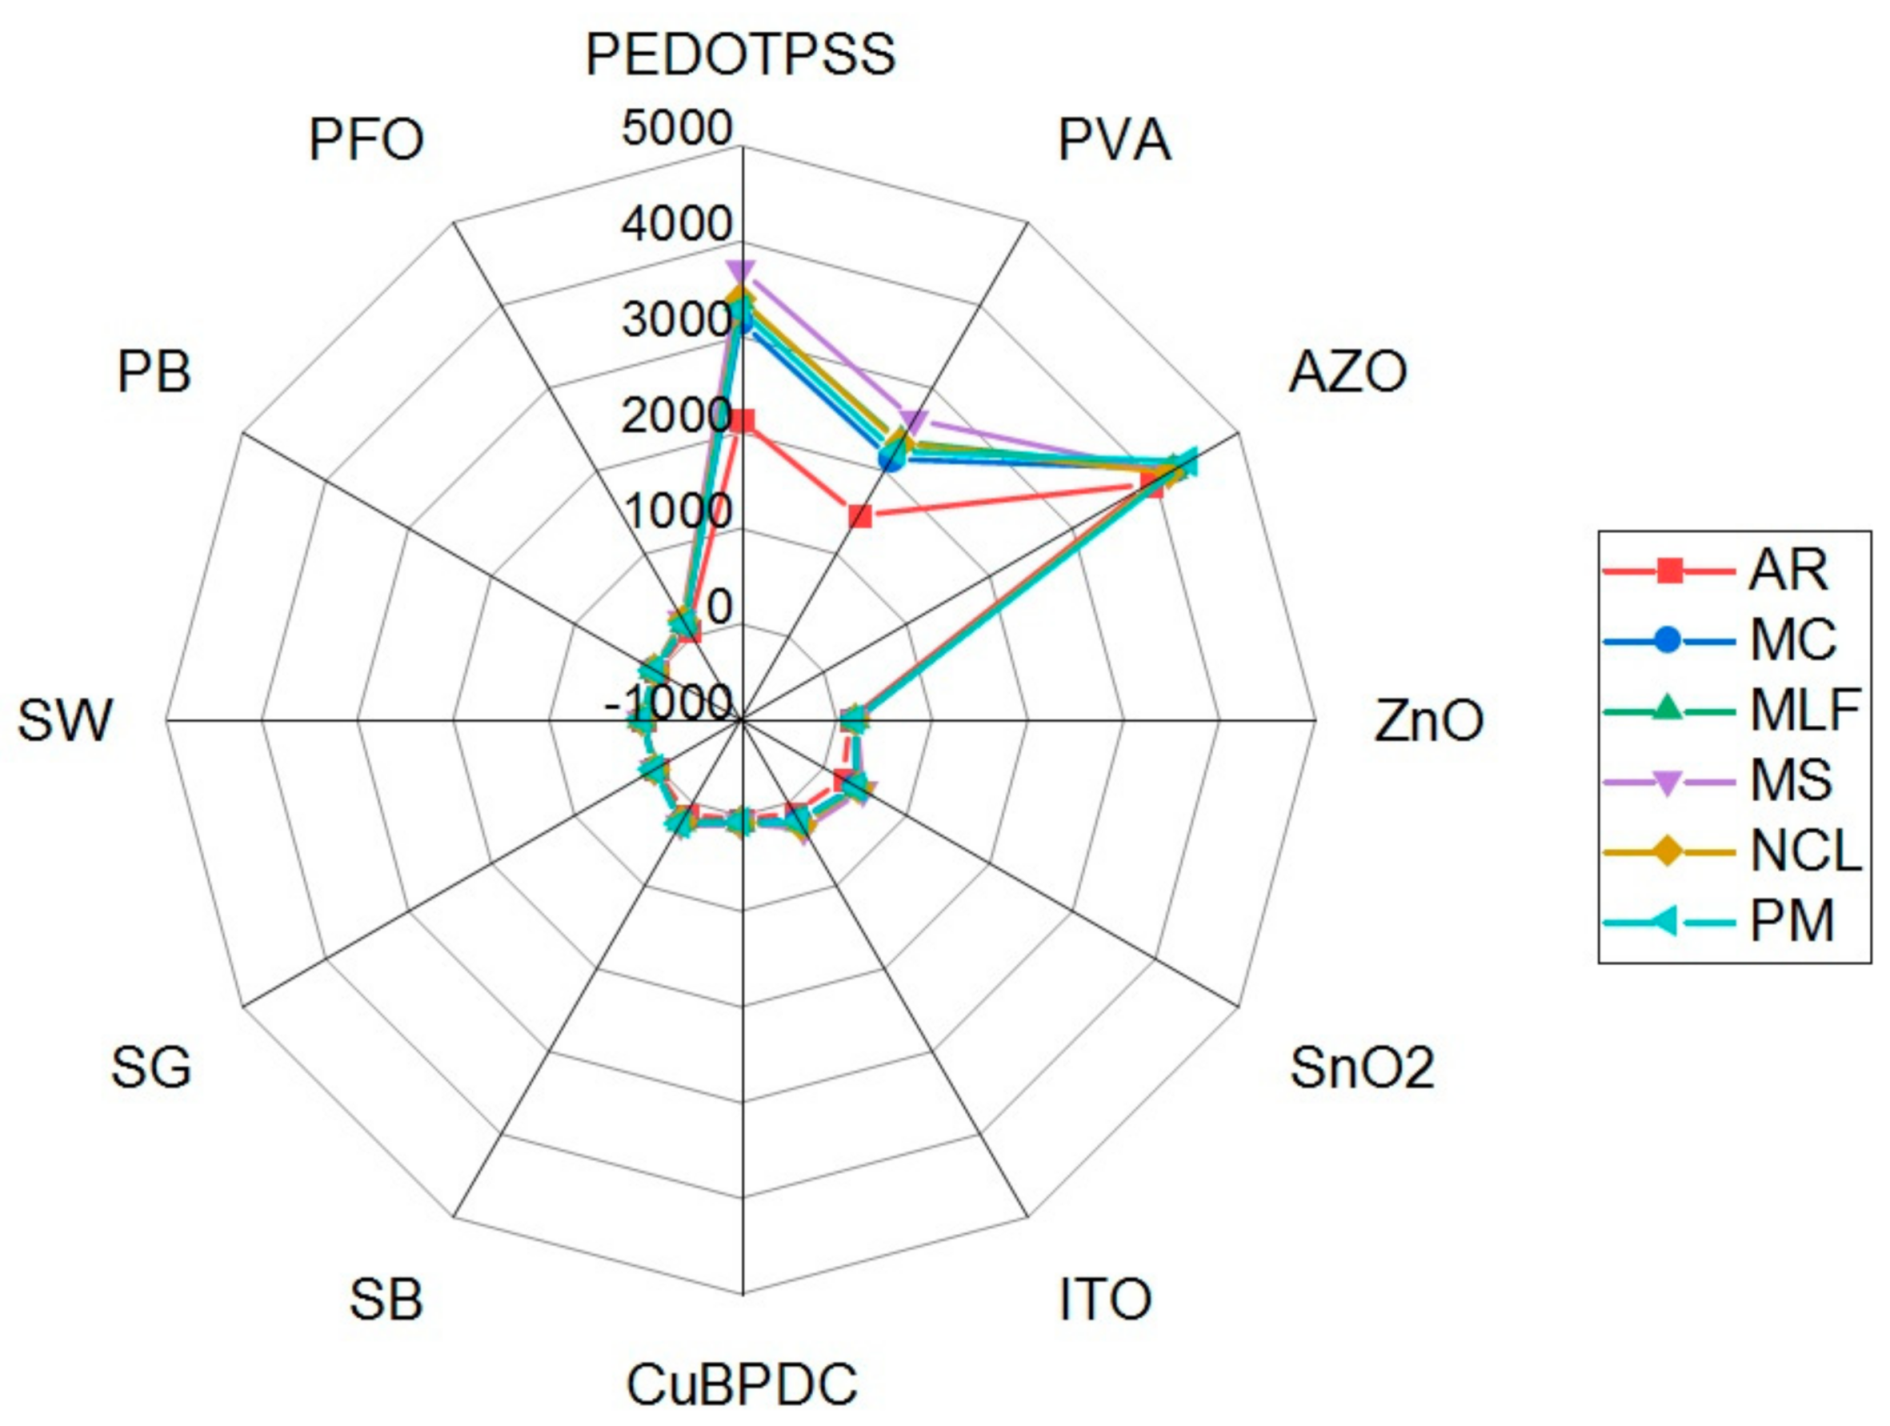
3.1. Sensor Array Response

Figure 2 illustrates the changes in resonance frequencies of the sensor array with 12 different sensing materials (Figure 2, (a) AZO, (b) ZnO, (c) SnO2, (d) ITO, (e) Cu(BPDC), (f) PVA, (g) PEDOT:PSS, (h) PFO, (i) SB, (j) SG, (k) SW, and (l) PB) as 2 cycles of adsorption (30 min) after exposure to each fresh Mint leaf and 60 min desorption by cleaning with dry N2 gas. In general, each sensor showed different cyclic response to each emitted concentration of each Mint scent. AZO produced the highest response among the sensor array and saturated within a few minutes, while most of the remaining sensors reached saturation only upon exposure to Agastache rugosa (AR) scent with the lowest response.
A radar plot of the maximum frequency shifts responses for the sensor arrays is given in Figure 3 for comparison. This radar plot, too, shows a clear discrimination. All the sensors exhibit a maximal response upon exposure to the scent of Mentha spicata (MS), and the lowest response upon exposure to the scent of Agastache rugosa (AR). On the other hand, the responses to the scents of the remaining Mints (i.e., MC, PM, MLF, and NCL) are very close to each other.
AZO produces the highest response with −4450 Hz as change in the resonance frequency, while the sensor with ZnO nanoparticles exhibits the lowest response among all sensors with only −220 Hz. Likewise, PEDOT:PSS displays a high response with −3722 Hz due to possible water content of fresh leaves of Mint species, while the sensor with SW and SG yield the lowest response among the polymer sensors with around −35 Hz. In addition, the Cu(BPDC) as SURMOFs relatively small responsive around −80 Hz as resonance frequency change. This can be explained as following: An improved electrical conductivity of ZnO nanomaterials by Al doping have been already demonstrated in the literature [47]. Metal oxide nanoparticles as gas sensors have higher sensitivities and faster response times due to very large surface-to-volume ratio, and creating more active sites for gas interaction on the metal oxide semiconductor surface [48]. Al impurity plays a crucial role in increasing the affinity between gas molecules and active surface sides in the sensing films. The sensitivity and selectivity can be enhanced and optimized by introducing dopants, like Al, in the ZnO structures by changing the energy band structure and morphology. A considerable greater sensitivity of Al-doped films to CO2 gas over that of pure ZnO film has been demonstrated Patil et al. [49]. FTIR studies of ZnO and AZO nanoparticles show broad absorption bands at 1620 cm−1 and 3440 cm−1 were ascribed to O–H bending vibration modes of water molecules absorbed onto the ZnO and AZO nanoparticles [48]. A freshly collected mint leave contains water and a mixture of plant oils, such as mentone, menthol, and limonene [8]. Quantitative analysis in literature show that Mint species also contain phenolic compounds, flavonoids, and rosmarinic acid and its derivatives [50]. Cumulative affinities of the constituent compounds in mint species reveal the highest frequency change as a result of the highest adsorption on the AZO films among other sensing materials on the QCM electrode.

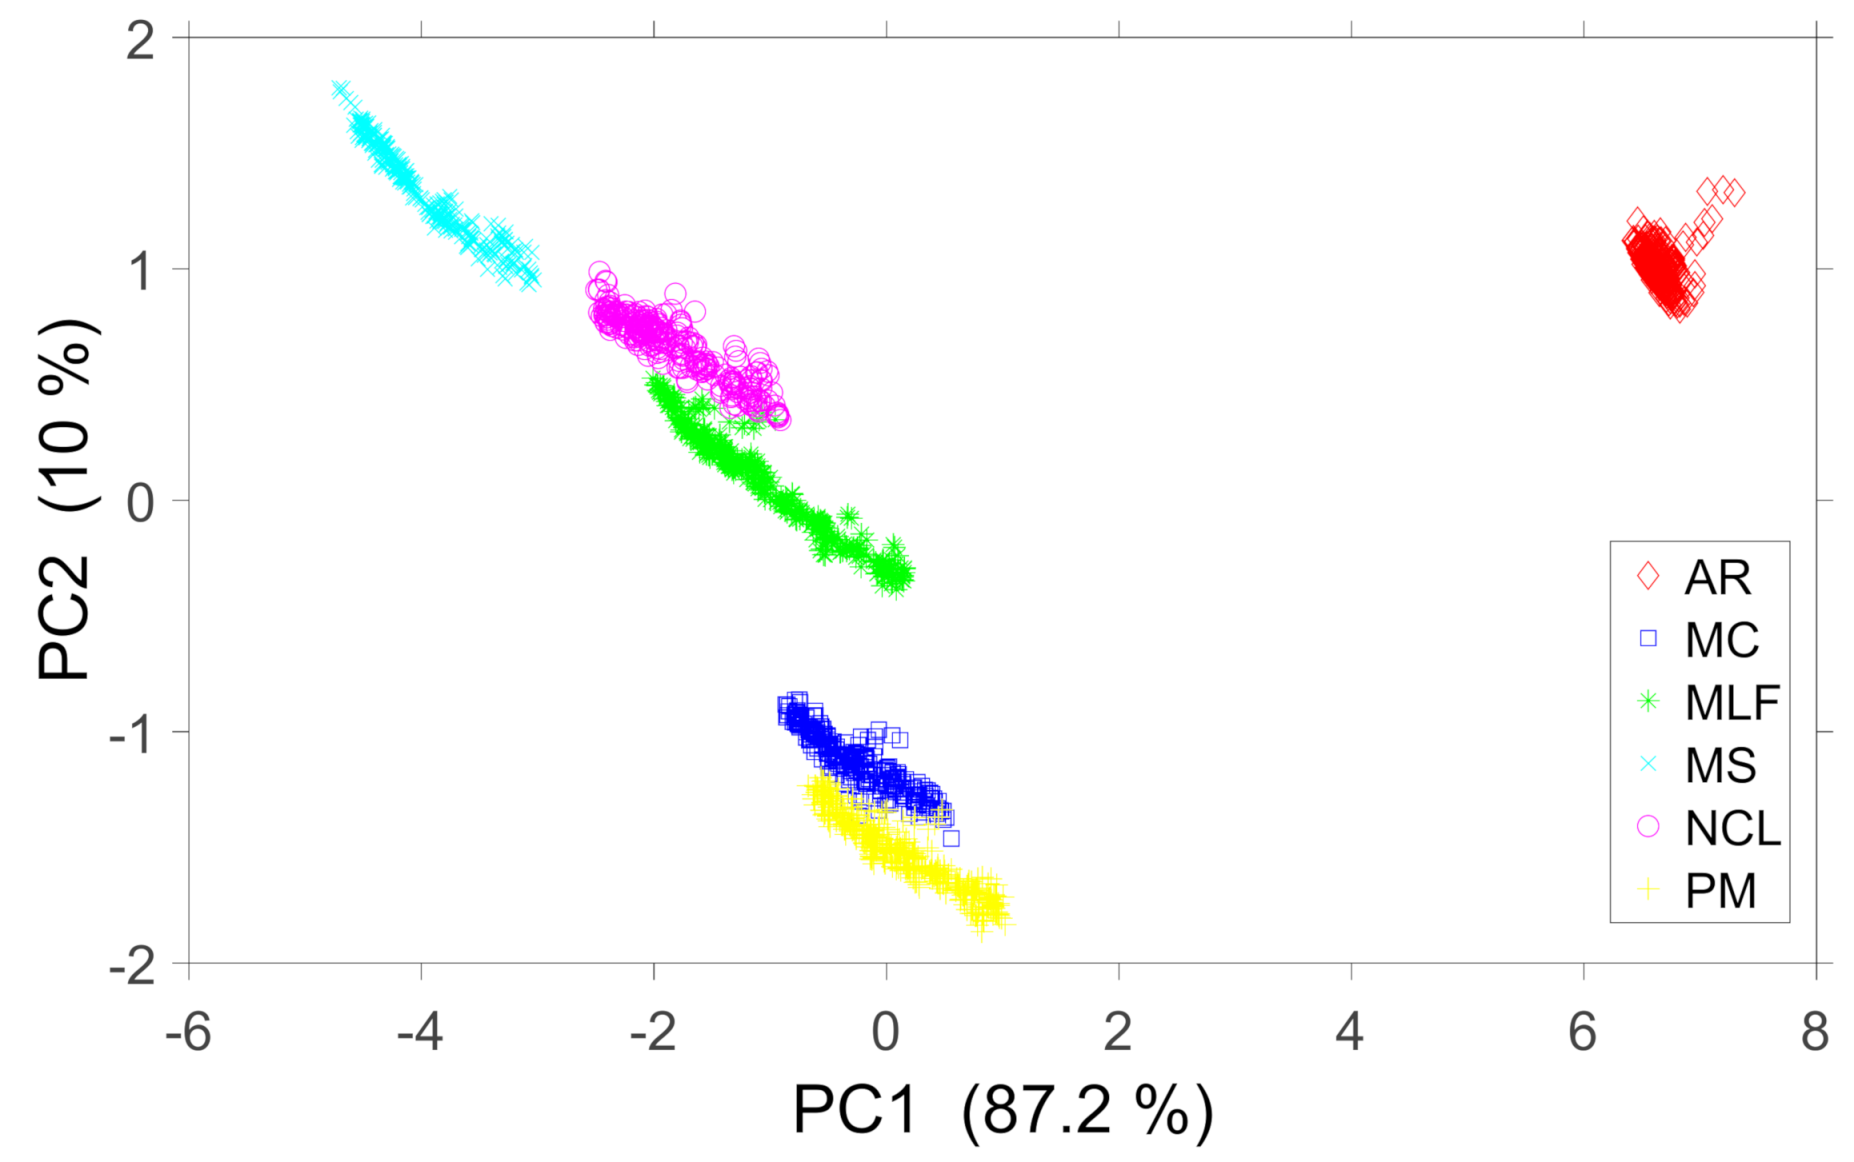
3.2. Principal Component Analysis (PCA)

Figure 4 shows a 2D plot for the coefficients of the Principal Component Analysis from 1800 observations for the six different Mint scents that group into six different clusters. Each scent is shown in different colors for visual discrimination. While these clusters separated from each other, the borders between Pepper Mint (PM) and Curly Mint (MC), as well as between Horse Mint (MLF) and Cat Mint (NCL), are not well defined. The sum of the 2 percentages of the total variance explained by each principal component is equal to 97.2. This shows very high discrimination accuracy close to 99% as compared to the rest of the variance components.

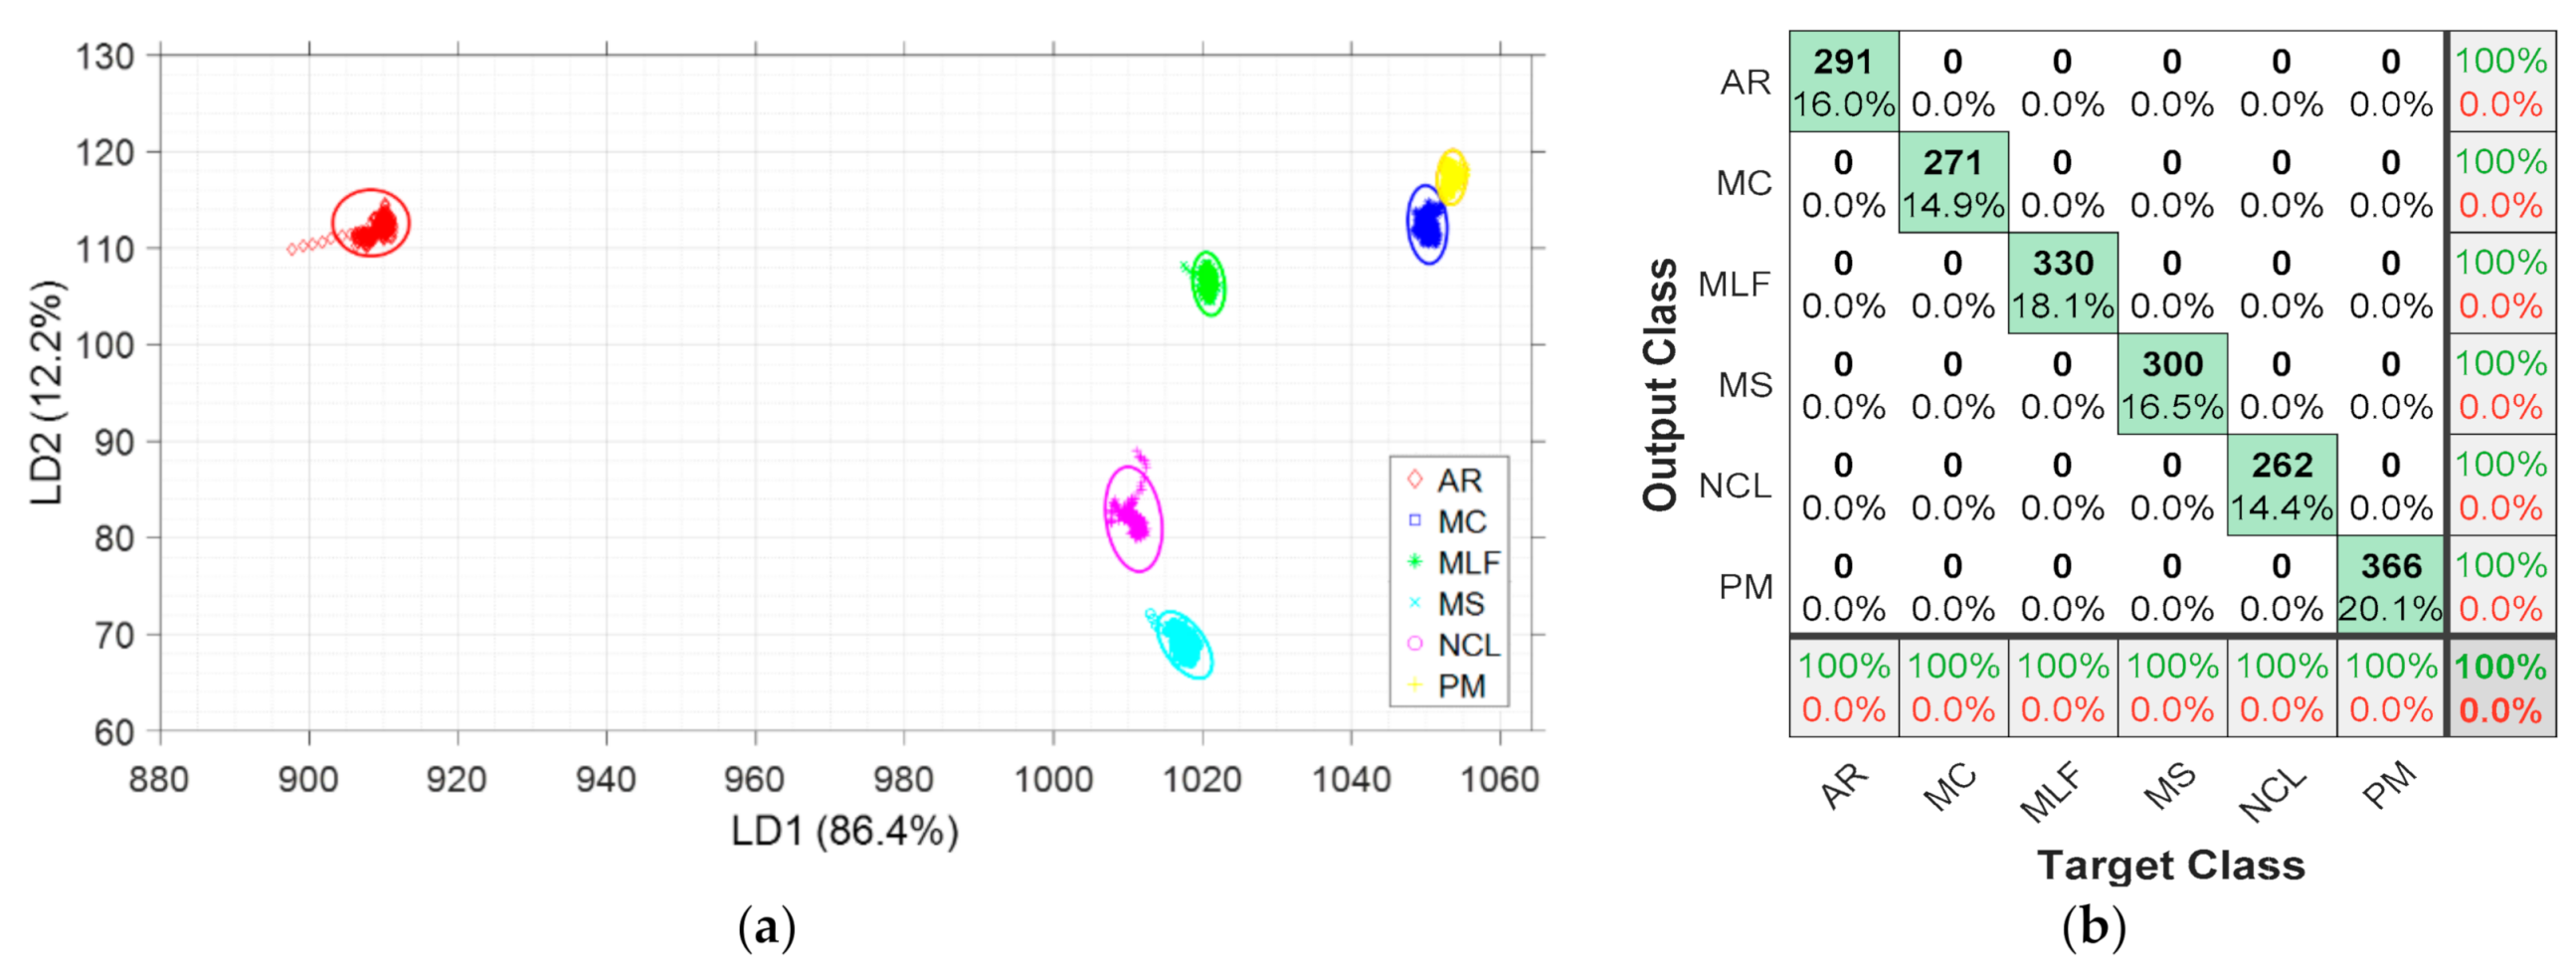
3.3. Linear Discrimination Analysis (LDA)

Figure 5 shows a 2D plot of the Linear Discriminant Analysis with the 95% confidence ellipses obtained for the different species (Figure 5a) obtained from 10 rounds of LDA calculation using the data obtained from the first cycle of the e-nose measurements given in Figure 2. The LDA plot shows a clear visual discrimination for the six types of Mints. The sum of the first two components of the LDA vector components is 98.6%, and the discrimination accuracy with the LDA method reached 100%, even though the LDA scores obtained for Menta spicata crispa (MC, blue) and Mentha x piperita (PM, yellow) are very close to each other.
To get a further readout for the quality of the prediction, a so-called confusion matrix was calculated (Figure 5b). A confusion matrix is a chart for comparison of the predicted (identified) labels with the true labels. The rows of the confusion matrix correspond to the true class and the columns correspond to the predicted class. Diagonal and off-diagonal cells correspond to correctly and incorrectly classified observations, respectively. The obtained confusion matrix also confirms the discrimination accuracy without any misclassification between groups of ten training data sets and randomly chosen test data sets. In this figure, the first two diagonal cells show the number and percentage of correct classifications by the trained observation data sets. For instance, in 291 cases scents from Agastache rugosa (AR) scents were correctly classified corresponding to 16% of all 1800 observed data sets. Since there was no single case of misclassification, the discrimination value was 100% correct.
Figure 6a shows a 2D plot of the 10-fold Linear Discriminant Analysis obtained from the training data sets. The colored symbols represent the measurements from the first cycle, while the black symbols give the data from the second cycle of the e-nose measurements. The LDA vector points calculated from the data sets from second cycle of the e-nose measurement allowed prediction of the unknown observations. The six different Mints segregate into fully distinct clusters. The first two components of the LDA vector components sum up to more than 99% reflecting the good separation of these clusters. With exception of Cat Mint (NCL), prediction classes (obtained from the second cycle) localized closely to the training classes (obtained from the first cycle) in the 2D LDA plot. For Cat Mint, the prediction was located just between Cat Mint (NCL, purple symbols) and Horse Mint (MLF, green symbols). This caused a 63.3% misclassification for the Cat Mint data sets in the corresponding prediction-confusion matrix derived from the unknown data sets collected during the second cycle of the e-nose measurements (Figure 6b). However, the overall prediction accuracy for the unknown data sets was very high with 90.6%, meaning that only 9.4% of the data remained misclassified.

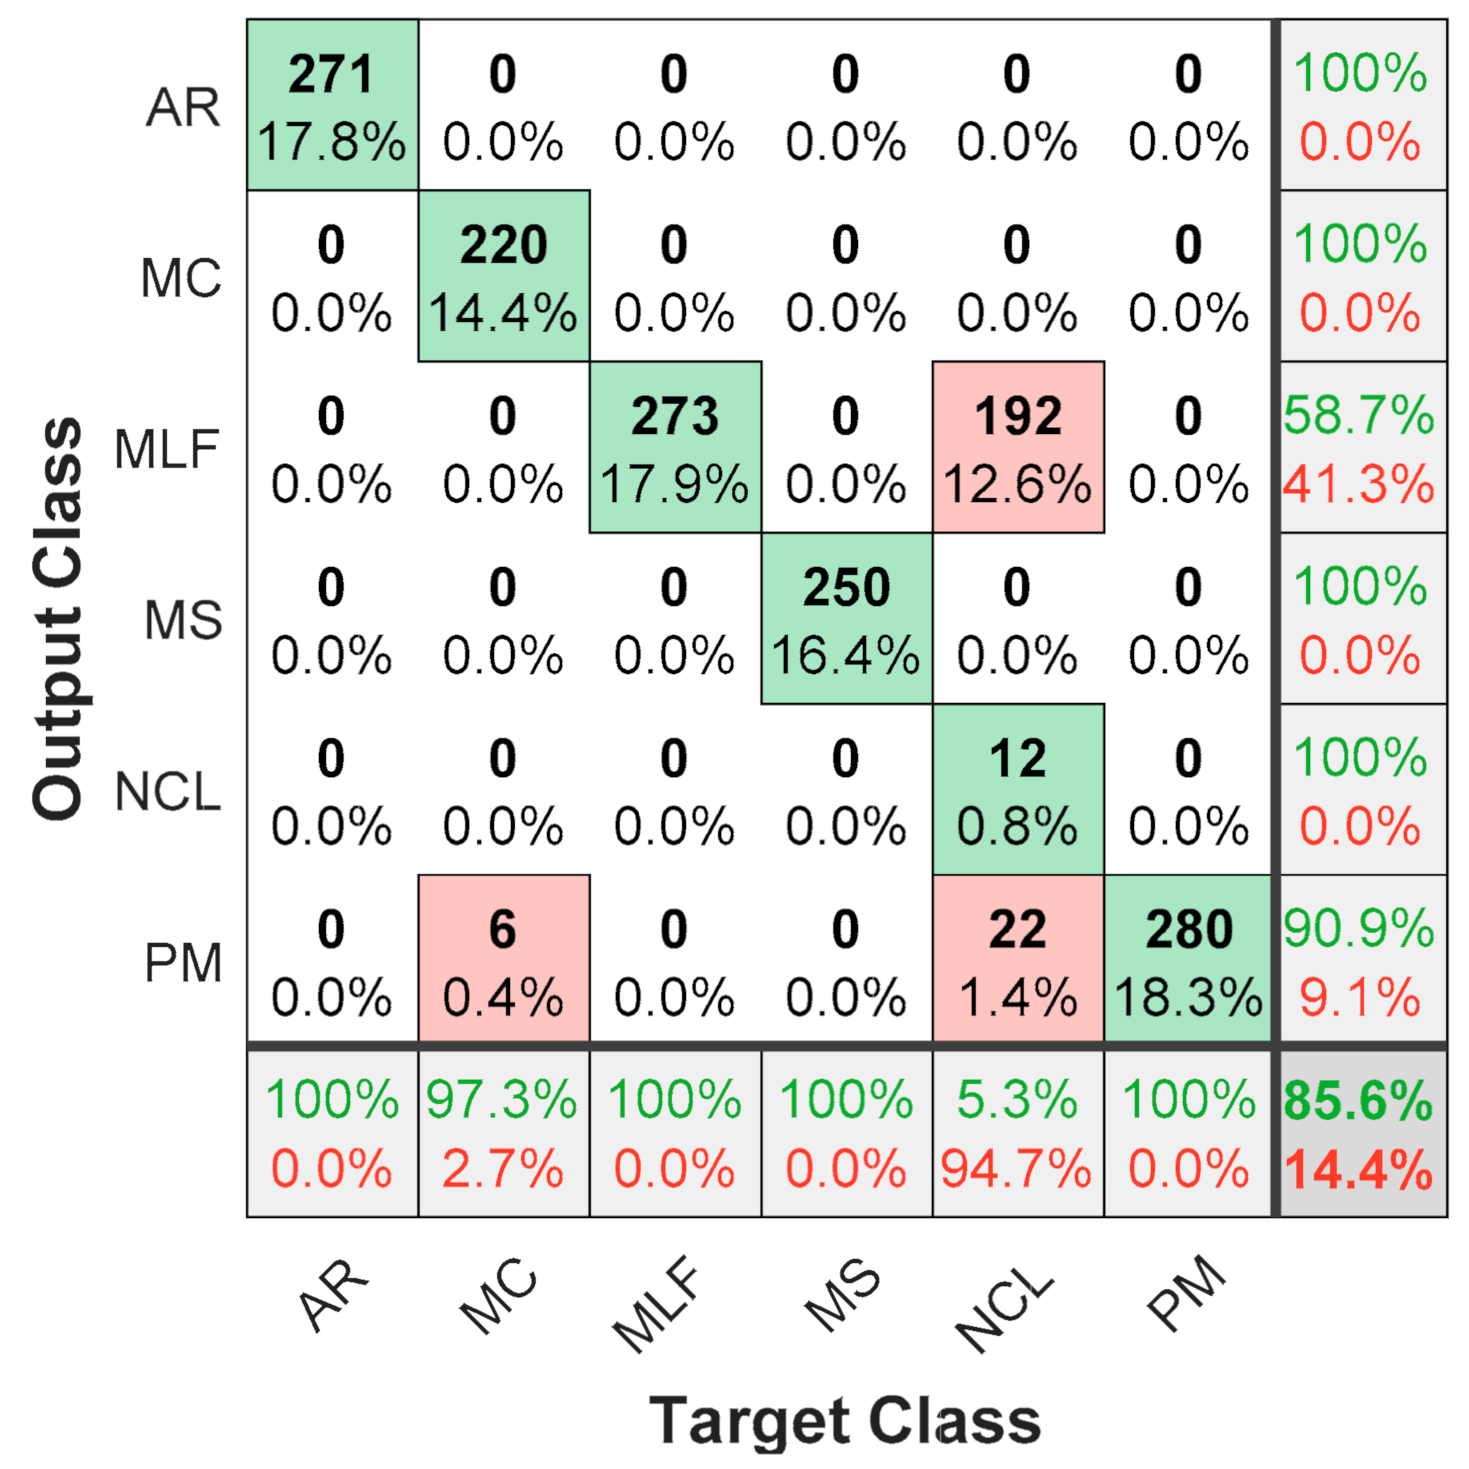
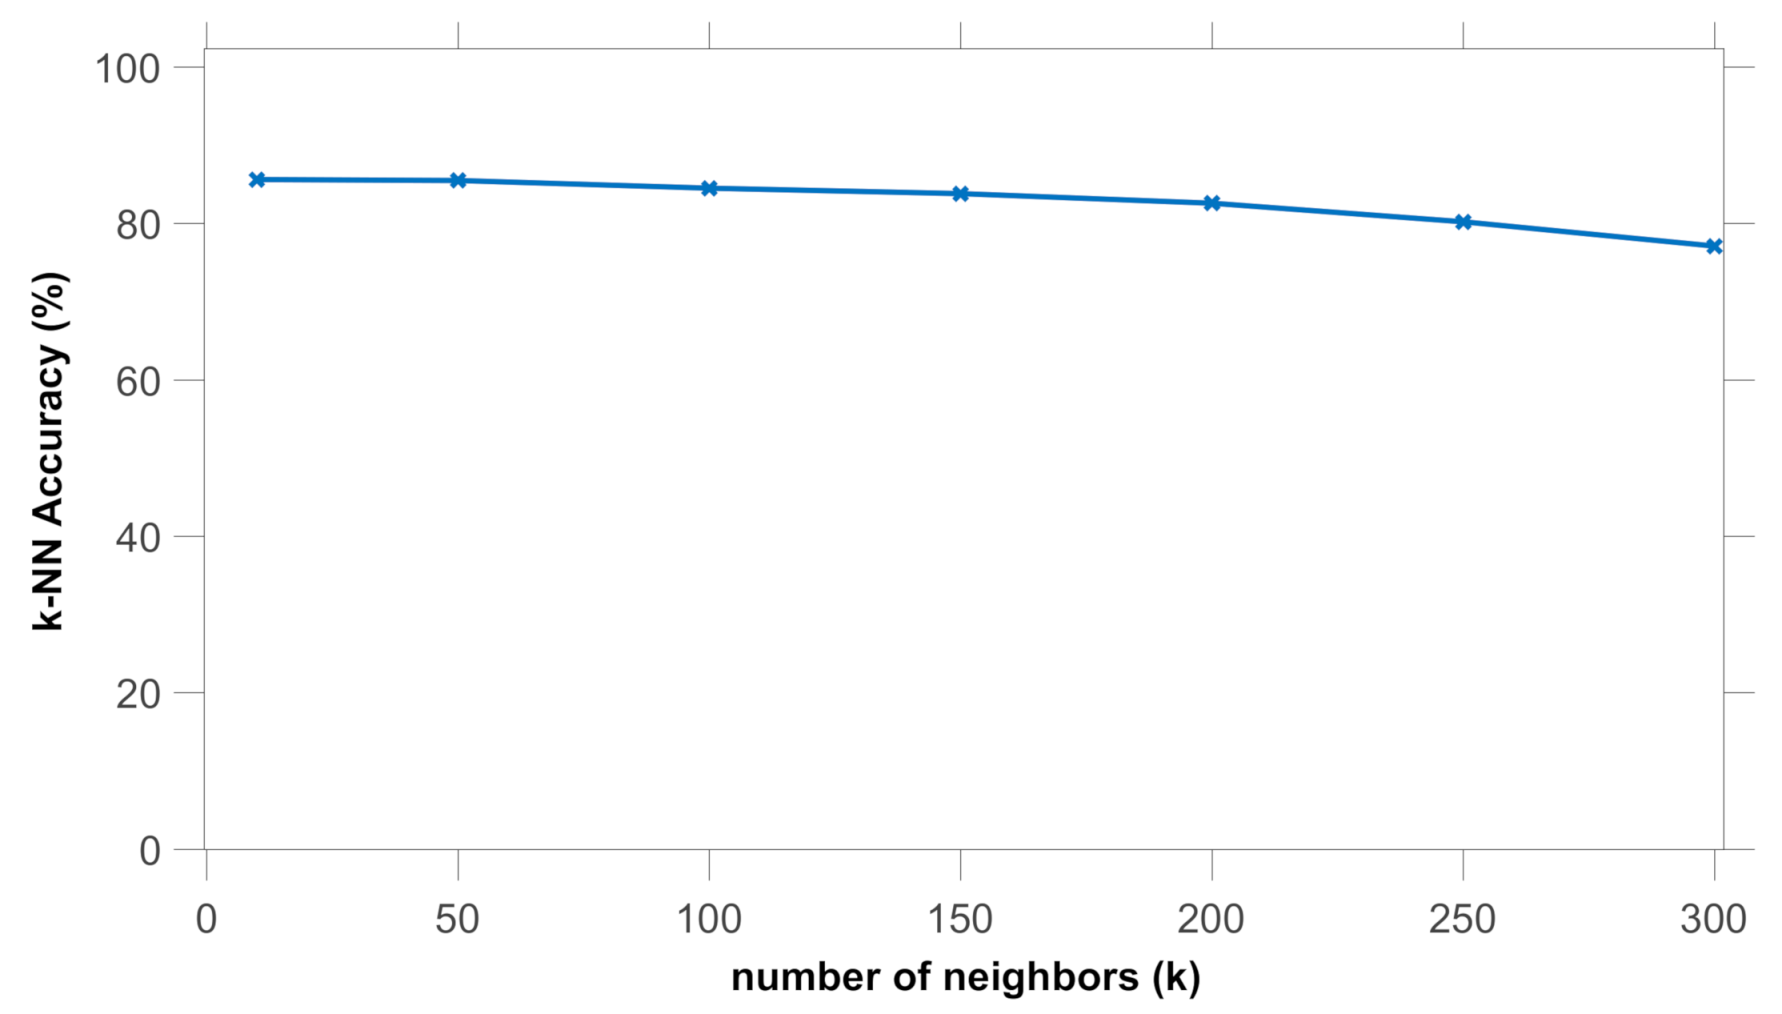
3.4. Nearest Neighbor Analysis (k-NN)

As last algorithm for prediction, we used k-NN analysis with a 10-fold (k = 10) calculation of the unknown data sets from the second cycle as compared to the true assignment from the training data set collected during the first cycle. The data sets from the second cycle of the e-nose measurement was used for the k-NN calculation to determine prediction accuracy for the unknown observations. Again, Cat Mint (NCL) and Horse Mint (MLF) remained ambiguous with 94.7% misclassification. The overall prediction accuracy for the unknown data sets was poorer than in the case of LDA with 85.6%, corresponding to 14.4% misclassification as shown in Figure 7.
In the next step, we tested to what extent the accuracy of the k-NN algorithm was dependent on the number of neighbors (Figure 8). However, while increasing k from 10 up to 300, we did not see any further increase in accuracy. In contrast, the accuracy dropped slowly. Thus, the distances between the classes sufficiently separate when using 10 neighbors.

4. Conclusions

Twelve different sensing materials, including four different metal oxide nanoparticle dispersions, one SURMOF, and seven different polymer films, were used for the modification of silver coated QCM sensors to discriminate six different Mint species. The adsorption and desorption datasets obtained from each modified QCM sensor were used for three different classification models (PCA, LDA, k-NN). Classification accuracies for the training sets reached 97.2% for PCA, 100% for LDA, and 99.9% for the k-NN method (using k = 10 nearest neighboring points). Prediction accuracies for a repeating test measurement with unknown samples were obtained as 90.6% for LDA and as 85.6% for the k-NN method. The results reveal that a QCM type e-nose represents a user-friendly and reliable alternative to GC-MS to monitor and discriminate the emitted scents from different Mint species and even, beyond the species level, for different chemotypes of individual species. This paves the way for numerous applications from pharmaceutical quality control to monitoring Mint oils as environmentally-friendly bioherbicides.

Supplementary Materials

The following are available online at https://0-www-mdpi-com.brum.beds.ac.uk/2227-9040/9/2/31/s1, Figure S1: The optical micrographs showing the topographical surface profiles of the sensing films: (a) Ag, (b) Cu(BPDC), (c) ZnO, (d) AZO, (e) SnO2, (f) ITO, (g) PEDOT PSS, (h) PVA, (k) PB, (l) SB, (m) SG, (n) SW.

Author Contributions

Conceptualization, S.O., M.S., A.K., P.N. and U.L.; methodology, S.O., M.S., A.K., P.N., Z.Z. and U.L.; software, S.O., R.H.; validation, S.O., M.S., R.H., A.K., P.N., Z.Z. and U.L.; formal analysis, S.O., R.H., A.K., L.H., P.N. and U.L.; investigation, S.O., Z.Z.; resources, S.O., C.W., P.N. and U.L.; data curation, S.O. and L.H., Z.Z.; writing—original draft preparation, S.O., M.S., R.H., P.N.; writing—review and editing, R.H., A.K., L.H., C.W., P.N. and U.L.; visualization, S.O.; supervision, C.W., P.N. and U.L.; project administration, S.O., C.W., P.N. and U.L.; funding acquisition, C.W., P.N. and U.L. All authors have read and agreed to the published version of the manuscript.

Funding

This research was funded by Deutsche Forschungsgemeinschaft (DFG, German Research Foundation) under Germany’s Excellence Strategy—2082/1—390761711, Philipp Schwartz Fellowship (a program run by the Alexander von Humboldt Foundation) provided by the Karlsruhe Institute of Technology, and Iraqi Ministry of Education and Science.

Data Availability Statement

The data presented in this study are available on request from the corresponding author. The data are not publicly available for now.

Acknowledgments

The corresponding authors, as well as co-authors A.K. and S.O., obtained support through a Philipp Schwartz Fellowship (a program run by the Alexander von Humboldt Foundation) provided by the Karlsruhe Institute of Technology. Co-author M.S. was supported by a fellowship from the Iraqi Ministry of Education and Science; U.L. and C.W. acknowledge support from Deutsche Forschungsgemeinschaft (DFG, German Research Foundation) under Germany’s Excellence Strategy—2082/1—390761711. The authors would like to thank Joachim Daumann for competent cultivation and maintenance of the plant material used in this study. The authors would like also to thank Felix Geislhoeringer for preparing the circuit diagram for the 16-channel e-nose system.

Conflicts of Interest

The authors declare no conflict of interest.

References

  1. Goossens, A.; Häkkinen, S.T.; Laakso, I.; Seppänen-Laakso, T.; Biondi, S.; De Sutter, V.; Lammertyn, F.; Nuutila, A.M.; Söderlund, H.; Zabeau, M. A functional genomics approach toward the understanding of secondary metabolism in plant cells. Proc. Natl. Acad. Sci. USA 2003, 100, 8595–8600. [Google Scholar] [CrossRef] [PubMed] [Green Version]
  2. Sugimoto, K.; Matsui, K.; Iijima, Y.; Akakabe, Y.; Muramoto, S.; Ozawa, R.; Uefune, M.; Sasaki, R.; Alamgir, K.M.; Akitake, S. Intake and transformation to a glycoside of (Z)-3-hexenol from infested neighbors reveals a mode of plant odor reception and defense. Proc. Natl. Acad. Sci. USA 2014, 111, 7144–7149. [Google Scholar] [CrossRef] [PubMed] [Green Version]
  3. Ferguson, J.J.; Rathinasabapathi, B.; Chase, C.A. Allelopathy: How plants suppress other plants. EDIS 2013. [Google Scholar] [CrossRef]
  4. Schandry, N.; Becker, C. Allelopathic Plants: Models for Studying Plant–Interkingdom Interactions. Trends Plant Sci. 2020, 25, 176–185. [Google Scholar] [CrossRef] [PubMed] [Green Version]
  5. Weir, T.L.; Park, S.-W.; Vivanco, J.M. Biochemical and physiological mechanisms mediated by allelochemicals. Curr. Opin. Plant Biol. 2004, 7, 472–479. [Google Scholar] [CrossRef]
  6. Cavalieri, A.; Caporali, F. Effects of essential oils of cinnamon, lavender and peppermint on germination of Mediterranean weeds. Allelopath. J. 2010, 25, 441–452. [Google Scholar]
  7. Campiglia, E.; Roberto, M.; Cavalieri, A.; Caporali, F. Use of Essential Oils of Cinnamon, Lavender and Peppermint for Weed Control. Ital. J. Agron. 2007, 2, 171–178. [Google Scholar] [CrossRef]
  8. Sarheed, M.M.; Rajabi, F.; Kunert, M.; Boland, W.; Wetters, S.; Miadowitz, K.; Kaźmierczak, A.; Sahi, V.P.; Nick, P. Cellular base of mint allelopathy: Menthone affects plant microtubules. Front. Plant Sci. 2020, 11, 1320. [Google Scholar] [CrossRef]
  9. Argyropoulos, E.I.; Vokou, D.; Eleftherochorinos, I. In Vitro Evaluation of Essential Oils from Mediterranean Aromatic Plants of the Lamiaceae for Weed Control in Tomato and Cotton Crops; Aristotle University of Thessaloniki: Aristotle, Greece, 2008. [Google Scholar]
  10. Kokkini, S.; Karousou, R.; Lanaras, T. Essential oils of spearmint (Carvone-rich) plants from the island of Crete (Greece). Biochem. Syst. Ecol. 1995, 23, 425–430. [Google Scholar] [CrossRef]
  11. Sharma, S.; Tyagi, B. Character correlation, path coefficient and heritability analyses of essential oil and quality components in Japanese mint. J. Genet. Breed. 1991, 45, 257–262. [Google Scholar]
  12. Analysis Method of Peppermint Oil—Japan Customs Analysis Methods, 302 ed. 2019. Available online: https://www.customs.go.jp/ccl_search/e_analysis_search/a_302_e.pdf (accessed on 18 January 2021).
  13. Buleandra, M.; Oprea, E.; Popa, D.E.; David, I.G.; Moldovan, Z.; Mihai, I.; Badea, I.A. Comparative chemical analysis of Mentha piperita and M. spicata and a fast assessment of commercial peppermint teas. Nat. Prod. Commun. 2016, 11, 1934578X1601100433. [Google Scholar] [CrossRef] [Green Version]
  14. Wu, X.; Zhu, J.; Wu, B.; Zhao, C.; Sun, J.; Dai, C. Discrimination of Chinese Liquors Based on Electronic Nose and Fuzzy Discriminant Principal Component Analysis. Foods 2019, 8, 38. [Google Scholar] [CrossRef] [Green Version]
  15. Okur, S.; Zhang, Z.; Sarheed, M.; Nick, P.; Lemmer, U.; Heinke, L. Towards a MOF e-Nose: A SURMOF sensor array for detection and discrimination of plant oil scents and their mixtures. Sens. Actuators B Chem. 2020, 306, 127502. [Google Scholar] [CrossRef]
  16. Gorji-Chakespari, A.; Nikbakht, A.M.; Sefidkon, F.; Ghasemi-Varnamkhasti, M.; Brezmes, J.; Llobet, E. Performance Comparison of Fuzzy ARTMAP and LDA in Qualitative Classification of Iranian Rosa damascena Essential Oils by an Electronic Nose. Sensors 2016, 16, 636. [Google Scholar] [CrossRef] [Green Version]
  17. Shao, X.; Li, H.; Wang, N.; Zhang, Q. Comparison of different classification methods for analyzing electronic nose data to characterize sesame oils and blends. Sensors 2015, 15, 26726–26742. [Google Scholar] [CrossRef] [Green Version]
  18. Okur, S.; Qin, P.; Chandresh, A.; Li, C.; Zhang, Z.; Lemmer, U.; Heinke, L. An enantioselective e-nose: An array of nanoporous homochiral MOF films for stereospecific sensing of chiral odors. Angew. Chem. Int. Ed. 2020, 132, 1–7. [Google Scholar]
  19. Berna, A. Metal oxide sensors for electronic noses and their application to food analysis. Sensors 2010, 10, 3882–3910. [Google Scholar] [CrossRef] [PubMed] [Green Version]
  20. Horzum, N.; Tascioglu, D.; Ozbek, C.; Okur, S.; Demir, M.M. VOC sensors based on a metal oxide nanofibrous membrane/QCM system prepared by electrospinning. New J. Chem. 2014, 38, 5761–5768. [Google Scholar] [CrossRef] [Green Version]
  21. Moon, S.E.; Choi, N.J.; Lee, H.K.; Lee, J.; Yang, W.S. Semiconductor-Type MEMS Gas Sensor for Real-Time Environmental Monitoring Applications. ETRI J. 2013, 35, 617–624. [Google Scholar] [CrossRef]
  22. Darwish, H.; Jafarian, A.; Baleanu, D.; Senel, M.; Okur, S. Applications of Artificial Neural Network Technique to Polypyrrole Gas Sensor Data for Environmental Analysis. J. Comput. Theor. Nanosci. 2015, 12, 4392–4398. [Google Scholar] [CrossRef]
  23. Darwish, H.M.B.; Okur, S. CO adsorption kinetics of ferrocene-conjugated polypyrrole using quartz microbalance technique. Sens. Actuators B Chem. 2014, 200, 325–331. [Google Scholar] [CrossRef]
  24. Bieg, C.; Fuchsberger, K.; Stelzle, M. Introduction to polymer-based solid-contact ion-selective electrodes-basic concepts, practical considerations, and current research topics. Anal. Bioanal. Chem. 2017, 409, 45–61. [Google Scholar] [CrossRef]
  25. Broza, Y.Y.; Haick, H. Nanomaterial-based sensors for detection of disease by volatile organic compounds. Nanomedicine 2013, 8, 785–806. [Google Scholar] [CrossRef]
  26. Tung, T.T.; Losic, D.; Park, S.J.; Feller, J.F.; Kim, T. Core-shell nanostructured hybrid composites for volatile organic compound detection. Int. J. Nanomed. 2015, 10, 203–214. [Google Scholar]
  27. Ramgir, N.S. Electronic Nose Based on Nanomaterials: Issues, Challenges, and Prospects. ISRN Nanomater. 2013, 2013, 941581. [Google Scholar] [CrossRef] [Green Version]
  28. Wilson, A.D.; Baietto, M. Applications and advances in electronic-nose technologies. Sensors 2009, 9, 5099–5148. [Google Scholar] [CrossRef] [PubMed]
  29. Iqbal, N. QCM Sensor Arrays for Monitoring Volatile Plant Emanations via Molecularly Imprinted Polymers. Ph.D. Thesis, University of Vienna, Vienna, Austria, 2011. [Google Scholar]
  30. Staii, C.; Johnson, A.T., Jr.; Chen, M.; Gelperin, A. DNA-decorated carbon nanotubes for chemical sensing. Nano Lett. 2005, 5, 1774–1778. [Google Scholar] [CrossRef] [PubMed] [Green Version]
  31. Iqbal, N.; Mustafa, G.; Rehman, A.; Biedermann, A.; Najafi, B.; Lieberzeit, P.A.; Dickert, F.L. QCM-arrays for sensing terpenes in fresh and dried herbs via bio-mimetic MIP layers. Sensors 2010, 10, 6361–6376. [Google Scholar] [CrossRef] [PubMed] [Green Version]
  32. Kiani, S.; Minaei, S.; Ghasemi-Varnamkhasti, M. Real-time aroma monitoring of mint (Mentha spicata L.) leaves during the drying process using electronic nose system. Measurement 2018, 124, 447–452. [Google Scholar] [CrossRef]
  33. Kiani, S.; Minaei, S.; Ghasemi-Varnamkhasti, M. Application of electronic nose systems for assessing quality of medicinal and aromatic plant products: A review. J. Appl. Res. Med. Aromat. Plants 2016, 3, 1–9. [Google Scholar] [CrossRef]
  34. Dhanekar, S. Smart and Intelligent E-nose for Sensitive and Selective Chemical Sensing Applications. Smart Sens. Environ. Med. Appl. 2020, 149–171. [Google Scholar]
  35. Wilson, A.D. Diverse applications of electronic-nose technologies in agriculture and forestry. Sensors 2013, 13, 2295–2348. [Google Scholar] [CrossRef] [Green Version]
  36. Cui, S.; Ling, P.; Zhu, H.; Keener, H.M. Plant Pest Detection Using an Artificial Nose System: A Review. Sensors 2018, 18, 378. [Google Scholar] [CrossRef] [PubMed] [Green Version]
  37. Laothawornkitkul, J.; Moore, J.P.; Taylor, J.E.; Possell, M.; Gibson, T.D.; Hewitt, C.N.; Paul, N.D. Discrimination of plant volatile signatures by an electronic nose: A potential technology for plant pest and disease monitoring. Environ. Sci. Technol. 2008, 42, 8433–8439. [Google Scholar] [CrossRef] [PubMed]
  38. Sarheed, M.M. Allelopathic Compounds from Mint Target the Cytoskeleton from Cell Biology towards Application as Bioherbicides; KIT-Bibliothek: Karlsruhe, Germany, 2019. [Google Scholar]
  39. Bolse, N.; Eckstein, R.; Schend, M.; Habermehl, A.; Eschenbaum, C.; Hernandez-Sosa, G.; Lemmer, U. A digitally printed optoelectronic nose for the selective trace detection of nitroaromatic explosive vapours using fluorescence quenching. Flex. Print. Electron. 2017, 2, 024001. [Google Scholar] [CrossRef]
  40. Bolse, N.; Huber, R.; Habermehl, A.; Eckstein, R.; Hernandez-Sosa, G.; Mertens, A.; Eschenbaum, C.; Lemmer, U. A Low-Cost Versatile Fluorescence Quenching Detection System for Liquid-and Vapor-Phase Sensing. In Proceedings of the 2017 IEEE Sensors, Glasgow, UK, 29 October–1 November 2017; IEEE: New York, NY, USA, 2017; pp. 1–3. [Google Scholar]
  41. Shekhah, O.; Wang, H.; Kowarik, S.; Schreiber, F.; Paulus, M.; Tolan, M.; Sternemann, C.; Evers, F.; Zacher, D.; Fischer, R.A.; et al. Step-by-step route for the synthesis of metal-organic frameworks. J. Am. Chem. Soc. 2007, 129, 15118–15119. [Google Scholar] [CrossRef] [PubMed]
  42. Arslan, H.K.; Shekhah, O.; Wohlgemuth, J.; Franzreb, M.; Fischer, R.A.; Wöll, C. High-Throughput Fabrication of Uniform and Homogenous MOF Coatings. Adv. Funct. Mater. 2011, 21, 4228–4231. [Google Scholar] [CrossRef]
  43. Liu, J.X.; Lukose, B.; Shekhah, O.; Arslan, H.K.; Weidler, P.; Gliemann, H.; Bräse, S.; Grosjean, S.; Godt, A.; Feng, X.L.; et al. A novel series of isoreticular metal organic frameworks: Realizing metastable structures by liquid phase epitaxy. Sci. Rep. 2012, 2, 921. [Google Scholar] [CrossRef] [Green Version]
  44. Muckley, E.S.; Anazagasty, C.; Jacobs, C.B.; Hianik, T.; Ivanov, I.N. Low-cost scalable quartz crystal microbalance array for environmental sensing. In Organic Sensors and Bioelectronics IX; International Society for Optics and Photonics: Bellingham, WA, USA, 2016; p. 99440Y. [Google Scholar]
  45. Sauerbrey, G.; Jung, G. Vibrational Modes of Planoconvex Quartz Plates. Z. Angew. Phys. 1968, 24, 100–106. [Google Scholar]
  46. Zarzo, M.; Stanton, D.T. Identification of Latent Variables in a Semantic Odor Profile Database Using Principal Component Analysis. Chem. Senses 2006, 31, 713–724. [Google Scholar] [CrossRef] [Green Version]
  47. Lu, Z.; Zhou, J.; Wang, A.; Wang, N.; Yang, X. Synthesis of aluminium-doped ZnO nanocrystals with controllable morphology and enhanced electrical conductivity. J. Mater. Chem. 2011, 21, 4161–4167. [Google Scholar] [CrossRef]
  48. Sankar ganesh, R.; Navaneethan, M.; Mani, G.K.; Ponnusamy, S.; Tsuchiya, K.; Muthamizhchelvan, C.; Kawasaki, S.; Hayakawa, Y. Influence of Al doping on the structural, morphological, optical, and gas sensing properties of ZnO nanorods. J. Alloy. Compd. 2017, 698, 555–564. [Google Scholar] [CrossRef]
  49. Patil, A.; Dighavkar, C.; Borse, R. Al doped ZnO thick films as CO2 gas sensors. J. Optoelectron. Adv. Mater. 2011, 13, 1331–1337. [Google Scholar]
  50. Bahadori, M.B.; Zengin, G.; Bahadori, S.; Dinparast, L.; Movahhedin, N. Phenolic composition and functional properties of wild mint (Mentha longifolia var. calliantha (Stapf) Briq.). Int. J. Food Prop. 2018, 21, 183–193. [Google Scholar] [CrossRef] [Green Version]
Figure 1. E-nose setup used for measuring the Mint scent.
Chemosensors 09 00031 g001
Figure 2. (al) show the resonance frequency shifts of the sensor array with 12 different sensing materials e.g., (a) AZO, (b) ZnO, (c) SnO2, (d) ITO, (e) Cu(BPDC), (f) PVA, (g) PEDOT:PSS, (h) PFO, (i) SB,(j) SG, (k) SW, and (l) PB during two cycles of exposure to the individual Mint leaves (see Table 1 for abbreviations).
Chemosensors 09 00031 g002aChemosensors 09 00031 g002b
Figure 3. Maximum frequency shifts responses of sensor array.
Chemosensors 09 00031 g003
Figure 4. Two-dimensional plot of the Principal Component coefficients from 1800 observations.
Chemosensors 09 00031 g004
Figure 5. Linear Discriminant Analysis (LDA) of six species of Mints. (a) Two-dimensional plot of the LDA with 95% confidence ellipse; (b) confusion matrix obtained from 10-fold LDA calculations using the data obtained from the first cycle of the e-nose measurements.
Chemosensors 09 00031 g005
Figure 6. Linear Discriminant Analysis (LDA) of six Mint species. (a) Two-dimensional plot of the 10-fold LDA obtained from the training data sets shown with the colored symbols (first cycle e-nose measurements), and from the prediction data sets shown with the black symbols (second cycle of the e-nose measurements); (b) prediction confusion matrix with the unknown data sets from the second cycle of the e-nose measurements.
Chemosensors 09 00031 g006
Figure 7. The prediction confusion matrix obtained from the k-Nearest Neighbor Analysis (k-NN) analysis with10-fold (k = 10) calculation with the unknown data sets from the second cycle to compare with the training data set (true labels) obtained from the first cycle.
Chemosensors 09 00031 g007
Figure 8. k-NN accuracy (%) with increasing number of nearest neighbors.
Chemosensors 09 00031 g008
Table 1. Accessions used in this study. The voucher number gives the code, under which the plants are available in the Botanical Garden of the Karlsruhe Institute of Technology (KIT). The number of leaves harvested to reach 1 g is indicated, as well.
Mint AccessionCommon NameAbbreviationKIT Voucher# of Leaves for 1 g
Mentha x piperita L.Pepper MintPM539310
Mentha longifolia (L.)Horse MintMLF868210
Mentha spicata L. var. spicataSpear MintMS757923
Mentha spicata L. var. crispa (MC)Curly MintMC53917
Agastache rugosa (Fisch. & C.A.Mey.) KuntzeKorean MintAR757612
Nepata cataria L.CatnipNCL464311
Table 2. Frequency shifts after spin coating.
MaterialsSpin Speed (RPM)Initial f0 (MHz)Frequency Shift (kHz)
ZnO20009,999845.1
AZO200010,000043.6
SnO210009,999936.5
ITO10009,999681.8
PVA200010,020051.8
PEDOT.PSS200010,000150.4
PB210010,00647.5
SW155010,01549.2
PFO130010,00619.7
SB210010,002116.7
SG130010,00618.4
Cu(BPDC)-10,000113.9
Publisher’s Note: MDPI stays neutral with regard to jurisdictional claims in published maps and institutional affiliations.

