Article

Graphite Studded with Facile-Synthesized Cu2O Nanoparticle-Based Cubes as a Novel Electrochemical Sensor for Highly Sensitive Voltametric Determination of Mebeverine Hydrochloride

by
Ahmed H. Naggar
1,2,*,
Ahmed Kotb
2,
Ahmed A. Gahlan
2,
Mahmoud H. Mahross
2,
Abd El-Aziz Y. El-Sayed
2 and
Adel A. Abdelwahab
1,2
1
Department of Chemistry, College of Science and Arts, Jouf University, Al Qurayyat 75911, Saudi Arabia
2
Chemistry Department, Faculty of Science, Al–Azhar University, Assiut 71524, Egypt
*
Author to whom correspondence should be addressed.
Submission received: 22 December 2020 / Revised: 3 February 2021 / Accepted: 4 February 2021 / Published: 9 February 2021
(This article belongs to the Section Electrochemical Devices and Sensors)

Abstract

:
Herein, a feasible chemical reduction method followed by intensive mixing was applied for the preparation of an attractive material based on graphite studded with cuprous oxide nanoparticle-based cubes (Cu2ONPs–C@G). Transmission electron microscope (TEM), scanning electron microscope (SEM), X-ray diffraction (XRD) and cyclic voltammetry (CV) were utilized for characterization. Cuprous oxide nanoparticles (Cu2ONPs), with a diameter range mainly distributed from 4 to 20 nm, aggregate to form microcubes (Cu2ONPs–C) with an average diameter of about 367 nm. Paste electrode was prepared using Cu2ONPs–C@G (Cu2ONPs–C@G/PE) for voltametric quantification of the musculotropic antispasmodic drug: mebeverine hydrochloride (MEB). The electrochemical behavior of MEB was studied using CV, and the optimum analytical parameters were investigated using square wave adsorptive anodic stripping voltammetry (SWAdASV). Moreover, density functional theory (DFT) was used to emphasize the ability of MEB to form a complex with Cu2+, confirming the suggested electrochemical behavior of MEB at Cu2ONPs–C@G/PE. With good stability and high reproducibility, SWAdASV of Cu2ONPs–C@G/PE shows successful quantification of MEB over the concentration range of 5.00 × 10⁻¹¹–1.10 × 10⁻⁹ M with lower limit of detection (LOD) and lower limit of quantification (LOQ) values of 2.41 × 10⁻¹¹ M and 8.05 × 10⁻¹¹ M, respectively. Finally, accurate quantification of MEB in dosage forms (tablets) and biological fluids (spiked human urine and plasma samples) was achieved using Cu2ONPs-C@G/PE.

1. Introduction

Nanoparticles offer interesting and peculiar properties, such as size- and shape-dependent and catalytic activities, crystal shape-dependent thermodynamics, novel mechanical properties, unique magnetic phenomena and quantum confinement phenomena [1]. Particularly copper nanoparticles show attractive unusual properties, such as small dimensions, large specific surface area, low electric resistance and lower cost than other favored metal nanoparticles, e.g., gold and silver nanoparticles [2,3,4]. With special regard to cuprous oxide nanoparticles (Cu2ONPs), it is considered as one of the cheapest and abundant p-type semiconductor metal oxides with a narrow band gap and is environmentally friendly, since it is a relatively non-toxic material [5].
Among cuprous oxide transversal forms, cubes may be the most interesting because of their tailor-made properties and their high symmetries, other more complex structures can be obtained from these simple structural forms [6,7]. It was reported about the self-assembly of Cu2ONPs to form microspheres and microcubes [8]. Different synthesis methods were applied to obtain the microcube morphology, such as hydrothermal [8,9], metal–organic framework calcination [10], surface ion exchange strategy followed by reductive deposition [11] and chemical reduction [12]. However, it is important to introduce a more facile and safe synthesis method where these previously mentioned methods require special equipment [8,9]; use special chemicals [9,10,11,12], such as surfactants; or use dangerous chemicals [11].
Carbon-based metal nanoparticles have attracted considerable attention due to their mechanical and thermal properties and their ability for electrode modifications [13,14]. Because of these properties, metal and metal oxide nanoparticles have been used successfully for increasing carbon paste electrode sensitivity toward various electroanalytical applications [15,16]. It was found in the literature that pure Cu2ONPs [11] and Cu2ONPs supported on carbon materials were applied successfully in different voltametric determinations [17,18].
Mebeverine hydrochloride (MEB) (Scheme 1) is used in the treatment of various medicinal abdominal troubles. MEB is an effective musculotropic antispasmodic, which is used as a medicine for spasms associated with gastrointestinal disorders, such as irritable bowel syndrome and gastrointestinal spasm secondary [19,20]. MEB relieves spasms without affecting gut motility due to its action not interfering with the autonomic nervous system. The ideal dose of MEB is to be taken in the range of 135–270 mg, and this is to avoid serious health complications in the form of cardiovascular and neurological symptoms. After oral administration, MEB is rapidly and completely metabolized to mebeverine alcohol and veratric acid. Moreover, as a result of MEB hydrolysis and desmethylation steps, mebeverine acid and desmethylmebeverine acid are the major metabolites of MEB found in real human samples [20,21].
Due to its vital importance, MEB quantification in dosage forms and biological fluids at low concentrations is of great importance. Although different analytical methods have been applied for the quantification of MEB, there is an agreement that MEB cannot be detected in real biological samples due to the previously mentioned MEB metabolism. Additionally, most of these methods have been applied for the MEB quantification in dosage forms and spiked biological samples. The literature survey reveals several analytical methods for MEB quantification, such as chromatographic [21,22], GC–MS [23], spectrophotometric [24,25], spectrofluorometric [25,26] and electrochemical methods [27,28,29,30,31,32,33]. Carbon paste electrodes (CPEs) have been applied successfully for MEB quantification either using potentiometric [31] or voltametric techniques [32,33]. This can be attributed to their low cost, low background currents, possibility to be used over a wide studied potential window, ease of surface renewability as well as modification simplicity and utilization variety when compared with other solid electrodes [34,35,36,37]. However, electrodes used for reported voltametric techniques are prepared from high price materials with multistep time-consuming preparation, with a sensitivity that needs improvement [32,33].
Quantum chemical calculations are widely used to predict the optimized structure of a compound and its reactivity to bind the metal ion. Recently, with the massive advancement of computational hardware, density functional theory (DFT) has attracted considerable attention from the scientific community for predicting the structural behavior and reaction mechanisms of several chemical species. Using this advanced computational method, it is easy to predict a systematic method for the analysis and describe the reaction mechanism of different organic compounds and their metal complexes [38,39].
The current work is a continuation of our efforts in the field of voltametric quantification of pharmaceuticals using bare [34,40] and modified [41,42] electrodes. Herein, we propose a simple and straightforward strategy for the synthesis of cuprous oxide microcubes (Cu2ONPs–C). The resulting Cu2ONPs–C is used for the studding of graphite (Cu2ONPs–C@G) via a simple hand mixing method. Both Cu2ONPs–C and Cu2ONPs–C@G are characterized using different structural and electrochemical techniques. Moreover, Cu2ONPs-C@G is used to prepare a working paste electrode, which is denoted as Cu2ONPs–C@G/PE. The Cu2ONPs–C@G/PE is applied to study the MEB electrochemical behavior using cyclic voltammetry (CV). DFT is used for investigating the behavior of MEB during the voltametric measurement. Thanks to its high sensitivity, square wave adsorptive anodic stripping voltammetry (SWAdASV) is used to investigate the optimum conditions required for the voltametric quantification of MEB. The proposed Cu2ONPs–C@G/PE is applied over a wide potential window (−0.6 to +1.0 V vs. Ag/AgCl) in an easier and highly sensitive procedure using SWAdASV for the quantification of MEB in dosage forms (tablets) and biological fluids (spiked human urine and plasma samples).

2. Materials and Methods

2.1. Apparatus

All voltametric experiments were carried out using the EG&G Princeton Applied Research Potentiostat/Galvanostat Model 273A (USA) combined with a magnetic stirrer (KIKA Labortechinik, Staufen, Germany), controlled by an IBM compatible computer running the electroanalytical software model 270/250 version 4.30. This system was accomplished with a three-electrode system where handmade carbon paste, Ag/AgCl and Pt wire were used as the working, reference, and counter electrodes, respectively. VWR Scientific Products, Model 2000, USA, were used for all pH measurements. The used pH meter was calibrated using standard buffer pH 4.01, 7.00 and 9.00.

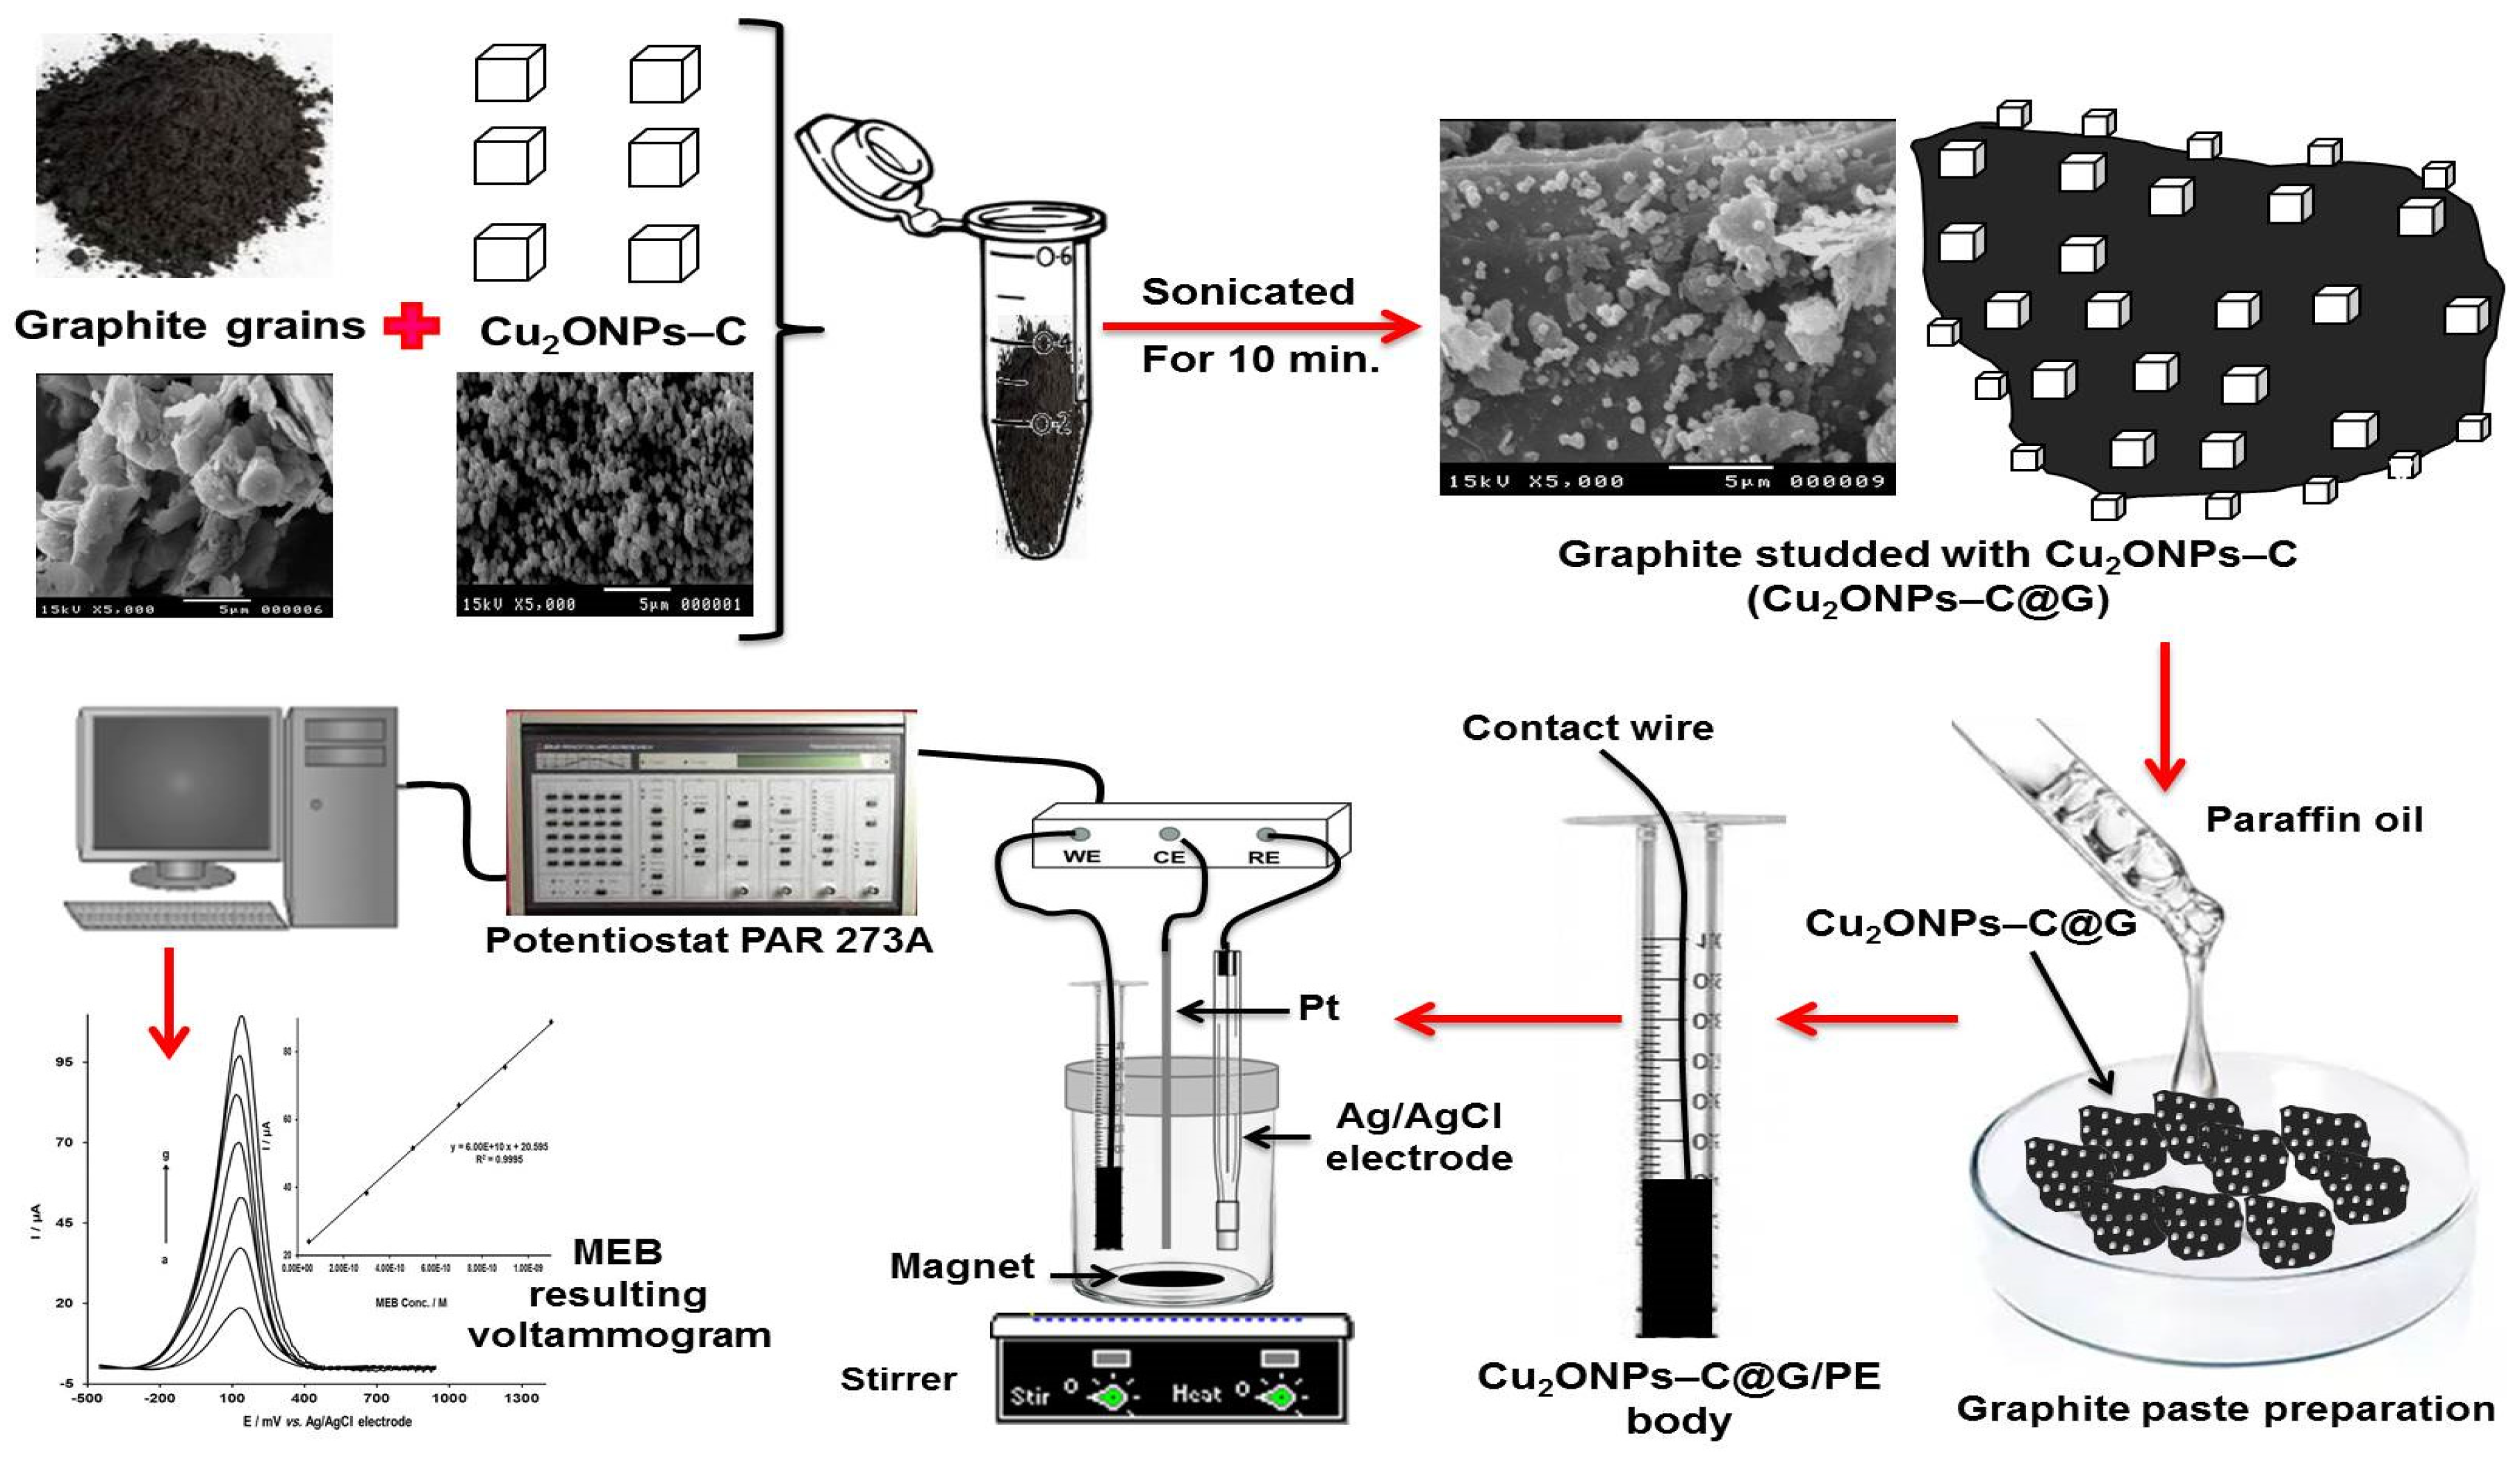
2.2. Preparation and Characterization of the Cu2ONPs–C and Cu2ONPs–C@G Composites

Herein, a previous procedure for cupric oxide nanoparticles (CuONPs) preparation was applied with some modifications that resulted in Cu2ONPs–C production as we prove later in the discussion of the characterization results [4]. In a typical procedure, 200 mg of Cu(NO3)2·3H2O was dissolved in 100 mL distilled water. Then, at room temperature and under vigorous stirring for 10 min, 4 mL of 10% N2H4·H2O was added dropwise to the previous resulted solution. The addition process was accompanied by a rapid formation of dark blue suspension. The whole solution was heated at 80 °C until complete evaporation. During heating, the dark blue suspension is changed gradually to dark red and finally stabilized at reddish–brown color. The resulted precipitate after drying is characterized as a fine precipitate; it was collected, washed repeatedly with distilled water to ensure the highest purity degrees, then filtered and left till complete drying at room temperature. The as-prepared reddish-brown precipitate was collected and labeled as Cu2ONPs–C.
For the preparation of Cu2ONPs–C@G, 1 g of graphite was hand-mixed intensely with 80 mg of Cu2ONPs–C. To ensure the good distribution and stabilization of Cu2ONPs–C on the graphite grain surface, an Eppendorf tube containing this mixture was ultrasonicated for 10 min. A small part of the resulting mixture was kept for the characterization process, and the rest was used in the preparation of a paste working electrode (Cu2ONPs–C@G/PE) as previously mentioned [34]. For comparison purposes, another paste electrode based on bare graphite (CPE) was prepared using the same procedure.
For the investigation of the prepared materials, different analyses were accomplished. The phase of the prepared nanoparticles was identified by recording X-ray diffraction (XRD) patterns using the X-Ray Diffractometer theta:theta D8 Advance-Burker, with Cu–Kα radiation operated at λ = 0.1542 nm, 40 kv and 40 mA, with a secondary monochromator of graphite at an angle of 2θ from 10° to 80° with a scan speed of 0.02°/min. The crystallite sizes of the prepared nanoparticles were calculated by application of Scherrer’s equation. Morphology of the prepared nanoparticles was investigated using avscanning electron microscope (SEM) studies carried out on JEOL JSM 5400 LV. To examine the inner structure and size of the obtained Cu2ONPs–C@G in the composite, transmission electron micrographs were recorded using a JEOL JEM–100 CXII transmission electron microscope (TEM) equipped with a tungsten–filament 100 kv transmission electron microscope; the images were picked out using a Gatan Erlangshen ES500W camera where Gatan Digital Micrograph software was used for the determination of nanoparticle diameters.

2.3. Computational Calculations

The theoretical calculations were performed using the DFT at B3LYP (Becke’s three-parameter hybrid functional using the correlation functional of Lee, Yang and Parr, which includes both local and non-local term correlation functionals) methods at 3–21G basis set. To perform this computational work, we used the Gaussian 09 program package [43].

2.4. Reagents and Materials

Copper nitrate trihydrate (Cu(NO3)2·3H2O) and hydrazine monohydrate (N2H4·H2O) were purchased from Avondale Laboratories (UK) and Alpha Chemika (India), respectively. MEB was purchased from Merck. An appropriate amount of pure MEB was used to prepare MEB stock solution by dissolving in double-distilled water, and the resulting solution was stored in a brown volumetric flask in a refrigerator. Required concentrations of MEB were prepared daily by serial dilution of its stock solution using the same solvent. For MEB quantification in dosage forms, Duspatalin and Colospasmin® forte tablets were purchased from Pharco Pharmaceutical Company and Egyptian International Pharmaceutical Industries Company (E.I.P.I.CO), respectively. Each tablet is claimed to contain 135 mg MEB. All other used chemicals were of analytical grade, used without further purification, and their solutions were prepared using double distilled water. Graphite powder was purchased from Measurement Ringsdorff Werke, Germany.

2.5. Methodology

2.5.1. Square Wave Adsorptive Anodic Stripping Voltametric Quantification of MEB in Bulk and Dosage Forms

For all stripping voltametric measurements, the used blank solution was a mixture of 0.1 M phosphate buffer (pH ≈ 8.0) and 0.1 M KCl. The preconcentration step was performed by immersing the prepared Cu2ONPs–C@G/PE in a stirred 15 mL of the blank solution at a potential range from −0.6 to +1.0 V for a given period. Once the stirring stopped, the solution was left for 10 s to settle and allow the background current to decrease. The same procedure was repeated in the presence of 2 × 10⁻⁵ M MEB. Then, cyclic and square wave anodic stripping voltammograms were recorded in the positive potential direction. To restore the initial activity of Cu2ONPs–C@G/PE, simply removing the outer surface of paste by smoothing its surface against white paper was performed. All measurements were performed at room temperature. A brief description of the working electrode construction and MEB voltametric quantification is shown in Figure 1.
For analysis of MEB in dosage forms, ten tablets of MEB dosage forms (Duspatalin or Colospasmin® forte) were weighed, powdered and mixed well in a mortar. An amount of 0.1294 g of powdered MEB tablets was dissolved in 100 mL of double distilled water, shaken well and filtered using filter paper. An aliquot of the filtrate was then transferred into a 10 mL calibrated flask, and it was completed to the mark with the same solvent. Then, 20 µL of this solution was then added into the voltametric cell, and the voltametric procedure was performed as before.

2.5.2. MEB Analysis from Spiked Human Urine and Plasma Samples

The studied biological fluids were collected from healthy donors who had not received any previous treatments. These fluids were subjected to simple preliminary treatment steps before used in MEB determination.
For the MEB quantification spiked human urine samples, the collected blank urine samples were centrifuged for 20 min at 4000 rpm to get rid of protein residues. Then, 1.0 mL of the resulting supernatant solution was drawn off using a micro-pipette and then injected into an electrochemical cell containing a blank solution mixture containing 0.1 M phosphate buffer (pH ≈ 8.0) and 0.1 M KCl. Thereafter, the described voltametric procedure was conducted, and MEB determination voltammogram was recorded.
The investigated plasma samples were obtained by centrifuging the collected blood samples at 4000 rpm for 30 min using tabletop the high-speed universal harmonic centrifuge 12,000 rpm model PLC–012 (Taiwan). After that, a mixture consisting of MEB aliquots, 1.0 mL of obtained human plasma and 3 mL of acetonitrile was transferred quantitatively to centrifugation tubes and allowed to be centrifuged at 4000 rpm for 20 min. After finishing the centrifugation, 20 μL of the resulting mixture was injected into the voltametric cell, and the recommended voltametric procedure was applied for the MEB voltametric determination.

3. Results and Discussion

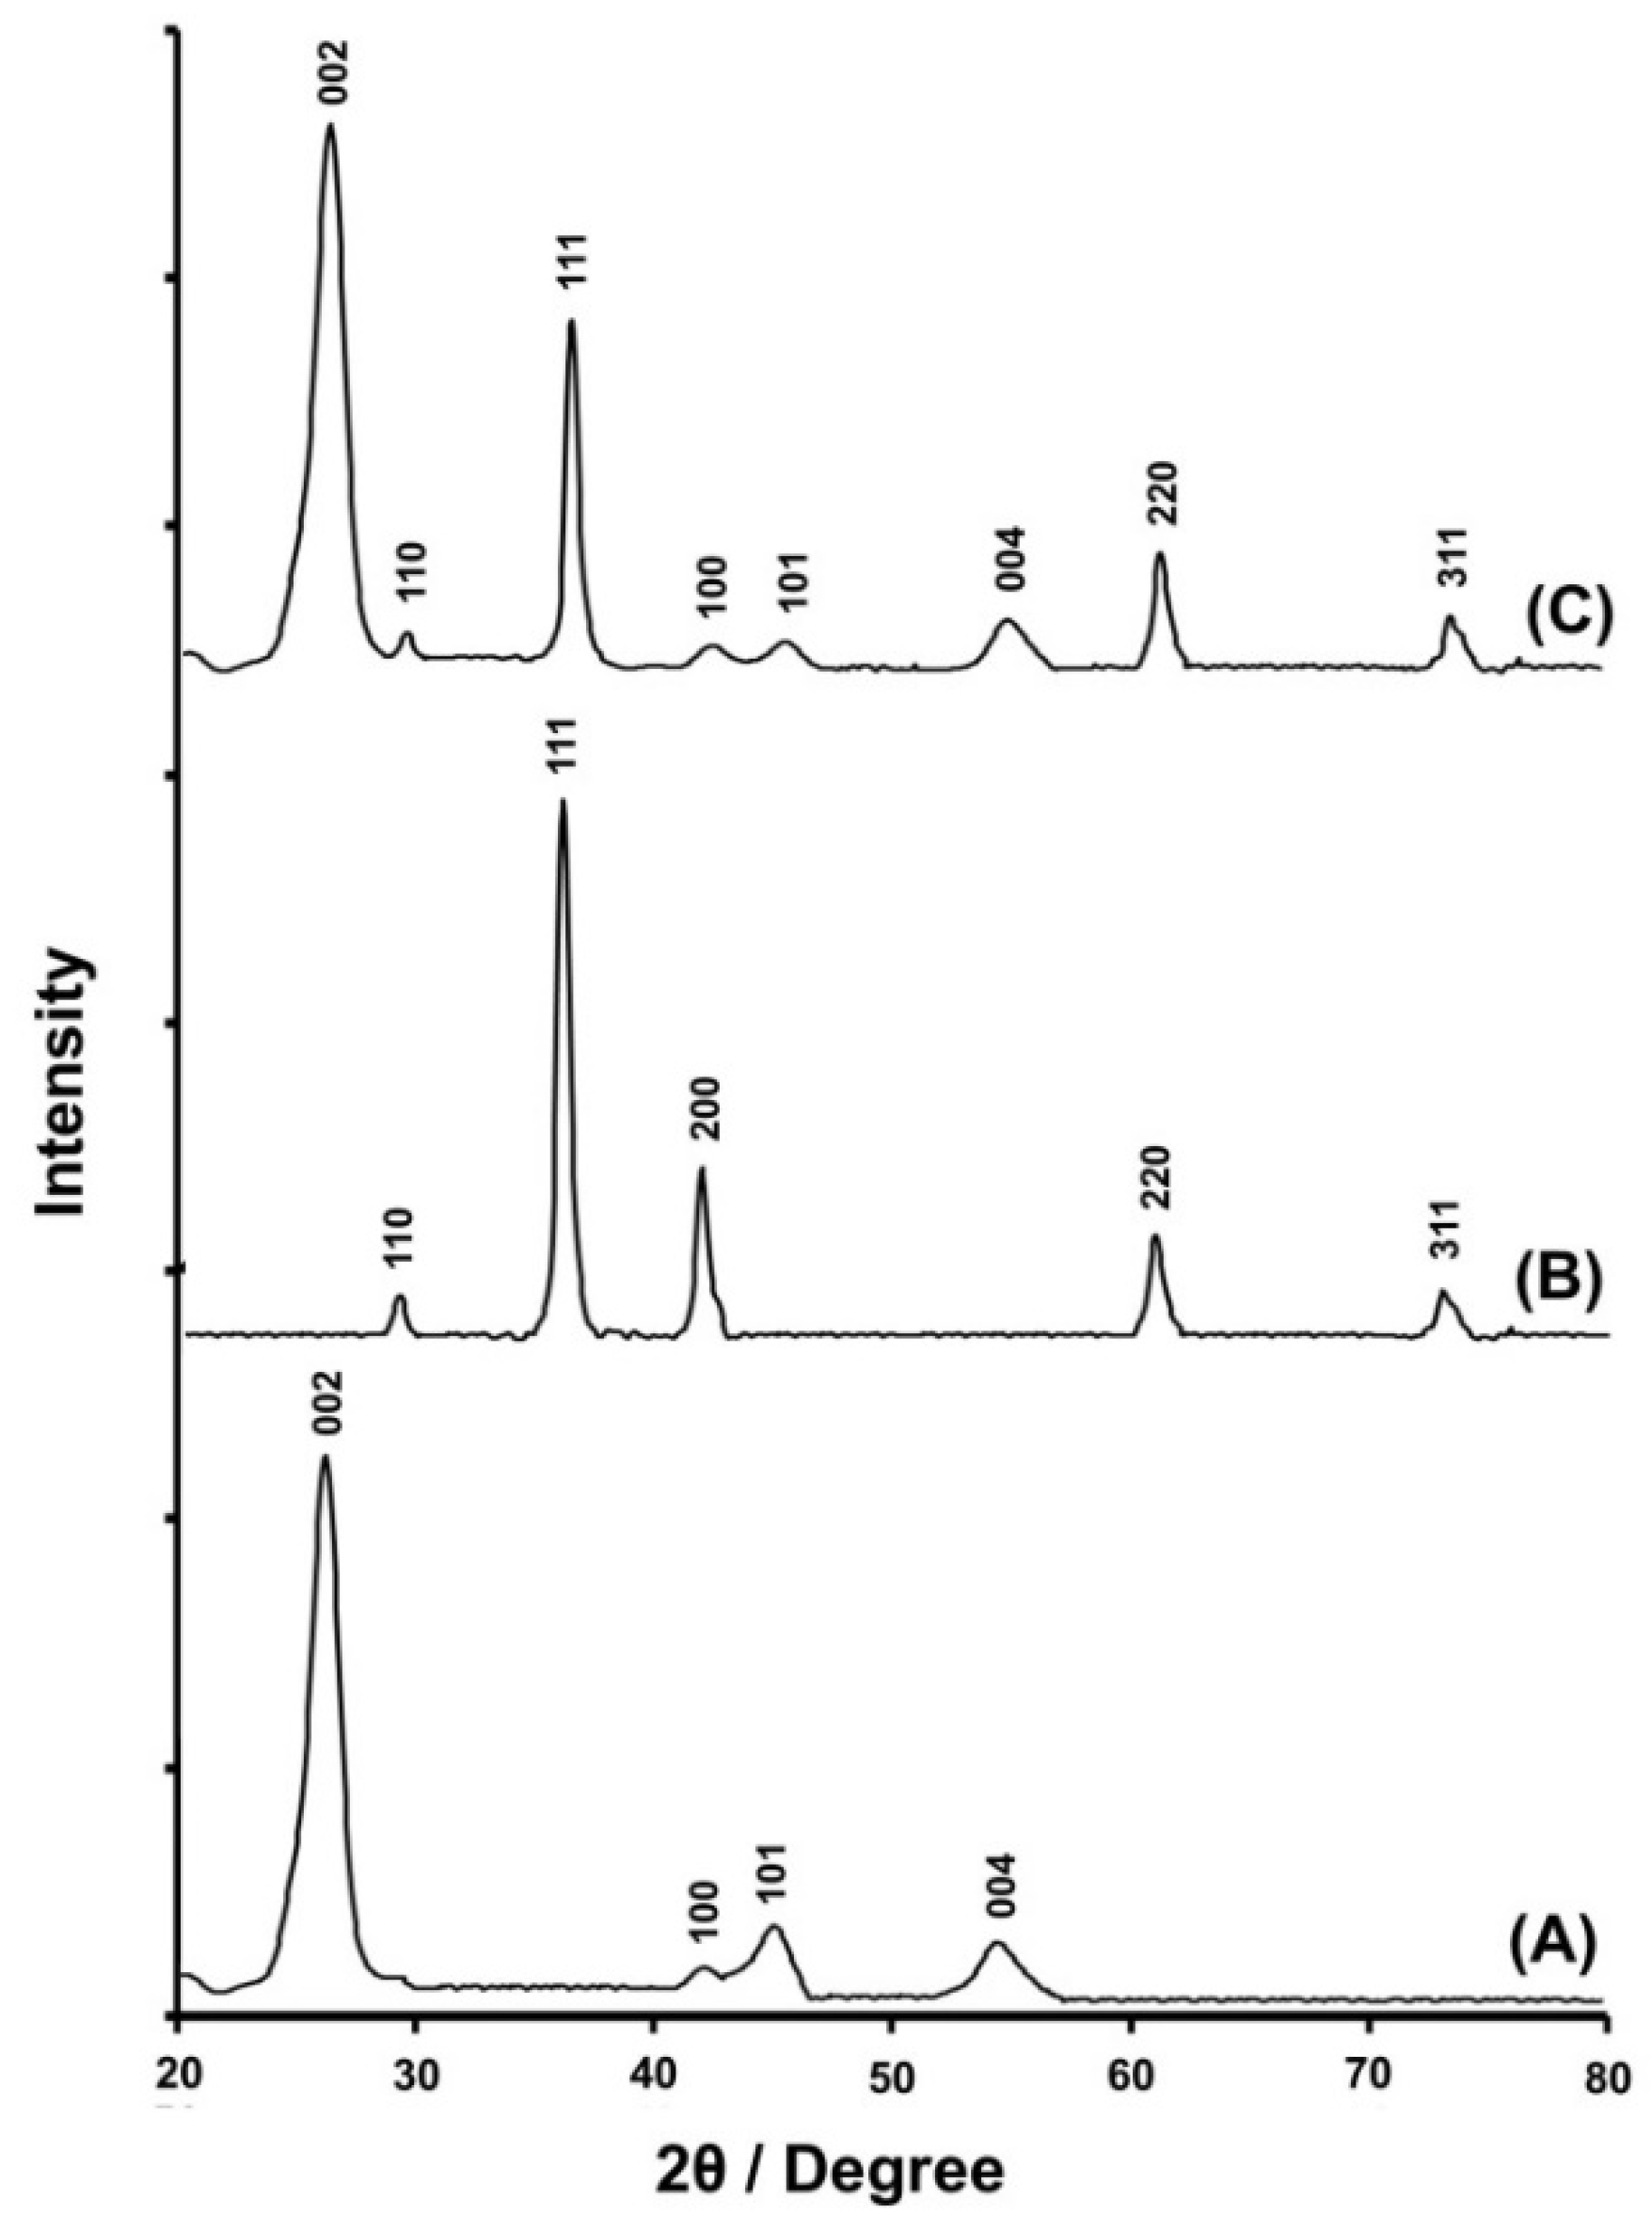
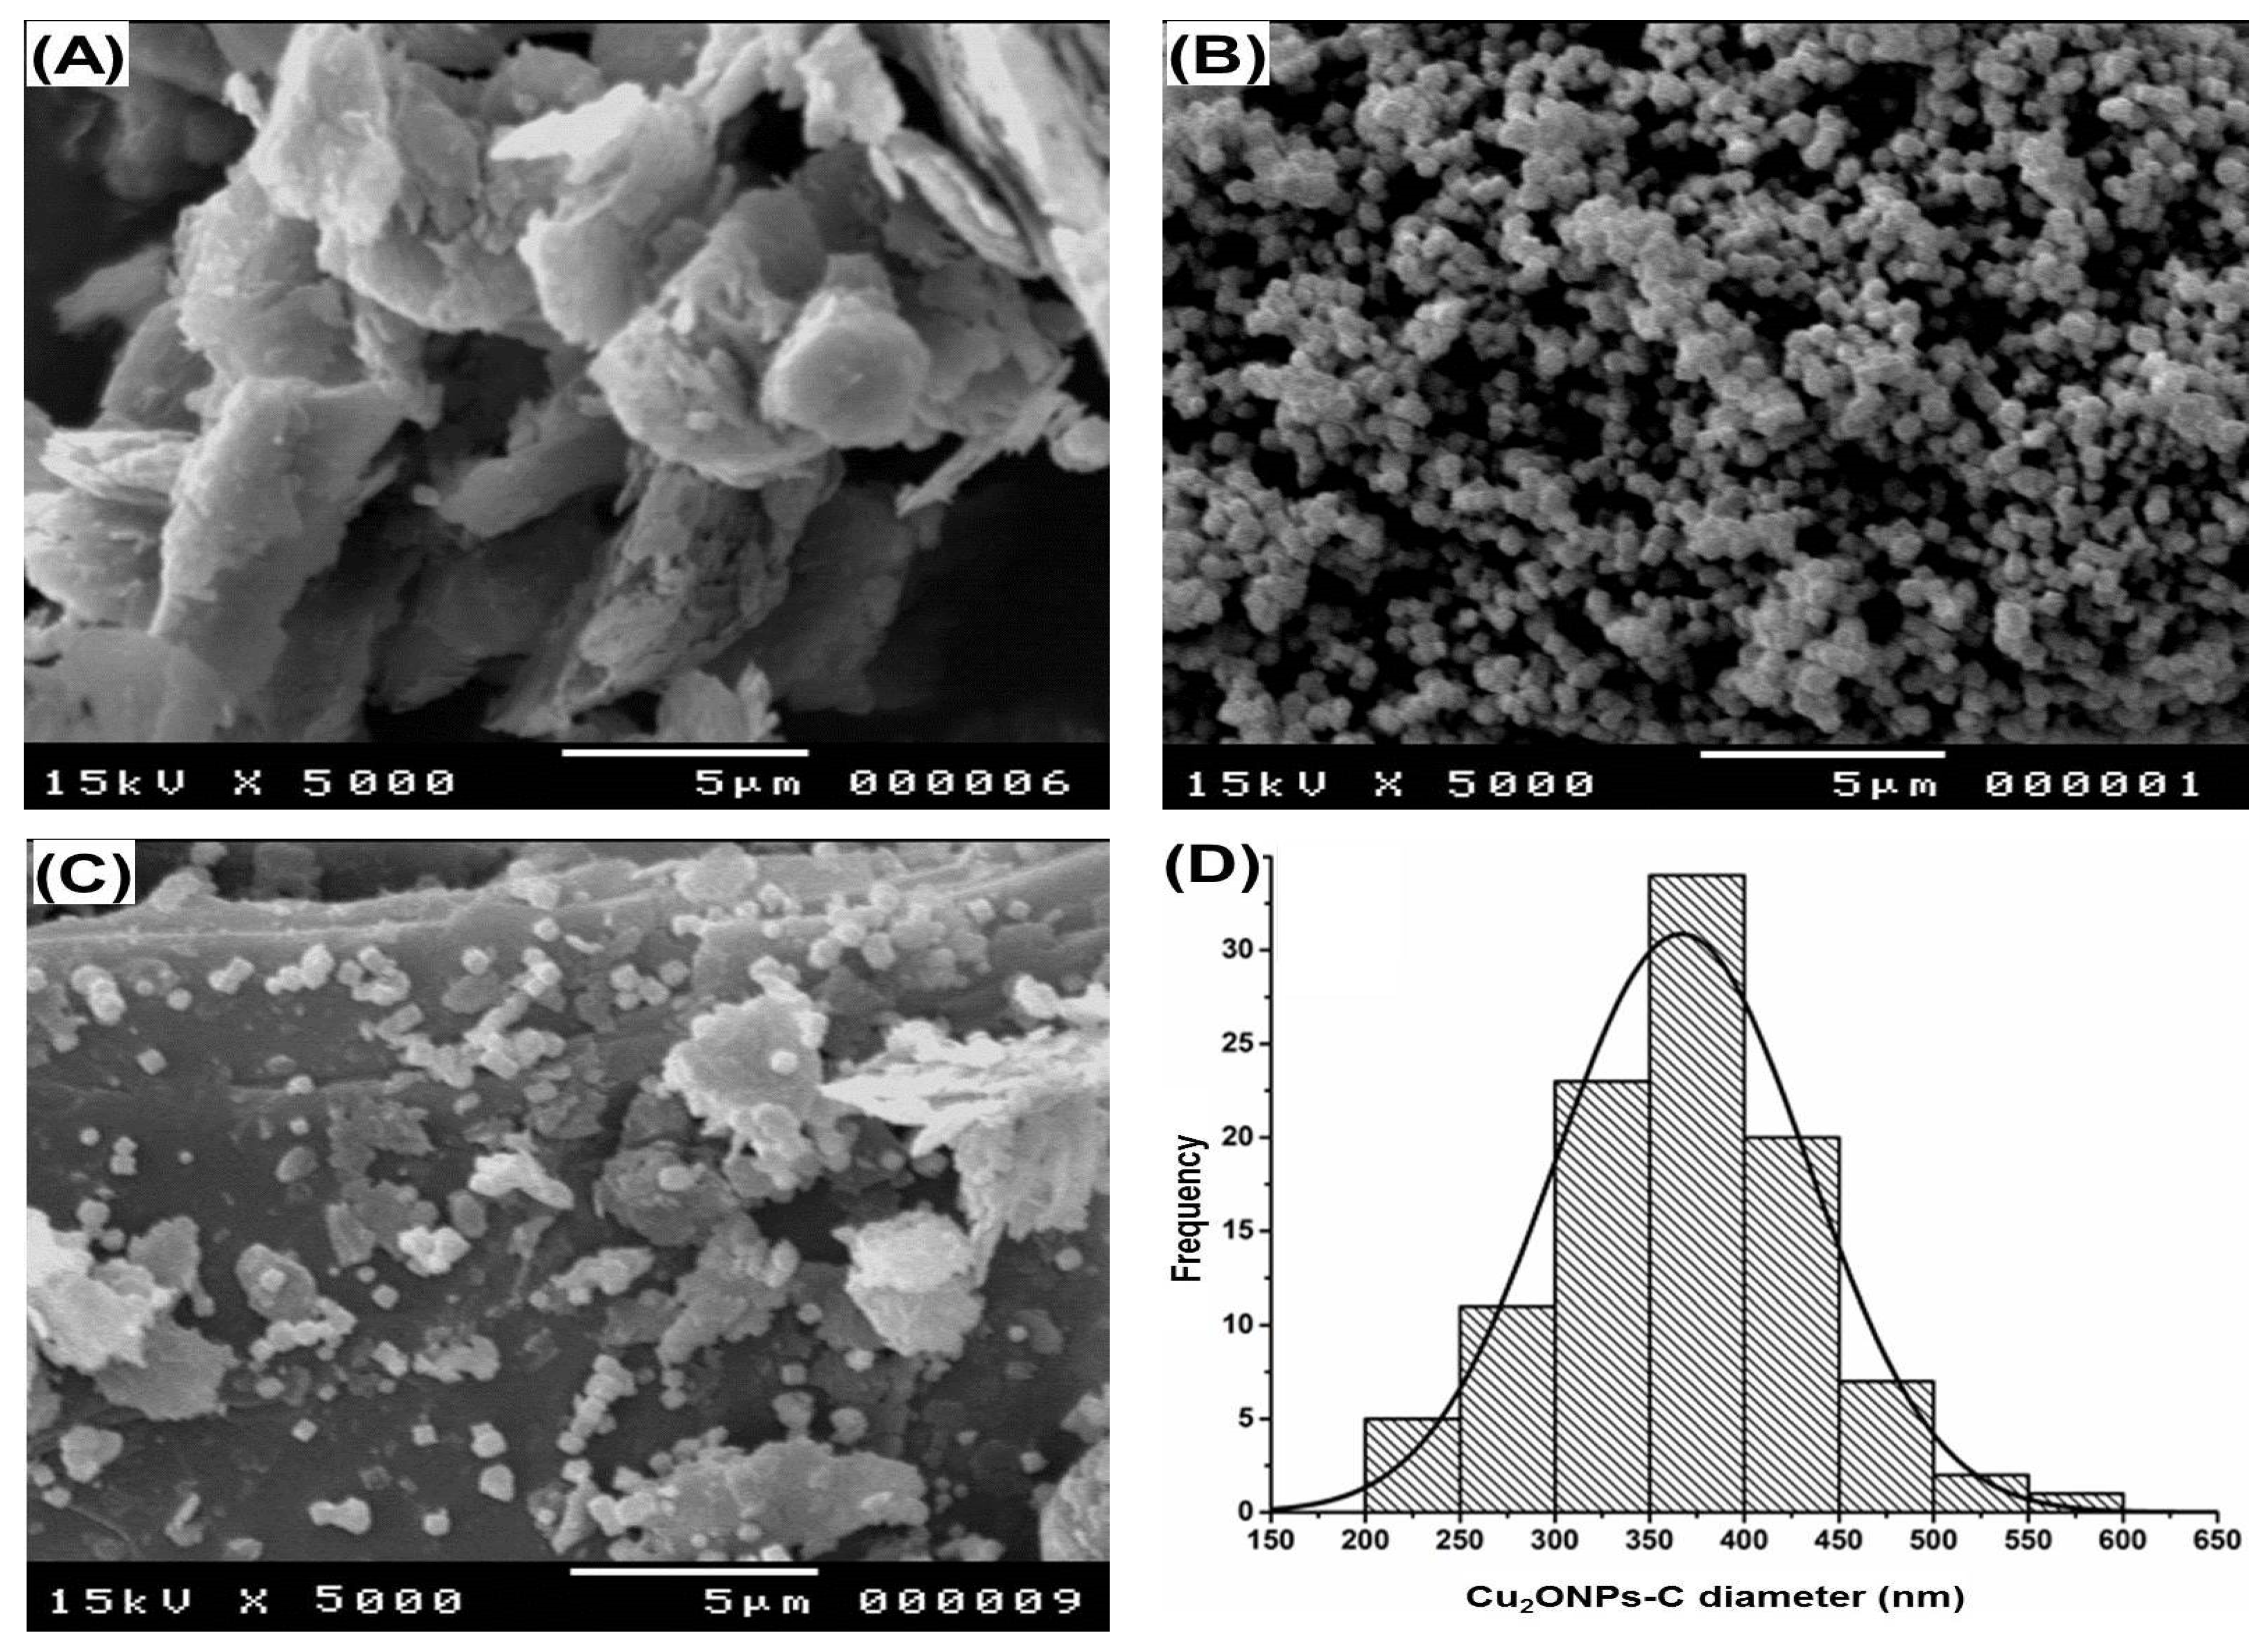
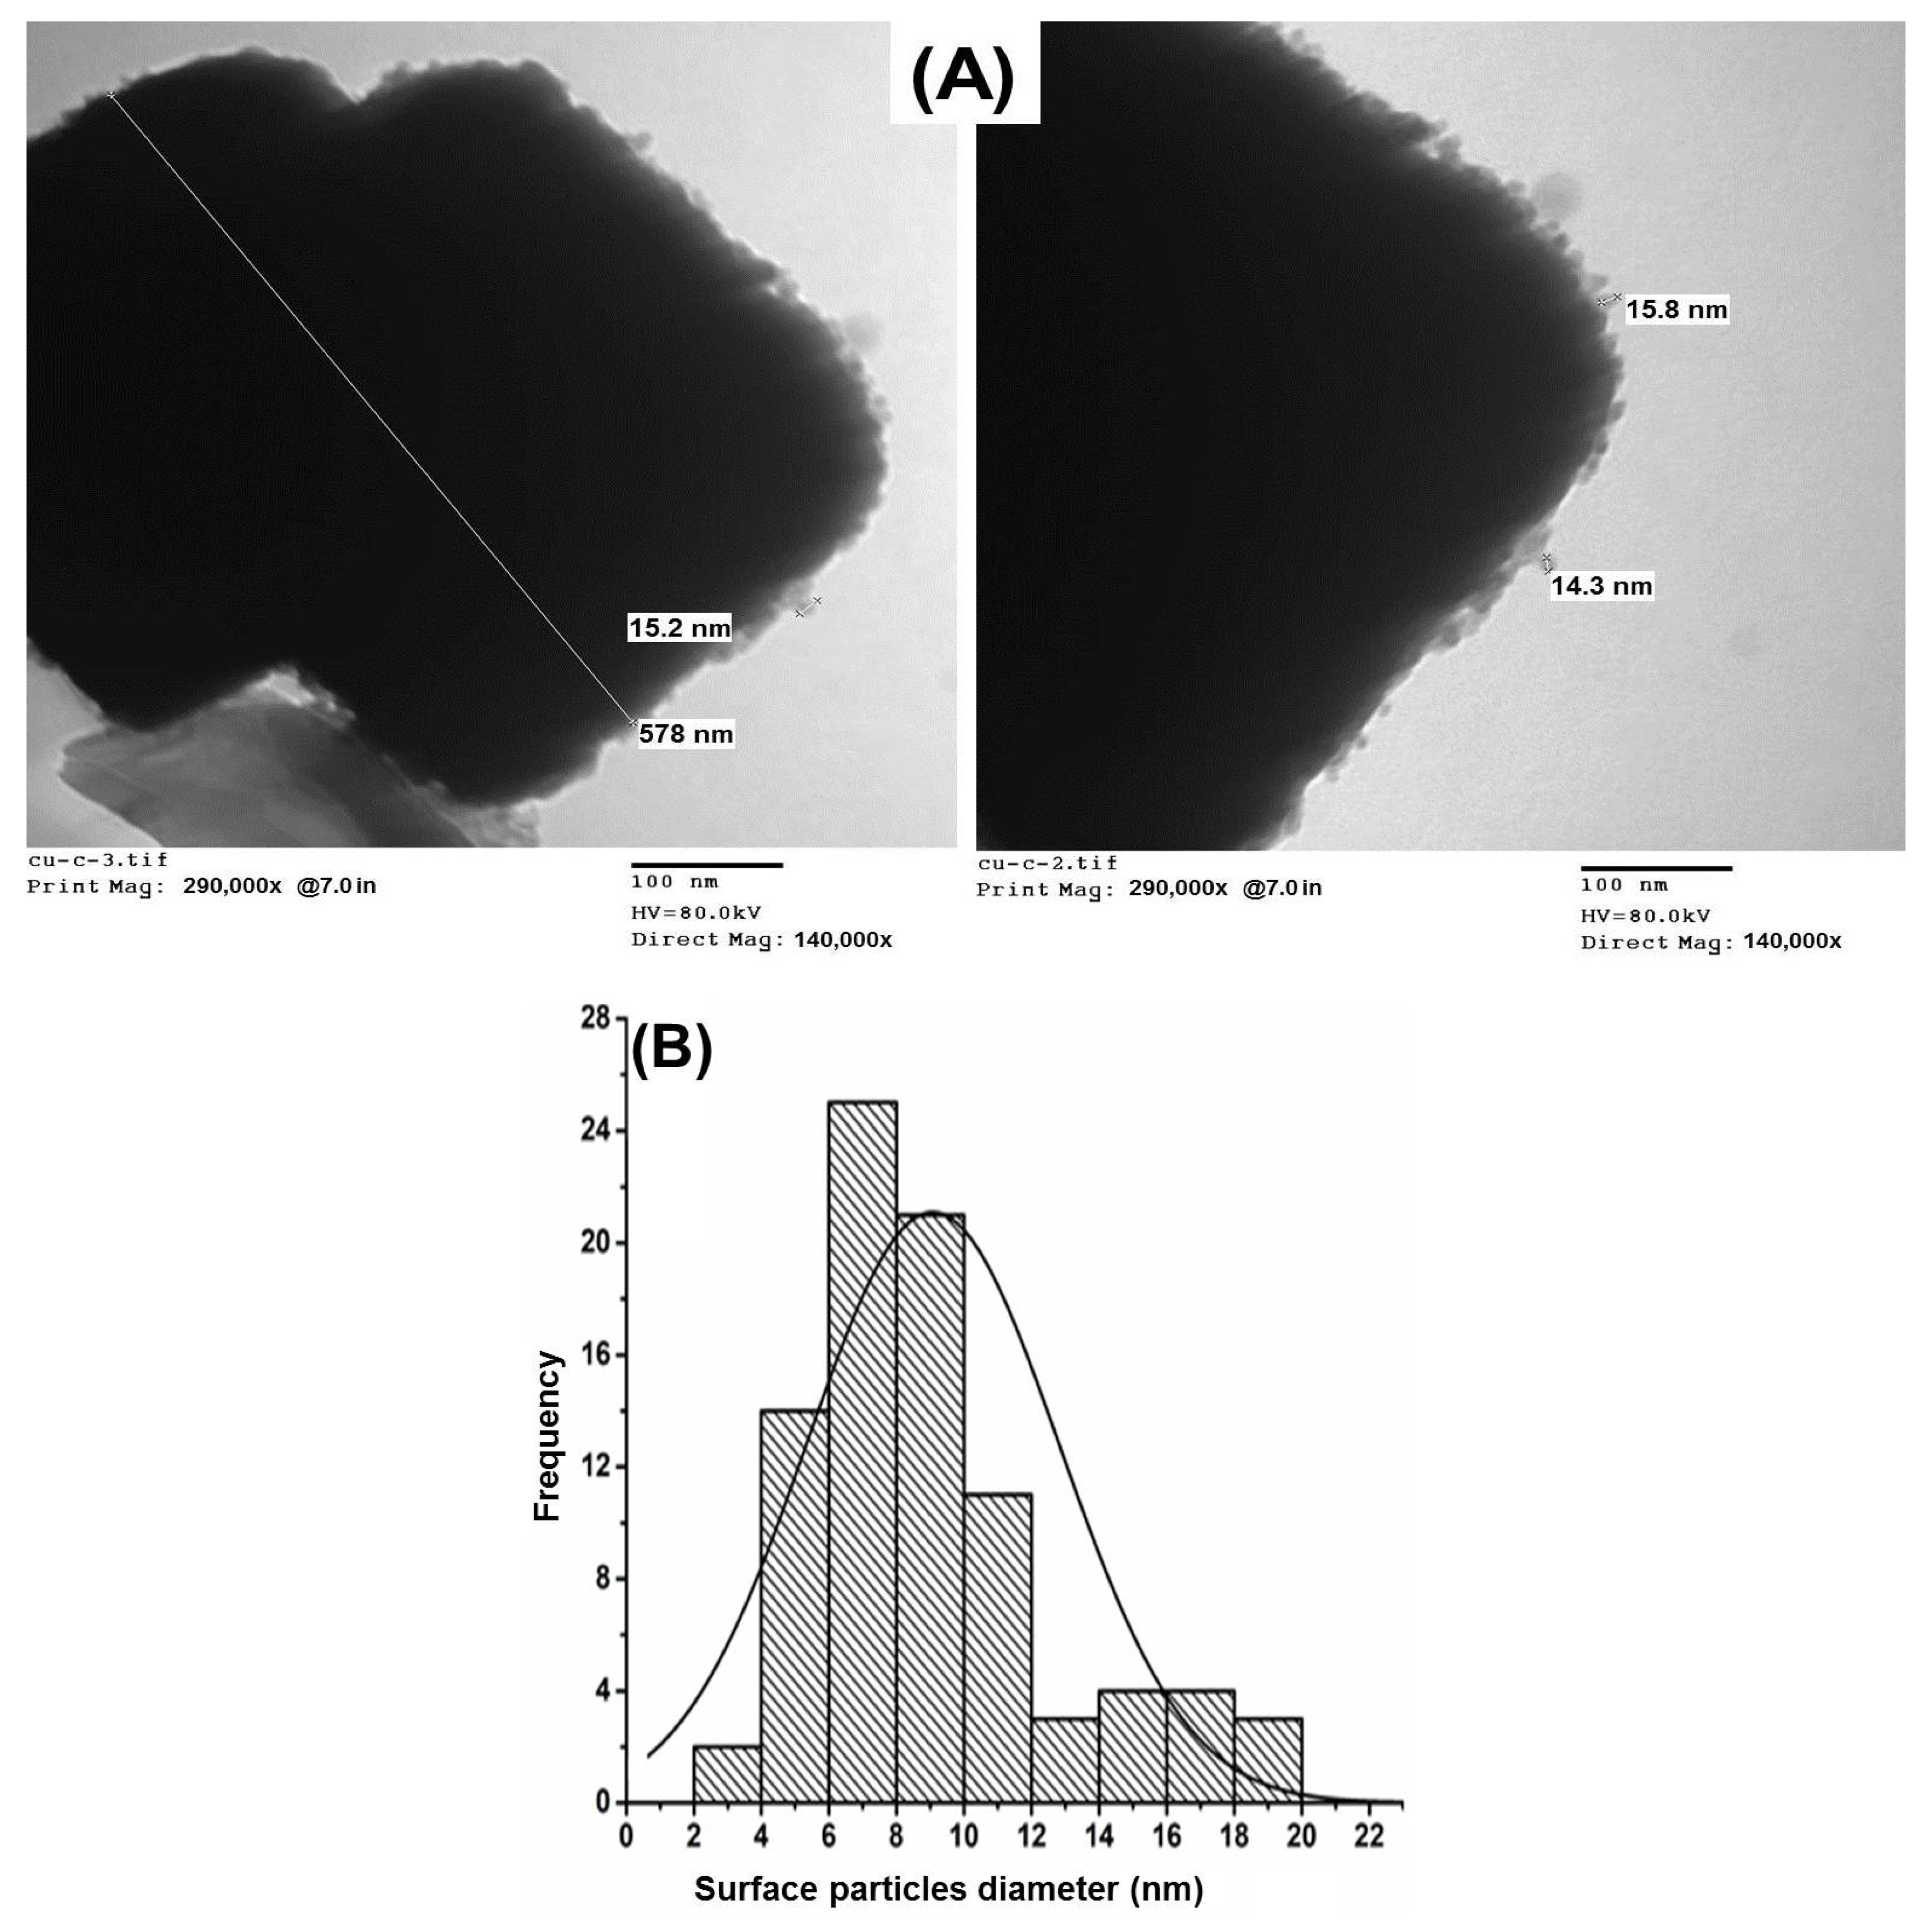
3.1. Characterization of Cu2ONPs–C and Cu2ONPs–C@G Composite

Figure 2 shows a typical XRD pattern of bare graphite, pure synthesized Cu2ONPs–C and Cu2ONPs–C@G. For the XRD pattern of bare graphite grains (Figure 2A), three distinctive diffraction peaks at 2θ values of 26.5°, 44.6° and 54.7° and a small peak at 42.4° corresponding to (002), (101), (004) and (100) planes, respectively, are illustrated. The recorded values are in accordance with previously recorded graphite XRD peaks [44]. From the XRD pattern shown in Figure 2B, the diffraction peaks of Cu2ONPs–C were recorded at 2θ values of 29.38°, 36.10°, 41.92°, 61.06° and 73.24°, corresponding to (110), (111), (200), (220) and (311) planes, respectively. The recorded peak positions show an excellent agreement with the International Center of Diffraction Data card (JCPDS Card No. 05–0667) and the reported values obtained for a similar analysis found in the literature [3,17,18]. The literature review shows data for the XRD pattern of Cu nanoparticles, which illustrate the existence of characteristic peaks at 2θ values of 43.64°, 50.80° and 74.42°, corresponding to (111), (200) and (220) planes, respectively (JCPDS Card No. 04–0836) [3]. Additionally, for CuO nanoparticles, the reported characteristic peaks at 2θ values of 32.6°, 35.6°, 38.9°, 48.9°, 53.7°, 58.4°, 61.7°, 66.3°, 68.1°, 72.5° and 75.2° correspond to (110), ( 1 ¯ 11–002), (111–200), ( 2 ¯ 02), (020), (202), ( 1 ¯ 13), (311), (220), (311) and (004) planes, respectively (JCPDS Card No. 48–1548) [45]. The XRD pattern of Cu2ONPs–C proved that there are no characteristic peaks of either Cu or CuO nanoparticles, indicating that the obtained Cu2ONPs are a pure crystalline single cubic phase with typical face-centered cubic (fcc) lattice [3,45]. Approximately, all diffraction peaks of bare graphite grains and Cu2ONPs–C were recorded in the XRD pattern of Cu2ONPs–C@G, as illustrated in Figure 2C, indicating the presence of a combination of nanoparticles and graphite in this sample. The broadness of the peaks can be used to obtain the crystallite size of Cu2ONPs by using the Debye–Scherrer formula in Equation (1) as follows [46]:
D = K λ β c o s θ
where D is the average crystallite size of the prepared particles, λ is the X–ray wavelength, typically 0.1541 nm, β is the full width at half maximum (FWHM) in radians, K is the Scherrer’s coefficients (0.89) and θ is Bragg’s angle. The produced Cu2ONPs have an average calculated crystallite size of 14.52 ± 1.08 nm.
SEM was used to identify the morphology of bare graphite grains, pure synthesized Cu2ONPs–C and graphite grains studded with Cu2ONPs–C@G (Figure 3). As can be seen in Figure 3A, bare graphite grains appeared as overlapped peels of different sizes with rugged and heterogeneous surfaces. At the same magnification, pure synthesized Cu2ONPs–C showed nearly monodisperse cubes (Figure 3B). In the same examined area, it can be seen that some of the prepared Cu2ONPs–C can be aggregated to form groups of cubes or to produce a larger cube, as reported before [8]. Figure 3C shows the SEM of Cu2ONPs–C@G where graphite peels are apparently studded with brighter cubes of Cu2ONPs–C, which are distributed everywhere in the examined area of graphite grains. A few agglomerates in specific locations on the surface of the grains are clearly seen. This is a normal phenomenon, since the graphite grains do not have a smooth surface texture or perfect shape. Additionally, this demonstrates that Cu2ONPs–C is in intimate contact with the graphite surface. Cu2ONPs–C showed a diameter of more than 200 nm with about 367 nm as the average diameter (Figure 3D).
Figure 4 shows the representative TEM image for Cu2ONPs–C@G. As can be seen in Figure 4A, two overlapped microcubes (dark black particles; the diameter of each cube is more than 400 nm) with rough surfaces constructed from nanoparticles (light small black particles). Taking into account the resulting SEM analysis (Figure 3B), and since we used an ordinary mixing method (without using special tools or chemicals), we can assume that there is no significant effect on the morphology or chemical composition of the produced monodisperse cuprous oxide microcubes (Cu2ONPs–C). From the clear surface topography of the right TEM image in Figure 4A, we can conclude that the surface nanoparticles are Cu2ONPs, which self-assembled in an ordered way to build Cu2O microcubes (Cu2ONPs–C). Based on measuring the longest diameter for Cu2ONPs at the cube surfaces, the diameter range was found to be mainly distributed from 4 to 20 nm with an average diameter of about 9 nm (Figure 4B). Due to the high magnification and diameter of the cubes, at the downside of the left TEM image (Figure 4A), we can clearly see part of the graphite layers adherent with the two overlapped cubes.
Since there are different articles reporting the electroanalytical applications of copper nanoparticles, we tried to prove the existence of Cu2ONPs localized on graphite grain surfaces using CV. In blank phosphate buffer (pH ≈ 8), a typical cyclic voltammogram was recorded using CPE (dashed line) or Cu2ONPs–C@G/PE (solid line) (Figure 5). CPE showed no peaks in the potential range from −0.6 to +1.0 V. At the same conditions, Cu2ONPs–C@G/PE showed a cyclic voltammogram with one well-defined oxidation peak at +0.120 V, which could refer to the oxidation of Cu+ to Cu2+ [47,48]. This is in accordance with XRD measurements which prove the existence of only pure crystalline Cu2ONPs and the absence of Cu and CuO nanoparticles. In the reverse direction, a broad and very weak peak was recorded starting from +0.392 V to −0.114 V, which could refer to the reduction in Cu2+ to Cu+. The appearance of such broad peak can be explained as Cu2+ was not fully reduced to Cu+ [49,50]. The 2nd cathodic peak, which was recorded at Ep = −0.275 V, was very distinctive with a larger peak current. This result can be explained as this peak expresses the existence of dual reduction processes: the remaining amount of Cu2+ and the whole amount of Cu+ are reduced to Cu0 [49,50]. Furthermore, we can assume that the 2nd reduction process (Cu+ to Cu0) is the main contributor in the recorded current for this peak thanks to the high concentration of Cu2ONPs, which build the cubes (Cu2ONPs–C), distributed widely on graphite grain surfaces, which in turn were used to prepare the proposed Cu2ONPs–C@G/PE.

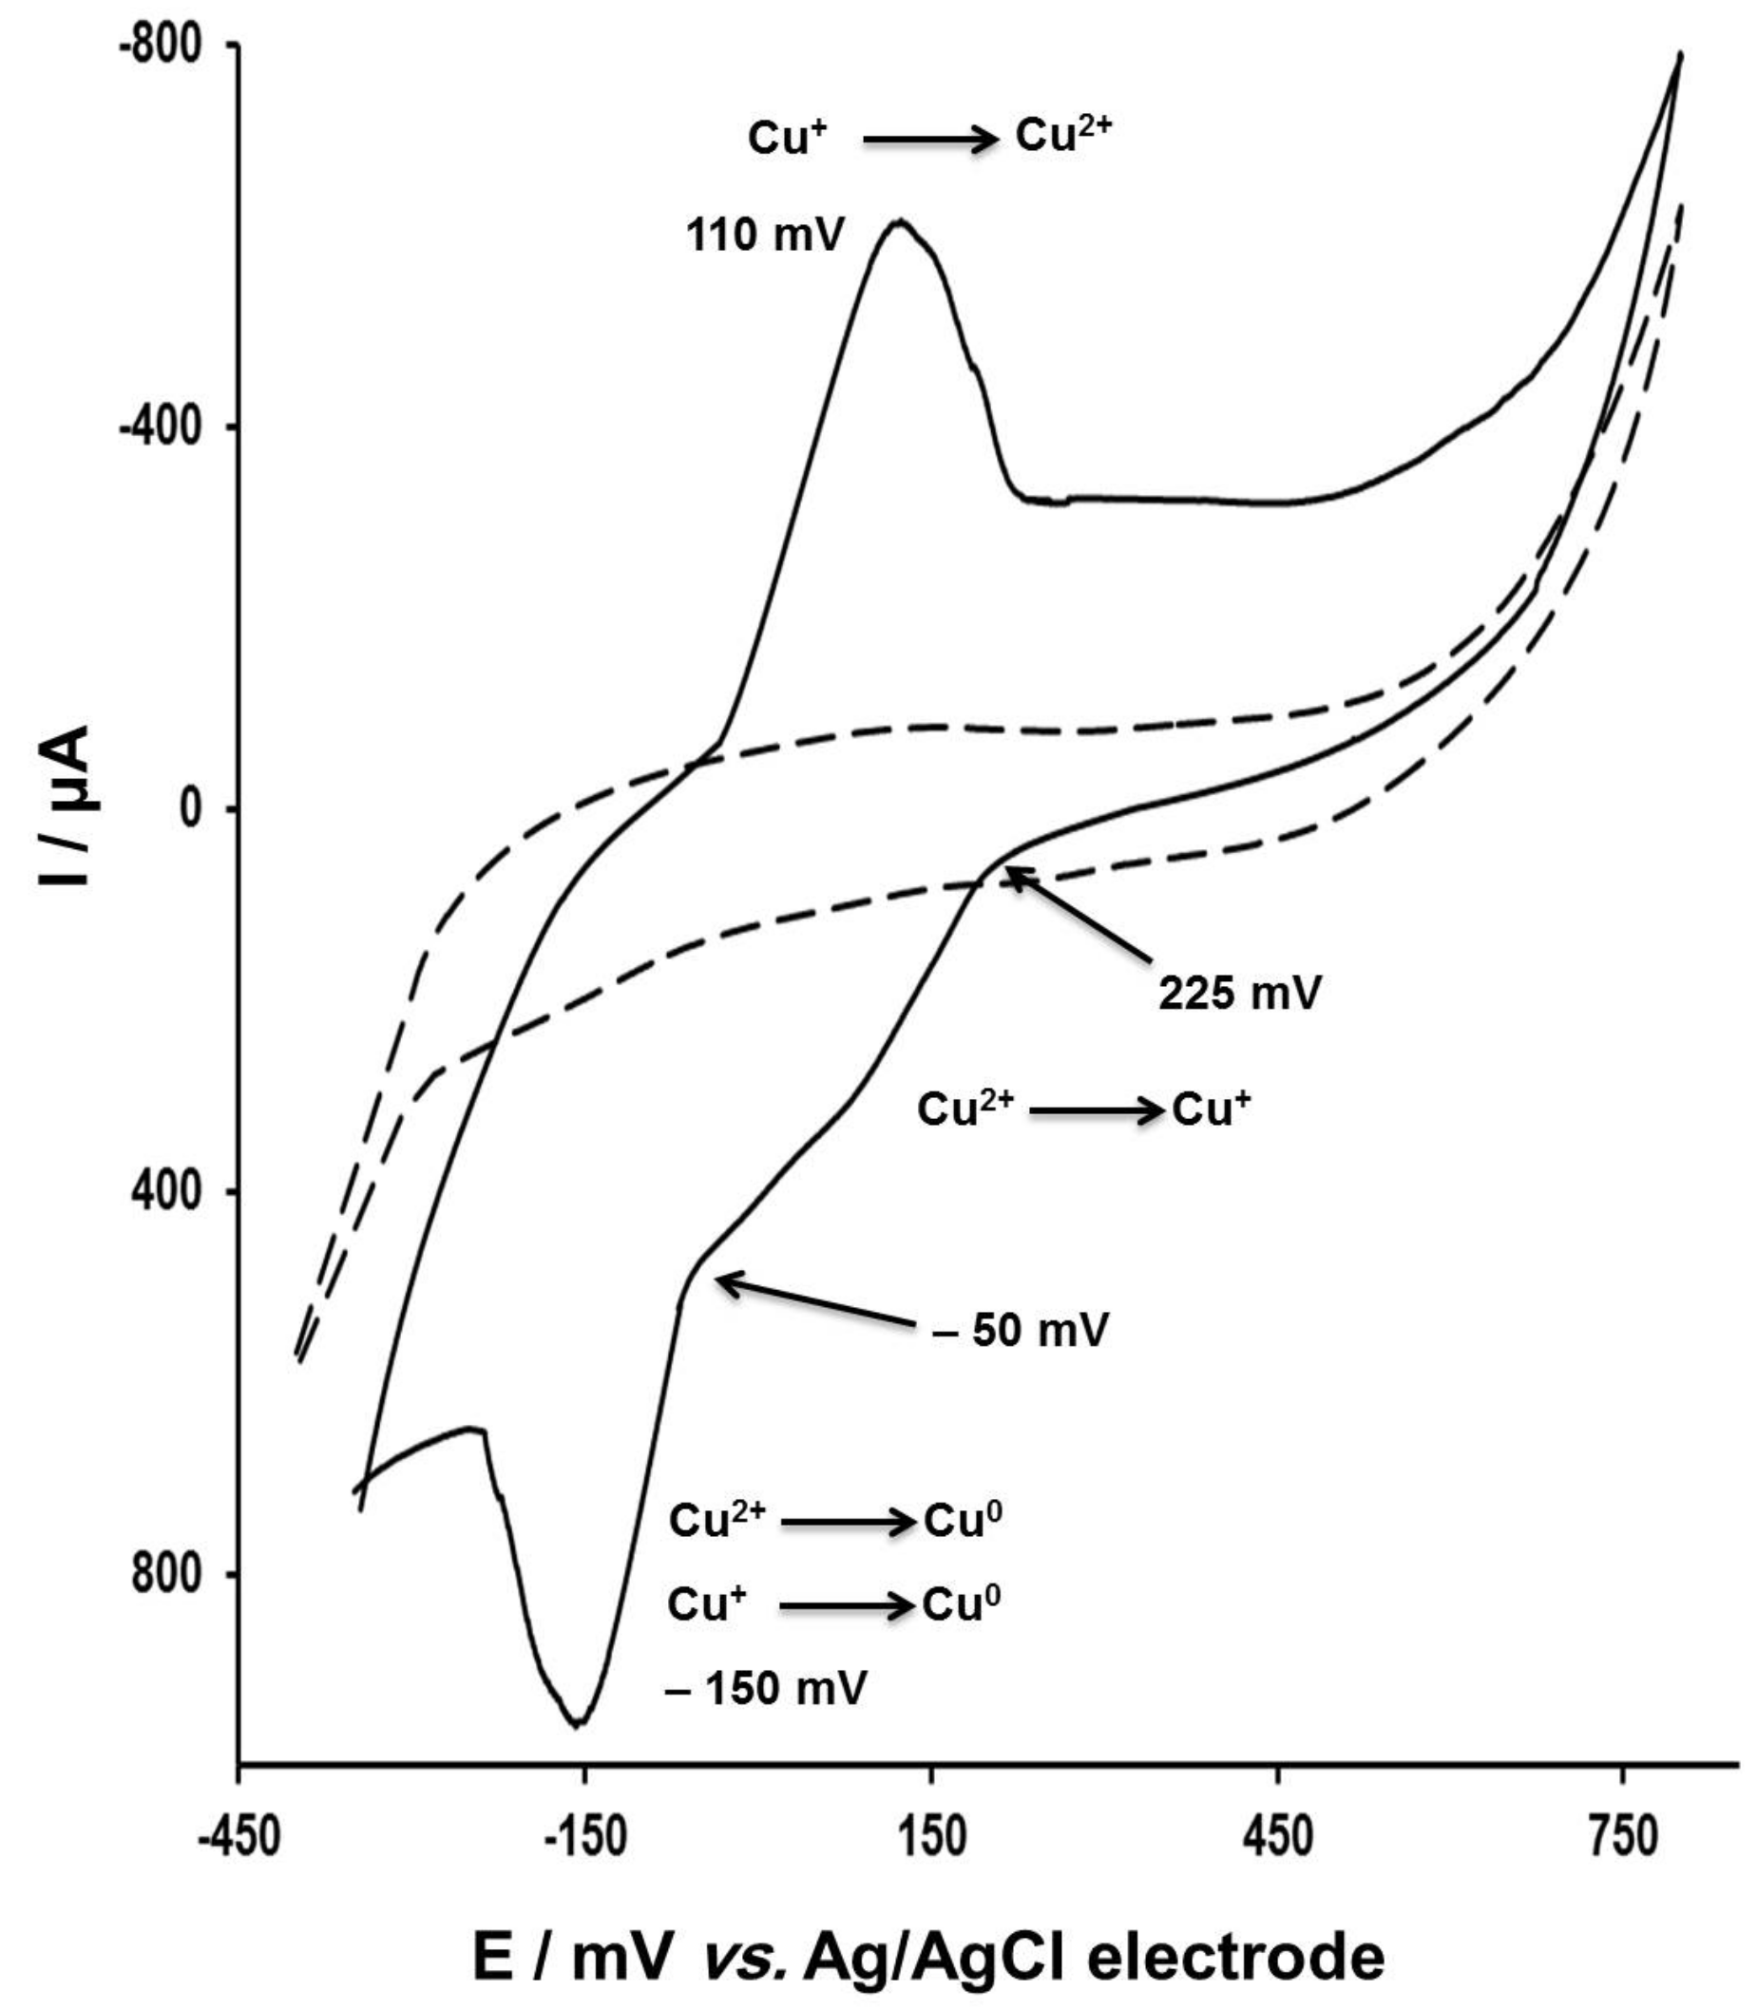
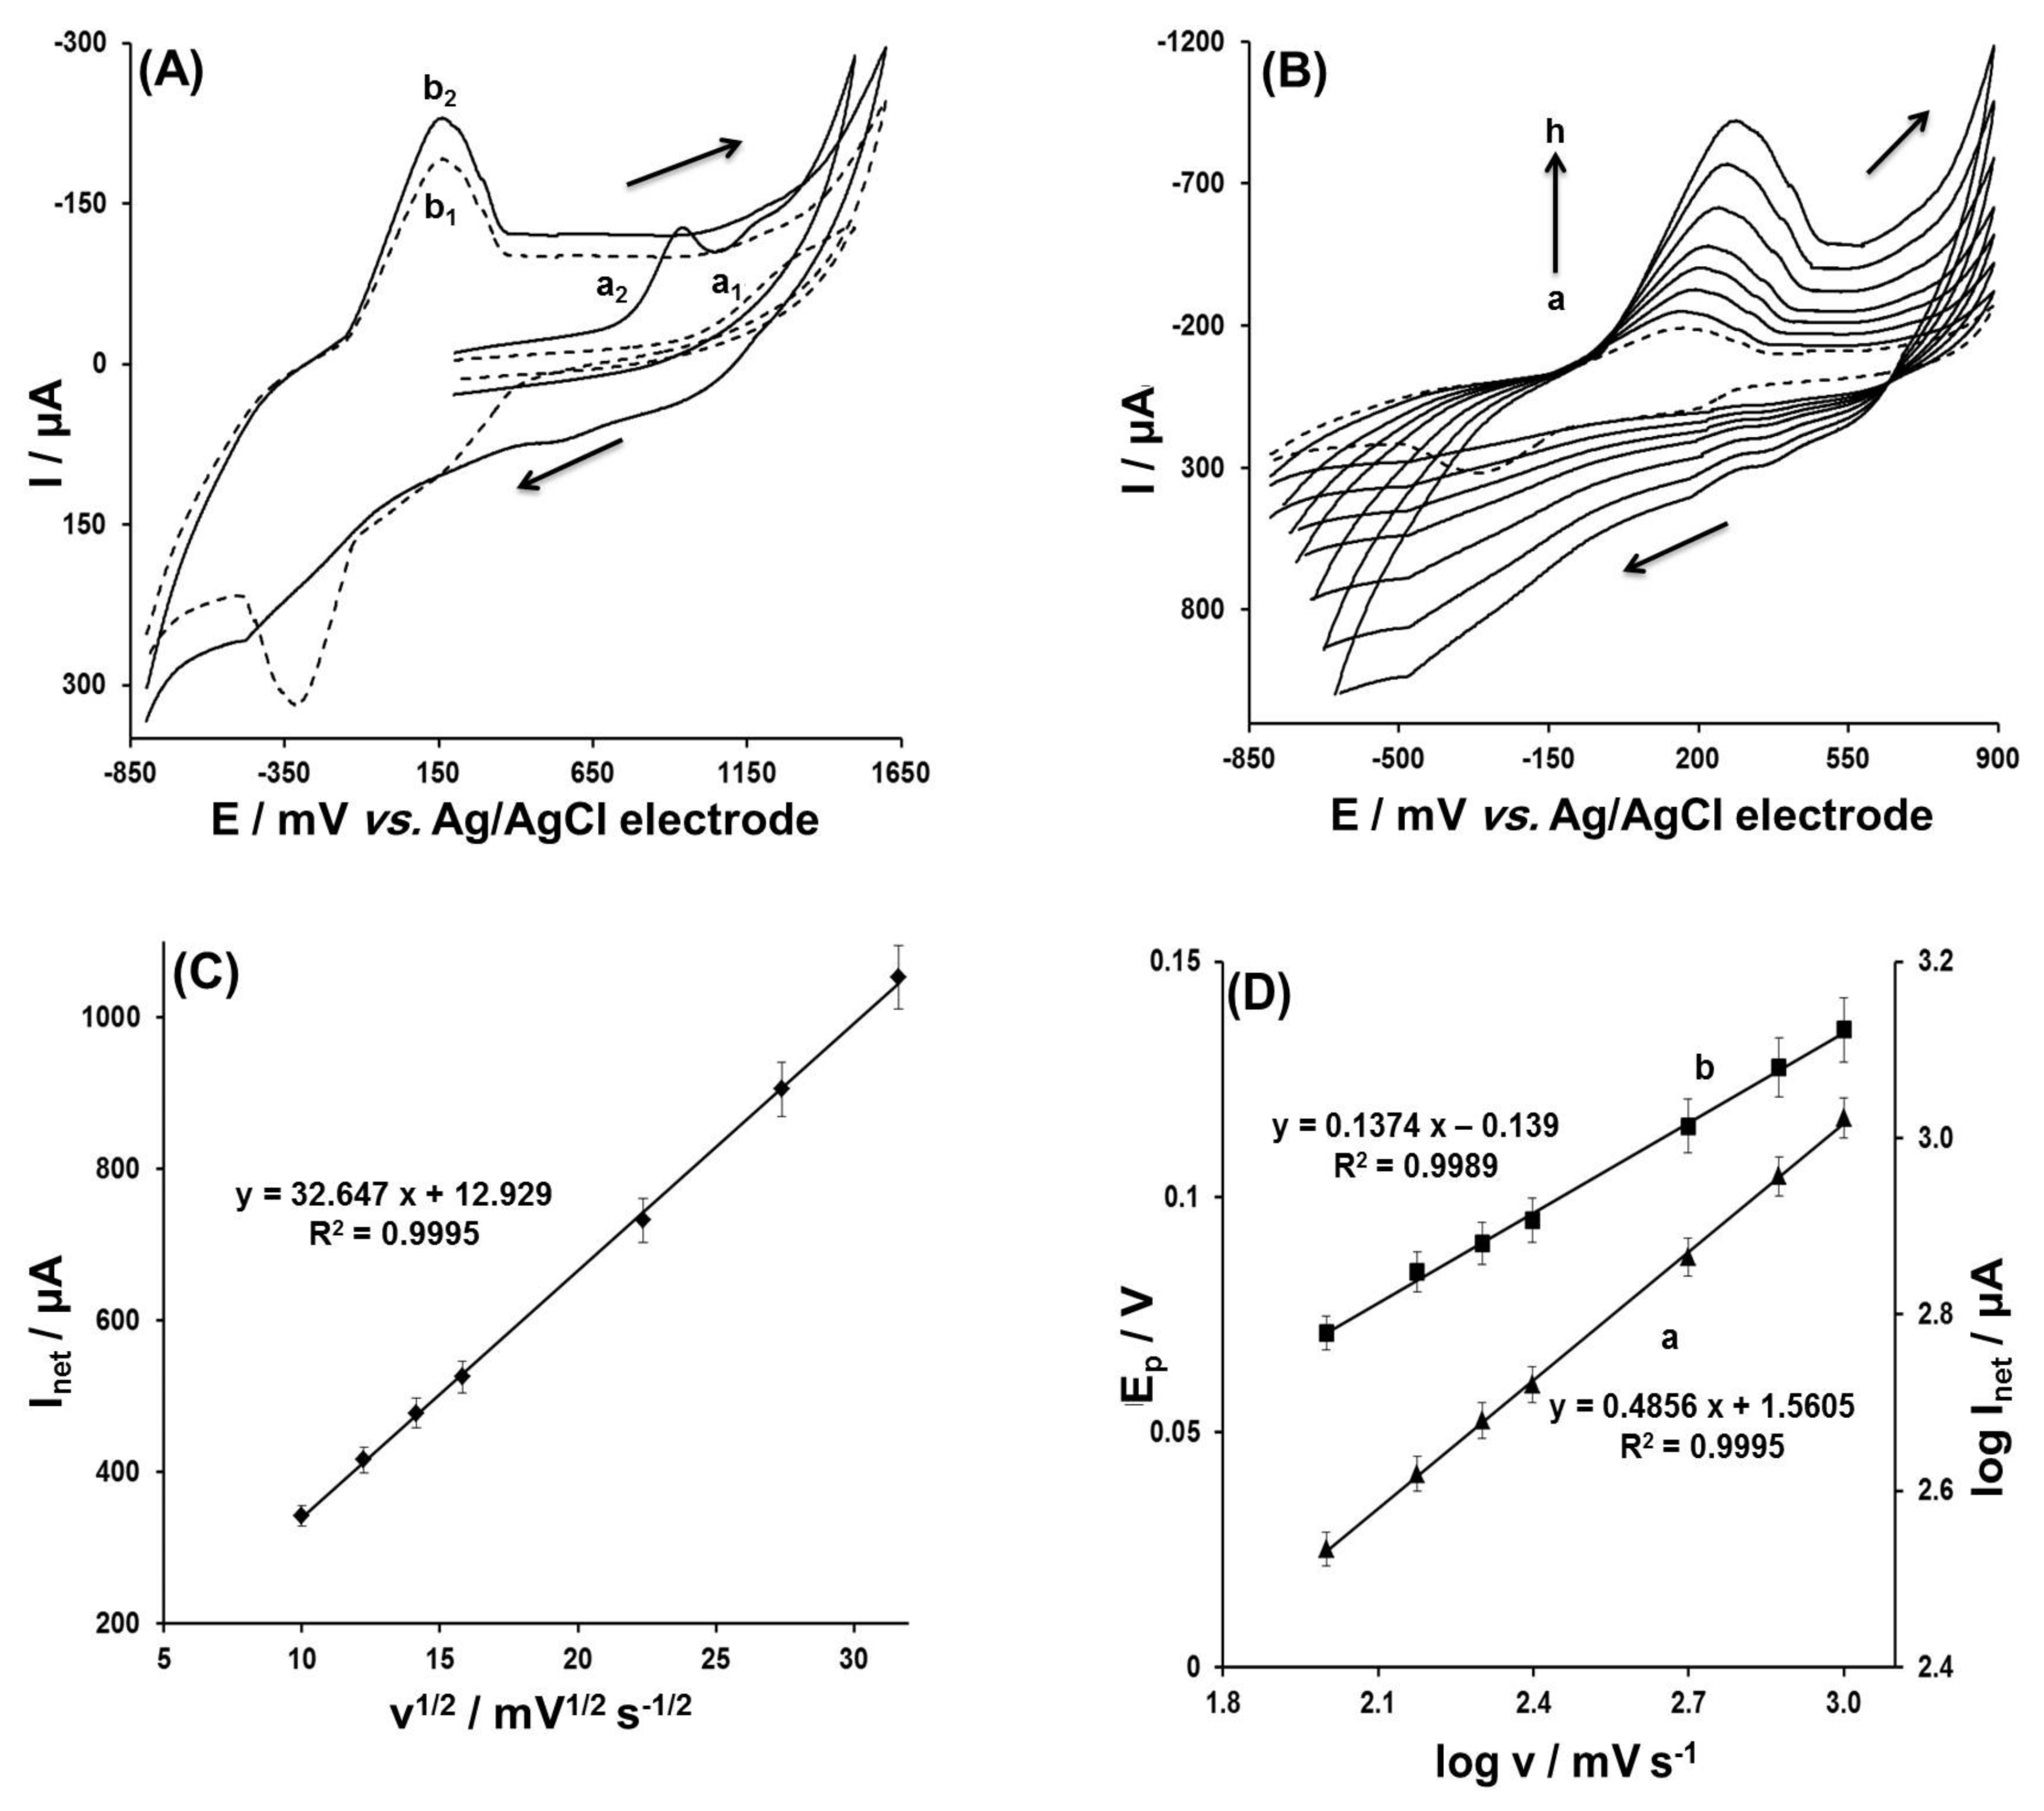
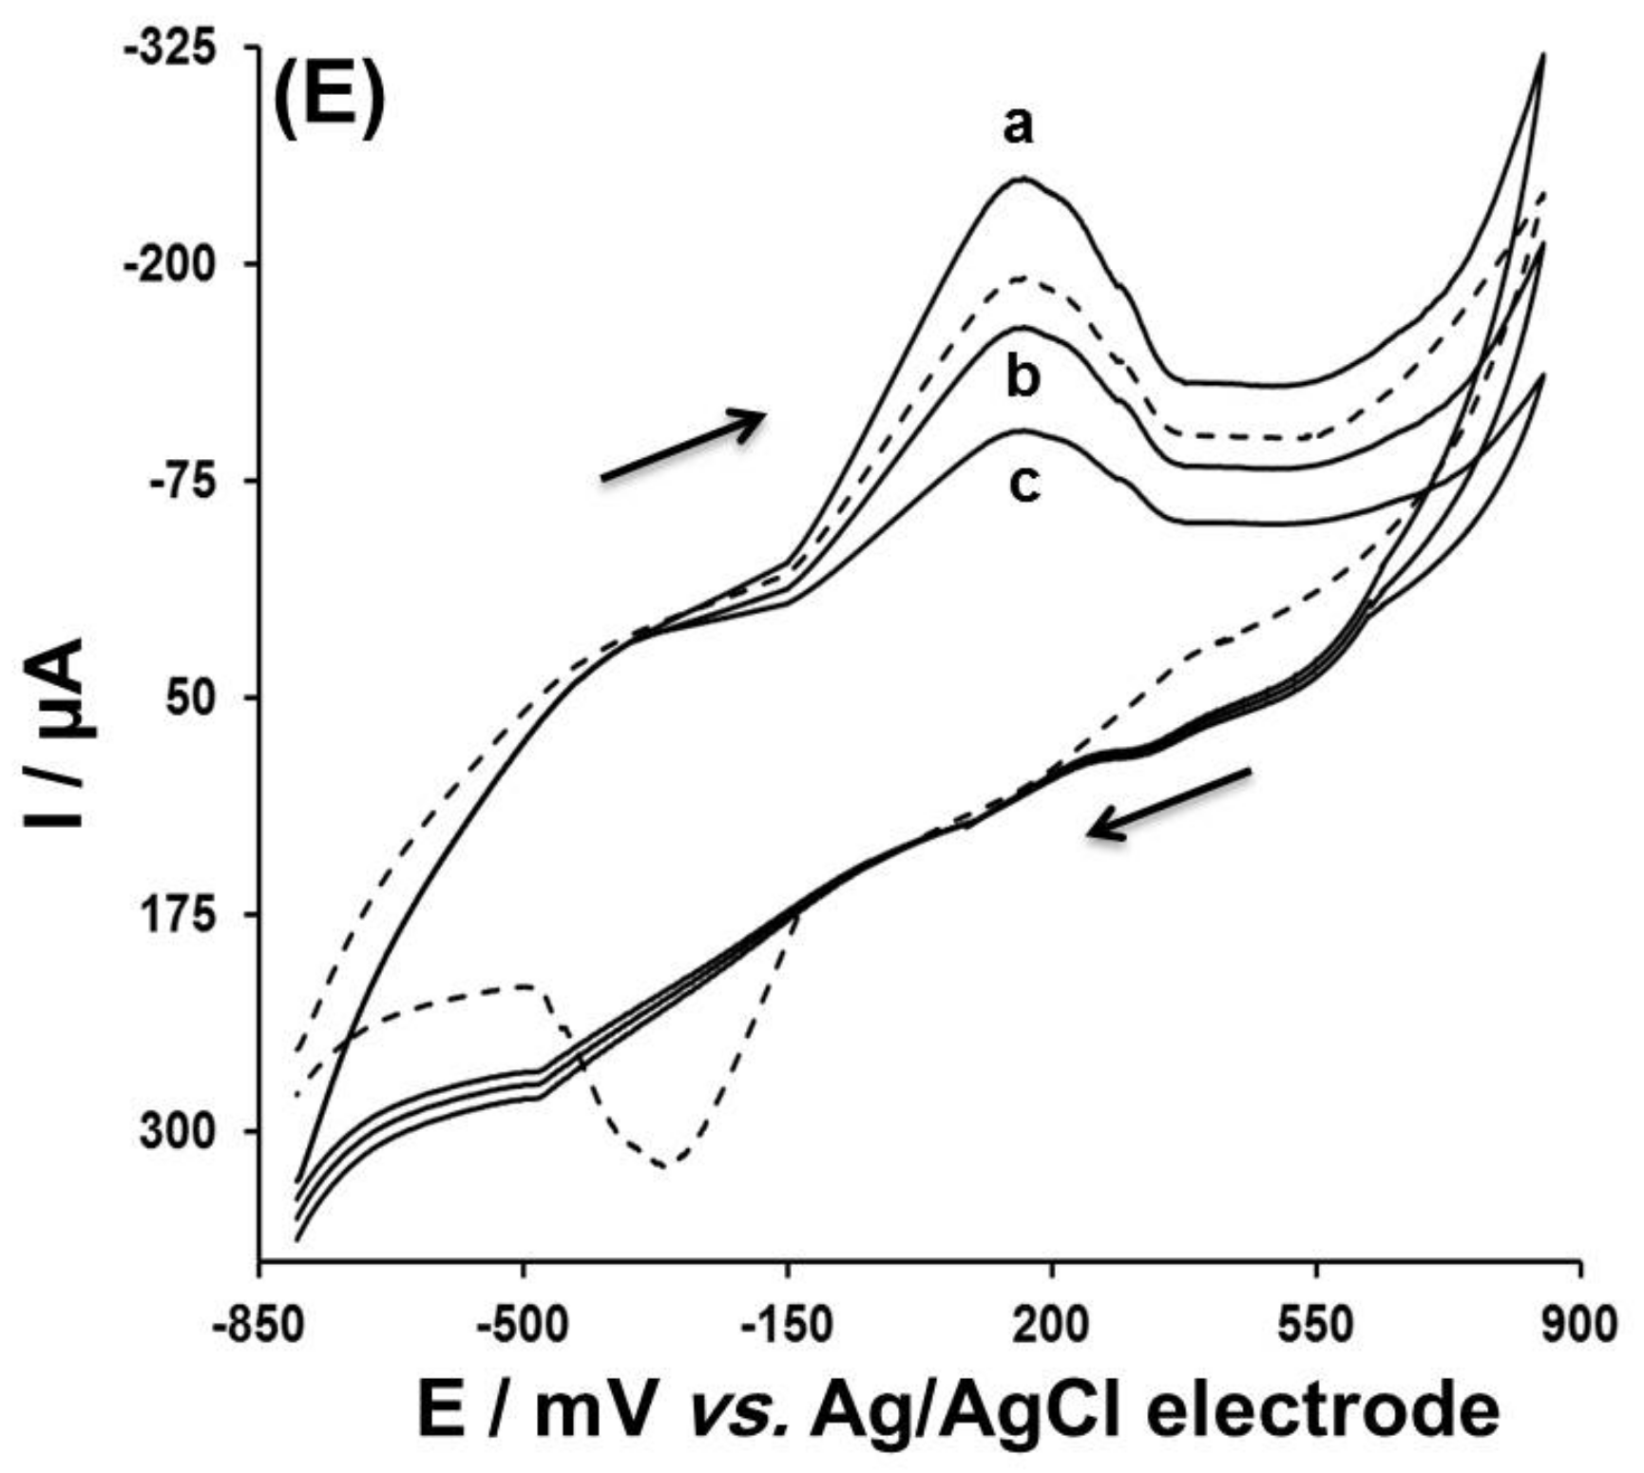
3.2. Electrochemical Behavior of MEB on the Cu2ONPs–C@G/PE

The electrochemical behavior of MEB was investigated at Cu2ONPs–C@G/PE using CV. For a comparison, Figure 6A shows the recorded cyclic voltammograms in the absence and presence of MEB in phosphate buffer solutions (pH ≈ 8) containing 0.1 M KCl using CPE and Cu2ONPs–C@G/PE as working electrodes. Using CPE, blank solutions did not show any peaks in the oxidation and reduction direction, as shown in cycle a1. After the addition of 2 × 10⁻⁵ M MEB, only one clear irreversible anodic peak at Ep = +0.800 V was recorded, which can be attributed to the oxidation of the amino group (cycle a2). In the case of Cu2ONPs–C@G/PE, the recorded cyclic voltammogram in blank solution, which is shown in cycle b1, was previously explained in Figure 5. After the addition of 2 × 10⁻⁵ M MEB (cycle b2), the Cu+ oxidation peak was increased, while no other peaks were observed in the same direction, which can be explained as a formation of an electroactive complex between MEB and the produced Cu2+. Additionally, the two recorded reduction peaks shown in cycle b1 completely disappeared (cycle b2). This can be explained as all the produced Cu2+ was consumed in the formed MEB–Cu complex, which has an irreversible electrochemical behavior. The net current of the added MEB, which is proportional to MEB concentration, can be calculated by Equation (2) as follows:
Inet = ItIi
where Inet is the calculated current, which is related to the added concentration of MEB; It is the total recorded current of the formed MEB–Cu complex; and Ii is the initial current, which corresponds to oxidation of Cu+ to Cu2+ in the absence of MEB.
The proposed MEB–Cu complex structure is elucidated in Scheme 2. Due to Cu+ oxidation under the electrochemical conditions, it converts to the preferred Cu2+, which may coordinate with MEB in the solution in two possible pathways: the 1st pathway is through the formation of a five-membered ring with the two donor methoxy groups at the edge of MEB structure (complex I), while the 2nd pathway is through the formation a seven-membered ring with the two potential donor atoms (N and O) in the middle of the MEB structure (complex II). Considering the highest stability of the five-membered ring geometrical shape and the steric hindrance at the nitrogen atom, we can confirm that complex I produced by the 1st pathway is the sole product of the suggested reaction.
So, we can assume that our suggested procedure can be applied for the indirect quantification of MEB. Well-dispersed Cu2ONPs–C over graphite grain surfaces was beneficial for the electrocatalytic reaction that may occur at the electrode surface [18]. The markable enhancement of Cu+ oxidation current indicates the electrocatalytic activity of the Cu2ONPs–C@G, which can be attributed to synergistic electrochemical activity between Cu2ONPs–C and graphite grain surfaces, which in turn can be illustrated as the existence of the Cu+/Cu2+ redox couple, making the electrode surface highly sensitive.
A thorough study of the electrochemical behavior of MEB was accomplished by examining the effect of scan rate on the recorded oxidation current of the formed MEB–Cu complex. Cyclic voltammograms of the formed MEB–Cu complex at different scan rate values are shown in Figure 6B (b–h); we can see that with increasing scan rate values, the recorded peak current increased gradually. A linear relationship between peak current (Inet) and square root of scan rate (ν1/2) was obtained, which indicates that the electrochemical oxidation of the formed MEB–Cu complex is a diffusion-controlled process (Figure 6C). This relationship can be expressed by Equation (3) as follows:
I n e t ( μ A ) = 32.647   ν 1 / 2   ( m V 1 / 2 / s 1 / 2 ) + 12.929   ( R 2 = 0.9995 )
Moreover, Figure 6D (a) shows a linear relationship between the logarithm of peak current (log Inet) and logarithm of scan rate (log ν), which can be expressed by Equation (4) as follows:
l o g I n e t ( μ A ) = 0.4856   l o g ν   ( m V / s ) + 1.5605   ( R 2 = 0.9995 )
The slope of 0.4856 confirms that the occurred electron transfer was a diffusion-controlled process, since it is very close to the same theoretically expected value of 0.5 for a pure diffusion-controlled process [51]. In the same voltammogram, we can see that a positive shifting occurred in the peak potential with increasing scan rate values, which confirms the irreversibility nature of the recorded oxidation process [51]. Figure 6D (b) shows a linear relationship between peak potential (Ep) and scan rate logarithm (log ν), which can be expressed by Equation (5) as follows:
E p ( V ) = 0.1374   l o g ν   ( m V / s ) 0.1390   ( R 2 = 0.9989 )
The resulting relationship proves that the oxidation of the MEB–Cu complex at Cu2ONPs–C@G/PE was mainly a diffusion–adsorption-controlled process. This behavior was verified by recording successive cyclic voltametric sweeps in the presence of MEB at Cu2ONPs–C@G/PE (Figure 6E). The dashed cycle represents the recorded cyclic voltammogram by Cu2ONPs–C@G/PE in blank solution. Cycle a, as explained before, showed that the Cu+ oxidation peak increased after MEB addition, but with the repeating cyclic sweeps, the recording peak current decreased gradually (cycles b and c). This could be due to the fact that the formed MEB–Cu complex is adsorbed on the Cu2ONPs–C@G/PE surface, causing blocking on its surface and hence a reduction in the exposed effective sites. So, as we indicated before, the Cu2ONPs–C@G/PE surface was renewed after each measurement.

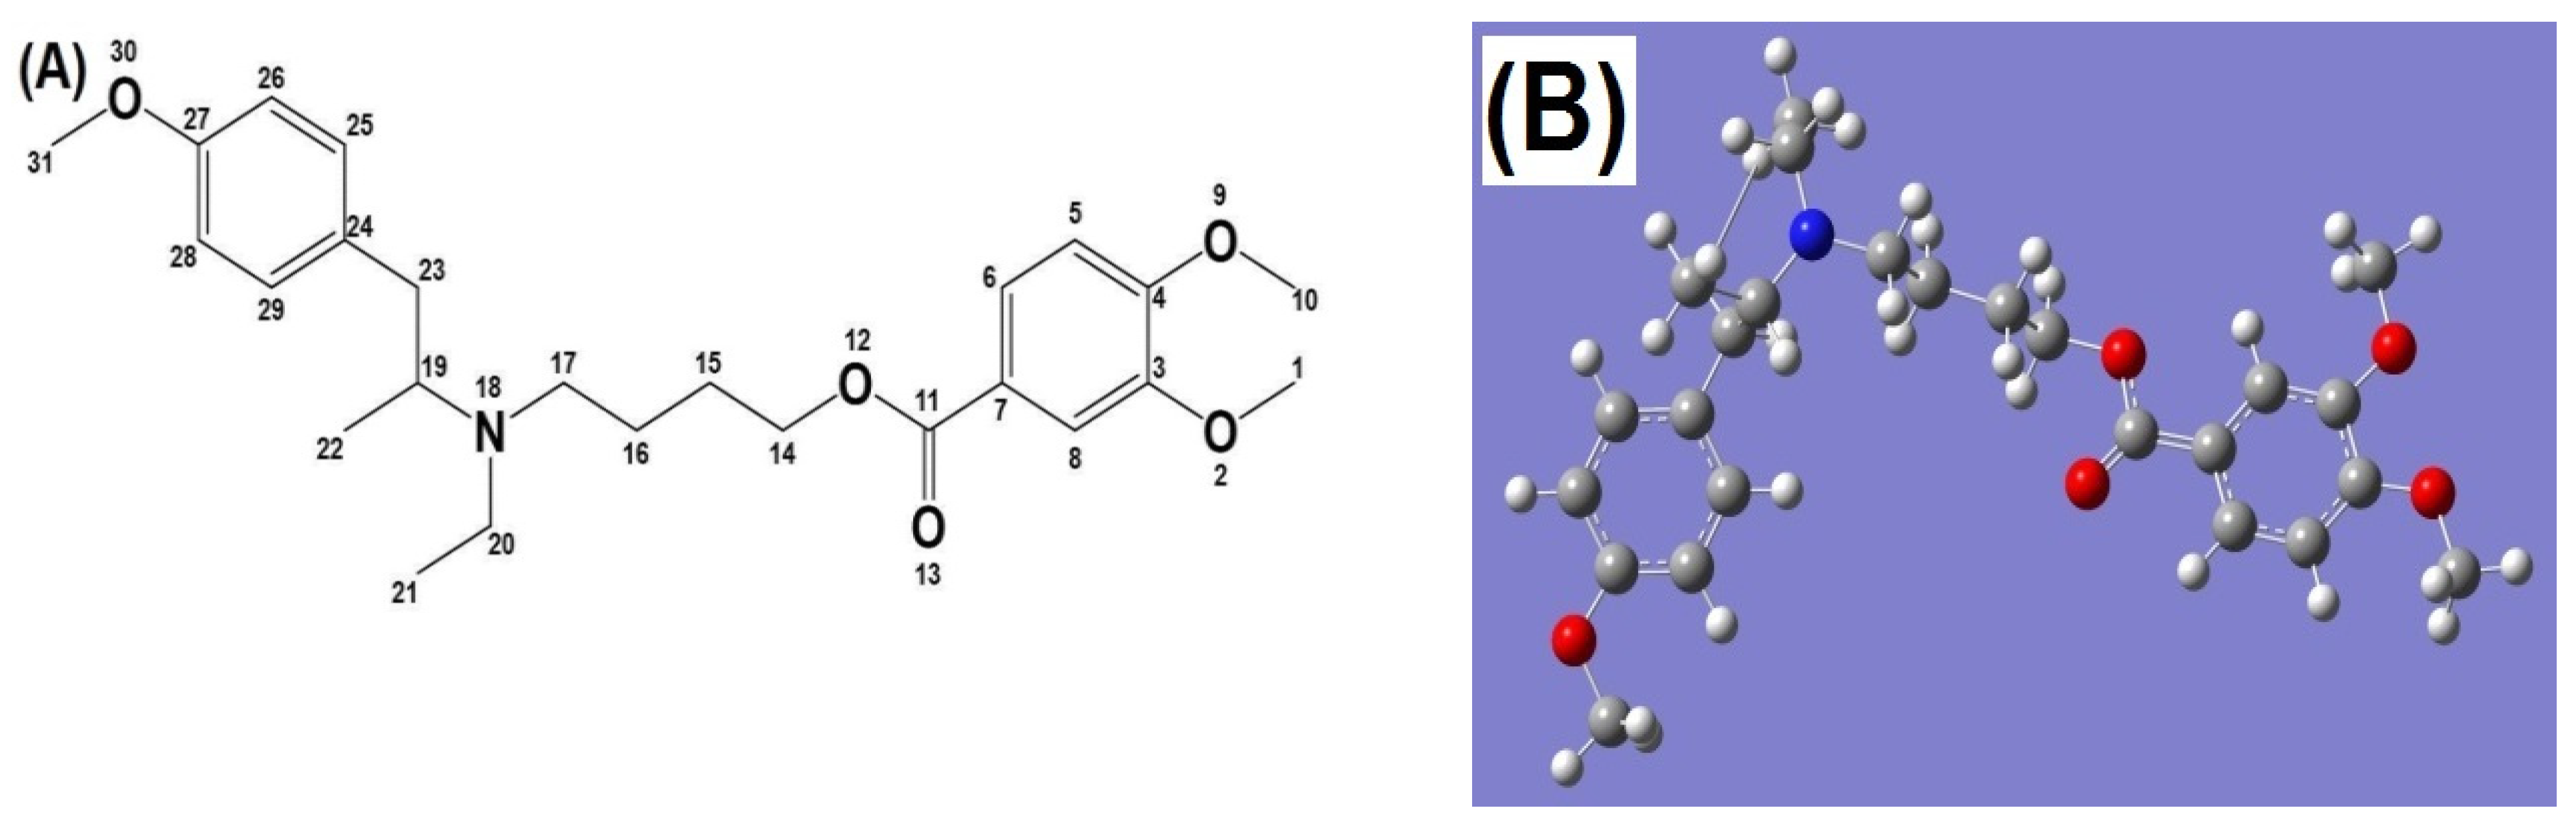
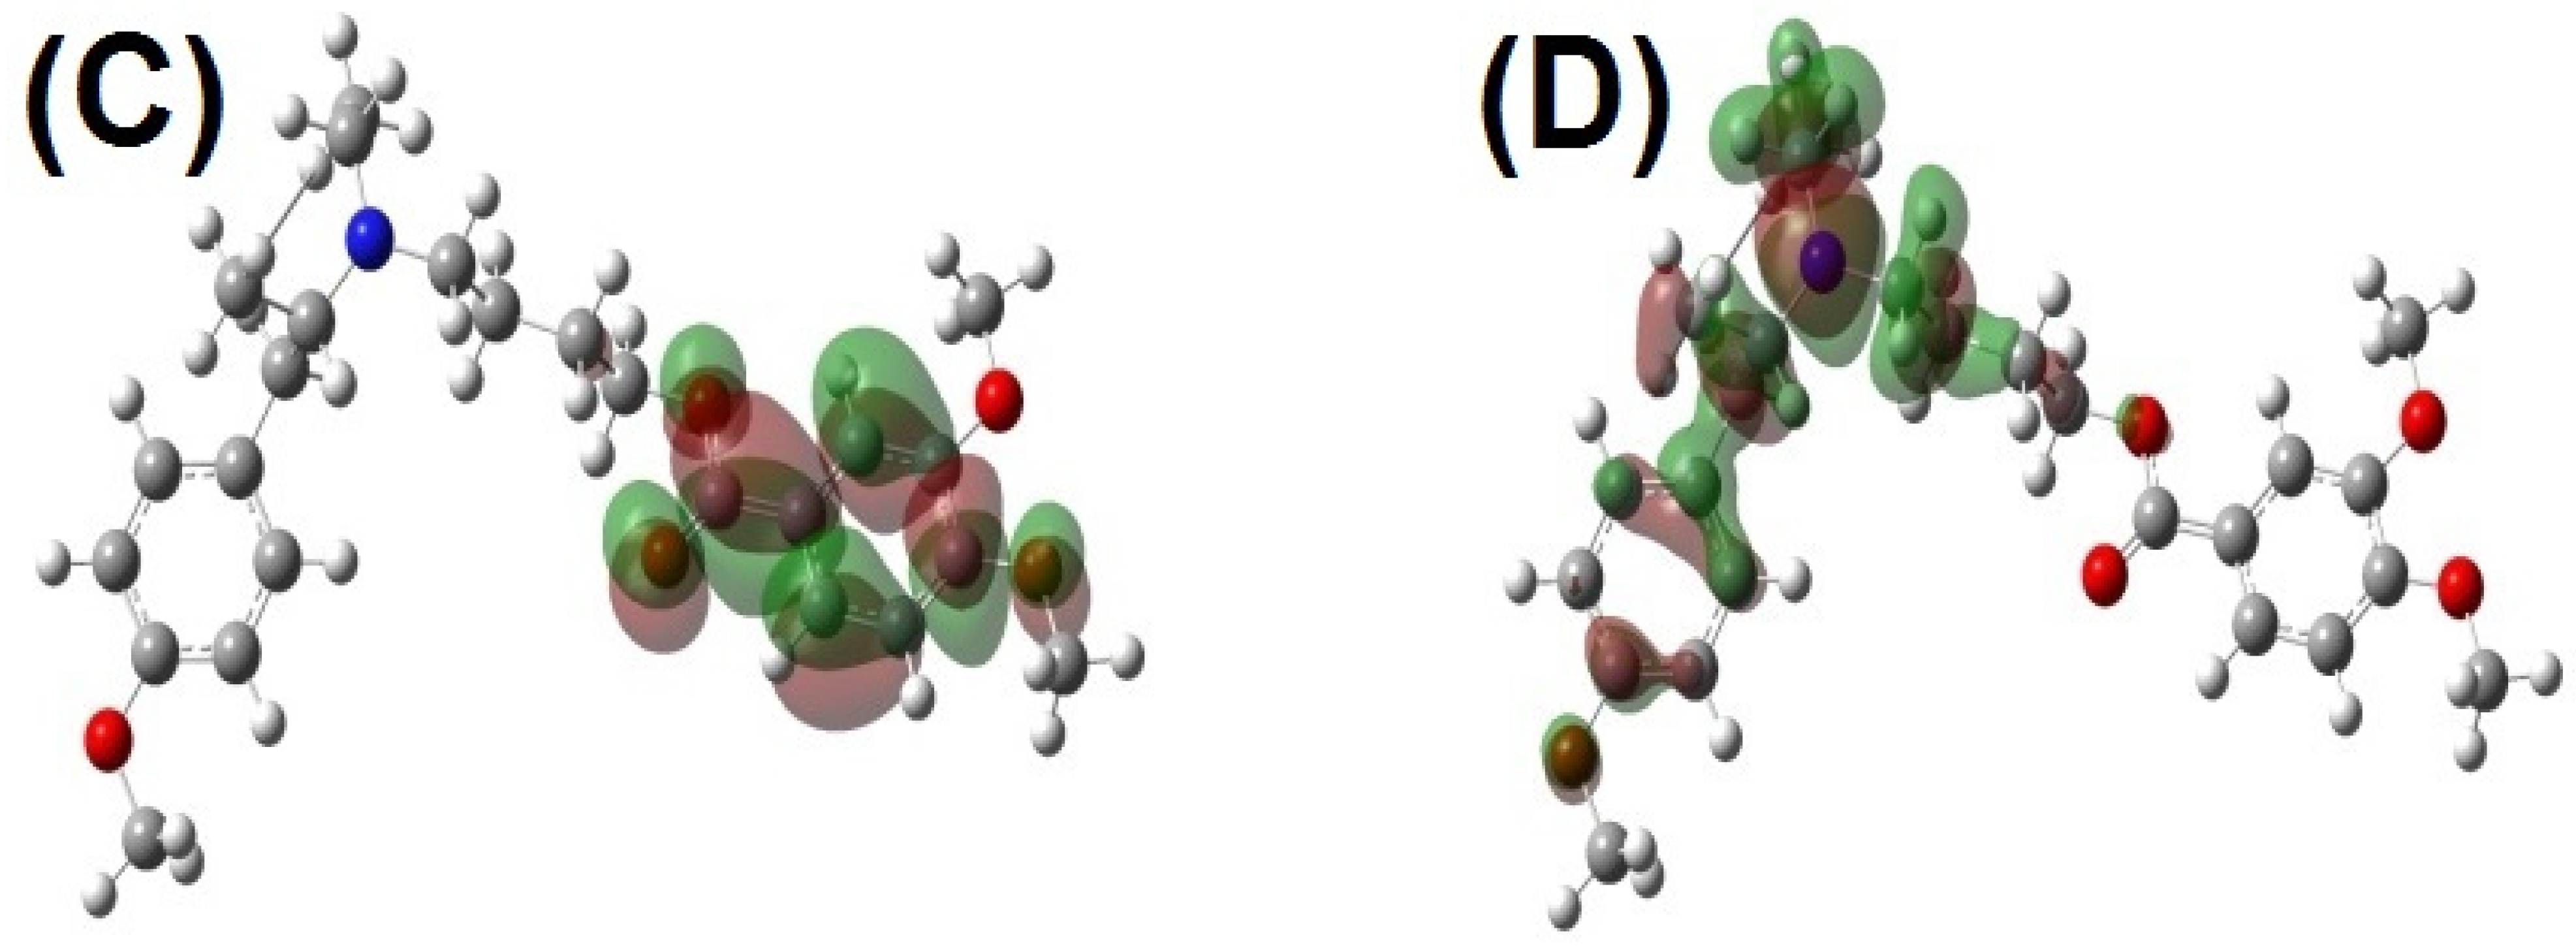
3.3. Computational Analysis Data

To confirm our suggestion that MEB can form the expected complex with produced Cu2+, quantum chemical calculations were performed with DFT using the B3LYP function. The resulting quantum chemical parameters are tabulated in Table 1. Additionally, the optimized geometric structures and Mulliken charges of MEB were studied and are presented in Figure 7A,B.
The ability of MEB molecules to connect with metal orbital may be attributed to their frontier molecular orbital (FMO), i.e., HOMO and LUMO [52]. HOMO is related to the capability of a molecule to donate electrons, whereas LUMO indicates its capability to accept electrons. From Figure 7C,D, it can be noted that the electronic density in HOMO and LUMO on the entire area of each molecule is quite uniform, which is due to its π–electron cloud density. Analysis of HOMO and LUMO is shown in Figure 7C,D, the preferential area of nucleophilic attack in the MEB molecule is the two methoxy groups (O–CH3). Theoretically, the methyl group is a donating electron group that increases the electron density on the oxygen atom, which in turn is considered as a reason to enhance MEB to form a complex with Cu2+.
The low value of the energy gap (ΔE = ELUMO − EHOMO) indicates the good activity of the studied ligand to react with other species, because the required energy to remove an electron from the last occupied orbital is low [53]. Additionally, the literature reveals that a larger value of the ΔE signifies low reactivity to a chemical species, because the ΔE is related to the softness or hardness of a molecule. A soft molecule is more reactive than a hard molecule because a hard molecule has a larger energy gap [54,55]. According to this, MEB shows a high reactivity to react with Cu, which is evidenced from the results tabulated in Table 1, where ΔE, absolute softness and hardness of MEB were calculated to be 0.1203, 16.6251 and 0.0602 ev, respectively.
Dipole moment is the measure of bond polarity, and it is related to the distribution of electrons in a molecule [56]. As the dipole moment has a high value, the ligand has a high efficiency to react with other species, as predicted in MEB to react with Cu. Furthermore, the total energy (TE) of a molecule includes all forms of potential and kinetic energy, and it is used to determine the molecule’s reactivity and stability. The high stability of a molecule and hence its low ability of electron donation can be confirmed by the highest TE values. From the elaborated results in Table 1, it is evident that MEB has a low TE value (–1396.9 a.u.), which indicates the high tendency of MEB to react with Cu by donating electrons.
Mulliken atomic charge represents the charge of each atom in MEB, and the obtained Mulliken atomic charges are shown in Figure S1A (see Supplementary Material). The calculated atomic charge values of MEB show that the oxygen atom of the methoxy groups (O–CH3) has a higher charge value than the N atom present in MEB. This result indicates that MEB has the ability to form bonds with Cu through O–CH3 groups, which is emphasized by Molecular Electrostatic Potential (MEP).
Molecular Electrostatic Potential (MEP) was calculated for the suggested complex structures (Figure S1B; see Supplementary data file). It was found that the negative charge density localized on oxygen atoms (atoms No. 2 and 9; 1st pathway) is higher than the negative charge density localized on the nitrogen atom (atom No. 18; 2nd pathway). High negative charge density was shown as a red color area around oxygen atoms No. 2 and 9, which attached to two methyl groups. This result indicates that a higher ability of MEB to form a metal complex through these two oxygen atoms than only one nitrogen atom exists in MEB. This interpretation confirms the suggested MEB–Cu complex structure expressed as complex (I) in Scheme 2.
Similar quantum calculations were performed for the suggested structure of the MEB–Cu complex to ascertain its stability. The obtained results are tabulated in Table S1 (see Supplementary data file), and the optimized geometric structures and Mulliken charges of the MEB-Cu complex were studied and are presented in Figure S2 (see Supplementary data file). The illustrated results confirm the high stability of the proposed MEB–Cu complex (I) (Scheme 2), which is in accordance with the fact that the stability of the 5-membered ring (Complex (I)) is higher than the 7-membered ring (Complex (II)).

3.4. Optimization of Instrumental Conditions

In the present work, SWAdASV was selected for MEB voltametric investigation because of its high sensitivity [51,57]. The variation of peak current and shape with instrumental parameters, such as accumulation potential, frequency and pulse height, was studied using 2 × 10⁻⁵ M MEB in Britton–Robinson buffer (pH ≈ 8.0) and using Cu2ONPs–C@G/PE as the working electrode (Figure S3A (see Supplementary data file)). In the case of accumulation potential, there was no significant change in peak potential with changing accumulation potential from −1.0 to −0.2 V. It was observed that peak current increased from −1.0 to −0.6 V and then decreased in the range from −0.5 to −0.2 V. The peak current reached its maximum value at accumulation potential −0.6 V, which was used in the subsequent examinations.
The importance of studying frequency and pulse height arises in the current article because we decided to use SWAdASV as the selected technique for the MEB quantification. It is well known that higher values of frequency and pulse height can increase SWAdASV sensitivity. Additionally, at their high values, both of them have a great effect on the generated capacitive current, which in turn causes distortion in the SWAdASV curves and lowers its sensitivity [57,58]. The effect of frequency on the peak current intensities of 2 × 10⁻⁵ M MEB was studied. The recorded peak current increased with increasing frequency from 10 to 80 Hz. At the highest frequency values, up to 120 Hz, the recorded peak current values became approximately leveled off. So, 100 Hz was selected as the best value for more investigations (Figure S3B (see Supplementary data file)). Additionally, the effect of pulse height on the same MEB concentration was investigated by varying the pulse height value from 0.01 to 0.30 V. Results illustrated in Figure S3C (see Supplementary data file) reveal that the peak current increased with increasing pulse height from 0.01 to 0.15 V, then became approximately stable with increasing pulse height values up to 0.30 V. So, a pulse height of 0.20 V was chosen for subsequent experiments.

3.5. Optimization of Experimental Parameters

Several experimental parameters, such as pH, buffer type, supporting electrolyte type and concentrations, may affect the peak current and its shape. So, the study of the effects of such parameters is very important.
Using Cu2ONPs–C@G/PE as the working electrode, the peak current of 2 × 10⁻⁵ M MEB was recorded by SWAdASV in Britton–Robinson buffer at different pH values. This study was carried out over the pH range of 2.25–11.5, as shown in Figure S4A (see Supplementary data file). There was no significant change that occurred in the peak potential of MEB with increasing the pH value. A small peak current was observed at pH ≈ 2.25, which increased gradually up to pH ≈ 8 and then decreased at higher values. Thus, pH ≈ 8 was selected in all consecutive measurements.
Different buffer types of pH ≈ 8 were investigated to select the most suitable buffer type for the SWAdASV quantification of MEB. This study was accomplished in sodium borate–HCl buffer, phosphate buffer, Britton–Robinson and sodium borate–boric acid buffer. Both peak shape and height were taken into account when choosing the buffer type. Figure S4B (see Supplementary data file) shows that the best buffer selected as a medium is phosphate buffer. The effect of phosphate buffer ionic strength on the recorded voltametric peak revealed that minimal background current, the best curve and the highest current were obtained in 0.1 M phosphate buffer.
Among three different supporting electrolytes (KCl, NaNO3 and NaClO4), the best response of 2 × 10⁻⁵ M MEB in phosphate buffer (pH ≈ 8) was obtained using 0.1 M KCl as the supporting electrolyte (Figure S4C (see Supplementary data file)). The effect of supporting electrolyte ionic strength was studied at the same conditions, considering minimal background current, best curve shape and the highest sensitivity. In 0.1 M phosphate buffer (pH ≈ 8), the peak current of 2 × 10⁻⁵ M MEB was recorded in the presence of different KCl concentrations. The obtained data show that the best choice, which gives the best shape and highest peak current, was 0.1 M KCl (Figure S4D, (see Supplementary data file)).

3.6. Effect of Accumulation Time and Reproducibility

Accumulation time significantly affects MEB oxidation peak current. This can be obvious through studying the time effect on 6.01 × 10⁻⁹ M and 6.01 × 10⁻¹⁰ M MEB at the Cu2ONPs–C@G/PE working electrode. It was found that with increasing accumulation time up to 240 s, the peak current increased greatly, which induced the existence of MEB–Cu complex adsorption on the Cu2ONPs–C@G/PE surface. Upon increasing time values up to 600 s, the recorded peak current increased slowly and approximately leveled off. However, 60 s was generally chosen as the accumulation time to build up the MEB calibration curve using Cu2ONPs–C@G/PE. Repeating three experiments on the studied MEB concentrations at 60 s accumulation time to check the reproducibility of the proposed procedure, the relative standard deviation was calculated to be 4%.

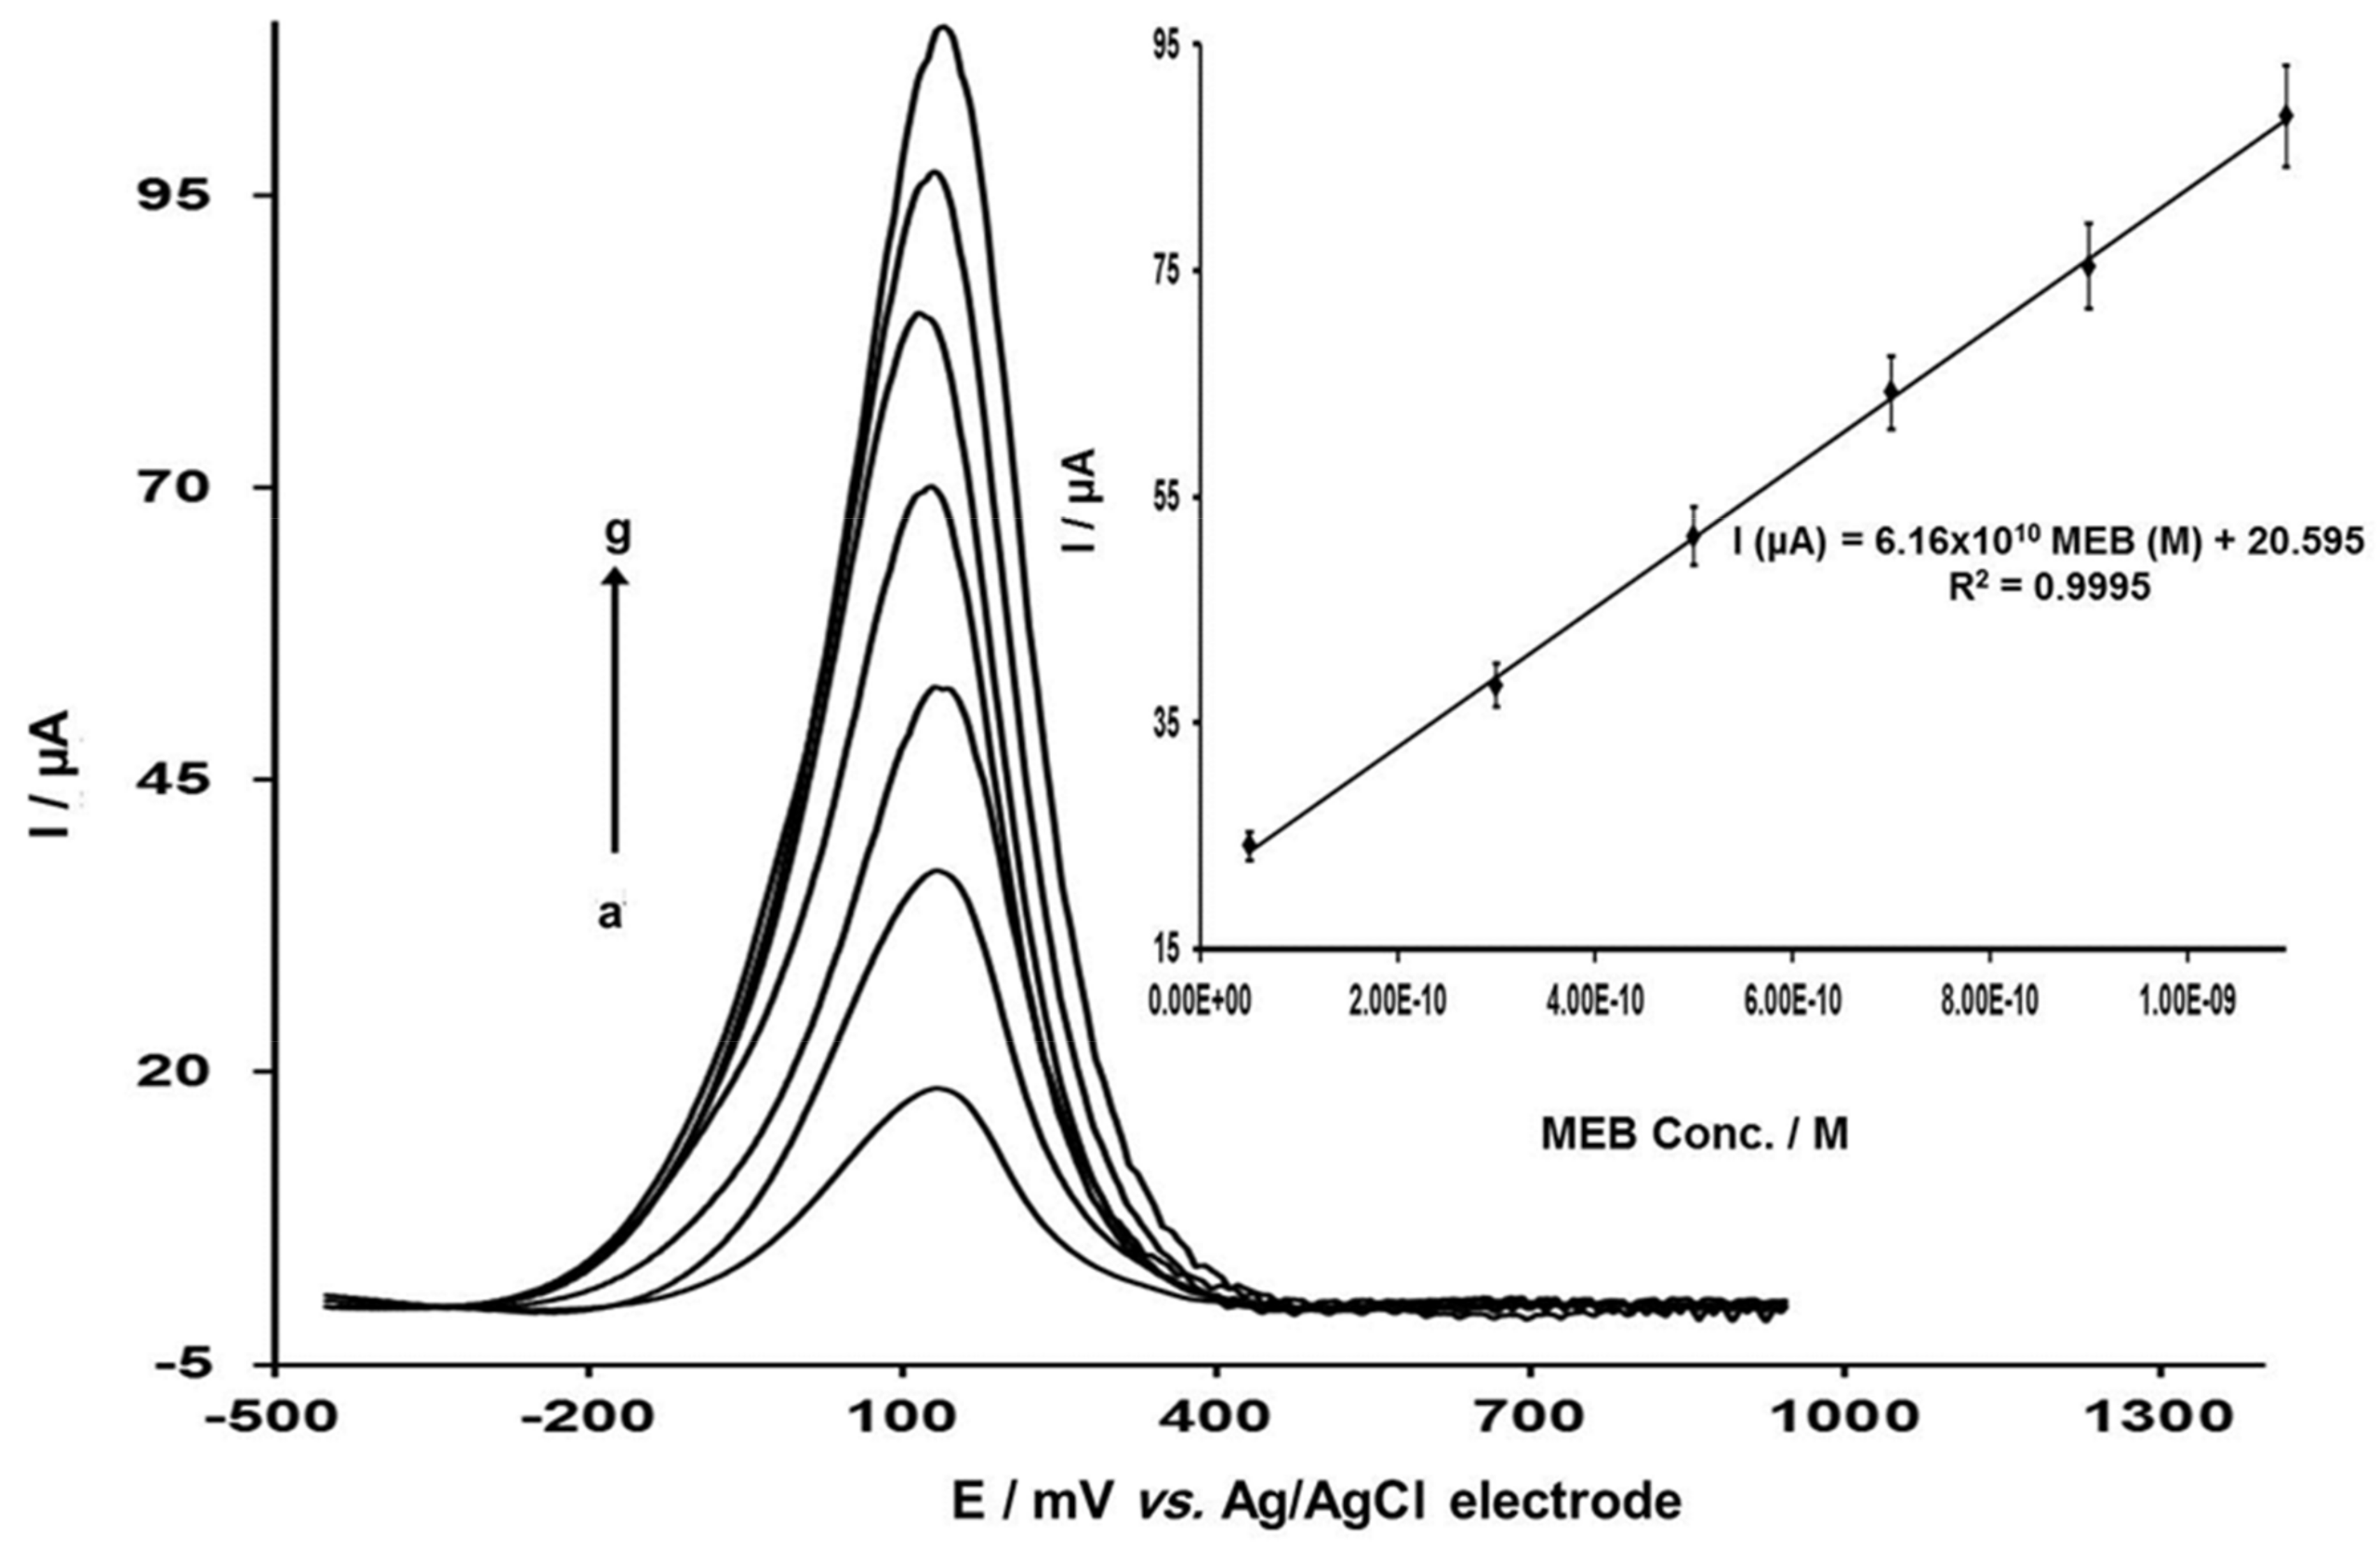
3.7. Analytical Characterization and Validation of the Proposed Method

In the current article, SWAdASV was selected for the quantification of MEB. The obtained SWAdASV for the successive additions of MEB and its corresponding calibration graph are shown in Figure 8. This voltammogram was conducted using Cu2ONPs–C@G/PE as the working electrode in 0.1 M phosphate buffer solutions (pH ≈ 8) containing 0.1 M KCl. As previously explained in the electrochemical behavior of MEB on the Cu2ONPs–C@G/PE, the current value corresponding to the added concentration of MEB (Inet) is equal to the difference between the current value resulting from Cu+ oxidation (Ii) and the current resulting from the oxidation of the formed MEB–Cu complex (It). The obtained results were applied to draw the calibration graph shown in Figure 8 (inset), which shows a linear dependency between the recorded current response and MEB concentration in the range of 5.00 × 10⁻¹¹ M–1.10 × 10⁻⁹ M and can be expressed by Equation (6) as follows:
I   ( μ A ) = 6.16 × 10 10   M E B   ( M ) + 20.595   ( R 2 = 0.9995 )
Relative standard deviation (% RSD) and other statistical parameters of the proposed method were calculated and are tabulated in Table 2. The low value of % RSD indicates the good precision and accuracy of the method. The lower limit of detection (LOD) and quantification (LOQ) were calculated using the following two equations: LOD = 3σ/b and LOQ = 10σ/b, where σ is the standard deviation of the intercept and b is the slope of the calibration curve [13,14,34,40,41,42]. The calculated values of LOQ and LOQ for ten repeated quantifications of MEB and related regression data of the elaborated calibration plot are presented in Table 2.
Validation of the proposed procedure for SWAdASV quantification of MEB was achieved through investigation of the repeatability of the peak current for three different MEB concentrations (1.00 × 10⁻⁹, 5.00 × 10⁻⁹ and 6.01 × 10⁻⁸ M). MEB repetitive quantification was recorded on the same day (an intraday) and after five days (an interday). A Cu2ONPs–C@G/PE cleaning step was performed for each measurement by wiping the electrode surface against white paper until smooth, and a shiny surface was obtained followed by washing the electrode body with twice distilled water. The standard addition method for five repetitive measurements was applied under the optimized instrumental and experimental conditions; the recovery and % RSD proposed were calculated [59]. Results elaborated in Table 2 confirm that the MEB voltametric quantification using our proposed procedure shows good repeatability and reproducibility within its decided optimized conditions.

3.8. Comparison with Other Analytical Methods

The current analytical was more sensitive than other electrochemical methods reported for MEB quantification. Some of these methods are classical electrochemical methods (conductometric [27,28] and potentiometric [29,30,31] methods), which did not offer a sufficient sensitive quantitation limit for pharmacokinetic studies and therapeutic drug monitoring. Additionally, Cu2ONPs–C@G/PE was successfully applied for the voltametric quantification of MEB at a lower detection limit than other voltametric sensors previously used for the same purpose [32,33]. Table 3 summarizes a comparison of our results with other voltametric methods previously applied for the quantification of MEB. The tabulated data prove that Cu2ONPs–C@G/PE has a sensitivity greater than that of other sensors used for the same purpose. Moreover, we can confirm the great benefits of Cu2ONPs–C@G/PE over other analytical methods used for MEB quantification. Our opinion is attributed to an economic point of view due to the low prices of the materials used in Cu2ONPs–C@G/PE preparation or its ease of preparation. In contrast, MEB was quantified previously using analytical methods based on expensive nanomaterials or using cumbersome separation methods. In fact, we consider Cu2ONPs–C@G as a promising material, since it was successfully applied in the preparation of the current electrochemical sensor (Cu2ONPs–C@G/PE) and can be used in the future to prepare various forms of electrochemical sensors with different voltametric applications.

3.9. Interference Studies

To demonstrate the selectivity of the proposed method under the optimized conditions, the suggested procedure was performed to record the peak current of MEB in the MEB–Cu complex either in the absence or in presence of different interferences. The studied interferences include some excipients that are used in pharmaceutical industries (e.g., glucose, sucrose, lactose, fructose, starch and talc) and some inorganic salts (e.g., Na+, K+, Zn2+, Al3+, Ca2+, Sr2+, Cd2+, Co2+, Ni2+ and Mg2+). The experimental results show that up to a thousand-fold excess molar concentration of the studied interferences has no significant effect on the recorded peak current. This is clear from the obtained % recovery with low standard deviation values for five determinations (recovery (%) ± SD = 101.04 ± 1.09 for excipients and 99.85 ± 2.12 for inorganic salts).
To confirm the selectivity of Cu2ONPs–C@G/PE toward MEB voltametric determination, a quantum theoretical investigation was achieved aiming to prove the highest ability of MEB to form a complex with Cu2+ in the presence of the studied excipients. The performed DFT theoretical calculations showed that a ΔE value of MEB is lower than glucose, sucrose and fructose (as an example of studied excipients) (Table S2; see Supplementary data file). Additionally, Figure S5 (see Supplementary data file) shows the optimized geometric structures of glucose, fructose and sucrose. Another indication for MEB having the highest chemical reactivity in comparison to the studied excipients is that MEB has N and O as heterocyclic atoms that give MEB more negativity than the studied excipients that have only O atoms.

3.10. Application of the Cu2ONPs–C@G/PE Sensor to Dosage Forms and Biological Fluids

The proposed analytical method was successfully applied for the quantification of MEB in dosage forms and biological fluids (spiked human urine and plasma samples).
Thanks to its sensitivity and selectivity, Cu2ONPs–C@G/PE exhibits an excellent analytical behavior towards the voltametric quantification of MEB in two sample dosage forms (Duspatalin and Colospasmin® forte tablets). The achieved recovery values for studied dosage forms spiked with various MEB concentrations using the standard addition method were in the range of 97.50–103.33%, as shown in Table 4. The achieved results were compared statistically with previous results obtained by SWAdASV [32] and differential pulse voltametric (DPV) [33] reference methods by applying a Student’s t-test for accuracy and an F-test for precision at 95% confidence level. Values from the Student’s t-test and the variance ratio F-test (1.53 and 1.79, respectively) did not exceed their theoretical values at p = 0.05 (2.75 and 7.84, respectively), indicating no significant differences between the proposed and reference methods.
Another application of Cu2ONPs–C@G/PE is to quantize MEB in biological fluids (spiked human urine and plasma samples). At defined optimum conditions and using the standard addition method, the recovery percentage values were found in the range of 96.10–104.25%, as shown in Table 4. The t-test and F-test were applied to the obtained dataset, at the 95% confidence level, aiming to prove the reliability between the acquired data using Cu2ONPs–C@G/PE and the reference voltametric methods [32,33]. Values obtained from the Student’s t-test and the variance ratio F-test (1.15 and 1.59, respectively) did not exceed their theoretical values at p = 0.05 (2.05 and 4.14, respectively). The obtained data elaborated that Cu2ONPs–C@G/PE delivered accurate and precise data and showed no significant differences between the proposed and reference methods.

4. Conclusions

In the current work, we present a facile chemical reduction method followed by intensive mixing to produce a new material of graphite grains studded with cuprous oxide microcubes (Cu2ONPs–C@G), which was characterized and verified using various methods. The produced material was used to fabricate a paste electrode (Cu2ONPs–C@G/PE), which was successfully applied as a sensitive and selective voltametric quantification of MEB. The electrochemical behavior of MEB was studied using CV, and the optimum analytical parameters were achieved using square wave adsorptive anodic stripping voltammetry (SWAdASV). MEB was successfully quantified over the concentration range of 5.00 × 10⁻¹¹ −1.10 × 10⁻⁹ M with LOD and LOQ values of 2.41 × 10⁻¹¹ M and 8.05 × 10⁻¹¹ M, respectively. Cu2ONPs–C@G/PE exhibited a markable analytical sensitivity towards the analytical quantification of MEB in dosage forms (tablets) and biological fluids (spiked human urine and plasma samples). Owing to the simplicity, sensitivity and selectivity of the proposed method, it can be applied easily for the quantification of MEB in various research aspects, such as quality control centers and pharmaceutical research authorities.

Supplementary Materials

The following are available online at https://0-www-mdpi-com.brum.beds.ac.uk/2227-9040/9/2/35/s1, Figure S1: (A) Mulliken charges diagram of MEB atoms, (B) MEP of MEB, Figure S2: (A) Optimized geometric structures; (B) MEP; Molecular orbital (C) HOMO, (D) LUMO, (E) Mulliken charges diagram; and (F) counter plot of MEB-Cu complex, Figure S3: Different optimized instrumental conditions on recorded oxidation peak current of 2 × 10⁻⁵ M MEB in Britton–Robinson buffer (pH ≈ 8.0) using Cu2ONPs–C@G/PE: (A) Effect of accumulation potential (V), (B) Effect of frequency (Hz) and (C) Effect of pulse height (V), Figure S4: Different optimized experimental parameters on recorded oxidation peak current of 2 × 10⁻⁵ M MEB using Cu2ONPs–C@G/PE: (A) Effect of pH, (B) Effect of buffer type at pH ≈ 8.0, (C) Effect of supporting electrolyte type, and (D) Effect of selected supporting electrolyte concentration, Figure S5: Optimized structure of (A) Molecular orbital, (B) HOMO and (C) LUMO of glucose, fructose and sucrose, Table S1: Calculated quantum chemical parameters of MEB–Cu complex, Table S2: The calculated ΔE of MEB and some studied excipients.

Author Contributions

A.H.N. supervised, organized this study and wrote the manuscript. A.K. performed all experiments and characterizations. M.H.M. performed the computational study. A.A.G., A.A.A. and A.E.-A.Y.E.-S. helped in the explanation of some results. All authors have read and agreed to the published version of the manuscript.

Funding

Deanship of Scientific Research at Jouf University for funding this work through Research Project Grant No. (40/203).

Institutional Review Board Statement

Not applicable.

Informed Consent Statement

Not applicable.

Data Availability Statement

The data presented in this study are available on request from the corresponding author.

Acknowledgments

The authors extend their appreciation to the Deanship of Scientific Research at Jouf University for funding this work through Research Project Grant No. (40/203).

Conflicts of Interest

The authors declare no conflict of interest.

References

  1. Koch, C.C. Nanostructured Materials: Processing, Properties and Applications, 2nd ed.; William Andrew: Norwich, NY, USA, 2006. [Google Scholar]
  2. Salavati-Niasari, M.; Davar, F. Synthesis of copper and copper (I) oxide nanoparticles by thermal decomposition of a new precursor. Mater. Lett. 2009, 63, 441–443. [Google Scholar] [CrossRef]
  3. Sasmal, A.K.; Dutta, S.; Pal, T.A. Ternary Cu2O–Cu–CuO nanocomposite: A catalyst with intriguing activity. Dalton Trans. 2016, 45, 3139–3150. [Google Scholar] [CrossRef] [PubMed]
  4. Tian, L.; Gao, Y.; Li, L.; Wu, W.; Sun, D.; Lu, J.; Li, T. Determination of thiourea using a carbon paste electrode decorated with copper oxide nanoparticles. Microchim. Acta 2013, 180, 607–612. [Google Scholar] [CrossRef]
  5. Paracchino, A.; Laporte, V.; Sivula, K.; Grätzel, M.; Thimsen, E. Highly active oxide photocathode for photoelectrochemical water reduction. Nat. Mater. 2011, 10, 456–461. [Google Scholar] [CrossRef]
  6. Huang, L.; Peng, F.; Yu, H.; Wang, H. Synthesis of Cu2O nanoboxes, nanocubes and nanospheres by polyol process and their adsorption characteristic. Mater. Res. Bull. 2008, 43, 3047–3053. [Google Scholar] [CrossRef]
  7. Song, Y.-J.; Han, S.-B.; Lee, H.-H.; Park, K.-W. Size–controlled Cu2O nanocubes by pulse electrodeposition. J. Korean Electrochem. Soc. 2010, 13, 40–44. [Google Scholar] [CrossRef] [Green Version]
  8. Kumar, R.; Rai, P.; Sharma, A. Facile synthesis of Cu2O microstructures and their morphology dependent electrochemical supercapacitor properties. RSC Adv. 2016, 6, 3815–3822. [Google Scholar] [CrossRef] [Green Version]
  9. Zhang, Y.-H.; Jiu, B.-B.; Gong, F.-L.; Chen, J.-L.; Zhang, H.-L. Morphology–controllable Cu2O supercrystals: Facile synthesis, facet etching mechanism and comparative photocatalytic H2 production. J. Alloys Compd. 2017, 729, 563–570. [Google Scholar] [CrossRef]
  10. Zeng, Q.-X.; Xu, G.-C.; Zhang, L.; Lv, Y. Porous Cu2O microcubes derived from a metal–formate framework as photocatalyst for degradation of methyl orange. Mater. Res. Bull. 2019, 119, 110537. [Google Scholar] [CrossRef]
  11. Li, H.; Ye, L.; Wang, Y.; Xie, C. A glassy carbon electrode modified with hollow cubic cuprous oxide for voltammetric sensing of L–cysteine. Microchim. Acta 2018, 185, 5. [Google Scholar] [CrossRef]
  12. Liang, X.; Gao, L.; Yang, S.; Sun, J. Facile synthesis and shape evolution of single–crystal cuprous oxide. Adv. Mater. 2009, 21, 2068–2071. [Google Scholar] [CrossRef]
  13. Abdelwahab, A.A.; Elseman, A.; Alotaibi, N.; Nassar, A. Simultaneous voltammetric determination of ascorbic acid, dopamine, acetaminophen and tryptophan based on hybrid trimetallic nanoparticles–capped electropretreated graphene. Microchem. J. 2020, 156, 104927. [Google Scholar] [CrossRef]
  14. Abdelwahab, A.A.; Naggar, A.H.; Abdelmotaleb, M.; Emran, M.Y. Ruthenium nanoparticles uniformly–designed chemically treated graphene oxide nanosheets for simultaneous voltammetric determination of dopamine and acetaminophen. Electroanalysis 2020, 32, 2156–2165. [Google Scholar] [CrossRef]
  15. Afzali, M.; Mostafavi, A.; Nekooie, R.; Jahromi, Z. A novel voltammetric sensor based on palladium nanoparticles/carbon nanofibers/ionic liquid modified carbon paste electrode for sensitive determination of anti–cancer drug pemetrexed. J. Mol. Liq. 2019, 282, 456–465. [Google Scholar] [CrossRef]
  16. Almandil, N.B.; Ibrahim, M.; Ibrahim, H.; Kawde, A.; Shehatta, I.; Akhtar, S. A hybrid nanocomposite of CeO2–ZnO–chitosan as an enhanced sensing platform for highly sensitive voltammetric determination of paracetamol and its degradation product p–aminophenol. RSC Adv. 2019, 9, 15986–15996. [Google Scholar] [CrossRef] [Green Version]
  17. He, Q.; Tian, Y.; Wu, Y.; Liu, J.; Li, G.; Deng, P.; Chen, D. Electrochemical sensor for rapid and sensitive detection of tryptophan by a Cu2O nanoparticles–coated reduced graphene oxide nanocomposite. Biomolecules 2019, 9, 176. [Google Scholar] [CrossRef] [Green Version]
  18. Yan, Q.; Zhi, N.; Yang, L.; Xu, G.; Feng, Q.; Zhang, Q.; Sun, S. A highly sensitive uric acid electrochemical biosensor based on a nano–cube cuprous oxide/ferrocene/uricase modified glassy carbon electrode. Sci. Rep. 2020, 10, 10607. [Google Scholar] [CrossRef]
  19. Sweetman, S.C. Martindale: The Complete Drug Reference; Pharmaceutical Press: London, UK, 2009. [Google Scholar]
  20. Annaházi, A.; Róka, R.; Rosztóczy, A.; Wittmann, T. Role of antispasmodics in the treatment of irritable bowel syndrome. World J. Gastroenterol. 2014, 20, 6031–6043. [Google Scholar] [CrossRef] [PubMed]
  21. Moskaleva, N.E.; Baranov, P.A.; Mesonzhnik, N.V.; Appolonova, S.A. HPLC–MS/MS method for the simultaneous quantification of desmethylmebeverine acid, mebeverine acid and mebeverine alcohol in human plasma along with its application to a pharmacokinetics study. J. Pharm. Biomed. Anal. 2017, 138, 118–125. [Google Scholar] [CrossRef]
  22. Panda, S.S.; Bera, V.V.R.K.; Sahoo, P.; Sahu, B. Quantitative estimation of mebeverine hydrochloride in sustained–release dosage form using an analytical lifecycle management oriented stability–indicating LC method. J. Liq. Chromatogr. Relat. Technol. 2018, 41, 637–644. [Google Scholar] [CrossRef]
  23. Tulich, L.J.; Randall, J.L.; Kelm, G.R.; Wehmeyer, K.R. Determination of two mebeverine metabolites, mebeverine alcohol and desmethylmebeverine alcohol, in human plasma by a dual stable isotope–based gas chromatographic–mass spectrometric method. J. Chromatogr. B 1996, 682, 273–281. [Google Scholar] [CrossRef]
  24. Lotfy, H.M.; Fayez, Y.M.; Michael, A.M.; Nessim, C.K. Simultaneous determination of mebeverine hydrochloride and chlordiazepoxide in their binary mixture using novel univariate spectrophotometric methods via different manipulation pathways. Spectrochim. Acta A 2016, 155, 11–20. [Google Scholar] [CrossRef] [PubMed]
  25. Derayea, S.M. An application of eosin Y for the selective spectrophotometric and spectrofluorimetric determination of mebeverine hydrochloride. Anal. Methods 2014, 6, 2270–2275. [Google Scholar] [CrossRef]
  26. Walash, M.; El–Din, M.S.; El–Enany, N.; Eid, M.; Shalan, S. First derivative synchronous fluorescence spectroscopy for the simultaneous determination of sulpiride and mebeverine hydrochloride in their combined tablets and application to real human plasma. J. Fluoresc. 2010, 20, 1275–1285. [Google Scholar] [CrossRef] [PubMed]
  27. Elmasry, M.S.; Elazazy, M.S.; Hassan, W.S. Utilization of ion–associate formation in spectroscopic and conductometric determination of mebeverine hydrochloride in pharmaceutical formulations. Int. J. Electrochem. Sci. 2013, 8, 3888–3901. [Google Scholar]
  28. Elazazy, M.S.; Elmasry, M.S.; Hassan, W.S. Conductometric and spectroscopic determination of mebeverine hydrochloride and the solubility products of its ion recognition species. Int. J. Electrochem. Sci. 2012, 7, 9781–9794. [Google Scholar]
  29. Ibrahim, H.; Issa, Y.M.; Abu–Shawish, H.M. Potentiometric flow injection analysis of mebeverine hydrochloride in serum and urine. J. Pharm. Biomed. Anal. 2005, 36, 1053–1061. [Google Scholar] [CrossRef]
  30. Ibrahim, H.; Issa, Y.; Abu-Shawish, H.M. Improving the detection limits of antispasmodic drugs electrodes by using modified membrane sensors with inner solid contact. J. Pharm. Biomed. Anal. 2007, 44, 8–15. [Google Scholar] [CrossRef]
  31. Ali, T.A.; Mohamed, G.G.; Omar, M.; Abdrabou, V.N. Improved determination of mebeverine hydrochloride in urine, serum and pharmaceutical preparations utilizing a modified carbon paste electrode. Int. J. Electrochem. Sci. 2015, 10, 2439–2454. [Google Scholar]
  32. El–Desoky, H.S.; Ghoneim, M.M.; El-Badawy, F.M. Carbon nanotubes modified electrode for enhanced voltammetric sensing of mebeverine hydrochloride in formulations and human serum samples. J. Electrochem. Soc. 2017, 164, B212–B222. [Google Scholar] [CrossRef]
  33. Salama, N.N.; Zaazaa, H.E.; Azab, S.M.; Atty, S.A.; El-Kosy, N.M.; Salem, M.Y. Utility of gold nanoparticles/silica modified electrode for rapid selective determination of mebeverine in micellar medium: Comparative discussion and application in human serum. Ionics 2016, 22, 957–966. [Google Scholar] [CrossRef]
  34. Farghaly, O.A.; Taher, M.A.; Naggar, A.H.; El-Sayed, A.Y. Square wave anodic stripping voltammetric determination of metoclopramide in tablet and urine at carbon paste electrode. J. Pharm. Biomed. Anal. 2005, 38, 14–20. [Google Scholar] [CrossRef]
  35. Fallah, M.; Rahimnejad, M.; Asghary, M.; Mashkour, M. An electrochemical sensor based on a carbon paste electrode for the determination of buserelin. Anal. Methods 2020, 12, 33–38. [Google Scholar] [CrossRef]
  36. Demir, E.; Silah, H. Development of a new analytical method for determination of veterinary drug oxyclozanide by electrochemical sensor and its application to pharmaceutical formulation. Chemosensors 2020, 8, 25. [Google Scholar] [CrossRef] [Green Version]
  37. Chandrashekar, B.N.; Lv, W.; Jayaprakash, G.K.; Harrath, K.; Liu, L.W.Y.; Swamy, B.E.K. Cyclic voltammetric and quantum chemical studies of a poly(methionine) modified carbon paste electrode for simultaneous detection of dopamine and uric acid. Chemosensors 2019, 7, 24. [Google Scholar] [CrossRef] [Green Version]
  38. Orabi, E.A.; Orabi, M.A.; Mahross, M.H.; Abdel-Hakim, M. Computational investigation of the structure and antioxidant activity of some pyrazole and pyrazolone derivatives. J. Saudi Chem. Soc. 2018, 22, 705–714. [Google Scholar] [CrossRef]
  39. Mahross, M.H.; Efil, K.; El-Nasr, T.A.S.; Abbas, O.A. Synthesis, characterization and corrosion inhibition of N′-phenylbenzohydrazide derivative metal complexes: Experimental and quantum chemical studies. Z. Phys. Chem. 2019, 233, 949–972. [Google Scholar] [CrossRef]
  40. Naggar, A.H.; Saleh, G.A.; Omar, M.A.; Haredy, A.M.; Derayea, S.M. Square wave adsorptive anodic stripping voltammetric determination of antidiabetic drug linagliptin in pharmaceutical formulations and biological fluids using pencil graphite electrode. Anal. Sci. 2020, 36, 1031–1038. [Google Scholar] [CrossRef] [PubMed] [Green Version]
  41. Saleh, G.A.; Askal, H.F.; Refaat, I.H.; Naggar, A.H.; Abdel-aal, F.A. Adsorptive square wave voltammetric determination of the antiviral drug valacyclovir on a novel sensor of copper microparticles–modified pencil graphite electrode. Arab. J. Chem. 2016, 9, 143–151. [Google Scholar] [CrossRef] [Green Version]
  42. Naggar, A.H.; ElKaoutit, M.; Naranjo–Rodriguez, I.; El–Sayed, A.Y.; Hidalgo-Hidalgo de Cisneros, J.L. Use of a sonogel-carbon electrode modified with bentonite for the determination of diazepam and chlordiazepoxide hydrochloride in tablets and their metabolite oxazepam in urine. Talanta 2012, 89, 448–454. [Google Scholar] [CrossRef]
  43. Frisch, M.J.; Trucks, G.W.; Schlegel, H.B.; Scuseria, G.E.; Robb, M.A.; Cheeseman, J.R.; Scalmani, G.; Barone, V.; Mennucci, B.; Petersson, G.A.; et al. Gaussian 09; Gaussian Inc.: Wallingford, CT, USA, 2013. [Google Scholar]
  44. Popova, A. Crystallographic analysis of graphite by X-ray diffraction. Coke Chem. 2017, 60, 361–365. [Google Scholar] [CrossRef]
  45. Chandrappa, K.; Venkatesha, T. Electrochemical bulk synthesis and characterisation of hexagonal–shaped CuO nanoparticles. J. Exp. Nanosci. 2013, 8, 516–532. [Google Scholar] [CrossRef]
  46. Klug, H.P. X-ray Diffraction Procedures: For Polycrystalline and Amorphous Materials, 2nd ed.; Wiley-Interscience: New York, NY, USA, 1974. [Google Scholar]
  47. Shahrokhian, S.; Kohansal, R.; Ghalkhani, M.; Amini, M.K. Electrodeposition of copper oxide nanoparticles on precasted carbon nanoparticles film for electrochemical investigation of anti-HIV drug nevirapine. Electroanalysis 2015, 27, 1989–1997. [Google Scholar] [CrossRef]
  48. Teo, W.Z.; Ambrosi, A.; Pumera, M. Direct electrochemistry of copper oxide nanoparticles in alkaline media. Electrochem. Commun. 2013, 28, 51–53. [Google Scholar] [CrossRef]
  49. Dong, S.; Xie, Y.; Cheng, G. Cyclic voltammetric and spectroelectrochemical studies of copper in alkaline solution. Electrochim. Acta 1992, 37, 17–22. [Google Scholar] [CrossRef]
  50. Vázquez, M.E.; López, J.R.; Medina-Rodelo, D.; Jiménez-Edeza, M.; Castañeda-Ruelas, G.M.; López, A.M.; Herrera-Ramírez, J.M.; Méndez, P.F. Electrochemical study, structural characterization and antimicrobial activity of silver and copper oxide (CuO) nanoparticles synthesized by a green method using L–ascorbic acid and chitosan. Int. J. Electrochem. Sci. 2019, 14, 6366–6375. [Google Scholar] [CrossRef]
  51. Bard, A.J.; Faulkner, L.R. Electrochemical Methods: Fundamentals and Applications, 2nd ed.; John Wiley and Sons: Hoboken, NJ, USA, 2001. [Google Scholar]
  52. Fang, J.; Li, J. Quantum chemistry study on the relationship between molecular structure and corrosion inhibition efficiency of amides. J. Mol. Struc. 2002, 593, 179–185. [Google Scholar] [CrossRef]
  53. Khalil, N. Quantum chemical approach of corrosion inhibition. Electrochim. Acta 2003, 48, 2635–2640. [Google Scholar] [CrossRef]
  54. Arslan, T.; Kandemirli, F.; Ebenso, E.E.; Love, I.; Alemu, H. Quantum chemical studies on the corrosion inhibition of some sulphonamides on mild steel in acidic medium. Corros. Sci. 2009, 51, 35–47. [Google Scholar] [CrossRef]
  55. Obi-Egbedi, N.; Obot, I.; El-Khaiary, M.; Umoren, S.; Ebenso, E. Computational simulation and statistical analysis on the relationship between corrosion inhibition efficiency and molecular structure of some phenanthroline derivatives on mild steel surface. Int. J. Electrochem. Sci. 2011, 6, e5675. [Google Scholar]
  56. Gece, G. The use of quantum chemical methods in corrosion inhibitor studies. Corros. Sci. 2008, 50, 2981–2992. [Google Scholar] [CrossRef]
  57. Mirceski, V.; Skrzypek, S.; Stojanov, L. Square-wave voltammetry. ChemTexts 2018, 4, 17. [Google Scholar] [CrossRef]
  58. Gopalan, A.I.; Lee, K.-P.; Manesh, K.M.; Santhosh, P.; Kim, J.H.; Kang, J.S. Electrochemical determination of dopamine and ascorbic acid at a novel gold nanoparticles distributed poly (4-aminothiophenol) modified electrode. Talanta 2007, 71, 1774–1781. [Google Scholar] [CrossRef] [PubMed]
  59. Miller, J.C.; Miller, J.N. Statistics for Analytical Chemistry, 4th ed.; Elsevier: New York, NY, USA, 1994. [Google Scholar]
Scheme 1. Mebeverine hydrochloride (MEB) Structure.
Chemosensors 09 00035 sch001
Figure 1. Description of Cu2ONPs–C@G and Cu2ONPs–C@G/PE preparation and the applied procedure for MEB voltametric determination.
Chemosensors 09 00035 g001
Figure 2. XRD patterns of: (A) bare graphite grains, (B) pure synthesized Cu2ONPs–C and (C) Cu2ONPs–C@G.
Chemosensors 09 00035 g002
Figure 3. SEM images of: (A) bare graphite grains, (B) pure synthesized Cu2ONPs–C, (C) Cu2ONPs–C@G and (D) diameter distribution of Cu2ONPsC.
Chemosensors 09 00035 g003
Figure 4. (A) TEM images of Cu2ONPsC@G and (B) diameter distribution of particles (Cu2ONPs) at cube surface derived from TEM.
Chemosensors 09 00035 g004
Figure 5. Typical cyclic voltammogram recorded in blank phosphate buffer (pH ≈ 8) using carbon paste electrodes (CPE) (dashed line) and Cu2ONPs-C@G/PE (solid line).
Chemosensors 09 00035 g005
Figure 6. (A) Cyclic voltammograms of blank solution using (a1) CPE and (b1) Cu2ONPs-C@G/PE, and in presence of 2 × 10⁻⁵ M MEB using (a2) CPE and (b2) Cu2ONPs-C@G/PE. (B) The recorded cyclic voltammogram using Cu2ONPs-C@G/PE (a) before and (bh) after addition of 2 × 10⁻⁵ M MEB at different scan rate values in the range of 100–1000 mV/s. (C) Plot of peak current (Inet) versus square root of scan rate (ν1/2). (D) Plot of logarithm scan rate (log ν) versus (a) logarithm peak current (log Inet) and (b) peak potential (Ep). (E) Successive cyclic voltammogram of 2 × 10⁻⁵ M MEB using Cu2ONPs-C@G/PE. All cyclic voltammograms where recorded under optimized instrumental and experimental conditions.
Chemosensors 09 00035 g006aChemosensors 09 00035 g006b
Scheme 2. Suggested scheme for the formed MEB–Cu complex.
Chemosensors 09 00035 sch002
Figure 7. (A) Numbered structure and optimized structure of (B) molecular orbital, (C) HOMO and (D) LUMO of MEB.
Chemosensors 09 00035 g007aChemosensors 09 00035 g007b
Figure 8. Typical SWAdAS voltammograms of different MEB concentrations: (a) residual current, (b) 5.00 × 10⁻¹¹ M, (c) 3.00 × 10⁻¹⁰ M, (d) 5.00 × 10⁻¹⁰ M, (e) 7.00 × 10⁻¹⁰ M, (f) 9.00 × 10⁻¹⁰ M and (g) 1.10 × 10⁻⁹ M. Inset, calibration graph for MEB voltametric determination. Measurement conditions: 0.1 M phosphate buffer (pH ≈ 8.0) containing 0.1 M KCl at −0.6 V accumulation potential and 60 s accumulation time using Cu2ONPs-C@G/PE as working electrode.
Chemosensors 09 00035 g008
Table 1. Calculated quantum chemical parameters of MEB.
Quantum ParameterLaw Related to Quantum ParameterMEB Values
EHOMO– – – – –−0.3095
ELUMO– – – – –−0.1892
Separation energies (∆E)∆E = ELUMO − EHOMO0.1203
Ionization potentials (I)I = −EHOMO0.3095
Electron affinity (A)A = −ELUMO0.1892
Chemical potential (u)u = I + A/20.2493
Electronegativity’s (X)X = − u−0.2493
Absolute hardness (η)η = (ELUMO − EHOMO)/20.0602
Absolute softness (σ)σ = 1/η16.6251
Global electrophilicity (ω)ω = u × u/2η0.5168
Total energy (TE)– – – – –−1396.9 a.u.
Dipole moment (µ)– – – – –2.1455 debye
Table 2. Regression data of calibration plot for MEB using Cu2ONPs–C@G/PE in 0.1 M phosphate buffer solutions (pH ≈ 8) containing 0.1 M KCl.
ParameterValue
Linearity range/M5.00 × 10−11–1.10 × 10⁻⁹
LOD/M2.41 × 10−11
LOQ/M8.05 × 10−11
Intercept (µA) ± SD20.595 ± 0.4947
Slope (µA M−1) ± SD6.16 × 1010 ± 0.072 × 10¹⁰
RSD, %1.0932
Correlation coefficient, R20.9995
Intraday precision (n = 5), recoveries (%)
for studied MEB concentrations a
95.12–99.11
Interday precision, 5 days, (n = 25) recoveries (%)
for studied MEB concentrations a
94.16–101.62
Intraday precision (n = 5), RSD (%)
for studied MEB concentrations a
2.45
Interday precision, 5 days, (n = 25) RSD (%)
for studied MEB concentrations a
4.15
a Studied MEB concentrations are 1.00 × 10⁻⁹ M, 5.00 × 10⁻⁹ and 6.01 × 10⁻⁸ M.
Table 3. Comparison of different analytical parameters of the proposed method with other voltametric methods used for MEB determination.
TechniqueElectrodeLinearity Range aLOD aLOQ arSensitivity bRef.
SWAdASV cf-MWCNT/CPE d0.50–35.000.130.440.99802.57[32]
DPV eGSMCPE f40.00−10000.001.505.000.99970.01[33]
SWAdASV cCu2ONPs-C@G/PE g0.05–1.100.020.080.9995616.00This work
a Multiplied by 10−9 and expressed in (M). b Multiplied by 108 and expressed in (μA M−1). c Square wave adsorptive anodic stripping voltammetry. d Functionalized multiwalled carbon nanotube modified carbon paste electrode. e Differential pulse voltammetry. f Gold nanoparticle/silica modified carbon paste electrode. g Paste electrode based on graphite grains studded with Cu2O nanoparticle-based cubes.
Table 4. Recovery percentage for the determination of MEB in dosage forms and biological fluids samples using Cu2ONPs–C@G/PE under its decided optimized conditions (n = 5).
Dosage FormsBiological Fluids
DuspatalinColospasmin® ForteSpiked Urine SampleSpiked Plasma Sample
T aF aR bT aF aR bT aF aR bT aF aR b
0.2150.217101.000.2150.21098.001.0731.06899.601.0731.090101.60
0.4290.41897.500.4290.42799.502.1452.08397.102.1452.06296.10
0.6440.665103.330.6440.646100.334.2914.345101.254.2914.473104.25
0.8580.862100.500.8580.880102.506.4366.19096.176.4366.29797.83
1.0731.101102.601.0731.092101.808.5828.904103.758.5828.48198.83
a T and F are taken and found concentrations, respectively, multiplied by 10−9 and expressed in (M). b R: recovery; expressed in (%).
Publisher’s Note: MDPI stays neutral with regard to jurisdictional claims in published maps and institutional affiliations.

