
Determination of Chemical Oxygen Demand (COD) Using Nanoparticle-Modified Voltammetric Sensors and Electronic Tongue Principles


Sensors and Biosensors Group, Department of Chemistry, Universitat Autònoma de Barcelona, Bellaterra, 08193 Barcelona, Spain
*
Author to whom correspondence should be addressed.
Chemosensors 2021, 9(3), 46; https://0-doi-org.brum.beds.ac.uk/10.3390/chemosensors9030046
Submission received: 22 January 2021
/
Revised: 19 February 2021
/
Accepted: 23 February 2021
/
Published: 27 February 2021
(This article belongs to the Special Issue Biosensors for Environmental Monitoring)
Abstract
:This manuscript reports the use of nanoparticle-modified voltammetric sensors for the rapid and green determination of chemical oxygen demand in river waters and waters from agricultural waste. Four different variants of modified electrodes have been prepared: CuO nanoparticles electrogenerated over Cu and covered with Nafion film (CuO/Cu-Nf), and graphite–epoxy composites modified with Cu, CuO, and Cu–Ni alloy nanoparticles. The response features of these electrodes were assessed by calibrating them vs. glucose, glycine, ethyleneglycol, and hydrogenphtalate in alkaline media, as samples providing different difficulty in their (bio)degradation characteristics. The most sensitive electrode was demonstrated to be the (CuO/Cu-Nf) electrode, with an LOD of 12.3 mg O2·L−1. The joint information provided by the sensor array showed the ability of estimating both the organic load and the type of sample in terms of difficulty of degradation, in what can be named an intelligent sensor assembly.
1. Introduction
Accompanied with the development of the modern industry, the protection of water resources from being polluted by waste effluents is becoming more relevant. Organic compounds are one of the most common pollutants, either in urban waste, agricultural and cattle production, or industrial runoffs. Chemical oxygen demand (COD) is an important parameter for evaluating the degree of water pollution by generic organic compounds, being a faster variant to ascertain the actual requirements for its biodegradation, the biochemical oxygen demand (BOD), which has precise long estimation times. COD is defined as the equivalent amount of molecular oxygen (in milligrams of O2) required to decompose by chemical oxidation all the organic compounds contained in 1 L of aqueous solution to carbon dioxide and water. There is a well-established and standardized method in many countries for measuring COD using potassium dichromate as the oxidizer in sulfuric acid media. Nevertheless, this method is very time-consuming, has high costs, and it is environmentally hazardous, as there is a reflux (2–4 h) in the process, and some expensive (Ag), corrosive (H2SO4 and Cr2O72−), and highly toxic (Hg and Cr (VI)) reagents are needed throughout the procedure [1].
In order to circumvent the drawbacks of the conventional method, some new trials and approaches have been studied, some with the use of sensors. Teixeira developed a novel photochemiresistor sensor using m-bismuth vanadate material for the determination of COD [2]. Kong and Wu tried to utilize ultraviolet spectroscopy to detect COD values in printing and dyeing waste waters to get a rapid method [3]. Cheng and coworkers developed a high-throughput chemiluminescence (CL) method for the determination based on a potassium permanganate–glutaraldehyde CL system [4]. Photocatalytic and photoelectrocatalytic methods were also studied to determine the COD values of wastewater samples [5,6]. Recently, a portable photoelectrochromic visualization sensor for COD detection was also developed by Wang et al. [7]. Unfortunately, photogenerated electron pairs recombined easily, and using UV light increased the costs associated to COD measurements [8].
In recent years, increasing attention has been paid to electrochemical methods utilizing differently modified electrodes and looking for the ones with the highest catalytic activity. Electrochemical methods are among the preferred ones because these kinds of methods are highly sensitive, time-saving, low cost, and easy to operate. As reported, many materials, such as TiO2 [9], Rh2O3 [10], IrO2 [11], CoO [12], Ni [13], or Ni Cu alloy [14], were used as electrocatalysts to fabricate sensors for COD measurements based on amperometric detection. Nevertheless, it is difficult to oxidize some organic substances directly with metal or carbon sensors, in which high potentials are needed. However, the potentials required are sometimes outside the potential windows of electrochemical devices reported, whose positive potentials are limited by the oxidation of water [15]. Copper electrodes have wide acceptance because of the fact that copper is a powerful and efficient electrocatalyst in alkaline media facilitating the degradation of carbohydrate and aminoacids by oxidation; these two types of compounds are common organic substances in wastewater and are considered as the main sources for COD. Up to now, different electrode variants to estimate organic load based on copper or copper oxide have been reported [16,17,18]. Nevertheless, it is nearly impossible to achieve the full oxidation of all organic contaminants to carbon dioxide and water by electrochemical methods performing at a high enough voltage. In spite of the fact that it is almost impossible to decompose all the organic contaminants, getting close to it is a necessary step to improve the accuracy and precision in the COD electrochemical determination. In addition to this information, whether a certain organic compound is easily decomposed or this is difficult contributes some important additional information to the organic load of a sample. Recalcitrant organic compounds are normally a challenge when their decontamination is sought, and detecting their presence can help in the management and operation of wastewater treatment plants.
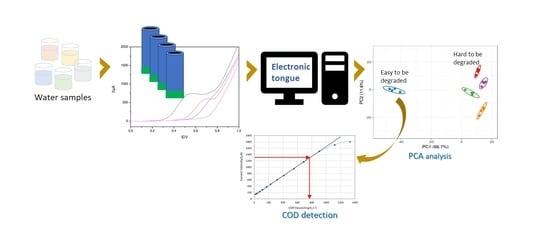
Winquist and coworkers utilized the voltammetric electronic tongue technique for multicomponent analysis of drinking water [19]. Inspired by this research, the combination of voltammetric sensors and an electronic tongue is a good choice to try to get a quantitative and qualitative analysis of a water sample simultaneously. According to the IUPAC technical report, the electronic tongue is defined as “a multisensory system, which consists of a number of low-selective sensors and uses advanced mathematical procedures for signal processing based on the pattern recognition and/or multivariate data analysis” [20,21]. Therefore, the electronic tongue, consisting of an array of non-specific, poorly selective sensors, supported by chemometric processing, can be used for analyzing the composition of multispecies solutions qualitatively and quantitatively. Principal component analysis (PCA) is commonly used in the data-processing algorithms to identify or classify the components [22]. The PCA technique, through data processing and rearranging, calculates a large number of variables to get fewer new variables, which not only reduces the number of variables but also retains the useful information of the original data.
In the work here presented, four electrodes based on copper, copper oxide, and nickel copper alloy were fabricated to compose an electronic tongue array. This voltammetric array, consisting of a Nafion film-covered electrodeposited CuO/Cu electrode as well as copper, copper oxide, and nickel copper alloy nanoparticle–graphite–epoxy composite electrodes, was employed for analyzing river water samples quantitatively and qualitatively. The COD values were calculated based on the calibration equation obtained based on the linear relationship of COD values and current intensity. The PCA technique applied to the profiles shown in the voltammograms was used to evaluate the main component of a polluted water sample, which was able to indicate whether this is easy or difficult to be degraded.
2. Experimental
2.1. Chemicals and Reagents
Reagents in this work were used as received from the manufacturers without any purification and the purities were all of analytical grade. All solutions were prepared using ultrapure water purified by a Milli-Q system (Millipore, Billerica, MA, USA). Nafion (5%, w/w) was purchased from Aldrich (St. Louis, MO, USA); copper (Cu) nanoparticles (40–60 nm) and copper (II) oxide (CuO) nanoparticles (˂50 nm), which were used as modifiers, from Sigma-Aldrich (St. Louis, MO, USA); gamma alumina powder, which was used for polishing the surface of copper block, was purchased from the company CH Instruments (Austin, TX, USA). Nickel copper alloy powder (Ni-Cu alloy) nanoparticles (˂80 nm) were purchased from Nanografi Nano Technology (Germany). Glucose, ethylene glycol, potassium hydrogen phthalate, glycine, and sodium hydroxide (NaOH) were purchased from Sigma-Aldrich (St. Louis, MO, USA); graphite powder (˂50 μm) used for the construction of the electrodes was purchased from BDH (BDH Laboratory supplies, Poole, UK) and epoxy for composite electrodes, the corresponding H77 resin, and hardener were purchased from Epoxy Technologies (Billerica, MA, USA).
2.2. Apparatus
All the cyclic voltammetric measurements were performed with use of a PGSTAT 30 Autolab potentiostat (EcoChemie, Netherlands) with GPES 4.7 version software (EcoChemie). Electrochemical measurements were carried out in a conventional three-electrode system composed of fabricated electrodes as working electrodes, a metallic platinum electrode, and an Ag/AgCl electrode, as the auxiliary and reference electrode, respectively. The working electrodes were fabricated by us, and the auxiliary and reference electrodes were bought from Fisher Scientific, which is a combination ORP electrode. The sealed tube for COD detection was purchased from the HACH company, Spain.
2.3. Electrodes Fabrication
2.3.1. Fabrication of Electrode E1
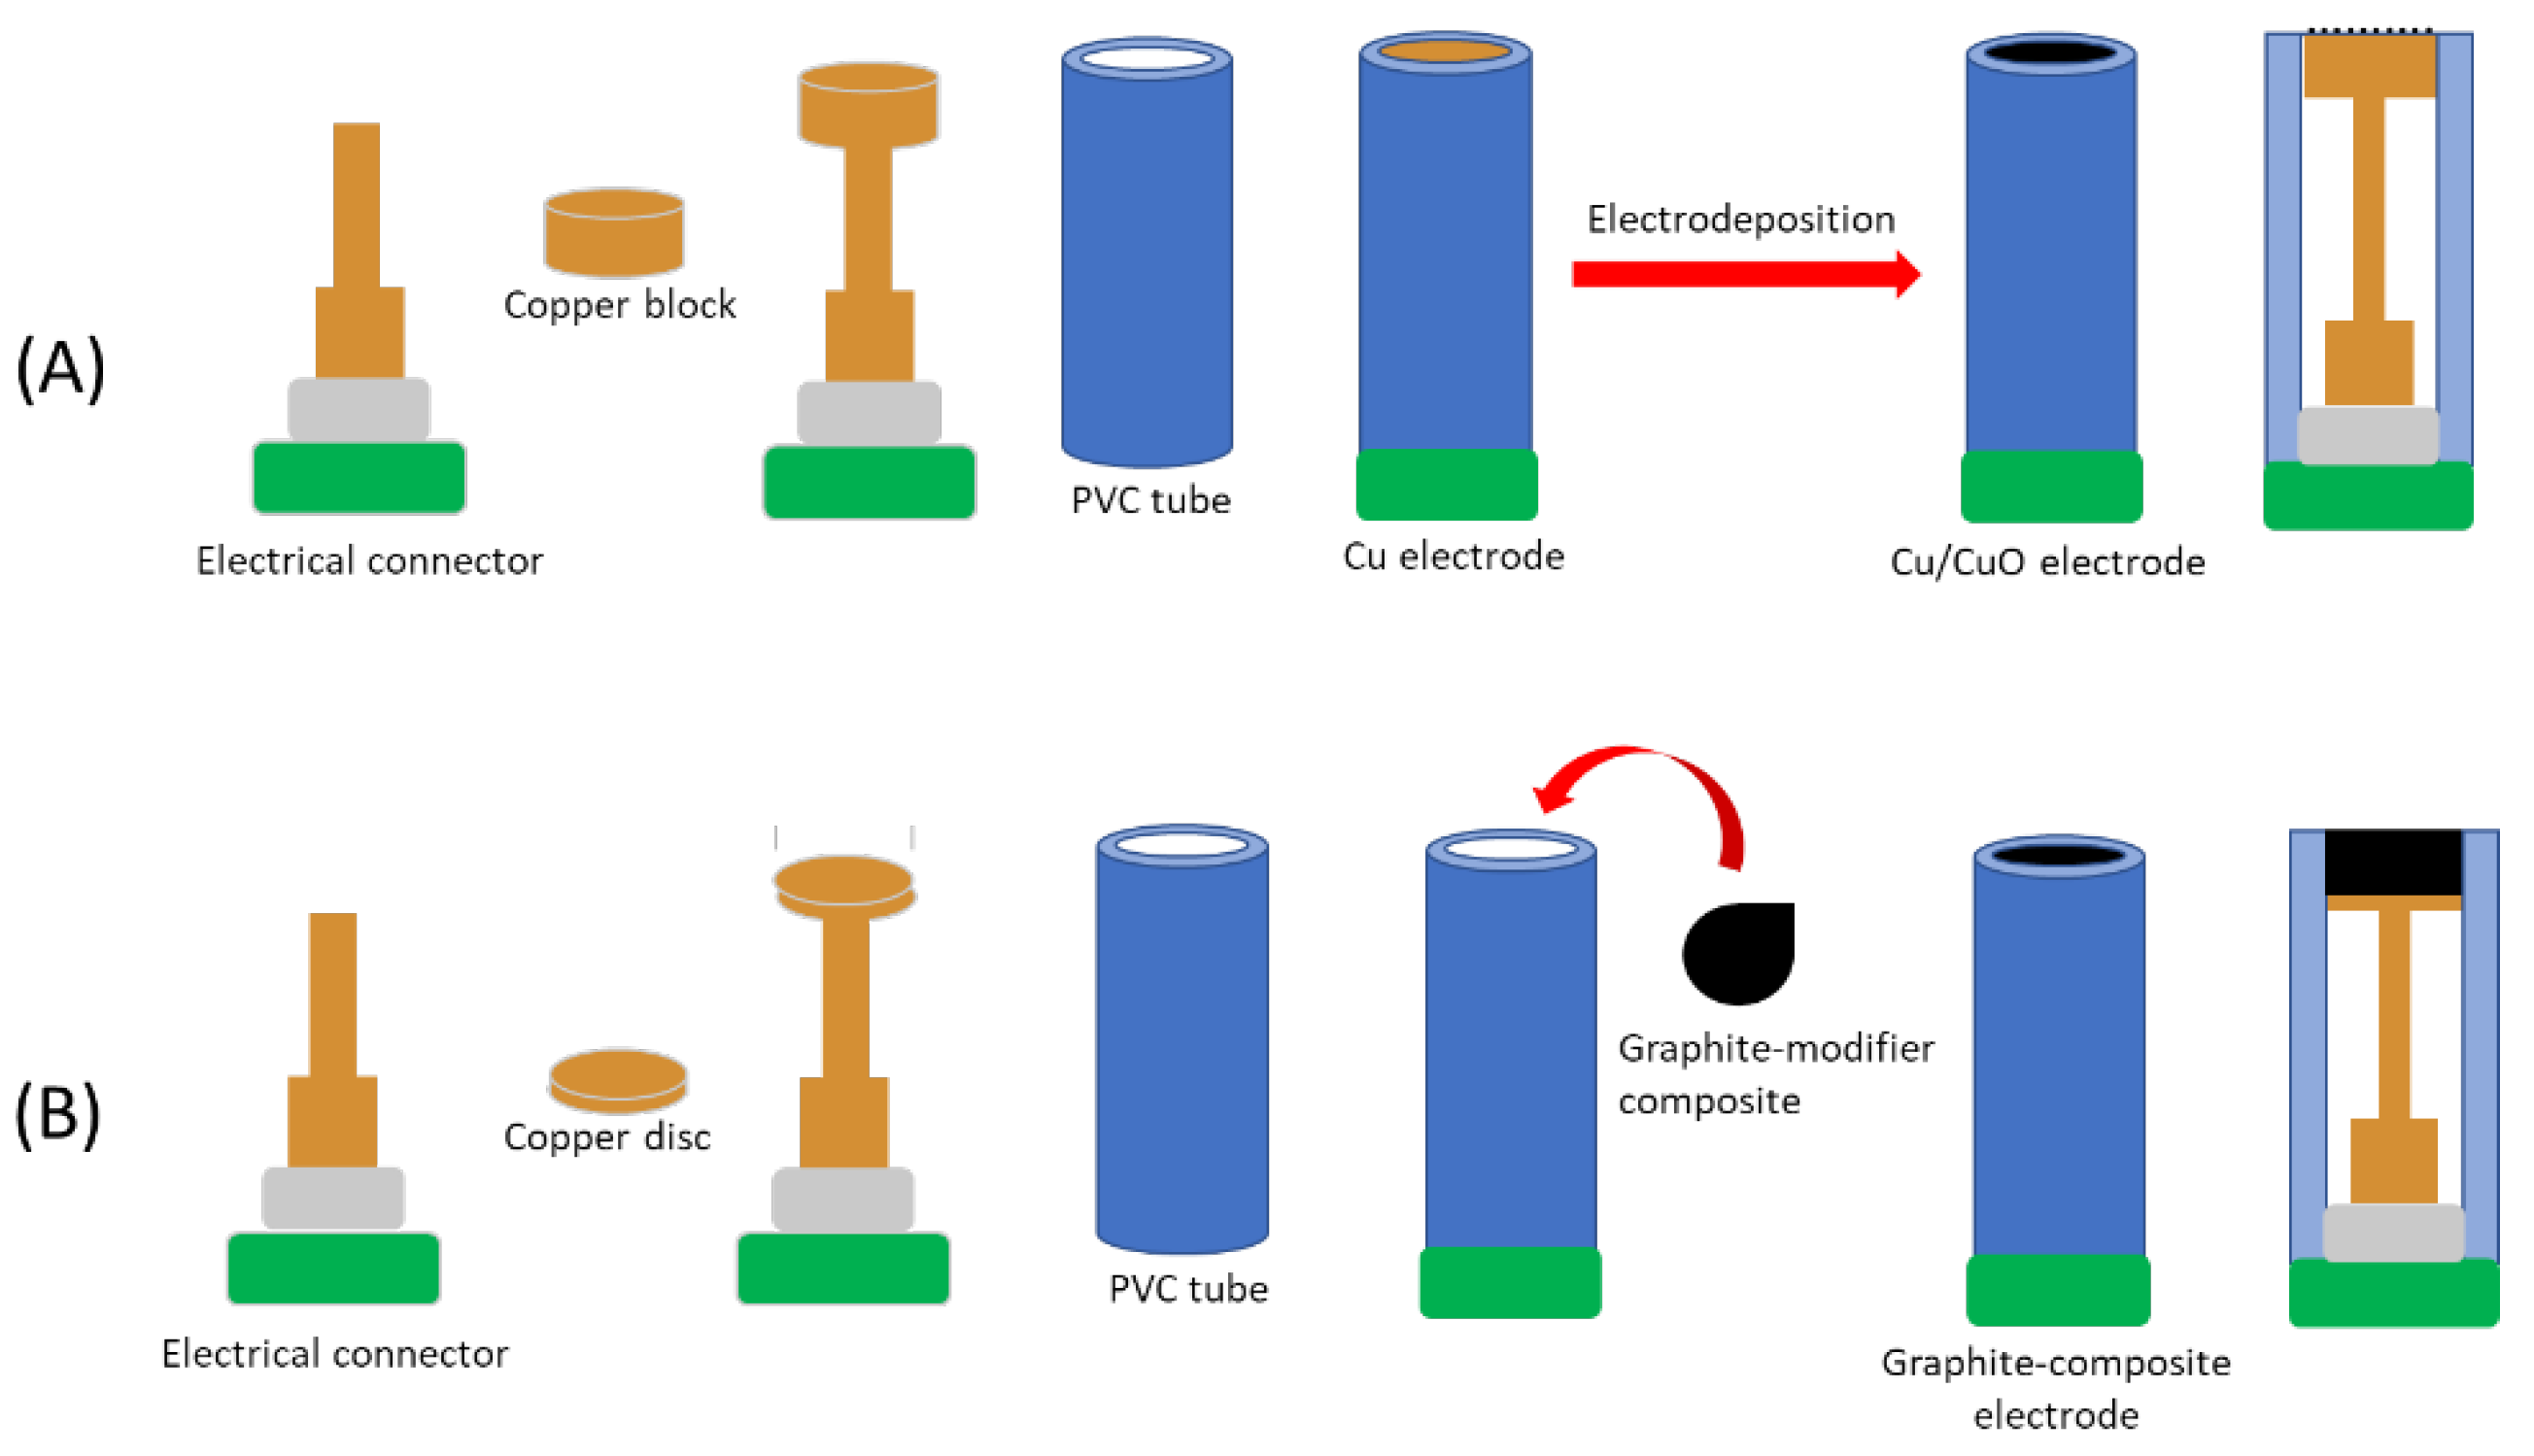
Electrode E1 is a Nafion-covered electrodeposited CuO/Cu electrode. To fabricate E1, as shown in Figure 1A, a copper block, 5 mm in diameter and 4 mm long, was soldered to an electrical connector. Then, this couple was inserted into a 20 mm long PVC tube, 6 mm in diameter, wrapped with H77 epoxy resin and cured for 24 h in an oven at 80 °C. Then, the surface of the electrode was polished with emery papers of decreasing grain size and alumina powder (1.0, 0.3 and 0.05 micron). Then, the final glossy and smooth surface was obtained and thoroughly rinsed with deionized water. After thoroughly rinsing with deionized water and drying, then, 10 microliters of Nafion was dropped on the electrode surface and keep it in air for 48 h, and then all the solvents were volatilized. The electrochemical deposition was conducted in a solution of 0.05 mol∙L−1 NaOH solution with cycling potential from −0.1 to +0.8 V for 50 times, and a dark film formed on the surface, which consists of copper oxide (CuO) nanoparticles.
2.3.2. Fabrication of Electrodes E2, E3, and E4
Electrodes E2, E3, and E4 are graphite-modifier (metal nanoparticles)–epoxy resin composite electrodes, and the modifiers are copper (Cu), copper oxide (CuO), and nickel copper alloy (Ni Cu alloy) nanoparticles, respectively. To fabricate the electrodes, as shown in Figure 1B, a copper disk (5 mm diameter) was soldered to an electrical connector. Then, the couple was inserted into a 20 mm long PVC tube, and a 4 mm deep cylinder cavity was formed. The cavity was filled with different paste composites, consisting of 54% graphite, 5% modifier, the corresponding epoxy resin, and hardener. This ratio of the components in the composite and the amounts of modifiers were inspired by the reported works in our laboratory [23,24]. Then, these electrodes were cured at 40 ℃ for 48 h. Electrode surfaces were polished with emery paper of decreasing sizes and rinsed with deionized water. Finally, electrodes E2, E3, and E4 with shiny and smooth surfaces were obtained.
2.4. Electrochemical Measurements
2.4.1. Cyclic Voltammetric Response
Four different organic compounds with different reducibility, glucose, glycine, ethylene glycol, and potassium hydrogen phthalate were used as COD standard substances to evaluate the performance of the prepared sensors. The voltammetric responses of electrodes to those standard substances were conducted individually in 0.05 M NaOH background electrolyte solution, since this media is needed for the catalytic copper operation. This electrolyte was inspired by reported works [15,16]; we reduced slightly the NaOH concentration to 0.05 mol∙L−1. The reason for that was to enhance the stability of the sensors and also enlarge the lifetime of the devices in a milder condition. Each cyclic voltammogram was recorded after a specific volume of standard solution was added into the electrolyte solution and stirred for 20 s. The cyclic voltammograms were recorded at a scan rate of 50 mV·s−1 by cycling the potential between 0 and +1.0 V vs. Ag/AgCl in room temperature. These standard solutions of glucose, ethylene glycol, and glycine are 0.1 mol∙L−1 (0.1 M) in concentration. The standard potassium hydrogen phthalate (KHP) solution is 0.05 M in concentration because of the lower solubility. All of these solutions are prepared using ultrapure water purified by a Milli-Q system.
2.4.2. Reproducibility Study
To check the stability of the electrodes, the reproducibility tests were carried out in a 2.15 mmol∙L−1 (2.15 mM) glucose in 0.05 M NaOH solution and a blank electrolyte solution (0.05 M NaOH). The cyclic voltammograms were recorded at a scan rate of 50 mV·s−1 by cycling the potential between 0 and +1.0 V vs. Ag/AgCl in room temperature. Ten cyclic voltammetric responses of these electrodes to the glucose and blank electrolyte solutions were carried out repeatedly in parallel. This permitted us to evaluate the stability of the responses, and if any hysteresis or memory effect was present. Before each sample measurement, these electrodes were rinsed with deionized water.
2.5. Measurements of Real Water Samples
Sample 1: This sample was originally taken from an effluent of an agricultural field in Gavà, Spain. The original pesticide concentration was really low (less than 0.5 ppm). Then, two pesticides (diuron and bentazon) were spiked to 10 ppm. Then, the sample was obtained after being treated by a fungal treatment process (Trametes versicolor fungus) for 93 days. The pesticide concentrations should be in the range of 5–10 ppm. The COD value of the sample was detected as 1312 mg O2·L−1 using the sealed tube method.
Sample 2: This sample was obtained from effluent generated in typical post-treatments to wash agricultural equipment and machines after their use and without any other process. In this case, the initial concentration of pesticides is much higher, 1–100 ppm. The COD value of the sample was detected as 2088 mg O2·L−1 using the sealed tube method.
Sample 3: This sample was originally taken from a stream very near to a farm in Lleida, Spain and without any other process. The COD value of its clean, surface water was unknown.
To conduct the measurements and analysis of real water samples, 100 μL of each real water sample was added into 20 mL 0.05 mol∙L−1 NaOH solution to be a test solution. Electrodes were submerged in the test solution and submitted to a cycling potential between 0 and +1 V vs. Ag/AgCl. The cyclic voltammograms were recorded at a scan rate of 50 mV·s−1 under room temperature. Then, the test solutions of Sample 1 and 2 were spiked with 40 μL 0.1 mol∙L−1 glucose solution and were measured in the same way after being stirred for 30 s, respectively.
3. Results and Discussion
3.1. Voltammetric Array Response
As the departure point shows, our aim in this study is to estimate the organic load of water samples with electronic tongue tools. In this sense, the first step was to check if the electronic tongue sensor array was properly built. For this, the voltammetric response of each electrode toward the different COD reference substances was analyzed as the first step to check the diversity of the generated signals and whether the obtained data were informative and rich enough to build a multivariate multiway calibration model. In this work, four organic substances of different reducibility, glucose, glycine, ethylene glycol, and potassium hydrogen phthalate (KHP) were used as COD standard substances. Glucose and KHP are the representatives of substances that are easy and hard to be oxidized in water samples, respectively.
The voltammetric electronic tongue array consists of four sensors, and the three-electrode system was built with a Pt auxiliary and an Ag/AgCl (KCl 3M) reference electrode for cyclic voltammetric measurements. The array consists of one electrodeposited CuO/Cu electrode E1 and three composite electrodes; the latter were bulk-modified with Cu nanoparticles (E2), CuO nanoparticles (E3), and NiCu alloy nanoparticles (E4), respectively, and were prepared as described in Section 2.3. This choice was aimed at maximizing the observed differences in the obtained voltammograms for the different sensors, taking advantage of the catalytic effects shown by the used metals and the reactive properties boosted by the nanoparticulate material. In the supplementary information, as shown in Figure S1, the scanning electron microscopy image of electrode E1 shows the particles electrogenerated on the Cu surface, with electron dispersive spectroscopy (EDS) demonstrating ca. 80% of the nanostructure seen in Cu (Figure S2 and Table S1). Compared with the SEM image of bare copper, we can see that the CuO nanoparticles spread over the electrode, and the surface looks rough and very different from the bare copper surface. The modifiers of electrodes E2, E3, and E4 are also perceptible from the SEM images shown in Figure S3 (supporting information).
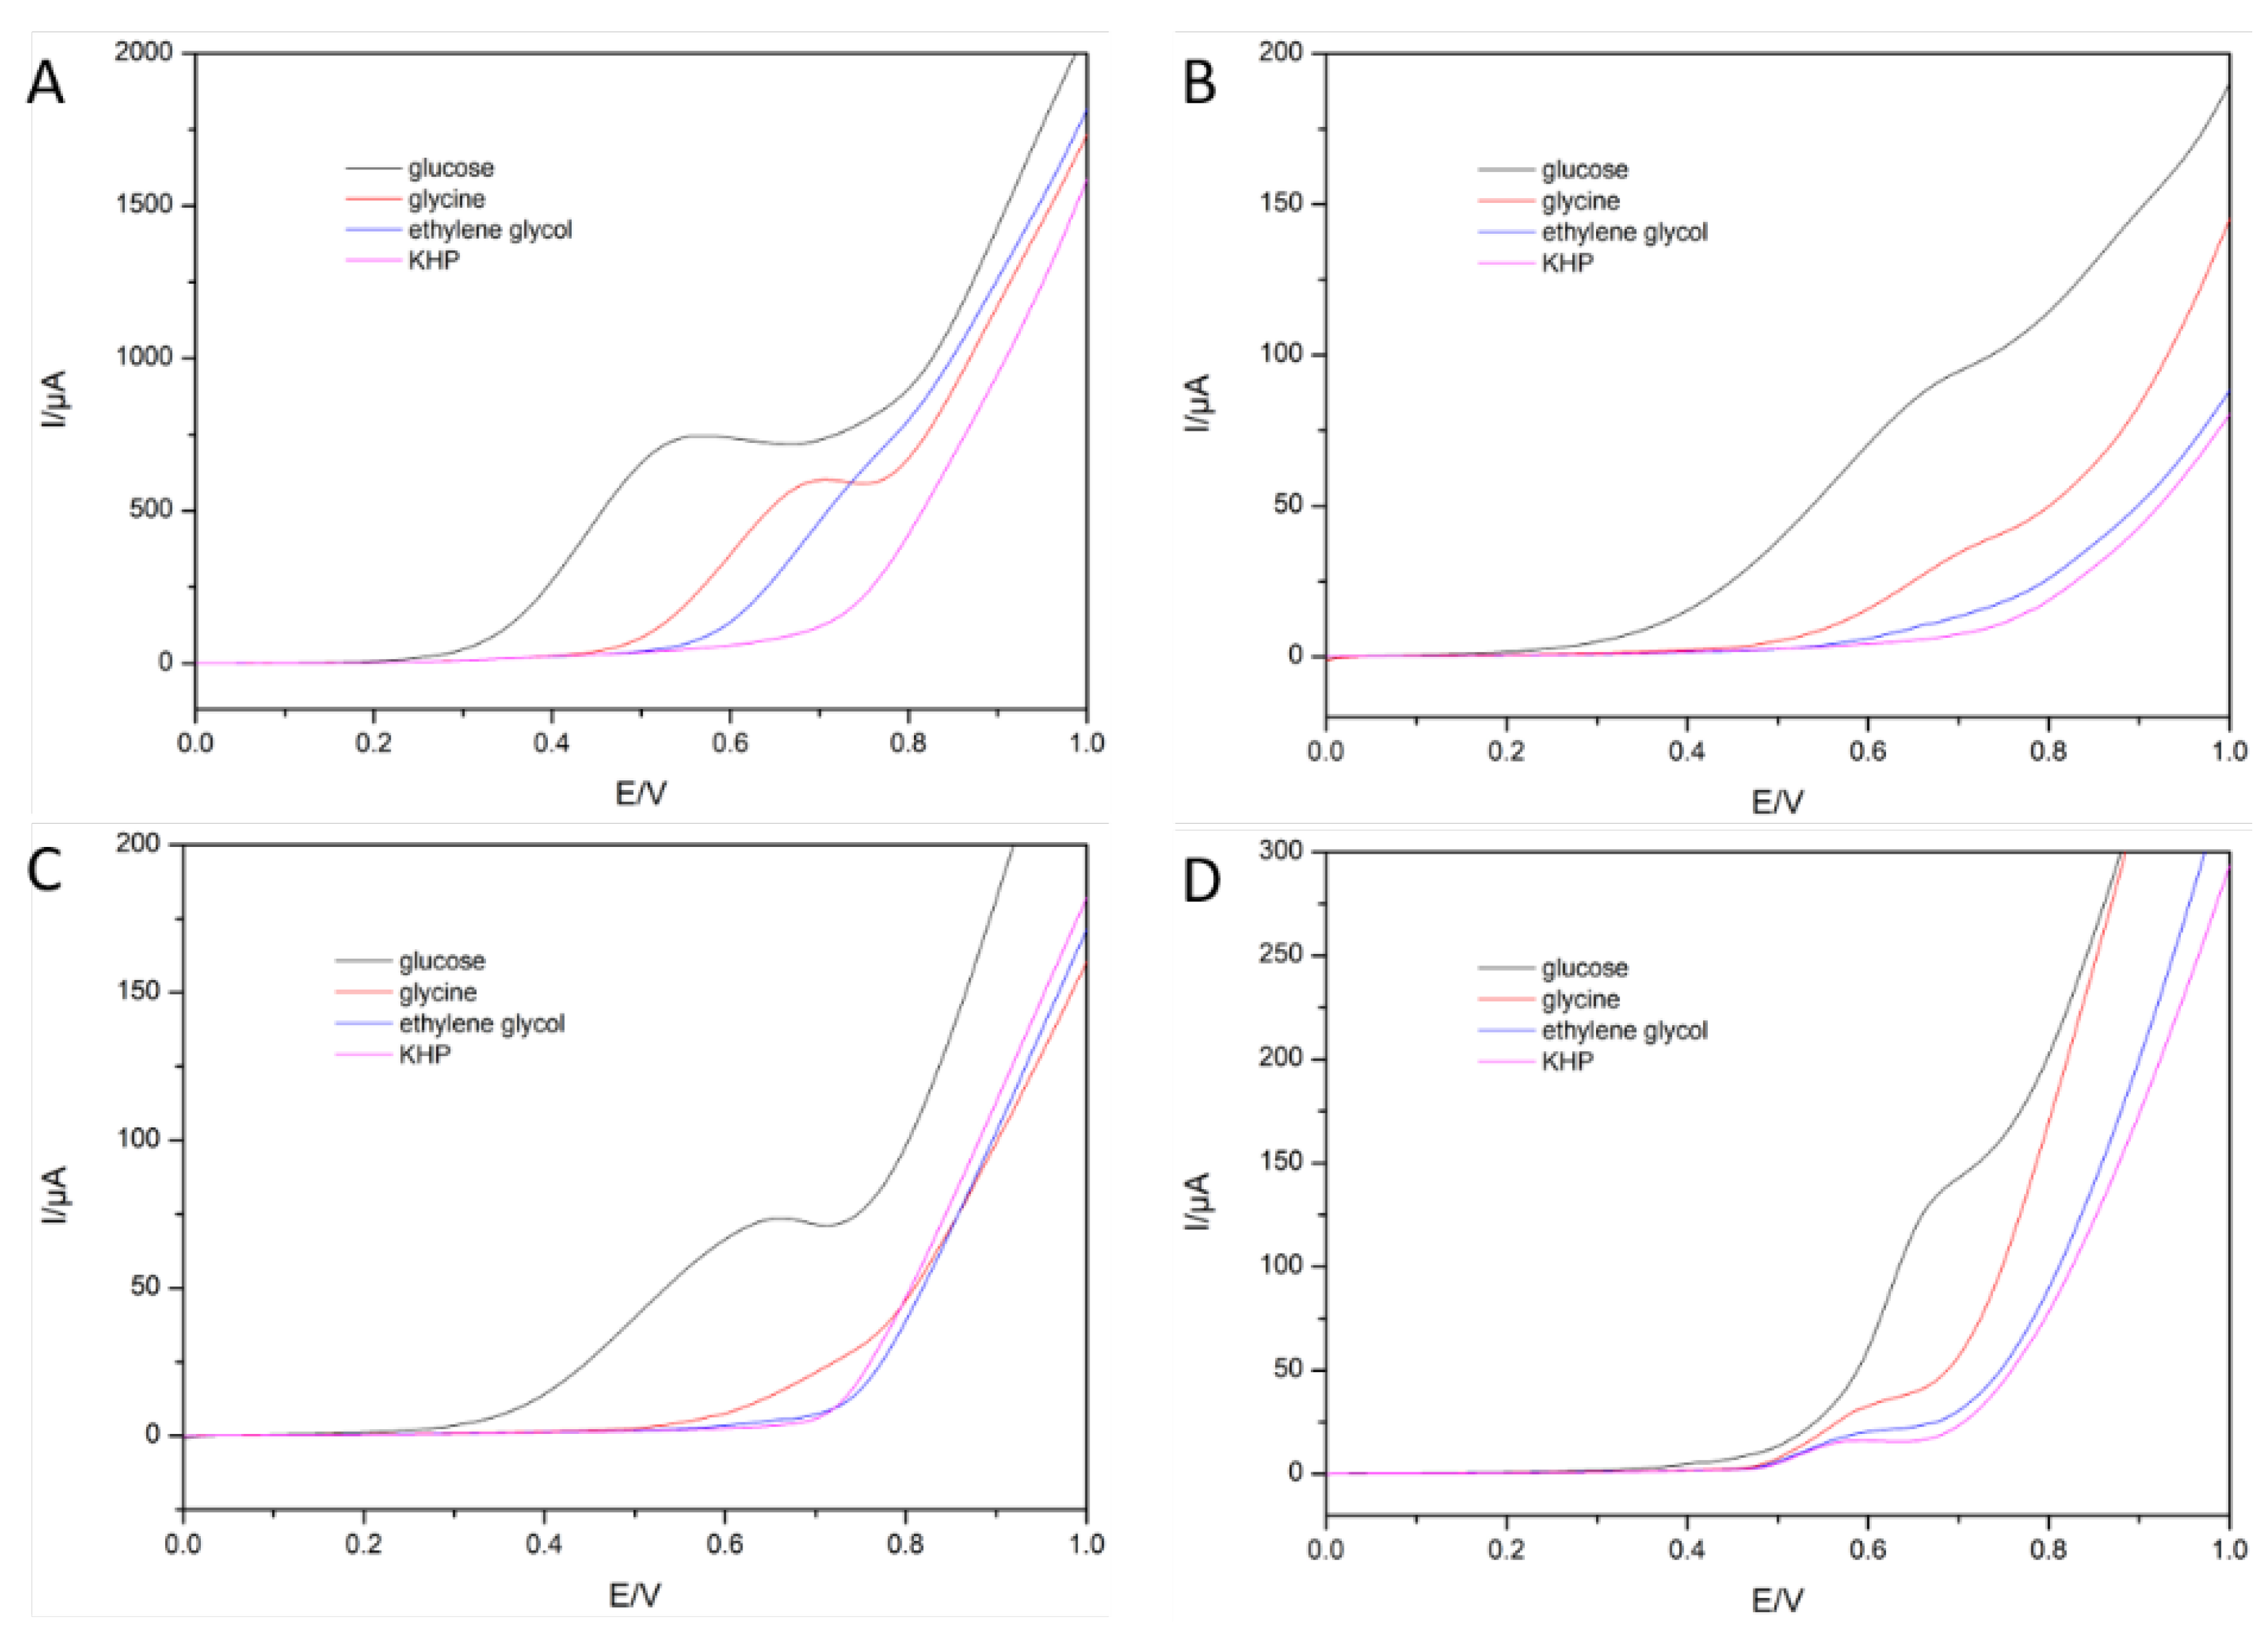
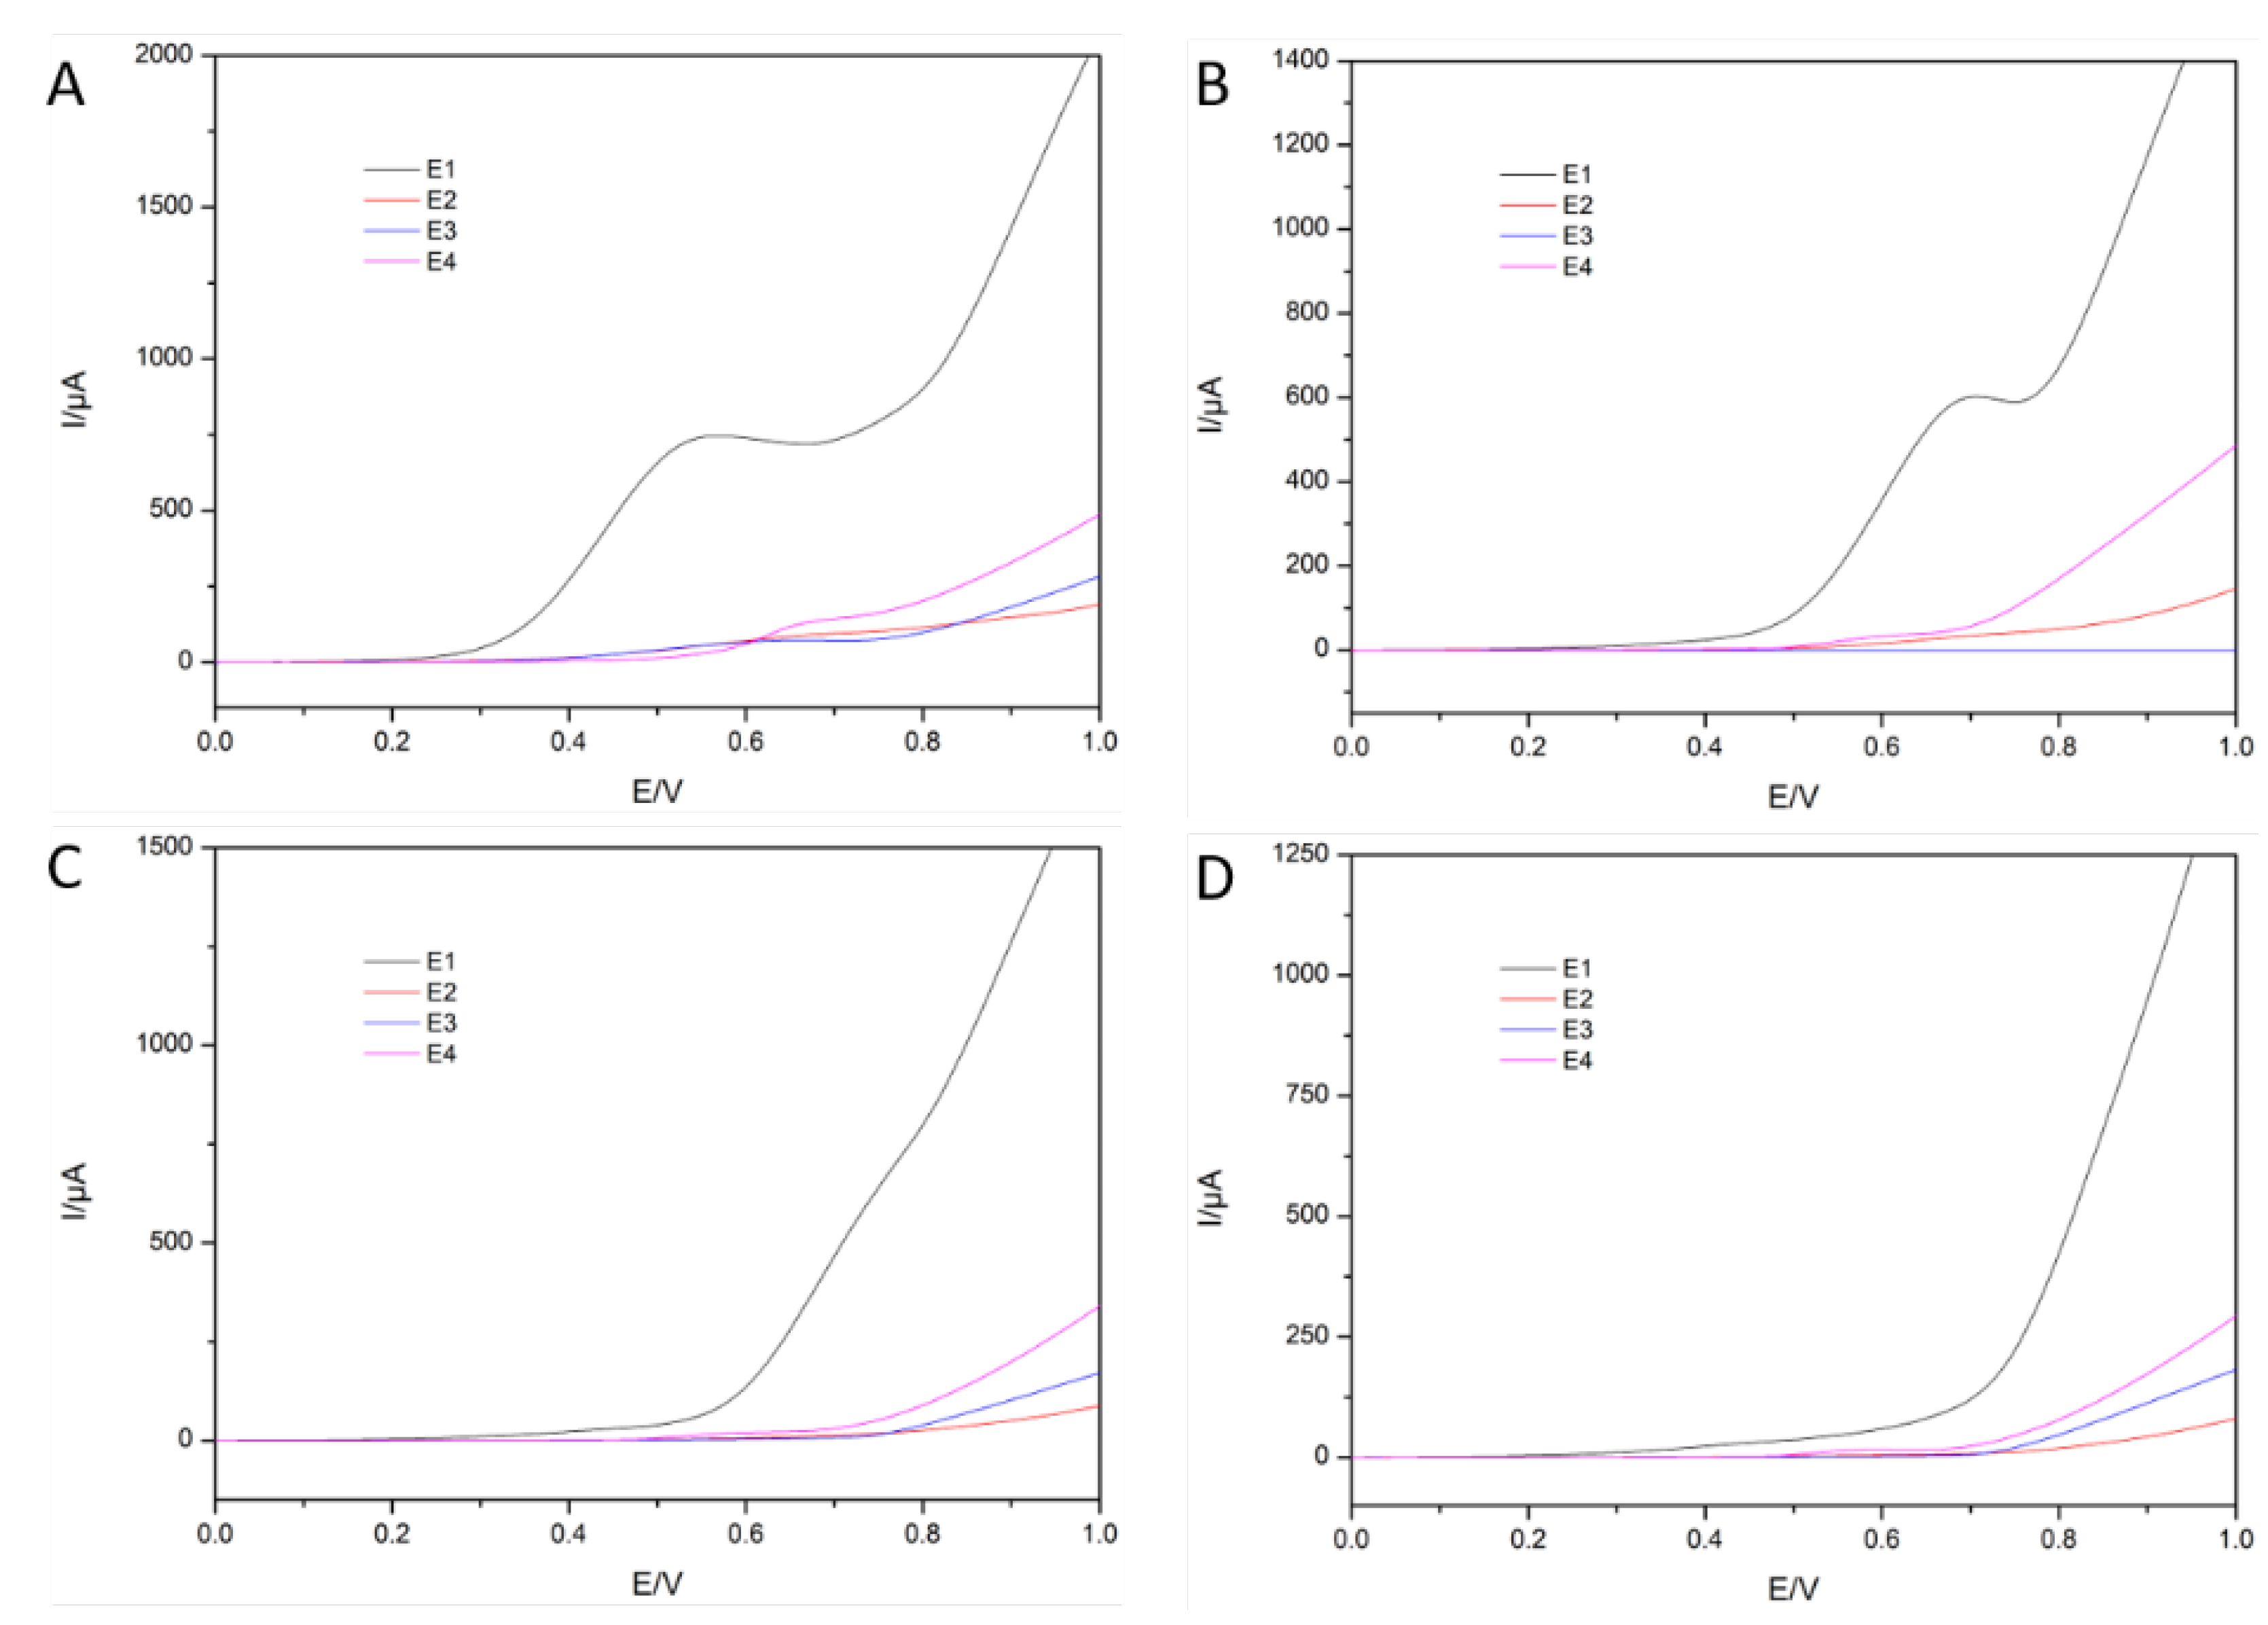
Cyclic voltammetric responses of fabricated electrodes to standard substances were measured as described in Section 2.4.1. The 0.05 M NaOH solution was chosen to be the background electrolyte to provide an alkaline environment for electrochemical measurements. The obtained oxidation parts of cyclic voltammograms are shown in Figure 2 and Figure 3. The figures show the voltammogram shapes of the four substances tested, with the four electrodes E1 to E4, where we can see that the different signals originated by the reference substances are different. Figure 3 represents the voltammograms but groups them in terms of the electrodes used. As we can see from these figures, the oxidation curves of the four electrodes show different shapes toward different substances, which is very useful for the following electronic tongue analysis. In addition, the different electrodes employed also display different signals for the compounds assayed; in there, electrode E1 gets higher current signals than the other electrodes, and it can make many organic compounds oxidized. Unfortunately, the KHP substance is very hard to be oxidized with these four electrodes, but this is a fact that can be also assessed from these measurements.
To demonstrate the enhanced performance of the deposited electrode E1, the active surface areas of the four electrodes were calculated according to the Randles–Sevcik Equation (1) [25,26], in which n is the number of electrons involved in the redox reaction, F is the Faraday’s constant (96,485 C∙mol−1), A is the electrode active area in cm−2, c is the concentration of electroactive substance (mol∙cm−3), v is the scan rate (V∙s−1 ), R is the gas constant (8.314 J∙mol−1·K−1), T is the temperature in K, and D is the analyte diffusion coefficient (6.32∙10−6∙cm−2∙s−1). Seven cyclic voltammograms of each electrode at different scan rates (10, 25, 50, 100, 200, 300, and 500 mV∙s−1) were recorded in the solution of 5 mmol∙L−1 [Fe(CN)6]3−/4−. The values of the active area of the electrodes could be calculated from the slope of the fitted line of vs. Ip/c graph. The calculated active areas were 139.23 mm2 for E1, 29.10 mm2 for E2, 31.09 mm2 for E3, and 35.65 mm2 for E4, whereas the geometric area was 28.27 mm2 (Ø = 6 mm). These results confirm the correct modification of the electrodes. The active area of E1 is about five times that of the other electrodes, which demonstrates the good function of deposited CuO nanoparticles for improving the electrode performance.
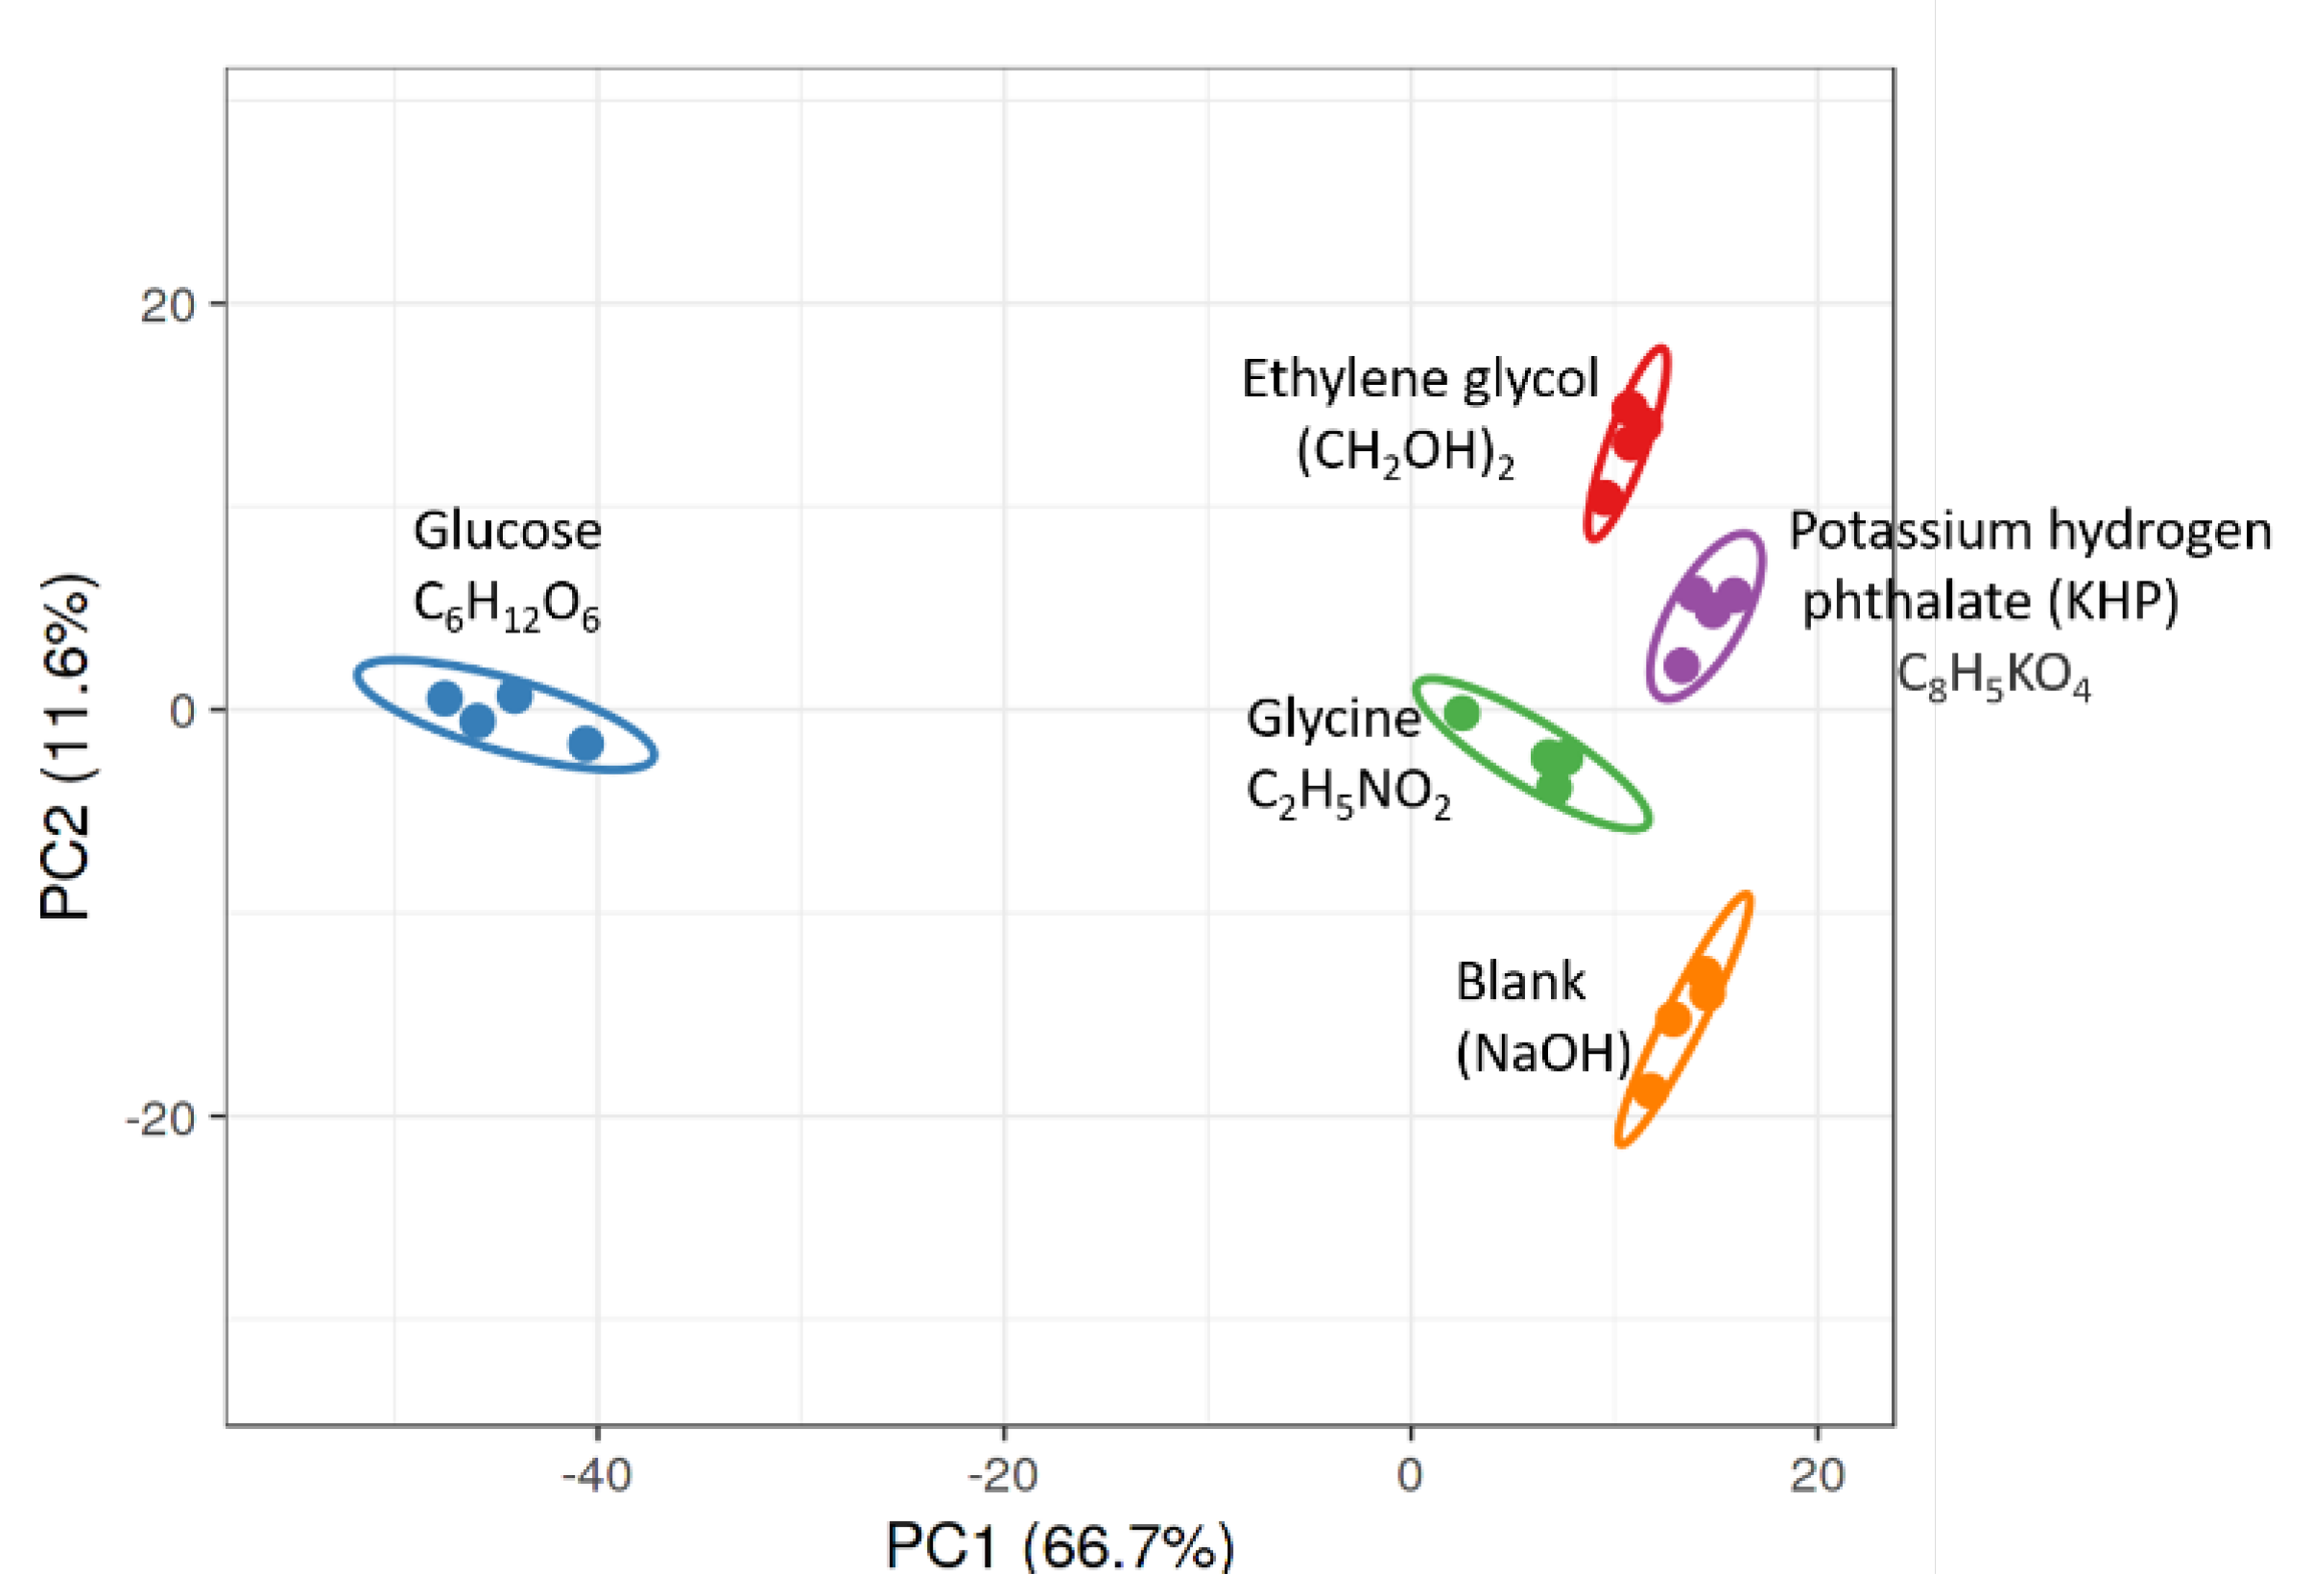
However, it is tedious to compare each cyclic voltammogram to assess the responding patterns of the electrodes, and multivariate analysis can be of help. In order to show the result visually, a complementary principal component analysis (PCA) was conducted. To do this study, different replicates at the above specified concentrations were measured and inspected by PCA to observe similitudes between samples. In Figure 4, we present the simplified representation of samples through the scores corresponding to the two first principal components for the array response; this has been prepared for the four standard substances. That is, we composed an unfolded vector formed by the four measured voltammograms in order to perform the calculation. In there, each compound sample is differentiated and clearly clustered. From the figure, we can see that glucose, which is easy to be oxidized, is much more left than other substances. Oppositely, KHP, which is hard to be degraded, is much more right. In this sense, PCA is informing the organic load that is detected (the PC2 axis is mainly related to this), and the type of compound, i.e., the difficulty of degradation can be also differentiated (PC1 axis).
3.2. Calibration Curves
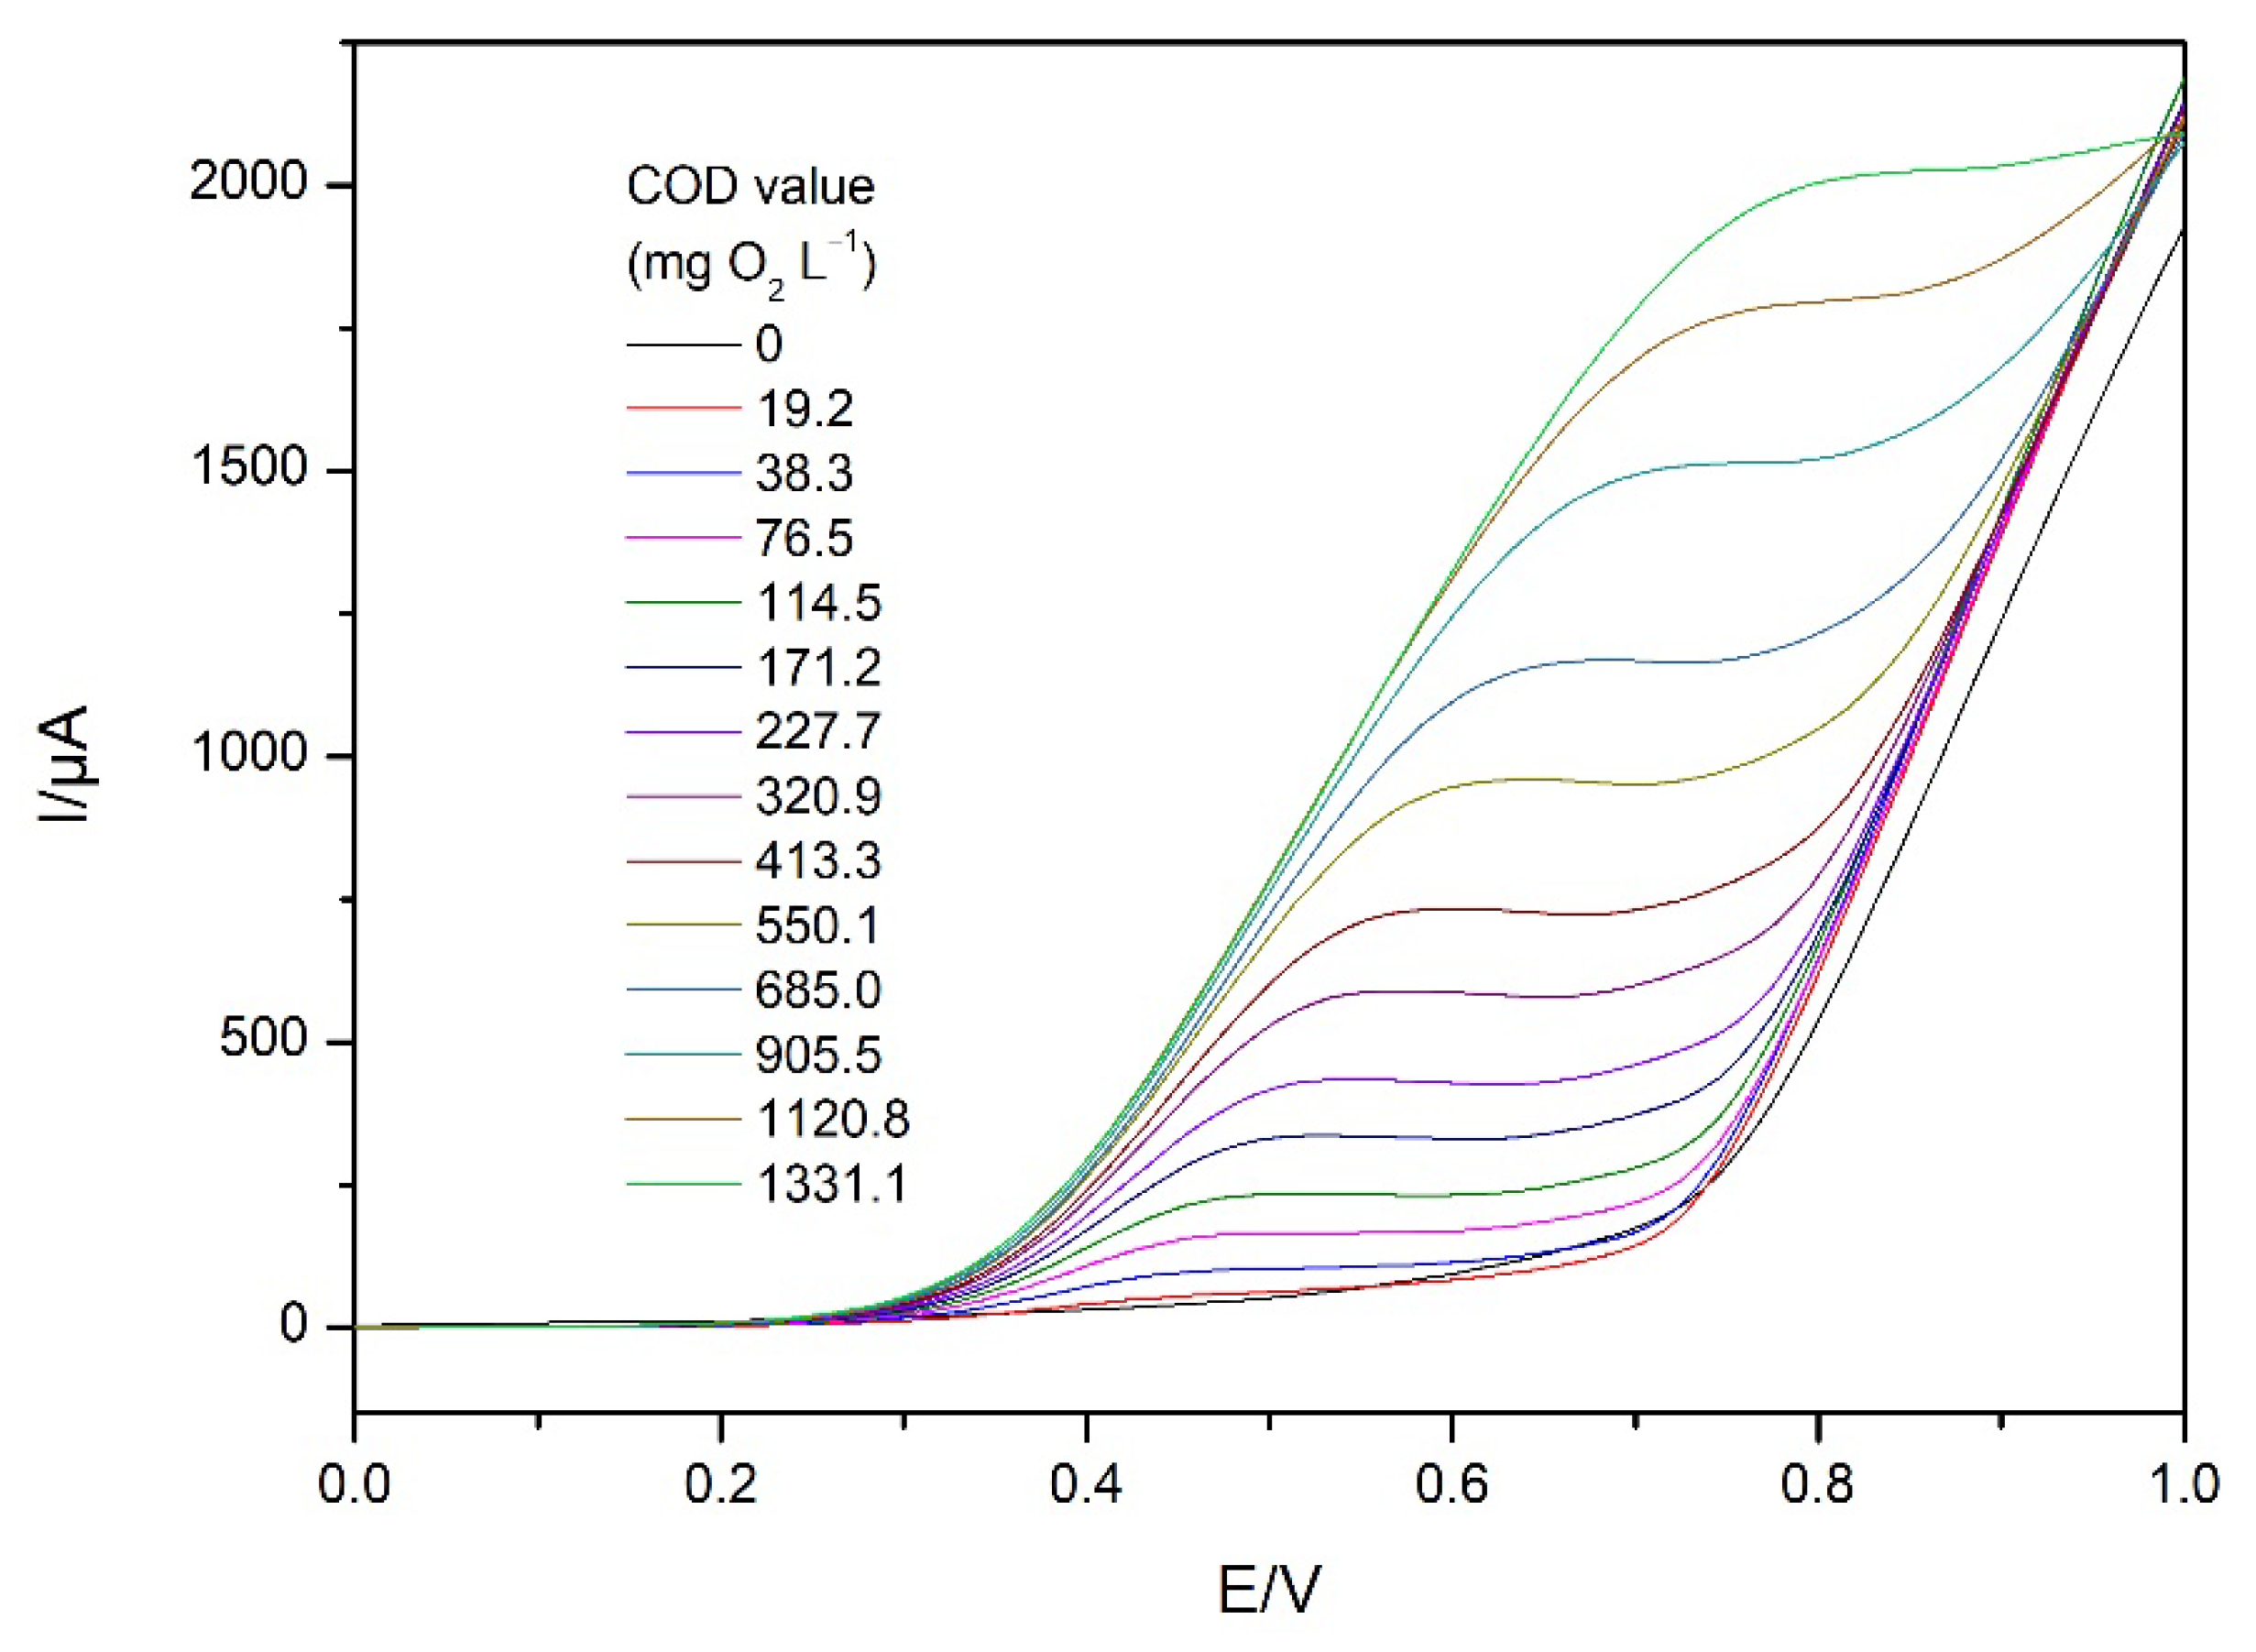
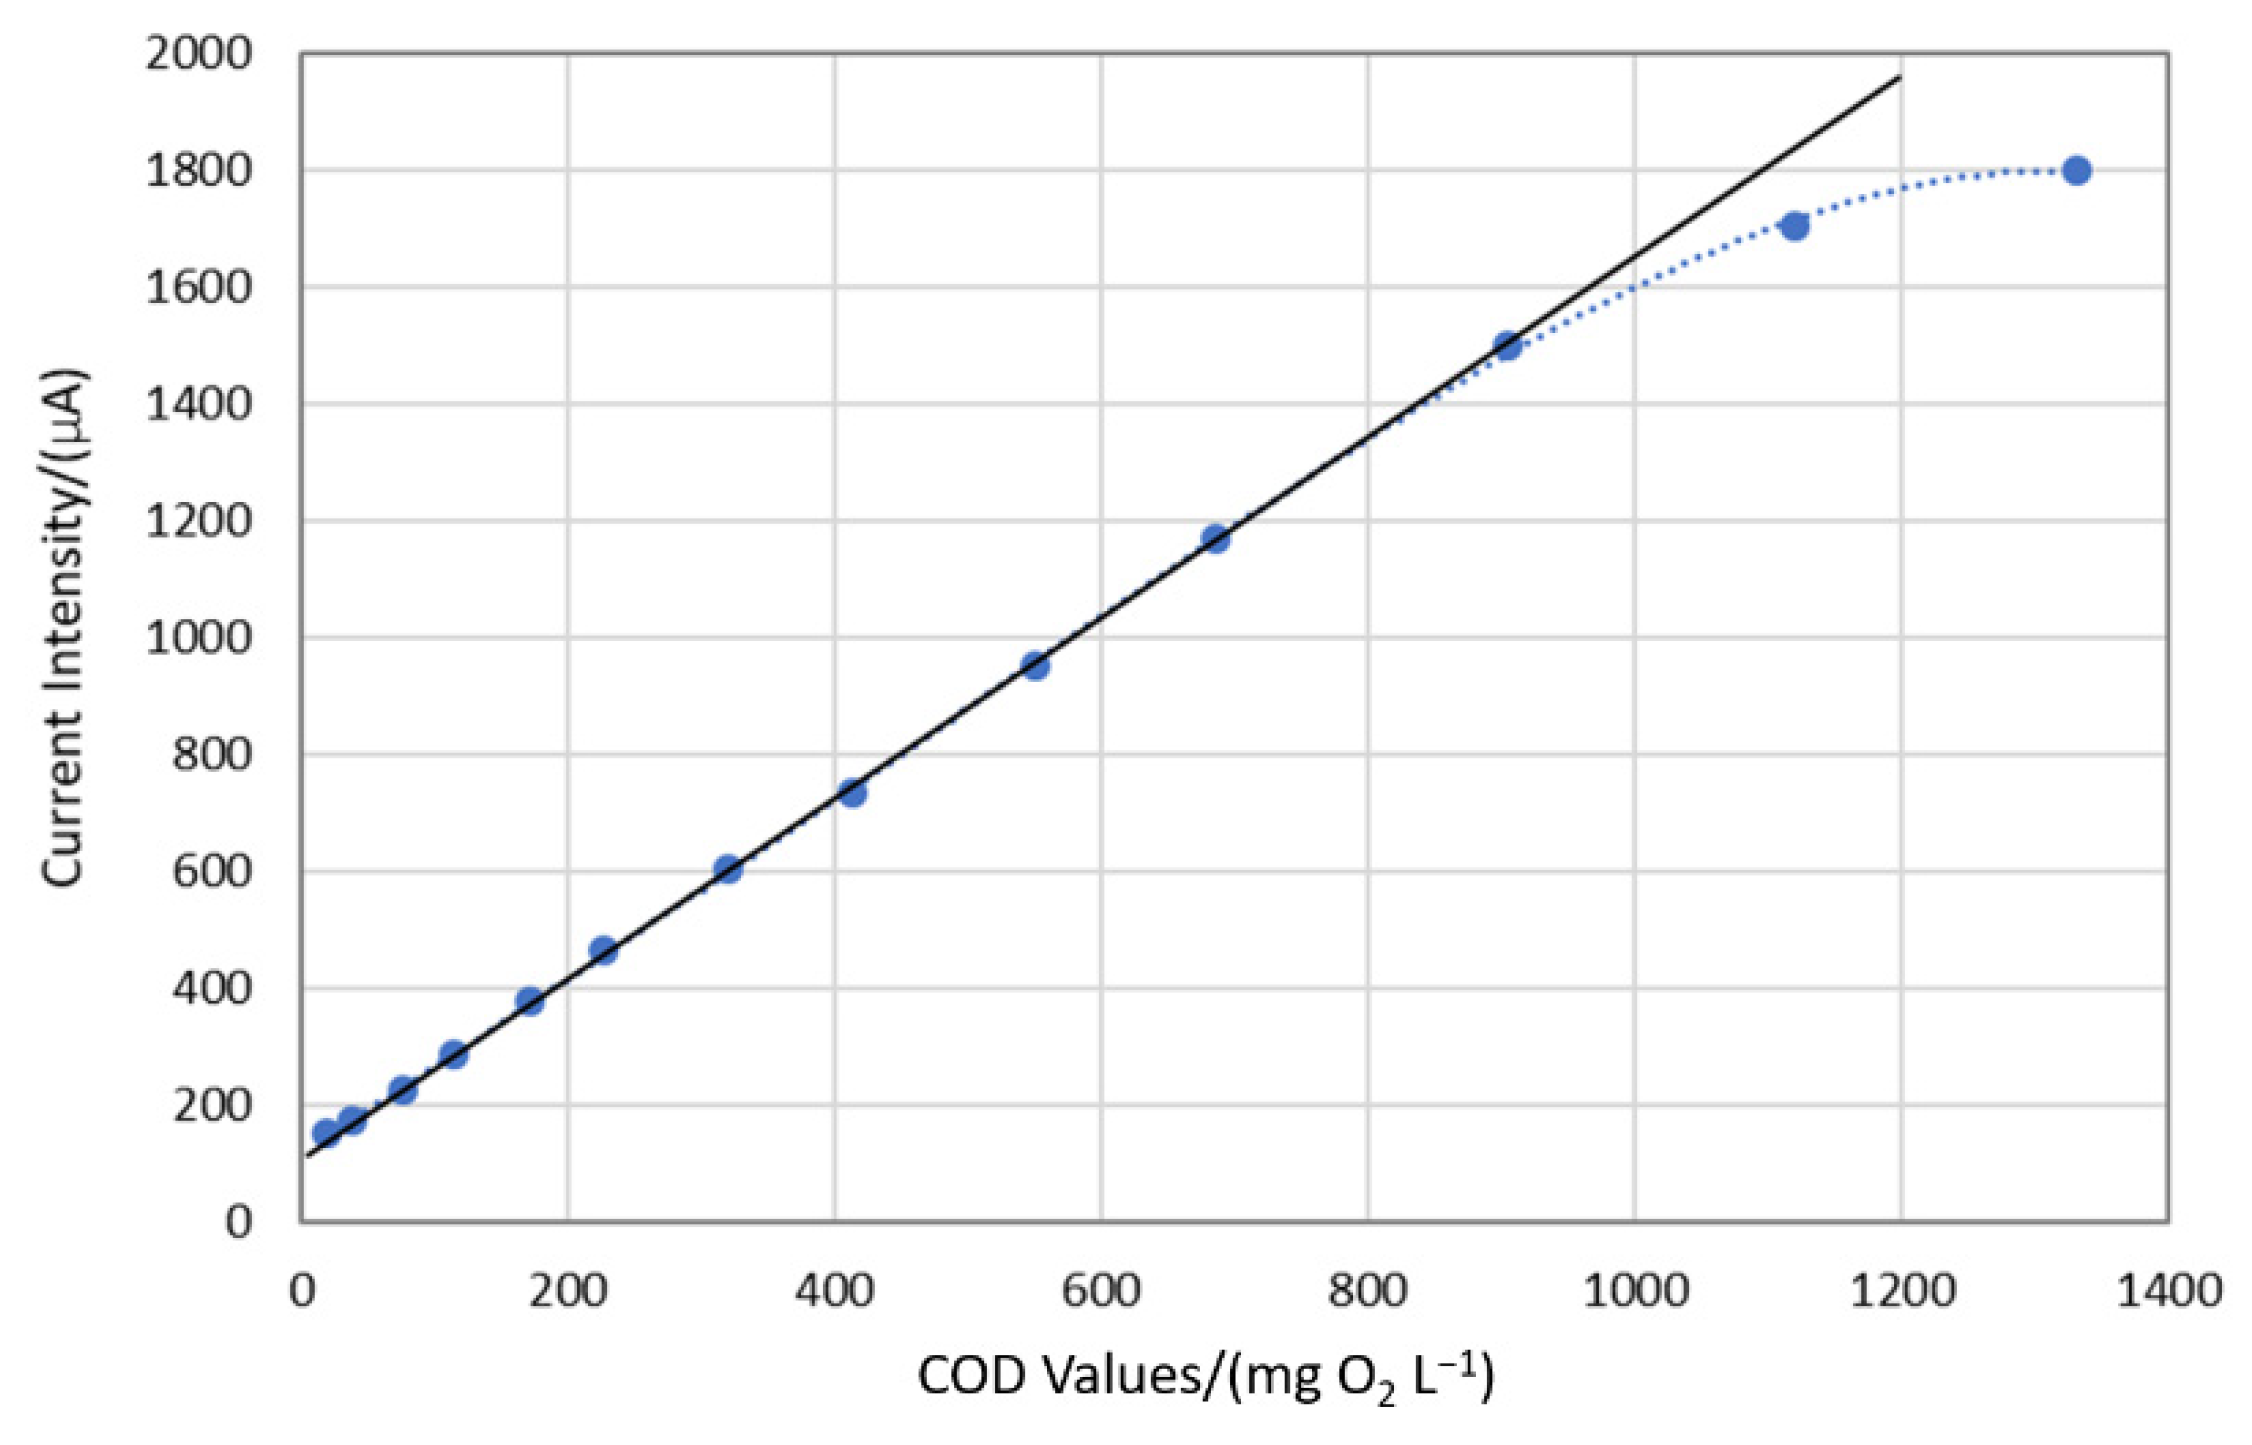
To evaluate the behavior of each electrode toward each standard substance, some calibration curves were studied based on the cyclic voltammetry technique. The voltammograms of the four electrodes responding to the four standard substances in increasing concentration are shown in Figures S3–S6, supplementary information. As shown in these figures, these electrodes show different oxidation capabilities to different substances. The corresponding theoretical COD values were obtained based on the consumed oxygen calculated according to chemical equations. Based on the increasing tendency of current intensity, some calibration equations of current intensity at +0.70 V vs. COD values were obtained as shown in Table 1. These calibration equations are different because of the different capabilities of different electrodes toward different substances. The electrode E1 shows higher current signals to these substances, especially to glucose. As can be seen in Figure 5, the current intensity at +0.70 V can be used as the magnitude proportional to the concentration of glucose; corresponding currents were plotted (see Figure 6) and fitted by least squares (y = m·x + b) with a linear range from 19.20 to 905.5 mg O2·L−1 and a regression equation I (μA) = 1.5281∙COD+112.75 (R2 = 0.9999). Limit of detection values were calculated as 12.3 mg O2·L−1 (using the formula of 3.3Sy/x/m), which improves data from some of the reported electrodes in the literature.
In comparison with other reported electrodes for COD determination appearing in the literature, as shown in Table 2, the electrode E1 in this work shows a good limit of detection, linear range, and high response signals.
3.3. Reproducibility Study
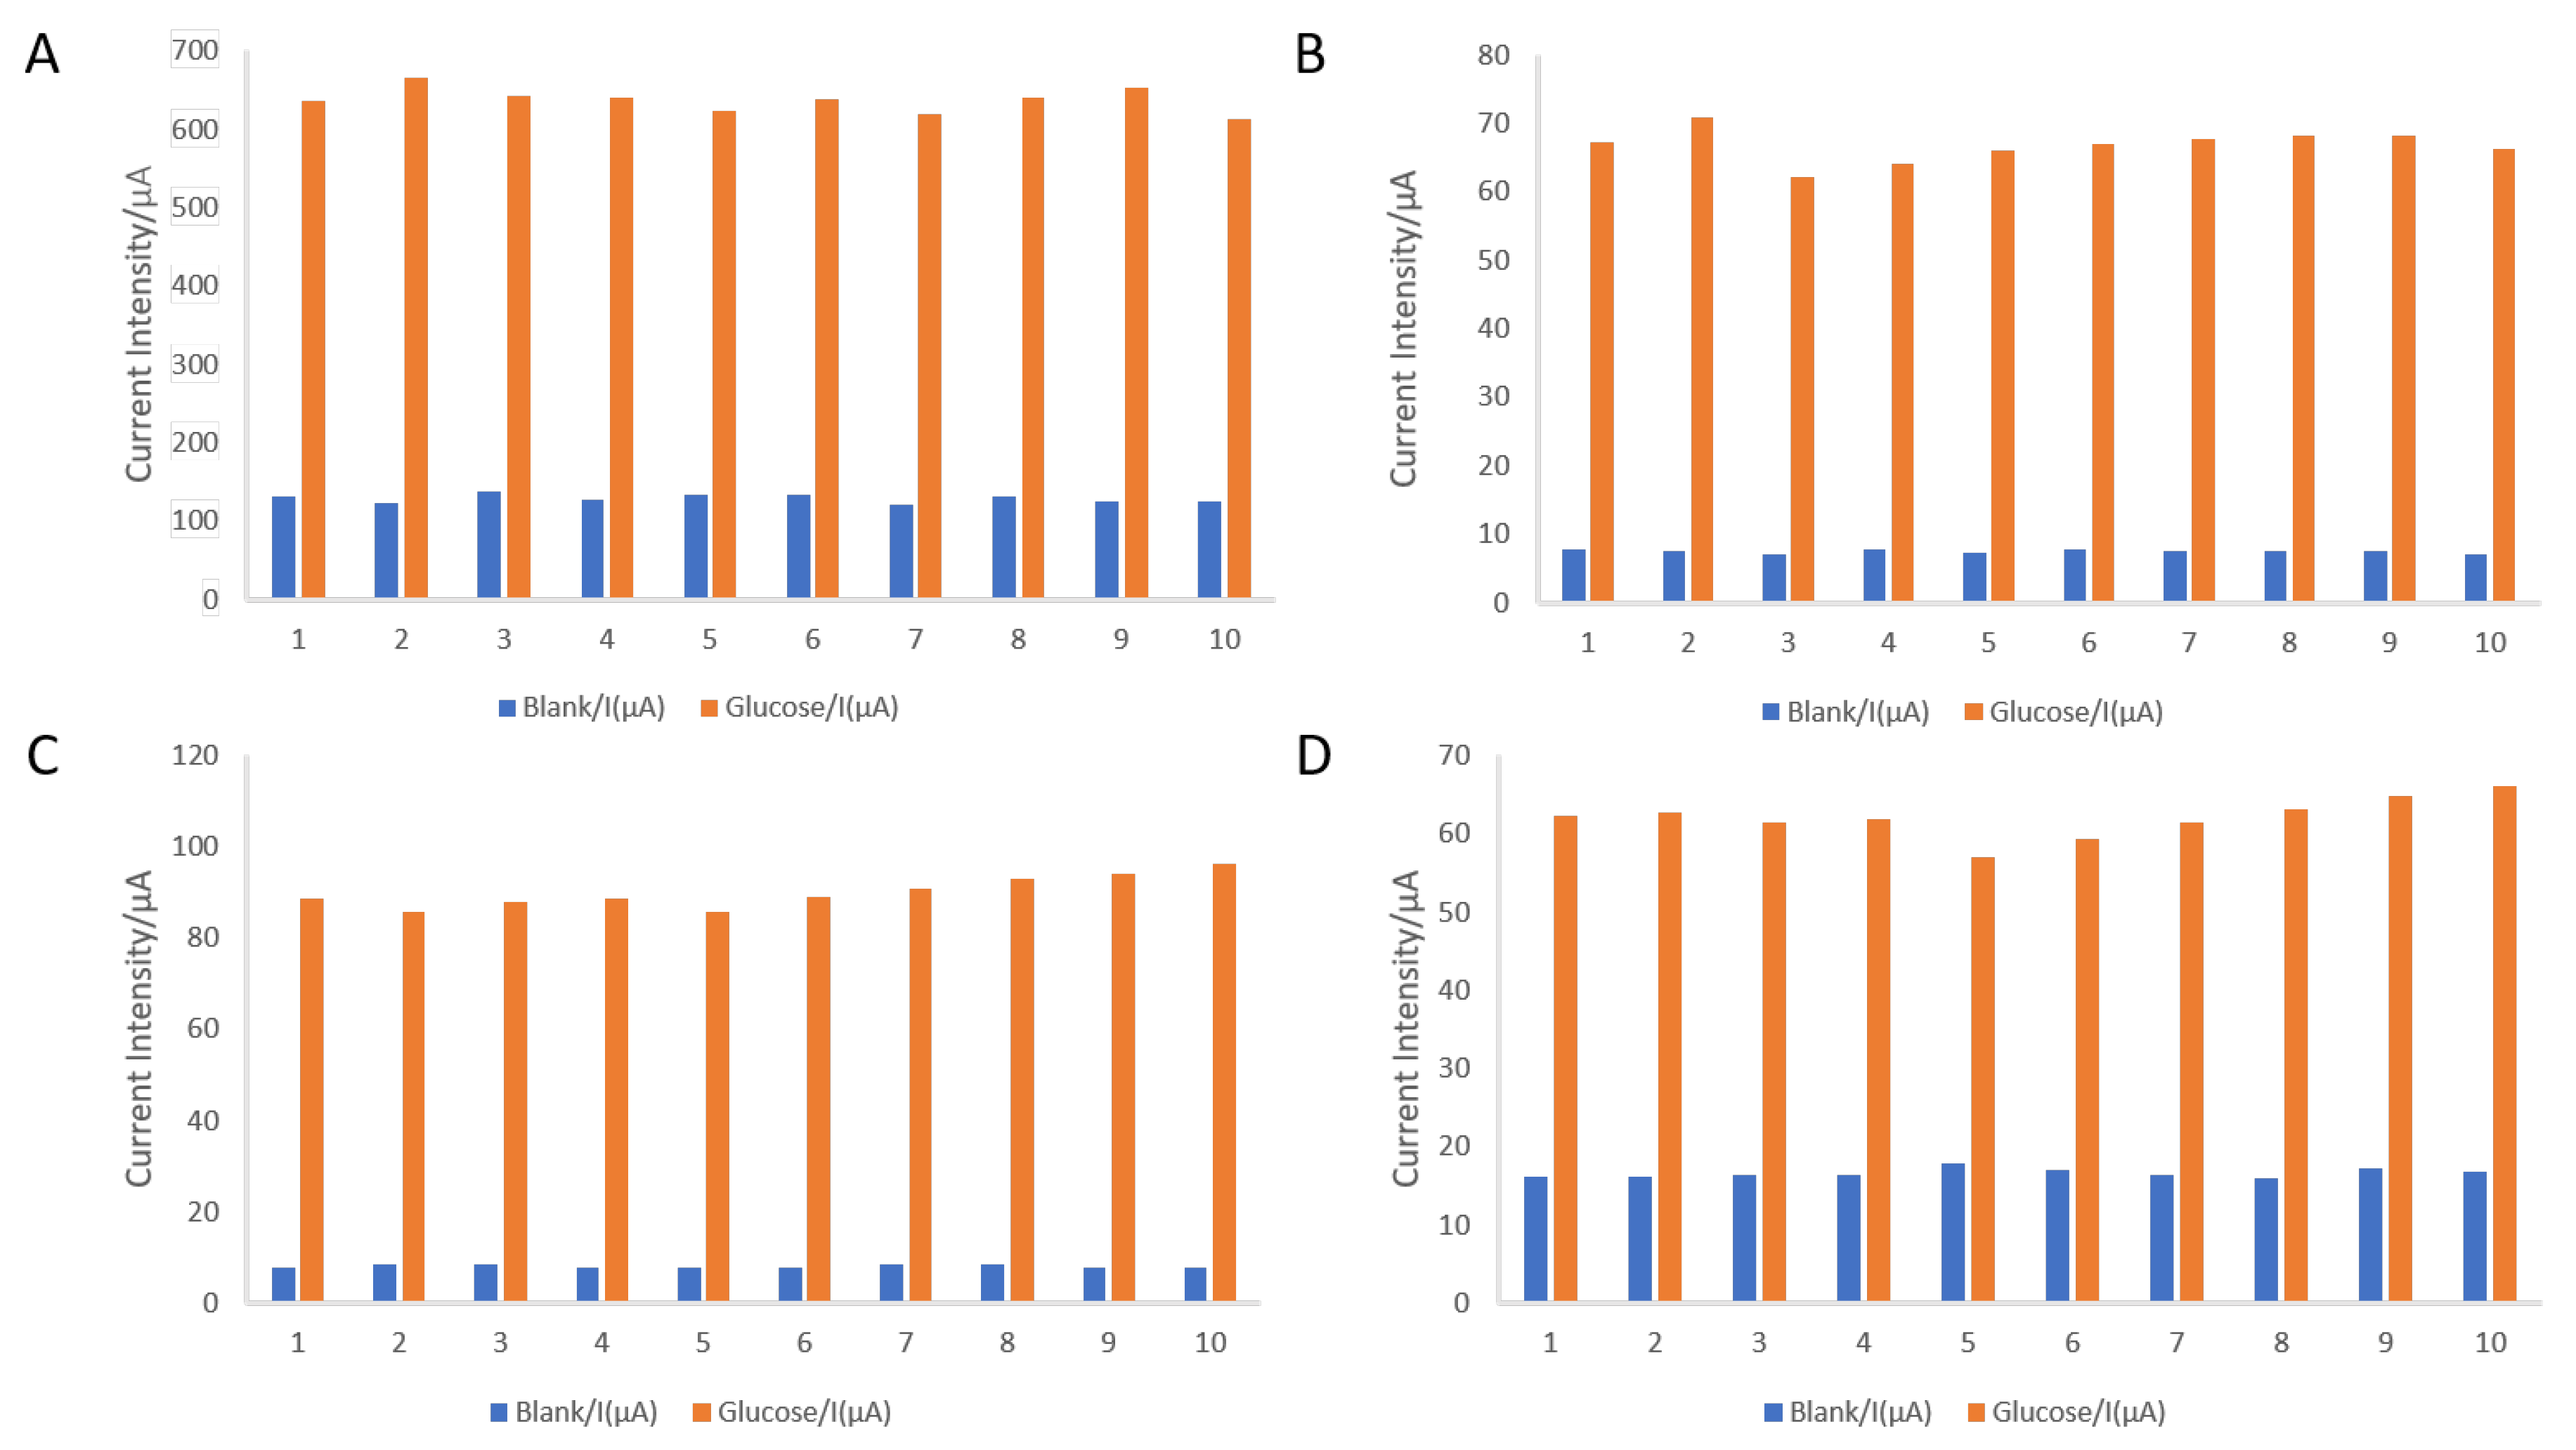
Reproducibility is a basic demand for an electrode used for the electronic tongue technique and for any other methodology. To check the stability of the four electrode types, 10 measurements of 2.15 mM glucose in 0.05 M NaOH solution and a blank electrolyte solution (0.05 M NaOH) were carried out in series by following the experimental conditions described in Section 2.4.2. The current intensity at +0.70 V of the measurements toward electrodes E1, E2, E3, and E4 are displayed in Figure 7. As we can see from these figures, the differences of current intensity of measurements to both glucose and blank solutions are very small. The relative standard deviation (RSD) values based on such measurements were calculated as shown in Table 3. The calculated RSD values of these electrodes are all smaller than 5%, which indicates a good reproducibility of the electronic tongue array composed of such four electrodes. Moreover, these electrodes show remarkable good reproducibility values, especially electrode E1, compared with some of the reported ones (Table 2). The excellent values obtained permit being confident on a series of measurements, and they also assure there are no hysteresis or memory effects.
3.4. Real Samples Detection
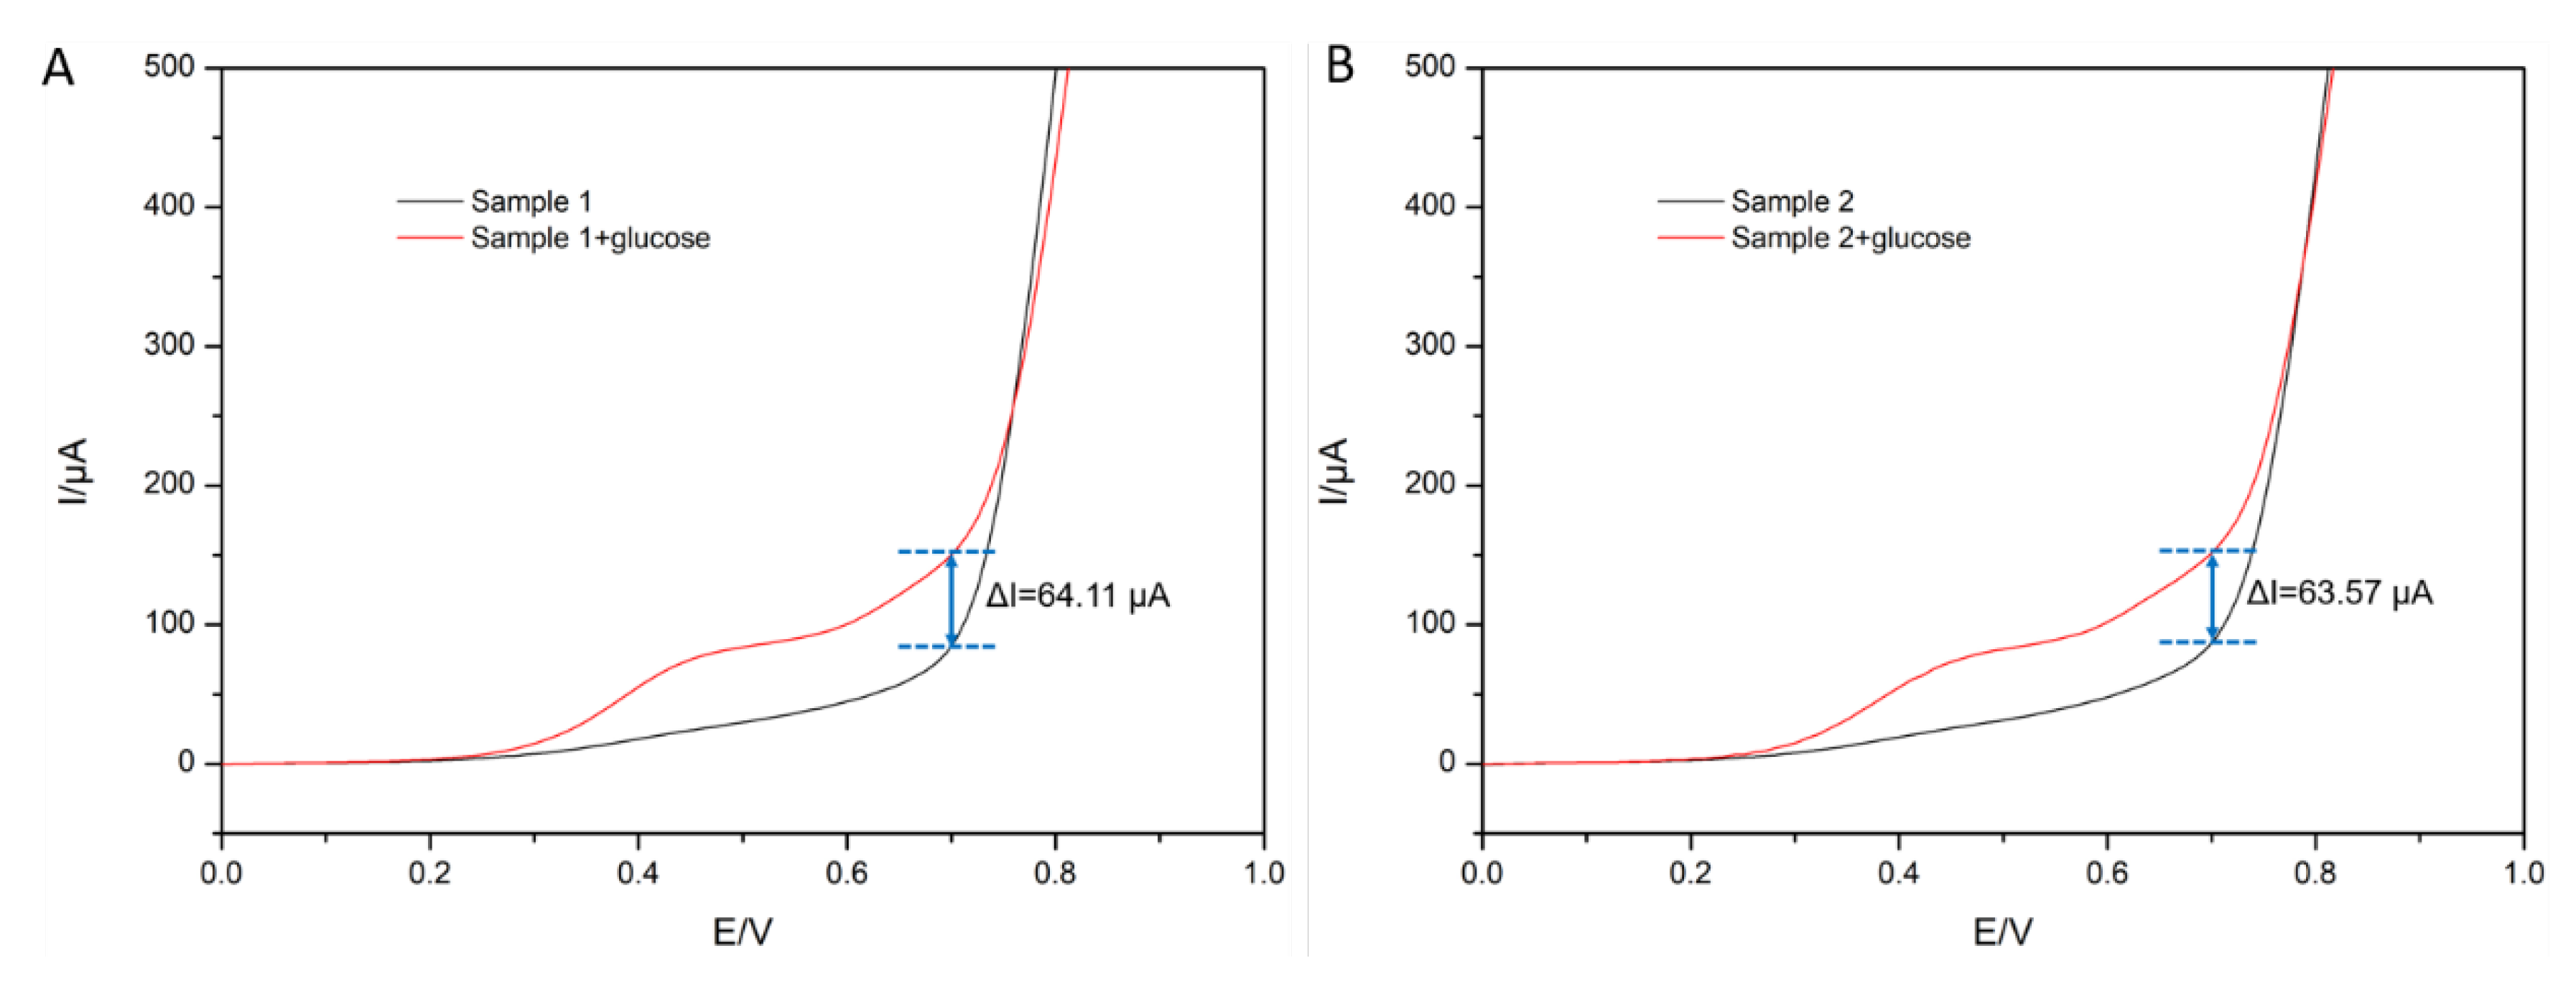
The COD detection of real samples was conducted using the proposed cyclic voltammetry technique with electrode E1 as described in Section 2.5 and the sealed tube method. The latter method was used to check the accuracy of the former one. COD values found for sample 1 and 2, which were estimated as currents at +0.70V, were lower than the intercept of the calibration line, suggesting that the values were below the LODs. This was mainly due to the large dilution performed (100 μL of these two samples were added into 20 mL NaOH individually). Afterwards, sample 1 and 2 were spiked with glucose, and their voltammograms were also recorded under the same condition. The net changes of current intensity at +0.70 V were calculated as 64.11 and 63.57 μA, respectively (see Figure 8). These are near the theoretical current intensity change of 58.27 μA according to the aforementioned equation in Section 3.2 (y = 1.5281x + 112.75).
The spiking tests of these three real samples with fewer dilution were further conducted; hereby, 10 mL of each sample was added into 10 mL of NaOH individually and then spiked with 100 μL glucose solution. These results have been summarized in Table 4, where the recovery yields of spiked glucose in these samples were very near 100%. These indicate that the electrode E1 has good performance in quantifying the organic compounds that are easy to be degraded.
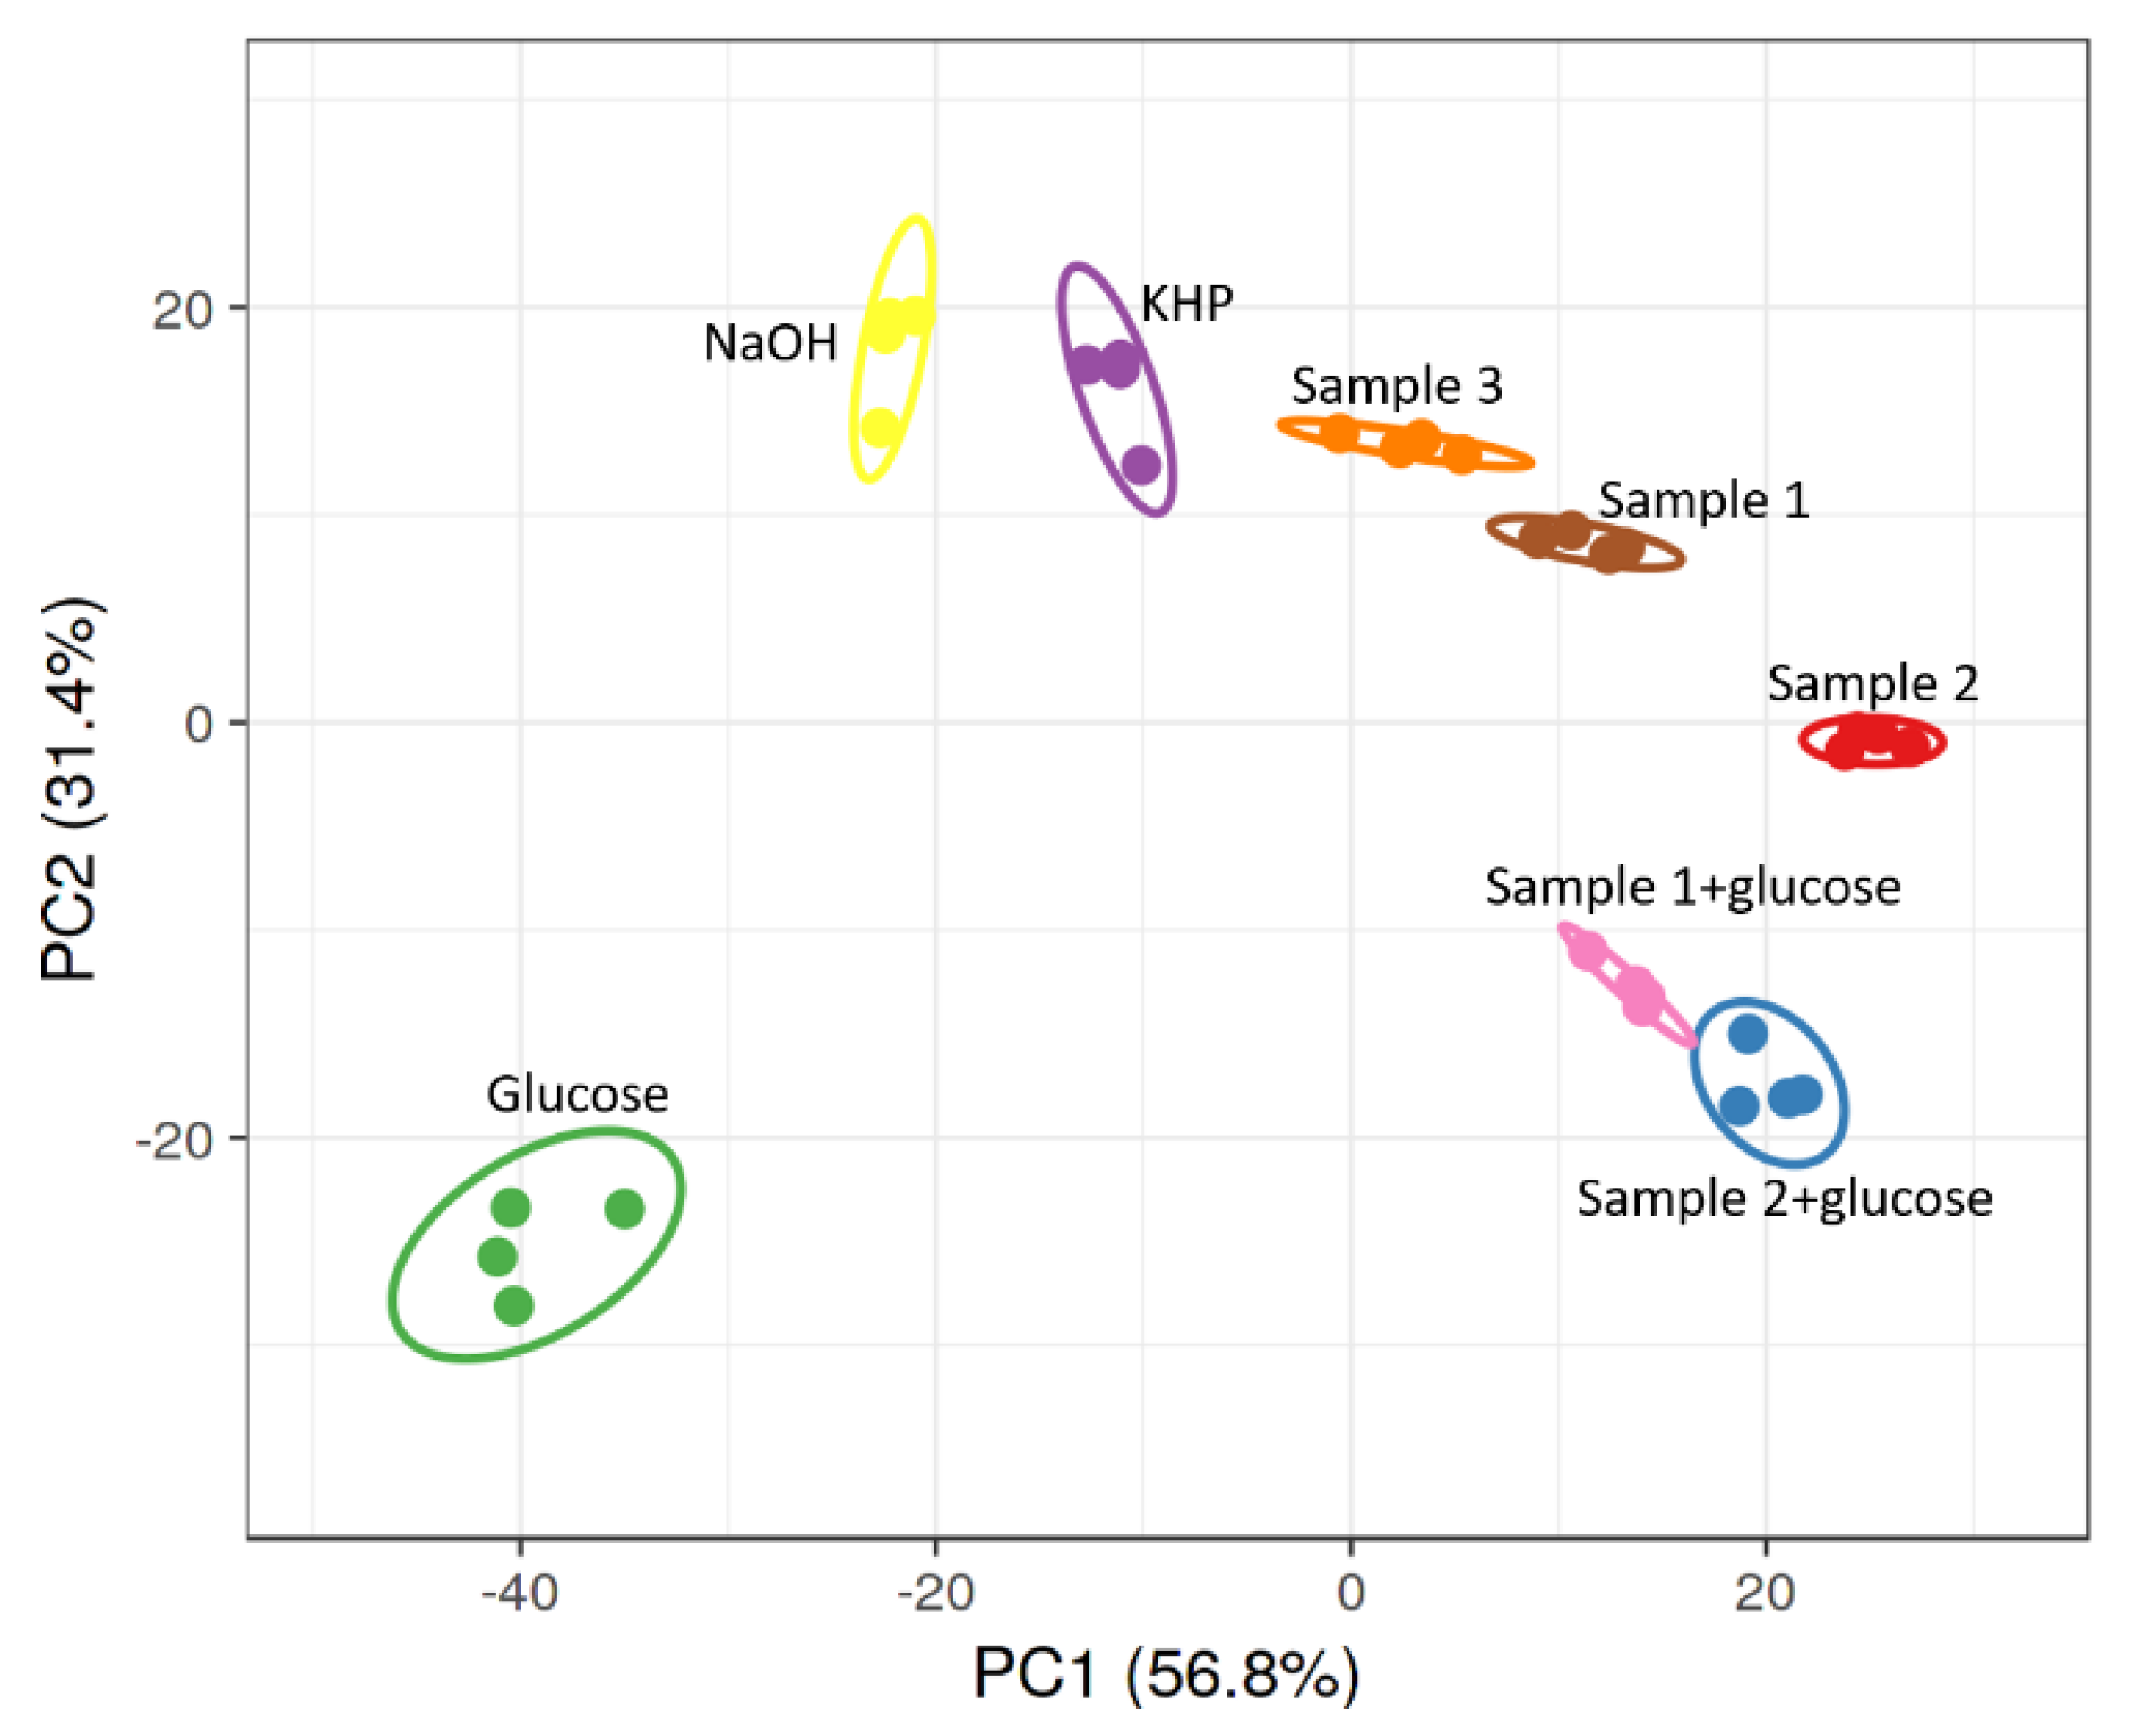
Principal component analysis (PCA) was also conducted toward real samples, again with the combination of the four voltammograms; as can be observed in Figure 9, the score plot of the samples also suggests two types of information to be deduced. First, the inferior part of the plot (negative values of PC1) indicates high organic load, as shown by the direction of increase after the spike. Similarly, the right part of the plot indicates the samples with organics that are more difficult to degrade. As we can observe from Figure 4, sample 2 contains a large amount of pesticides that are very hard to be degraded, and this cluster is in the right-most part of the plot. Sample 1 was spiked with pesticides initially and still contains some, so it is also on the right. However, sample 1 is also above sample 2, which is consistent with the truth that the COD value of sample 2 is bigger than that of sample 1. Sample 3 is on the left of sample 1 and the right of KHP, which indicates that it is likely that sample 3 also contains some organics of natural origin, low amount, and not of very easy degradation. PCA results can help us know interesting details about the samples: if they bring high organic load, and how difficult they are to degrade. The cluster of glucose, which is the easiest compound to be oxidized among these samples, is the farthest left and tends to the negative coordinate in the PC2 axis.
Present work in our laboratory is focused now on the building of a quantitative response model, which will employ measurements from the electrode array, and will consider organic load and the difficulty of degradation. To do this, a predictive model with varying sensitivity according to degradation difficulty will be needed, which we expect could be accomplished with the use of artificial neural networks intelligent data processing.
4. Conclusions
This work developed an easy method of analyzing wastewaters quantitatively and qualitatively by combining the electrochemical electrodes with the electronic tongue technique. Four electrodes, a Nafion film-covered electrodeposited CuO/Cu electrode, as well as copper, copper oxide, and nickel copper alloy nanoparticle–graphite–epoxy composite electrodes, were fabricated to compose an electronic tongue array. The COD values were calculated based on the calibration equation obtained based on the linear relationship of COD values and current intensity. The PCA technique was used to evaluate the main component of a river sample, which is easy or difficult to be degraded. The resulting sensor-based method demonstrates great potential not only for estimating the precise value of organic load (work under study) but for predicting the difficulty behavior in its degradation, in a simple, fast, and clean methodology, which is completely suited to the present demands of green techniques.
Supplementary Materials
The following are available online at https://0-www-mdpi-com.brum.beds.ac.uk/2227-9040/9/3/46/s1, Figures S1, S2, S3, S4, S5, S6, S7 and Table S1.
Author Contributions
Conceptualization, M.d.V.; methodology, M.d.V.; investigation, Q.W. and M.d.V.; writing—original draft preparation, Q.W.; writing—review and editing, Q.W. and M.d.V.; supervision, M.d.V.; funding acquisition, M.d.V. Both authors have read and agreed to the published version of the manuscript.
Funding
This research was funded by the Spanish Ministry of Science and Innovation, MCINN (Madrid) through project PID2019-107102RB-C21C. Q.W. acknowledges the concession of a PhD grant of the Chinese Scholarship Council (China). M.d.V. thanks the support from Generalitat de Catalunya through the program ICREA Academia.
Institutional Review Board Statement
Not applicable.
Informed Consent Statement
Not applicable.
Data Availability Statement
The data presented in this study are available in this article and Supporting Information.
Acknowledgments
Authors thanks Teresa Vicent, from Universitat Autònoma de Barcelona to provide the samples, with their COD analysis, pertaining to an agricultural study. Authors thanks also Anna Herrera-Chacón for the support in the SEM microscopy images.
Conflicts of Interest
The authors declare no conflict of interest.
References
- Gutiérrez-Capitán, M.; Baldi, A.; Gómez, R.; García, V.; Jiménez-Jorquera, C.; Fernández-Sánchez, C. Electrochemical nanocomposite-derived sensor for the análisis of chemical oxygen demand in urban wastewaters. Anal. Chem. 2015, 87, 2152–2160. [Google Scholar] [CrossRef]
- Alves, N.A.; Olean-Oliveira, A.; Cardoso, C.X.; Teixeira, M.F.S. Photochemiresistor sensor development based on a bismuth vanadate type semiconductor for determination of Chemical Oxygen Demand. ACS Appl. Mater. Interfaces 2020, 12, 18723–18729. [Google Scholar] [CrossRef] [PubMed]
- Kong, H.; Wu, H. A rapid determination method of chemical oxygen demand in printing and dyeing wastewater using ultraviolet spectroscopy. Water Environ. Res. 2009, 81, 2381–2386. [Google Scholar] [CrossRef]
- Yao, H.; Wu, B.; Qu, H.; Cheng, Y. A high throughput chemiluminescence method for determination of chemical oxygen demand in waters. Anal. Chim. Acta 2009, 633, 76–80. [Google Scholar] [CrossRef]
- Zhu, L.; Chen, Y.; Wu, Y.; Li, X.; Tang, H. A surface-fluorinated-TiO2–KMnO4 photocatalytic system for determination of chemical oxygen demand. Anal. Chim. Acta 2006, 571, 242–247. [Google Scholar] [CrossRef]
- Li, C.; Song, G. Photocatalytic degradation of organic pollutants and detection of chemical oxygen demand by fluorescence methods. Sens. Actuators B Chem. 2009, 137, 432–436. [Google Scholar] [CrossRef]
- Dai, Z.; Hao, N.; Xiong, M.; Han, X.; Zuo, Y.; Wang, K. Portable photoelectrochromic visualization sensor for detection of Chemical Oxygen Demand. Anal. Chem. 2020, 92, 13604–13609. [Google Scholar] [CrossRef]
- Yu, H.; Ma, C.; Quan, X.; Chen, S.; Zhao, H. Flow injection analysis of Chemical Oxygen Demand (COD) by using a boron-doped diamond (BDD) electrode. Environ. Sci. Technol. 2009, 43, 1935–1939. [Google Scholar] [CrossRef]
- Zhang, Z.; Chang, X.; Chen, A. Determination of chemical oxygen demand based on photoelectrocatalysis of nanoporous TiO2 electrodes. Sens. Actuators B Chem. 2016, 223, 664–670. [Google Scholar] [CrossRef]
- Li, J.; Li, L.; Zheng, L.; Xian, Y.; Jin, L. Rh2O3/Ti electrode preparation using laser anneal and its application to the determination of chemical oxygen demand. Meas. Sci. Technol. 2006, 17, 1995–2000. [Google Scholar] [CrossRef]
- Hou, Y.; Hu, J.; Liu, L.; Zhang, J.; Cao, C. Effect of calcination temperature on electrocatalytic activities of Ti/IrO2 electrodes in methanol aqueous solutions. Electrochim. Acta 2006, 51, 6258–6267. [Google Scholar] [CrossRef]
- Wang, J.Q.; Wu, C.; Wu, K.B.; Cheng, Q.; Zhou, Y.K. Electrochemical sensing chemical oxygen demand based on the catalytic activity of cobalt oxide film. Anal. Chim. Acta 2012, 736, 55–61. [Google Scholar] [CrossRef] [PubMed]
- Cheng, Q.; Wu, C.; Chen, J.; Zhou, Y.; Wu, K. Electrochemical tuning the activity of nickel nanoparticle and application in sensitive detection of Chemical Oxygen Demand. J. Phys. Chem. C 2011, 115, 22845–22850. [Google Scholar] [CrossRef]
- Zhou, Y.; Jing, T.; Hao, Q.; Zhou, Y.; Mei, S. A sensitive and environmentally friendly method for determination of chemical oxygen demand using NiCu alloy electrode. Electrochim. Acta 2012, 74, 165–170. [Google Scholar] [CrossRef]
- Silva, C.R.; Conceição, C.D.C.; Bonifácio, V.G.; Fatibelho Filho, O.; Teixeira, M.F.S. Determination of the Chemical Oxygen Demand (COD) Using a Copper Electrode: A Clean Alternative Method. J. Solid State Electrochem. 2009, 13, 665–669. [Google Scholar] [CrossRef]
- Carchi, T.; Lapo, B.; Alvarado, J.; Montero, P.J.E.; Llorca, J.; Fernández, L. A Nafion film cover to enhance the analytical performance of the CuO/Cu electrochemical sensor for determination of chemical oxygen demand. Sensors 2019, 19, 669. [Google Scholar] [CrossRef] [Green Version]
- Hassan, H.H.; Badr, I.H.A.; Abdel-Fatah, H.T.M.; Elfeky, E.M.S.; Abdel-Aziz, A.M. Low cost chemical oxygen demand sensor based on electrodeposited nano-copper film. Arab. J. Chem. 2018, 11, 171–180. [Google Scholar] [CrossRef] [Green Version]
- Badr, I.H.A.; Hassan, H.H.; Hamed, E.; Abdel-Aziz, A.M. Sensitive and green method for determination of chemical oxygen demand using a nano-copper based electrochemical sensor. Electroanalysis 2017, 29, 2401–2409. [Google Scholar] [CrossRef]
- Winquist, F.; Olsson, J.; Eriksson, M. Multicomponent analysis of drinking water by a voltammetric electronic tongue. Anal. Chim. Acta 2011, 683, 192–197. [Google Scholar] [CrossRef]
- Ha, D.; Sun, Q.; Su, K.; Wan, H.; Li, H.; Xu, N.; Sun, F.; Zhuang, L.; Hu, N.; Wang, P. Recent achievements in electronic tongue and bioelectronic tongue as taste sensors. Sens. Actuators B Chem. 2015, 207, 1136–1146. [Google Scholar] [CrossRef]
- Ortiz-Aguayo, D.; Bonet-San-Emeterio, M.; del Valle, M. Simultaneous voltammetric determination of acetaminophen, ascorbic acid and uric acid by use of integrated array of screen-printed electrodes and chemometric tools. Sensors 2019, 19, 3286. [Google Scholar] [CrossRef] [Green Version]
- Herrera-Chacón, A.; Torabi, F.; Faridbod, F.; Ghasemi, J.B.; González-Calabuig, A.; del Valle, M. Voltammetric electronic tongue for the simultaneous determination of three benzodiazepines. Sensors 2019, 19, 5002. [Google Scholar] [CrossRef] [Green Version]
- Sarma, M.; del Valle, M. Improved Sensing of Capsaicin with TiO2 Nanoparticles Modified Epoxy Graphite Electrode. Electroanalysis 2019, 32, 230–237. [Google Scholar] [CrossRef]
- Cetó, X.; Apetrei, C.; del Valle, M.; Rodríguez-Méndez, M.L. Evaluation of Red Wines Antioxidant Capacity by Means of a Voltammetric E-Tongue with an Optimized Sensor Array. Electrochim. Acta 2014, 120, 180–186. [Google Scholar] [CrossRef]
- Bonet-San-Emeterio, M.; González-Calabuig, A.; del Valle, M. Artificial Neural Networks for the Resolution of Dopamine and Serotonin Complex Mixtures Using a Graphene-Modified Carbon Electrode. Electroanalysis 2019, 31, 390–397. [Google Scholar] [CrossRef]
- Rudnicki, K.; Brycht, M.; Leniart, A.; Domagała, S.; Kaczmarek, K.; Kalcher, K.; Skrzypek, S. A Sensitive Sensor Based on Single-walled Carbon Nanotubes: Its Preparation, Characterization and Application in the Electrochemical Determination of Drug Clorsulon in Milk Samples. Electroanalysis 2019, 32, 375–383. [Google Scholar] [CrossRef]
- Ma, C.; Tan, F.; Zhao, H.; Chen, S.; Quan, X. Sensitive Amperometric Determination of Chemical Oxygen Demand Using Ti/Sb-SnO2/PbO2 Composite Electrode. Sens. Actuators B Chem. 2011, 155, 114–119. [Google Scholar] [CrossRef]
- Jing, T.; Zhou, Y.; Hao, Q.; Zhou, Y.; Mei, S. A Nano-Nickel Electrochemical Sensor for Sensitive Determination of Chemical Oxygen Demand. Anal. Methods 2012, 4, 1155. [Google Scholar] [CrossRef]
- Li, J.; Li, L.; Zheng, L.; Xian, Y.; Ai, S.; Jin, L. Amperometric determination of chemical oxygen demand with flow injection analysis using F-PbO2 modified electrode. Anal. Chim. Acta 2005, 548, 199–204. [Google Scholar] [CrossRef]
Figure 1.
Diagram of construction of the Cu/CuO electrode (A) and the graphite–epoxy electrodes modified with metal nanoparticles (B).
Figure 1.
Diagram of construction of the Cu/CuO electrode (A) and the graphite–epoxy electrodes modified with metal nanoparticles (B).

Figure 2.
Oxidation curves of cyclic voltammetric responses of electrodes E1 (A), E2 (B), E3 (C), and E4 (D) to four standard chemical oxygen demand (COD) substances: 2.15 mM glucose; 2.15 mM glycine; 2.15 mM ethylene glycol; 2.15 mM KHP.
Figure 2.
Oxidation curves of cyclic voltammetric responses of electrodes E1 (A), E2 (B), E3 (C), and E4 (D) to four standard chemical oxygen demand (COD) substances: 2.15 mM glucose; 2.15 mM glycine; 2.15 mM ethylene glycol; 2.15 mM KHP.

Figure 3.
Oxidation curves of cyclic voltammetric responses of electrodes E1, E2, E3, and E4 to four standard COD substances: (A) 2.15 mM glucose; (B) 2.15 mM glycine; (C) 2.15 mM ethylene glycol; (D) 2.15 mM KHP. Scan rate: 50 mV·s−1.
Figure 3.
Oxidation curves of cyclic voltammetric responses of electrodes E1, E2, E3, and E4 to four standard COD substances: (A) 2.15 mM glucose; (B) 2.15 mM glycine; (C) 2.15 mM ethylene glycol; (D) 2.15 mM KHP. Scan rate: 50 mV·s−1.

Figure 4.
Score plot of the first two components obtained after principal component analysis (PCA). A total of 20 samples were analyzed corresponding to quadruplicate determinations of glucose (blue), glycine (green), ethylene glycol (red), potassium hydrogen phthalate (purple), and blank (orange).
Figure 4.
Score plot of the first two components obtained after principal component analysis (PCA). A total of 20 samples were analyzed corresponding to quadruplicate determinations of glucose (blue), glycine (green), ethylene glycol (red), potassium hydrogen phthalate (purple), and blank (orange).

Figure 5.
Oxidation curves of cyclic voltammetric responses of electrode E1 to glucose of increasing concentration (from 0.10 to 6.90 mM). Scan rate: 50 mV·s−1.
Figure 5.
Oxidation curves of cyclic voltammetric responses of electrode E1 to glucose of increasing concentration (from 0.10 to 6.90 mM). Scan rate: 50 mV·s−1.

Figure 6.
Calibration graph corresponding to glucose standards, with current measured at +0.70 V, electrode E1.
Figure 6.
Calibration graph corresponding to glucose standards, with current measured at +0.70 V, electrode E1.

Figure 7.
Current intensities at +0.70 V of cyclic voltammograms of electrodes E1 (A), E2 (B), E3 (C), and E4 (D) responding to the repeated cycle of blank (blue) and 2.15 mM glucose (orange). Scan rate: 50 mV·s−1.
Figure 7.
Current intensities at +0.70 V of cyclic voltammograms of electrodes E1 (A), E2 (B), E3 (C), and E4 (D) responding to the repeated cycle of blank (blue) and 2.15 mM glucose (orange). Scan rate: 50 mV·s−1.

Figure 8.
Oxidation curves of cyclic voltammetric responses of electrode E1 to Sample 1 (A) and 2 (B) before (black lines) and after (red lines) being spiked with 0.2 mM glucose. Scan rate: 50 mV·s−1.
Figure 8.
Oxidation curves of cyclic voltammetric responses of electrode E1 to Sample 1 (A) and 2 (B) before (black lines) and after (red lines) being spiked with 0.2 mM glucose. Scan rate: 50 mV·s−1.

Figure 9.
Score plot of the first two components obtained after PCA analysis to real samples and standard substances. These samples are glucose (green), NaOH (yellow), potassium hydrogen phthalate (purple), Sample 1 (brown) and its spike with glucose (pink), Sample 2 (red) and its spike with glucose (blue), and Sample 3.


Table 1.
Calibration lines of the different electrodes employed in this work vs. the different reference organic compounds tested. Measured current vs. organic load.
Table 1.
Calibration lines of the different electrodes employed in this work vs. the different reference organic compounds tested. Measured current vs. organic load.
| E1 | E2 | E3 | E4 | |
|---|---|---|---|---|
| Glucose | y = 1.5281x +112.75, R2 = 0.9999 | y = 0.2044x + 14.23, R2 = 0.9934 | y = 0.1504x + 10.21, R2 = 0.9946 | y = 0.1908x + 59.18, R2 = 0.9720 |
| Glycine | y = 1.8878x + 121.02, R2 = 0.9941 | y = 0.1067x + 10.49, R2 = 0.9925 | -- | -- |
| Ethylene Glycol | y = 2.6844x + 122.71, R2 = 0.9945 | -- | -- | -- |
| KHP | -- | -- | -- | -- |
x = COD values (mg O2·L−1); y = IE=+0.70V (µA).
Table 2.
Comparison of the proposed COD sensor E1 with others reported in the literature.
| Sensor | Electrode Modifier | Standard Substance | LOD (mg O2·L−1) | Linear Range (mg O2·L−1) | Reproducibility (RSD%) |
|---|---|---|---|---|---|
| CuO/AgO sensor [1] | CuO/AgO nanoparticle | Glucose | 28 | 106–1292 | Not mentioned |
| Boron Doped Diamond [8] | - | KHP, phenol | 7.5 | 20–9000 | 1.9 |
| Cobalt oxide/GCE [12] | Cobalt oxide film | Glycine | 1.1 | 5.7–155.8 | 5.7 |
| Ni Cu alloy/GCE [14] | Ni Cu alloy film | Glucose | 1.0 | 10–1533 | 1.0 |
| CuO/Cu electrode [15] | CuO nanoparticle | Glucose | 20.3 | 53.0–28014 | Not mentioned |
| Ti/Sb-SnO2/PbO2 [27] | Sb-SnO2/PbO2 | Glucose | 0.3 | 0.5–200 | <5% |
| Nano-Ni/GCE [28] | Nano-Ni | Glucose | 1.1 | 10–1533 | 4.7 |
| F-PbO2 sensor [29] | Pb (II) particles | Glucose | 15.5 | 100–1200 | Not mentioned |
| This work, electrode E1 | Cu/CuO-Nf | Glucose | 12.3 | 19.2–905.5 | 2.48% |
Table 3.
Relative standard deviation (RSD) values of electrodes E1, E2, E3, and E4 in blank and glucose solutions.
Table 3.
Relative standard deviation (RSD) values of electrodes E1, E2, E3, and E4 in blank and glucose solutions.
| RSD | E1 | E2 | E3 | E4 |
|---|---|---|---|---|
| Blank 1 | 4.04% | 3.07% | 3.90% | 3.44% |
| Glucose 2 | 2.48% | 3.57% | 3.87% | 4.14% |
1 0.05 M NaOH solution; 2 2.15 mM glucose solution.
Table 4.
Recovery yield of spiked glucose detected by electrode E1 toward Sample 1 and Sample2.
| Real Samples | COD Values (mg O2·L−1) | Real Sample Found (mg O2·L−1) | COD Measuring Vessel (mg O2·L−1) | Added Glucose (mg O2·L−1) | Spiked Sample Found (mg O2·L−1) | Recovery Yield (%) |
|---|---|---|---|---|---|---|
| Sample 1 | 1312 | <LOD | 6.6 * | 38.32 | 27.11 | 109.5% |
| Sample 2 | 2088 | <LOD | 10.4 * | 38.32 | 27.67 | 108.6% |
| Sample 1nd | 1312 | 33.76 | 656 * | 95.52 | 112.11 | 82.02% |
| Sample 2nd | 2088 | 17.10 | 1044 * | 95.52 | 101.64 | 88.51% |
| Sample 3nd | Not detected | 18.56 | - | 95.52 | 97.37 | 82.50% |
* Resultant COD in measuring beaker after dilution. nd Spiking tests of real samples with fewer dilution.
Publisher’s Note: MDPI stays neutral with regard to jurisdictional claims in published maps and institutional affiliations. |
© 2021 by the authors. Licensee MDPI, Basel, Switzerland. This article is an open access article distributed under the terms and conditions of the Creative Commons Attribution (CC BY) license (http://creativecommons.org/licenses/by/4.0/).
Share and Cite
MDPI and ACS Style
Wang, Q.; del Valle, M. Determination of Chemical Oxygen Demand (COD) Using Nanoparticle-Modified Voltammetric Sensors and Electronic Tongue Principles. Chemosensors 2021, 9, 46. https://0-doi-org.brum.beds.ac.uk/10.3390/chemosensors9030046
AMA Style
Wang Q, del Valle M. Determination of Chemical Oxygen Demand (COD) Using Nanoparticle-Modified Voltammetric Sensors and Electronic Tongue Principles. Chemosensors. 2021; 9(3):46. https://0-doi-org.brum.beds.ac.uk/10.3390/chemosensors9030046
Chicago/Turabian StyleWang, Qing, and Manel del Valle. 2021. "Determination of Chemical Oxygen Demand (COD) Using Nanoparticle-Modified Voltammetric Sensors and Electronic Tongue Principles" Chemosensors 9, no. 3: 46. https://0-doi-org.brum.beds.ac.uk/10.3390/chemosensors9030046
Note that from the first issue of 2016, this journal uses article numbers instead of page numbers. See further details here.