
A Review of Microfluidic Detection Strategies for Heavy Metals in Water


EnviroCORE, Department of Science & Health, Institute of Technology Carlow, Kilkenny Road, R93 V960 Carlow, Ireland
*
Author to whom correspondence should be addressed.
Chemosensors 2021, 9(4), 60; https://0-doi-org.brum.beds.ac.uk/10.3390/chemosensors9040060
Submission received: 5 February 2021
/
Revised: 11 March 2021
/
Accepted: 17 March 2021
/
Published: 24 March 2021
(This article belongs to the Special Issue Colorimetric Sensors and Biosensors for Healthcare, Food Safety, Environmental Monitoring and Biosecurity Applications)
Abstract
:Heavy metal pollution of water has become a global issue and is especially problematic in some developing countries. Heavy metals are toxic to living organisms, even at very low concentrations. Therefore, effective and reliable heavy metal detection in environmental water is very important. Current laboratory-based methods used for analysis of heavy metals in water require sophisticated instrumentation and highly trained technicians, making them unsuitable for routine heavy metal monitoring in the environment. Consequently, there is a growing demand for autonomous detection systems that could perform in situ or point-of-use measurements. Microfluidic detection systems, which are defined by their small size, have many characteristics that make them suitable for environmental analysis. Some of these advantages include portability, high sample throughput, reduced reagent consumption and waste generation, and reduced production cost. This review focusses on developments in the application of microfluidic detection systems to heavy metal detection in water. Microfluidic detection strategies based on optical techniques, electrochemical techniques, and quartz crystal microbalance are discussed.
1. Introduction
Heavy metal pollution of drinking water is a critical issue affecting numerous countries worldwide. Heavy metals occur naturally, but can also be introduced into the environment through various anthropogenic activities including mining, improper disposal of industrial waste, and use of heavy metal containing pesticides and fertilisers. Additionally, poor management of agricultural and industrial waste has contributed to increased water pollution [1]. To mention one particularly problematic example, Table 1 lists countries with reported arsenic contamination in water supplies [2,3,4,5].
Although the term “heavy metals” is lacking a single definition, metals with densities higher than 5 g mL−1 are frequently defined as heavy metals. The term is also used to refer to any metallic element that has a relatively high density and is toxic at low concentrations. Certain heavy metals bioaccumulate in living organisms and are toxic to human health even at very low concentrations. The greatest risks to human health are caused by arsenic, cadmium, mercury, and lead, while chromium, nickel, cobalt, iron, and manganese are also known to cause harm to human health at elevated concentrations [3,4,5,6,7,8,9,10,11,12,13,14]. The various health implications that are caused by exposure to heavy metals are outlined in Table 2. Humans are exposed to heavy metals through consumption of contaminated food, water, and air. Children are most commonly exposed to heavy metals through ingestion, while industrial exposure is common in adults [4]. Various agencies and organisations such as the World Health Organisation (WHO), European Union (EU), and the US Environmental Protection Agency (US EPA) have established drinking water guidelines for heavy metals in water (Table 2).
There is consequently great demand for regular water quality monitoring in order to identify and assess heavy metal pollution in both groundwater and surface water [22,23]. To date, water monitoring is predominantly based on manual sampling followed by laboratory analysis [24]. A wide range of techniques have been employed for heavy metal detection in water, including atomic absorption spectrometry (AAS) [25,26], graphite furnace atomic absorption spectrometry (GFAAS) [27], energy dispersive X-ray fluorescence (EDXRF) [28], inductively coupled plasma mass spectrometry (ICP-MS) [29], and inductively coupled plasma optical emission spectrometry (ICP-OES) [30]. Although these techniques offer high analytical performance (sensitivity, specificity, accuracy, and precision) there are several limitations associated with them; these techniques are based on sophisticated instrumentation and require highly trained technicians in order to be correctly used and adequately maintained. All of these factors contribute to significant cost of analysis. Moreover, sample collection, transport, and processing add additional costs which vary depending on the frequency of sampling requirements. Transportation and labour expenses represent a large proportion of the overall cost of water monitoring [31]. As a result, small and rural communities in developing countries are not able to utilise sophisticated techniques such as ICP-MS and AAS [32]. Consequently, laboratory-based methods are not suitable for routine high frequency sample analysis [33]. Cost effective, sensitive, and selective methods that are easy to use are required for heavy metal monitoring [34].
Numerous researchers have investigated microfluidic analytical systems in order to improve environmental analysis. Microfluidic systems are characterised by their ability to process small amounts of analyte using channels with dimensions ranging from tens to hundreds of micrometres [35]. Microfluidic detection systems can incorporate important experimental steps such as sample preparation, reaction, separation, and detection into one device [36]. A typical microfluidic detection system requires a method for reagent and sample introduction, a method for transporting and mixing the sample and reagent within the system, and a detection device [35]. Some microfluidic detection systems employ features such as membranes, pneumatic controls, monoliths, and pillars, which can improve the performance of the analysis [37]. For microfluidic devices based on optical detection, a range of components such as optical waveguides and microlenses can be utilised. This topic is discussed in more detail in reviews by Yang et al. [38] and Gai et al. [36].
Manz et al. was the first to introduce the idea of miniaturised analysis systems [39]. Since then, rapid advances in optoelectronics have enabled miniaturisation of functional and detection components of microfluidic detection systems [40]. Microfluidic detection systems have a wide range of applications including medical diagnostics [41], protein studies [42], drug screening [43], environmental monitoring [44], and food analysis [45]. A variety of detection strategies, including optical detection, and electrochemical and mass spectrometry, have been used for microfluidic detection. Different optical detection strategies have been outlined by Pol et al. [46] and Ullah et al. [47]. In addition, the latest progress in electrochemical based microfluidic detection has been described by Liu et al. [48], Waheed et al. [49], and Li et al. [50].
A range of studies have outlined the advantages of microfluidic detection systems over standard laboratory based methods [51,52]. Firstly, the small dimensions of the detection channel enable lower reagent consumption and minimised waste production in comparison to conventional methods [53,54]. Secondly, the high ratio between surface area and volume along with the short diffusion distance enables fast reaction times [55]. Thirdly, miniaturised onsite analysis of samples also reduces contamination risk during sample handling and transportation. Lastly, the fluid flow can be easily and accurately controlled within microfluidic detection chips [56].
This review gives an overview of developments in heavy metal monitoring using microfluidic detection systems over the last two decades, with an emphasis on optical and electrochemical based detection methods. Metals are included based on their toxicity or other impacts on water quality [57] and include arsenic, cadmium, lead, mercury, cobalt, nickel, copper, iron, manganese, and chromium. Databases including Analytical Abstracts, SciFinder, Web of Science, and Science Direct were searched using relevant terms including: heavy metals, microfluidic, optical detection, colorimetric detection, fluorescence, surface plasmon resonance, electrochemical, electroanalytical, quartz crystal microbalance. Articles were selected for inclusion based on the analytical performance of the described devices, consideration of relevant interferants, potential for use in portable/deployable devices, and to achieve coverage of a range of relevant metals.
2. Optical Detection Strategies for Microfluidics
2.1. Absorbance Based Detection
UV-vis spectroscopy is a commonly used detection method due to its sensitivity and ease of use. In a microfluidic chip, the optical pathlength through the sample is often greatly reduced compared to conventional analysis, leading to decreased sensitivity of the measurement [58]. However, various strategies have been developed to address this issue. For example, optical length can be enlarged by using different channel geometries [59], use of mirrors at the end of microchannels [60], and embedding waveguide optics into the microfluidic channel [61,62].
Absorbance based detection also requires a light source. Light emitting diodes (LEDs) coupled to fibre optics have been frequently used in microfluidic detection systems. LEDs emit a narrow band of wavelength, therefore, LED-based sensors do not require optical couplers or monochromators [63]. In addition, LEDs are robust and can withstand adverse conditions such as high humidity and mechanical vibrations [64].
Lace and co-workers developed a method for microfluidic detection of arsenic in water using leucomalachite green dye [65,66]. The dye reacted with arsenic to produce a green coloured complex with peak absorption (λmax) at 617 nm. A linear response was obtained between 0.07–3 mg L−1, and the limit of detection (LOD) was found to be 0.19 mg L−1. Additionally, a simple reagent to sample ratio was obtained by combining the reagents, thereby enabling simple and cost effective microfluidic detection chip design. The method was robust, with the ability to detect arsenic in a range of various environmental water samples, however, iron was found to interfere with the detection of arsenic. The same authors optimised a colorimetric method based on 1,5-diphenylcarbazide for monitoring of chromium (Cr VI) with detection of the resulting complex at 543 nm. The optimised method had LOD of 0.023 mg L−1 and linear range from 0.03–3 mg L−1. The method proved to be simple, fast, and robust. Investigation of the method’s performance in different sample matrices and the good agreement obtained with ICP-MS measurements revealed that the method is suitable for determination of Cr VI in various water matrices [67].
O’Toole et al. developed a novel paired emitter-detector (PEDD), a dual LED-based optical detection system which employs two LEDs, one serving as the light source and the second, in reverse bias mode, employed as the light detector [68]. The PEDD system was subsequently used for sensitive dual wavelength detection of metals including manganese (Mn II) and cobalt (Co II). LODs of 1.0 µg L−1 and 2.5 µg L−1 were obtained for the detection of Mn(II) and Co(II) complexed with 4-(2-pyridylazo) resorcinol (PAR) [69]. The same research group has more recently developed a microfluidic electrochemical sensor for lead and cadmium in seawater [70].
Milani et al. developed an autonomous microfluidic detection device based on colorimetric detection for iron Fe (II) and manganese determination in water. The analytical device consisted of a polymethyl methacrylate (PMMA) microfluidic chip (Figure 1), custom designed syringe pumps, LEDs, lithium battery, and a microcontroller encased in a cylindrical housing. The authors used the ferrozine (3-(2-pyridyl)-5,6-diphenyl-1,2,4-triazine) method for iron determination and PAN (1-(2-pyridylazo)-2-naphthol) method for manganese determination. The ferrozine molecule upon reaction with iron formed a purple coloured species with λmax at 562 nm, whereas the PAN molecule generated a red colour complex once reacted with manganese, with λmax at 560 nm. The on-chip optofluidic cell was 600 μm wide, 300 μm deep, with optical pathlength of 100 mm. This allowed sensitive detection while minimizing the internal volume of the manifold to a total of 50 μL, allowing for low reagent and sample consumption. The reported LODs for iron and manganese were 27 nM and 28 nM, respectively. The linear range for iron was reported to be between 27–200 nM, and the linear range for manganese was found to be between 0.28–6 µM. Five minutes were required for one iron analysis, and ten minutes were needed for a manganese analysis. The method was applied for sea water sample analysis and was not affected by high salt concentration [71].
Du et al. used a microfluidic flow injection analysis system for iron detection in water. The method utilised liquid core waveguide spectrometric detection. Flow injection and sample introduction was carried out linearly moving an array with sample vials. The sample and carried solution were passed onto microfluidic chip by gravity, and phenantroline was used as the colorimetric reagent. Very high sample throughput was obtained with this method, as the method was able to analyse 300 samples in an hour. Linear response was reported to be between 1.0–100 µM, and the LOD was 1 µM [72].
Nuriman et al. developed an optical fibre method for mercury detection in water. Absorbance was measured within a microfluidic chip that contained a chromoionophore immobilised in PVC film. Tris [2-(4-phenyldiazenyl)phenylamino)ethoxy]-cyclotriveratrylene was used as the chromophore, and λmax was found to be 495 nm. The detection system was able to measure fifteen samples in one hour. The linear range was obtained from 1.0 × 10⁻⁶–2.5 × 10⁻⁴ M, and LOD was reported to be 0.5 µM. Good agreement between the developed method and cold vapour atomic absorption spectrometry was obtained. The method was applied to river water sample analysis, with over 90% recovery reported. However, copper, nickel, lead, and cadmium were found to interfere with the method at small concentrations [73].
Microfluidic paper-based analytical devices (µPADs) have numerous properties that make them suitable for use in microfluidic detection. They are cost effective, biodegradable, portable, and can be easily produced and patterned. Furthermore, no additional power sources are required for liquid transportation within the device as the liquid within the μPADs is driven by capillary force [74]. Satarpai et al. used μPADs for colorimetric detection of lead in water samples. Sodium rhodizonate in tartrate buffer was used a colorimetric reagent which formed a pink colour upon reaction with lead. The total analysis time was less than 15 min, and the results were recorded using a digital camera. LOD was reported to be 10 μg L−1, and the linear range was observed between 10 μg L−1 and 100 μg L−1. In addition, the method was used for tapwater and surface water sample analysis. Good agreement was obtained between the novel method and GF-AAS [75].
Chauhan et al. reported a method for arsenic detection in water using iron oxide nanoparticles. Arsenic was reduced to arsine by cysteine capped iron oxide nanoparticles and reacted with silver nitrate embedded onto µPAD resulting in a formation of a dark red colour complex. Ten minutes were required for complete colour development. The LOD was reported to be 0.01 mg L−1, and linear range was observed between 0.001–0.9 mg L−1. The method was applied for river water analysis and showed good correlation with AAS measurements [76].
Cai et al. developed a distance-based detection method for mercury using μPADs, where dithiozone in NaOH solution was loaded onto paper channels. Insoluble colour precipitate was formed by a reaction between dithiozone and mercury. Because of the linear relationship between the length of the precipitate and the concentration of mercury, the concentration of mercury was determined by simple measurements with a ruler. Therefore, the method did not require instrumentation, making it portable and easy to use. LOD was found to be 0.93 mg L−1; linear response was observed between 1–30 mg L−1. Cobalt, zinc, nickel, and silver at concentrations higher than 5 mg L−1 interfered with the determination of mercury [77]. Distance-based detection was also implemented by Sharifi et al.; their paper-based analytical device used a three-dimensional “origami” design, and the incorporation of a PVC membrane, to reduce movement of coloured products and thereby reduce colour heterogeneity. Colour detection was performed using an image scanner, and movement distance was related to concentration of the coloured complex. LoDs for copper detected using pyrocatechol violet and chrome azurol S were 1.7 and 1.9 mg L‒1 respectively, however very broad detection ranges were obtained of 5‒1400 and 5‒200 mg L‒1, respectively [78].
Chowdury et al. used a paper-based microfluidic device with a gold nanosensor functionalised with α-lipophilic acid and thioguanine for arsenic detection in well water. In the presence of arsenic, the nanosensor changed colour from red to black. A desktop scanner was used to analyse the results obtained from μPADs. Linear detection range was observed between 1–50 μg L−1. Fe III was found to interfere with the determination of arsenic. This interference could be overcome by adjusting the pH of the water samples to 12.1. In addition, good correlation between the method’s performance and ICP-OES measurements was obtained [79].
Devadhasan et al. developed chemically functionalised μPADs for nickel, Cr VI, and mercury detection in water. Silane compounds terminating at amine, carboxyl, and thiol groups were embedded on chromatography paper through condensation reactions. Chromogenic reagents were coupled to the functional groups. Dimethylglyoxime was used for nickel determination, forming a pink colour upon reaction with the metal. Cr VI was reacted with 1,5 diphenylcarbazide, which produced a purple colour upon reaction. Finally, Michler’s thioketone was used for mercury detection, forming a brown colour upon reaction. The LODs for nickel, Cr VI, and mercury were found to be 0.24 mg L−1, 0.18 mg L−1, and 0.19 mg L−1, respectively. In addition, various lake water samples were analysed using the method, and the results were compared to ICP-MS measurements, showing good correlation [80].
Gold nanoparticle application in microfluidic detection provides reduced complexity and enhanced sensitivity. In addition, gold nanoparticles are stable and show visible colour change upon aggregation [81]. Li et al. developed a mercury detection method in which helium plasma was used to reduce gold ions and create nanoparticles. Gold nanoparticles were functionalised with 3-mercaptopropionic acid. The functionalised nanoparticles aggregated and changed colour from red to blue in the presence of mercury (Hg II). A fibre-based light source (DT-mini-2, Ocean Optics, Rochester, NY, USA), spectrometer (HR4000, Ocean Optics) and 2 optical fibres with a collimator were used to quantitatively measure the colour shift of the solution. Concentration of mercury was determined by UV-vis spectroscopy, and the LOD was found to be 0.2 mg L−1 [82].
Digital imaging has become a widely used alternative for colorimetric sensing of analytes, including heavy metals, due to factors including the increased accessibility of high-quality smartphone cameras and image processing software. Kamnoet et al. developed a paper-based microfluidic device for simultaneous detection of copper, cobalt, nickel, mercury, and manganese using bathocuproine, dimethylglyoxime, dithizone, and 4-(2-pyridylazo) resorcinol as complexing agents. Selectivity was provided by using two pre-treatment zones where interfering ions were removed by masking agents. LODs were 0.32, 0.59, 5.87, 0.20, and 0.11 mg L−1 for Cu(II), Co(II), Ni(II), Hg(II), and Mn(II), respectively. The linear ranges were 0.32–63.55 mg L−1 Cu(II), 0.59–4.71 mg L−1 Co(II), 5.87–352.16 mg L−1 Ni(II), 0.20–12.04 mg L−1 Hg(II), and 0.11–0.55 mg L−1 Mn(II). Samples of drinking water and pond samples were analysed and gave good accuracy and agreement with an ICP-OES method [83]. Grasianto et al. recently reported the use of bathophenanthroline nanocrystals loaded onto a µPAD. A volume of aqueous sample was applied to the nanocrystal, which absorbed Fe (II) until its capacity was reached; this resulted in sample enrichment within the nanocrystal layer, causing an obvious colour change for µg L−1 concentrations. Detection was performed by smartphone camera imaging. LOD of 2.4 µg L−1 Fe2+ was achieved in a river water sample, however, interference by environmentally relevant ions such as Ca2+ and Mg2+ was reported [84]. Recent advances in the use of imaging-assisted techniques for heavy metals in water have been comprehensively reviewed by Jain et al. [85].
2.2. Fluorescence Detection
Fluorescence detection is widely used due to its high selectivity and sensitivity [86,87]. Some of the most commonly used excitation sources for fluorescence-based detection include light emitting diodes (LEDs), laser sources, and mercury and xenon arc lamps [36]. LEDs have a broad commercially available spectral range, making them suitable for use as excitation sources [88,89]. LEDs are suitable for integration into microfluidic chips, due to their highly efficient light production and low power requirement [90]. Laser induced fluorescence is a very sensitive method and is commonly used in combination with point detectors such as photomultiplier tubes. Laser induced fluorescence is applicable to small sample volumes and, therefore, it is suitable for use in microfluidic chips [91,92]. High pressure vapour discharge lamps are commonly used in fluorescence microscopy as they have a broad spectrum and wide range of wavelengths.
Borodiazaindacene (BODIPY) dyes are characterised by sharp emission and absorption peaks, chemical stability, and simple chemical alteration [93]. Bell et al. developed a droplet based microfluidic sensor for mercury detection in water (Figure 2). Gated mesoporous nanoparticles were combined with a fluorescent BODIPY dye. The microfluidic detection system consisted of transparent perfluoroalkoxyalkane (PFA) tubing, which enabled direct fluorescence measurements. A green LED (peak emission at 505 nm) was the excitation source, while the signal was obtained using optical fibre bundles. Response time was found to be 10 min, and the method yielded optimum response at pH 7.3. No significant interferences from other metals were reported. The LOD was 0.02 μg L−1 with a linear range between 0.02–200 μg L−1 [94].
Kou et al. developed a microfluidic system for lead, cadmium, and mercury detection in water. An inverted microscope was used for obtaining images from the detection system. BODIPY was used as a fluorophore for cadmium detection with λmax of 597 nm. For lead sensing, a fluorescent sensor consisting of four bis(2-pyridylmethyl)amine groups was used, resulting in maximum fluorescence intensity at 560 nm upon reaction with lead. Rhodamine derivative was used for mercury detection with λmax of 575 nm. A mercury lamp was used for fluorescence excitation. The LOD for cadmium was found to be 5.62 mg L−1 with linear range between 5.62–112.41 mg L−1 [95].
Calixarene derivatives have been widely used as building blocks and neutral molecule receptors in fluorescent reagent design [96]. Faye et al. synthesised fluorescent sensor Calix-DANS3-OH, consisting of three dansyl groups and alkyl chain, for lead determination in water. The sensor was embedded in the wall of a polydimethylsiloxane (PDMS) microfluidic detection chip. LOD was reported to be 42 μg L−1, and λmax was found to be 496 nm. The measurements in the microfluidic detection system were carried out at pH 3 with a total analysis time of 3 min. No significant interference from other metals was reported [97].
Zhao et al. used a microfluidic detection system for lead determination in water using Calix-DANS4 as a fluorimetric sensor. Y shaped microchannels were designed with optical fibre detection on a PDMS microfluidic detection chip. Sensor molecules were excited by 365 nm LED source using a dual optical fibre system, and emitted light was collected using another optical fibre and photomultiplier. The LOD was found to be 5 μg L−1. The method was applied to surface water analysis, and calcium was found to cause interference [98].
Wu et al. used a fluorescence-based microfluidic device for in situ lead determination in water. The microfluidic device was combined with microcolumn absorption based on a microcapillary filled with aminopropyl silica. Calix-DANS4 was used as a fluorescent sensor for lead determination in water. Emission spectra were acquired using a spectrofluorimeter. A period of 25 min was required for complete analysis, and no significant interferences from other metals were reported. The linear range for lead was found to be between 2.07–16.5 μg L−1, and LOD was 2 μg L−1. Furthermore, the method was compared to AAS with good agreement between the measurements obtained [99].
Rhodamine chromophores have been widely used for fluorescent labelling because of their unique properties, such as long wavelengths of excitation (greater than 550 nm) and emission (590 nm), good bioavailability, large absorption coefficients, and high fluorescent quantum yields [100,101,102,103]. Kim et al. synthesised ethylenediamine derivative of a rhodamine 6G silica particle (RSSP) and embedded it onto a PDMS microfluidic chip for iron sensing in water samples. Aluminium and mercury were found to interfere with iron determination. However, the chemosensor was capable of detecting iron at a wide pH range. The linear range was obtained between 2–8 μg L−1, and λmax was found to be 552 nm [104].
Zhang et al. used a microfluidic device based on fluorimetric detection for cadmium detection in water. Rhod-5N was used as a fluorescent sensor in a PDMS microfluidic chip with Y type mixer. The method yielded an optimum response at pH 7. LOD was 0.45 μg L−1, and the linear range was found to be between 1.12–22.4 μg L−1. Lead was found to interfere with the determination of cadmium, however, this issue was solved by using solid phase adsorption on aminopropyl silica [105].
Peng et al. developed a microfluidic detection based method for mercury determination in water using a rhodamine derivative. A PDMS microfluidic chip coupled with LIF detection was used for measurements. Strong fluorescence signal in presence of mercury was obtained at 579 nm. Copper, zinc, and iron were found to cause interference with the mercury detection. The authors reported a detection limit of 0.006 mg L−1. The linear range for mercury was observed between 6.21–14.05 mg L−1. The method was applied for environmental water sample analysis. Recoveries obtained for mercury from the environmental sample analysis ranged from 85–103% [106].
Fluorescence signals can be enhanced using metal nanoparticles [107]. Lafleur et al. used a gold nanoparticle based microfluidic sensor for mercury detection in water using a PDMS microfluidic chip. Gold nanoparticles were functionalised with rhodamine 6G. Fluorescence measurements were carried out using an inverted microscope. The LOD was found to be 0.6 μg L−1, and linearity was obeyed between 0.6–60 μg L−1. The method was applied to groundwater sample analysis, where LOD was found to be 16 μg L−1 due to matrix interferences. Additionally, cadmium was found to cause interference [108].
Digital microfluidics (DMF) use surface tension modulation induced by an electric field to manipulate sample as individual droplets. This approach can be used to avoid blockages, decreases reaction time, and improve detection sensitivity and selectivity [109]. Zhang et al. developed a method for mercury detection in coastal water using DMF with a rhodamine based fluorescent agent (1-Rhodamine B hydrazide-3-phenylthiourea). Upon reaction with mercury, pink colour formation was observed. The detection system consisted of a DMF chip, a controller unit, and a voltage amplifier. A fluorescence spectrometer was used for measurements. Less than 20 s were required for the analysis. Linear response was obtained between 0.7–10 μg L−1, and the LOD was 0.7 μg L−1. The method’s performance was not affected by highly saline conditions. Moreover, the results obtained from the method were in good agreement with atomic fluorescence measurements [110].
Wang et al. developed a microfluidic-based fluorescent “electronic eye” combined with tetrasodium iminodisuccinate (IDS)-etched CdTe/CdS quantum dots for detection of cadmium in water. The device consisted of a microfluidic chip, an ultraviolet LED (365 nm) for fluorescent excitation, an optical lens, and a smartphone for portable photographic detection and analysis. The IDS was added to the CdTe/CdS quantum dots to cause fluorescence quenching due to the chemical etching. Subsequent exposure to Cd (II) induced fluorescence changes that allowed quantitative detection. Linear response was observed over the range 1–250 μg L−1, and the LOD was reported as 0.26 μg L−1. An interference study was also reported in which Na+, K+, Ca2+, Mg2+, Cr3+, and Mn2+ did not interfere significantly, but some other metals were identified as interferants due to fluorescence quenching (Cu2+ and Hg2+), and formation of a passivation layer (Zn2+) [111].
2.3. Chemiluminescence Detection
Chemiluminescence based detection methods are highly sensitive and require simple instrumentation in comparison to other optical detection methods. Additionally, chemiluminescence based detection does not require an external light source. This in turn eliminates interferences from the microfluidic substrate and background emission and makes the analysis system more cost effective [112]. However, chemiluminescence is limited to reagents such as luminol [113], peroxyoxalate and oxalate [114], and ruthenium complexes [115]. Additionally, it is affected by variables such as temperature, pH, and solution composition. Consequently, this can result in poor reproducibility [116].
Nogami et al. used a microfluidic detection device based on chemiluminescence for detection of iron, copper, and cobalt in water. 1,10 phenanthroline was reacted with hydrogen peroxide with analyte metals acting as catalysts. From these reactions, a dioxetane compound was obtained and transformed to an excited state of 3,39-diformyl-2,29-dipyridyl. This compound returned to the ground state with chemiluminescent emission detected using a photomultiplier tube. The LODs for copper, cobalt, and iron were found to be 0.47, 35.35, and 55.84 mg L−1, respectively. Copper had a linear range between 0.47–6.73 mg L−1 [117].
Sun et al. used a paper based microfluidic device for lead detection (Figure 3). The analysis involved incubation of the sample, followed by mixing. The detection device was made from aluminium and PMMA, and the optical signal was detected by a smartphone. Unlike conventional μPAD methods, this method used wetting and gravity as a driving force. G-quadruplex based luminescence was used for measuring lead ions. Lead ions enhance single stranded DNAs to generate a G-quadruplex, which in turn enhances the luminescence of the iridium probe. The linear range for lead was observed from 2–200 μg L−1. The method was applied for environmental water sample testing; however, wastewater and sea water samples required a pre-treatment step. Good agreement was obtained between measurements carried out by microfluidic method and by AAS and fluorescence spectrophotometry [118].
Som-aum et al. used a microfluidic detection device for arsenic detection in water samples based on chemiluminescence detection. Chemiluminescence was detected on the chip using luminol with a heteropoly acid complex. In the presence of arsenic, a vanadomolybdoarsenate heteropoly acid complex was formed with high selectivity; the luminol chemiluminescence measurements were not affected by metals such as iron, cobalt, and copper. The linear range for As (V) was observed from 7.49–3.74 mg L−1, and the reported LOD was 6.6 ng L−1. Five minutes were required for complete analysis. The method was applied to arsenic determination in tap water samples and mineral water. Interferences by chromate and phosphate were avoided by passing the reaction solution through an anion exchange microcolumn [119].
Luminol (5-amino-2,3-dihydro-1,4-phthalazinedione) is one of the most widely used chemiluminescent compounds because of its availability and low cost [120]. Som-aum et al. developed a method for total chromium determination in water using chemiluminescence based microfluidic detection device. The chemiluminescence reaction was based on luminol oxidation by hydrogen peroxide with chromium acting as a catalyst. Sodium hydrogen sulphite was used to reduce Cr VI to Cr III. A glass microfluidic chip with a T mixer and negative pressure pumping system was used. Interference from iron, aluminium, nickel, and zinc was reported. The LOD was found to be 0.31 × 10⁻⁴ ng L−1, and the linear range was between 0.052 × 10⁻³ and 0.052 × 10⁻¹ ng L−1. The total analysis time was under one minute. The method was applied for seawater sample analysis with good recovery obtained [121].
Lv et al. used a microfluidic chip coupled with chemiluminescence detection for iron determination in water. Air stream sampling was used for the analysis, which reduced background interference and air bubble formation, and luminol was immobilised on exchange resin in the microfluidic chip. In total, three minutes were required for each sample analysis. The linear range was obeyed between 0.06–2.79 mg L−1, and LOD was found to be 0.017 mg L−1. Furthermore, good agreement was obtained between the novel method and spectrophotometry [122].
Chen et al. developed a method for cobalt detection in water using microfluidic detection based on chemiluminescence. The reaction was based on luminol oxidation by hydrogen peroxide, which took place in a PDMS chip with a serpentine mixing channel. Less than two minutes were required for the analysis. The linear range for cobalt was found to be between 5.89–5.89 × 10⁷ ng L−1, and LOD was 2 ng L−1 [123].
Microfluidic paper based analytical devices are useful for chemiluminescence detection as no excitation source or optical filters are needed. Chemiluminescence-based methods in, combination with μPADs, allow for low cost, and simple and easily disposable detection system development [124]. Alahmad et al. developed a microfluidic paper based analytical device based on chemiluminescence detection for chromium detection in water. The μPAD was fabricated using wax printing, and optical fibres were used to capture the chemiluminescence signal. Cr III catalysed the oxidation reaction of luminol by hydrogen peroxidase, and less than one minute was required for the analysis. The method did not require a separation and preconcentration step. Linear response was observed from 0.05 to 1 mg L−1, and the LOD was 0.02 mg L−1. Furthermore, the method was applied for water sample analysis. Good agreement was found between the method and ICP-OES [125].
Bhandari et al. introduced the lab on a cloth concept [126]. Microchannels can be easily built into cloth using wax screen printing. Lab on cloths are simple and cost effective while combining the properties of conventional lab on a chip detection systems [127]. Liu et al. used flow chemiluminescence for chromium detection in water using a lab on cloth device. Gravity and capillary forces drove the liquid in the lab on cloth that was fabricated using wax screen printing. Luminol was oxidised by hydrogen peroxide with Cr III acting as a catalyst, and the resulting signal was measured by a charge-coupled device (CCD) camera. The method had a linear range between 0.01–100 mg L−1, and the LOD was found to be 6.2 μg L−1. Various water samples were measured with recoveries ranging between 100 and 110%. In addition, less than 30 s were required for sample analysis [128].
2.4. Surface Plasmon Resonance
Surface plasmon resonance (SPR) can considerably enhance the sensitivity and accuracy of chemical detection and accurately detect various molecular reactions [129]. In this technique, plasmonic waves are generated between a metal layer and a dielectric medium [130]. SPR has been widely used for detection of various analytes because of characteristics such as simple design, high sensitivity, and low cost [131,132]. Motalbizadeh et al. used a smartphone based microfluidic detection system for arsenic and mercury detection using surface plasmon resonance (SPR) of gold nanoparticles. Colour change was obtained due to nanoparticle aggregate formation as gold nanoparticles reacted with dithiothreitol-10,12 pentacosadiynoic acid and lysine in the presence of mercury and arsenic. The linear range for mercury and arsenic was between 710 to 1278 μg L−1. The LOD for mercury and arsenic was 10.77 to 53.86 μg L−1, respectively [133].
Metallic nanoparticles display strong SPR bands with high molar absorption coefficients, which can provide highly sensitive responses [134]. Gomez-de Pedro et al. developed a microfluidic detection system for mercury monitoring using modified gold nanoparticles. The mercury ions were detected by synthesised thiourea ionophores, which were attached to the nanoparticles. Upon reaction with mercury ions, a change of the gold SPR band was obtained. A flow injection analysis system was used consisting of a peristaltic pump, an injection valve, and PTFE tubing connected to the microfluidic chip. The optical detection system consisted of a 525 nm LED, mounted in a printed circuit board (PCB), a photomultiplier, and a data acquisition card connected to a PC that controls the system and modulates the LED signal (Figure 4). Optimum results were obtained with a flowrate of 1.6 mL min−1, with 3.3 min required for one sample analysis. The LOD was found to be 11 µg L−1, and the linear range was observed between 11–100 µg L−1. No significant interference was reported [135].
Apilux et al. developed a µPADs for mercury detection in water using silver nanoparticles. Interaction between mercury ions and silver nanoparticles was examined by scanning electron microscope. Silver nanoparticles were oxidised by mercury ions resulting in particle fragmentation, and consequent change in the SPR band. Sample volume as small as 2 µl was required for the analysis, with maximum RSD of 8.6% reported. Linear response was obtained between 5–75 mg L−1, and the LOD using digital imaging and analysis by Adobe Photoshop software was 0.12 mg L−1. Moreover, the method was applied for mercury detection in spiked drinking and tap water samples with recoveries of 93–113% obtained [136].
Although silver and gold nanoparticles are widely used for surface plasmon resonance-based analysis, they are reportedly toxic [137,138]. In contrast, curcumin nanoparticles are non-toxic, and curcumin can readily chelate a range of different metals. Pourreza et al. developed a chemosensor for mercury detection in water using curcumin nanoparticles integrated into a paper based analytical device. With preconcentration the linear range was observed between 0.01–0.4 mg L−1, and LOD was 0.003 mg L−1. The method was precise, with RSD of 4.47% reported. No interference was reported. The method was applied for various environmental water sample analysis, with good agreement found between the measurements carried out by cold vapor generation atomic absorption spectrometry [139].
Molecularly imprinted nanoparticles are polymeric nanoparticles with binding sites that are the same size and shape as the target molecule [140]. Advantages associated with molecularly imprinted nanoparticles include high stability, simple synthesis process, robustness, and sensitivity [141]. Shristav et al. developed a method for simultaneous lead and copper detection in water samples using molecularly imprinted nanoparticles which were dip-coated onto an optical fibre, which was then exposed to sample in a flow cell. Response time for the method was 15 s, and no significant interference was reported. A non-linear relationship between the peak absorption wavelength and the metal concentration was obtained in each case, and LODs for copper and lead were 8.18 × 10⁻⁴ and 4.06 × 10⁻⁶ µg L−1, respectively [142].
3. Electrochemical Detection for Microfluidics
Electrochemical detection is characterised by target analyte interaction with electrodes or probes. As a result, various electrical signals are obtained which enable quantitative analysis of the analytes [143]. Electrodes can be easily integrated into a microfluidic detection system resulting in simple, low powered, and cost-effective detection with high sensitivity [144]. Additionally, minimal loss of sensitivity is observed through electrochemical method miniaturisation [145]. One disadvantage associated with electrochemical detection is the short operating life of electrodes. Because of high sensitivity, fast response, and easy integration into microfluidic chips, electrochemical methods are widely used in heavy metal detection [146].
Hong et al. developed a 3D printed microfluidic device for cadmium and lead determination in water using a microporous screen-printed electrode (SPE) modified with Mn2O3 (Figure 5). The calibration curves at the modified SPE for Cd(II) and Pb(II) covered two linear ranges from 0.5–8 and 10–100 μg L−1, respectively. The limits of detection were estimated to be 0.5 μg L−1 for Cd(II) and 0.2 μg L−1 for Pb(II) [147]. Metal organic framework is a multifunctional material that is used for porous material preparation with specific surface area [148]. Mn2O3 obtained from manganese metal organic frameworks is a nanomaterial with distinctive mechanical, electronic, and thermal characteristics [149,150]. The detection system was created by integrating metal organic framework derived Mn2O3 modified SPE into a 3D microfluidic cell. The sensor transmitted the data via USB connection to a computer allowing for real time detection of heavy metals. The linear range for cadmium was found to be between 0.5–8 μg L−1, and the LOD was 0.5 μg L−1. The linear range for lead was observed between 10 to 100 μg L−1, and the LOD was 0.2 μg L−1 [150].
Le et al. developed a microelectrodialyser for lead detection in water. The microsystem was fabricated using ion exchange membranes and lead was analysed by square wave anodic stripping voltammetry (SWASV) at a boron doped electrode. Peristaltic pumps were used to move the liquid through the system. Miniaturised platinum conductivity electrodes were used to measure the concentration of lead in samples in a PDMS microchannel. The linear range for lead detection was 20–100 μg L−1, and the LOD was found to be 4 μg L−1. The method showed good reproducibility with relative standard deviation (RSD) reported to be 0.35% [151].
Polyaniline (PANi) is a conducting polymer characterised by low cost, easy deposition on films, environmental stability, and high conductivity [152]. Nguyen et al. used a microfluidic detection chip based on sodium dodecyl sulfate-doped polyaniline (PANi-SDS) modified electrode for mercury detection in water. The electrode was integrated into a PDMS microfluidic detection chip. The lead samples were measured using SWASV. The linear range was observed between 1.20–7.02 μg L−1, and LOD was 0.48 μg L−1. The method was used for mercury analysis in water samples with high recovery rates obtained. Moreover, good reproducibility was obtained with RSD of 4.6% [153].
Electrochemical detection based µPADs also referred to as electrochemical paper based analytical devices (ePADs) have several advantages as they enable low-cost monitoring with high selectivity and sensitivity [154]. Additionally, they are simple to use, do not require additional instrumentation, and are easily disposable [155]. Screen printing technology is well established for the production of low-cost disposable electrochemical sensors. Shi et al. used paper based microfluidic devices for cadmium and lead determination using electrochemical detection. The authors combined paper strips with screen printed carbon electrodes (SPCE). The SPCE were constructed onto a PMMA platform. No pre-treatment was needed for the water sample analysis, and the samples were measured using SWASV. The linear range for lead was 2–100 μg L−1. LODs for lead and cadmium was 2 μg L−1 and 2.3 μg L−1, respectively. The method was successfully applied for lead determination in salt water and groundwater [156].
Shen et al. developed a portable microfluidic detection device for cadmium and lead determination in water using a carbon-based sensor. Working and counter electrodes were embedded into a microfluidic paper channel (Figure 6). The microfluidic detection system was based on graphite foil and paper making it cost effective. SWASV was used for sample measurements. Optimum results were obtained at pH 4.6 with 15 min required for one sample analysis. The LODs for cadmium and lead were found to be 1.2 μg L−1 and 1.8 μg L−1, respectively. Both metals could be simultaneously detected in concentrations between 20 and 100 μg L−1. However, copper was found to interfere with the detection method [157].
Bismuth based electrodes are less toxic than those based on mercury making them more appealing for environmental monitoring purposes. Additionally, they are characterised by a wide linear dynamic range and good resolution [158,159]. Zou et al. developed a lab on a chip with a bismuth electrode. The author used microfabrication and screen-printing techniques for device production. The sensor had a working bismuth sensor. The detection of lead and cadmium was carried out by anodic stripping voltammetry (ASV) inside the microchannels. LODs for cadmium and lead were determined to be 9.3 μg L−1 and 8 μg L−1, respectively. The linear range for cadmium was found to be from 28–280 μg L−1. The linear range for lead was observed from 25–400 μg L−1 [160].
Nantaphol et al. developed a microfluidic paper-based device for determination of lead and cadmium using boron doped diamond paste electrodes (BDDPEs) [161]. BDDPEs are characterised by low background current, robustness, stability in acidic and alkaline conditions, and high sensitivity [162,163]. A flow through design was coupled with square wave anodic voltammetry. The linear range for lead was reported to be observed between 1 to 200 μg L−1. The linear range for cadmium was between 25 and 200 μg L−1. The LODs for lead and cadmium were found to be 1 μg L−1 and 25 μg L−1, respectively. The method was used for drinking water analysis, and good agreement was found between the reported method and ICP-OES [161].
Pungjunun et al. developed a μPAD based method using gold nanoparticles for total arsenic detection in water. Thiosulfate solution was used to reduce the As (V) to As (III), which was deposited on gold nanoparticle-modified boron doped diamond electrode and detected using SWASV. The LOD was found to be 20 μg L−1, and the linear range was between from 0.1–1.5 mg L−1. Although copper was found to interfere with the detection of arsenic, ferricyanide was used to complex copper and overcome the interference [164].
Subramanian et al. integrated a radial channel ion concentration polarization device directly to electrodes to perform linear sweep voltammetric detection of a range of metal ions including arsenic. As (III) was detected down to 1 µg L−1, while the voltammogram exhibited peaks specific to ions including Cu (II), Fe (II), Mn (II), and Pb (II). The authors proposed the use of their device, in combination with a portable electrochemical analyser, as a point of use sensor for resource limited areas [165].
A review by Díaz-González and Fernández-Sánchez [166] provides a concise overview of recent advances in relation to electroanalytical devices for decentralized analysis of water contaminants including heavy metals, including sections on paper-based microfluidic devices and smartphone-based electrochemical sensors. Li et al. have also reviewed electrochemical microfluidic technologies for detection of heavy metals [152].
4. Detection Using Quartz Crystal Microbalance
Quartz crystal microbalance (QCM) is a sensitive detection technique based on the piezoelectric effect, where the resonant frequency of the quartz crystal oscillation linearly decreases with mass loading on the crystal’s surface [167]. QCM is a sensitive, durable, and cost-effective sensing technique with the ability to perform continuous in situ measurements [168]. Furthermore, the substrates used for QCM sensing can be easily modified, which provides a versatile sensing method [169].
Dendrimers are branched polymers which are characterised by distinct sizes and geometries [170]. The ability of dendrimers to coordinate metal ions in their interior and exterior branches allows for highly selective sensor development [171]. Shen et al. developed a method for copper ion determination using QCM sensing by combining phosphate modified dendrimer and ionophore. A QCM sensor based on ion selective membrane was created and attached to a flow cell. Syringe pumps were used for sample introduction into the cell. The method was selective for copper in presence of nickel, zinc, and calcium ions. Linear range was observed between 0.006–6.355 mg L−1. The response time was 40 s with optimum results obtained at pH 5.7 [172].
Wang et al. developed a QCM sensor based on phosphate modified dendrimer for copper detection in water. QCM sensor was integrated within a microfluidic flow cell designed with a temperature controller, which maintained 21 °C temperature throughout the analysis. Microinjector was used to introduce samples into the cell. The method was precise, with a maximum RSD of 2.9% reported. The linear range was 0.006–60 µg L−1, and LOD was 0.006 µg L−1. The response time was reported to be less than 40 s [173].
Aptamers are nucleic acid-based affinity probes which coordinate interaction between mercury ions and thymine [174,175,176]. Dong et al. developed a QCM based sensor with flow system for mercury detection utilising mercury specific aptamer with gold nanoparticles. Short thiolated mercury specific aptamers were set on the surface of QCM as capture probes, whereas the mercury specific aptamers attached to gold nanoparticles served as linking probes. In the presence of mercury ions, change in the resonance frequency was obtained. The LOD was 0.048 µg L−1. The method was applied for spiked tap and wastewater analysis with recoveries ranging from 96.8 to 101.6% in the concentration range of 5–20 µg L−1 [177].
DNAzyme based sensors are sensitive and have been used in various signal transduction mechanisms for metal ion detection [178,179]. Teh et al. developed a DNAzyme based QCM method with dissipation monitoring for lead determination in water. Gold nanoparticles were used for signal amplification. Lead specific DNAzymes were immobilised on QCM surface allowing them to bind with gold nanoparticles, and GR-5 DNAzyme was used as a recognition probe. In presence of lead ions, the gold nanoparticles were removed from the sensor surface causing a dissipation change. Linear range for lead was observed from 0.013–0.062 mg L−1, and the LOD was 0.013 mg L−1. Additionally, the method was used for spiked tap water sample analysis with good recovery obtained. Moreover, the results were in a good agreement with ICP-MS measurements [180].
Can et al. 2016 developed a method for cadmium determination in water using QCM sensor coupled with (2,3,7,8,12,13,17,18-Octakis-(4-tert-butylbenzylthio)-porphyrazinato) Mg(II) (MgPz). The QCM sensor was placed in a flow cell attached to a peristaltic pump. Optimum flow rate was found to be 0.3 μL min−1. Experiments were carried out at 25 °C, and no significant interference was reported. Double deionised water was passed through the detection system after each measurement. A LOD of 10 mg L−1 was reported [181].
5. Discussion and Outlook
Numerous research groups have developed microfluidic detection systems for heavy metal monitoring in order to create portable and cost-effective alternatives to costly laboratory-based detection methods. Some of these are summarised in Table 3. Microfluidic analytical system performance depends on the effectiveness of the detection method used for the analysis. Further research in optical and electrochemical detection methods is needed to allow microfluidic sensor development. Additionally, improvements in microfabrication and new material development for microfluidic detection systems is required. Future developments would also be concentrated on microfluidic detection system application to field. Challenges such as analysis of complex water matrices and variable environmental conditions with minimum power consumption will need to be addressed.
At present, in situ monitoring for microfluidic detection systems is limited due to various issues. Biofouling is a serious concern, especially for measurements in the marine environment. Biofilms can drastically reduce the width of the channels, reducing the flow rate or blocking it completely [182]. Additionally, biofilms can alter the composition of metal compounds in water leading to unreliable measurements [183]. Another major issue is the formation of air bubbles, which can affect the flow rate within the microfluidic channels as well as interfering with the analytical signal via optical, chemical, or electrochemical effects. Irregular flow rate can also be caused by variation in pressure in pumping systems [184]. Syringe pumps can cause oscillations in the flow due to the frictional forces between syringe piston and the syringe wall [185]. The stability of materials is another restriction that can shorten the operating lifetime of a detection system. In addition, once the microfluidic detection system is deployed in the field, the electronics within the microfluidic detection system are subjected to oxidation reactions, which can in turn affect the readings. Deployable microfluidic detection systems should be able to operate for long periods of time. However, achieving this requirement without elevating the manufacturing cost is a major challenge [186].
Many research groups have developed microfluidic detection systems with high sensitivity. For example, Bell et al. developed a method for mercury determination with LOD of 0.2 μg L−1 using fluorescence based microfluidic detection system [94]. Hong et al. developed an electrochemical based method for cadmium and lead analysis, with LOD of 0.2 and 0.5 μg L−1, respectively [147]. Exceptionally low detection limits have been achieved using chemiluminescence based methods. Chen et al. described a method for cobalt determination in water with LOD of 2 ng L−1 [123]. Som-aum et al. reported an LOD of 3.12 × 10⁻⁴ ng L−1 for chromium using luminol [121].
Microfluidic detection methods that have been applied for water sample analysis with various matrices have been reported by numerous research groups. In environmental water sample analysis complex water matrices lead to interferences which affect the analysis of target analyte and decrease the lifetime of the detection system. This issue can be resolved by using highly selective molecules. Environmental samples also contain colloidal particles which can affect optical and electrochemical based detection methods. This issue could be mitigated by introducing filtration systems in microfluidic detection devices [46]. Numerous strategies for solving interference problems have been developed; Zhang et al. used solid phase absorption to overcome interference [105], Chowdury et al. adjusted pH to prevent iron interference on arsenic determination [79]; Punjunum et al. used ferricyanide for copper interference elimination [164]. In general, however, more extensive research is needed to assess the capability of microfluidic detection systems to produce reliable and reproducible measurements in a wide range of complex environmental water matrices.
Despite very significant research efforts and the development of numerous microfluidics-based analytical systems, often with impressive analytical performance under laboratory conditions, only a small number of microfluidic detection methods have been developed into portable or autonomous detection devices. Current and future research must focus on transforming microfluidic detection systems into autonomous, fully integrated detection devices that could be deployed in the field or used for portable, low cost, point of use measurements. In this context, work such as that of Boehle et al. [187] and Wu et al. [188] are encouraging, albeit not applied to heavy metal detection in the studies cited here. Boehle et al. integrated paper-based colorimetric sensing with a Raspberry Pi computing and camera system and a 3D-printed light box to yield a portable and low-cost analytical device [187]. Wu et al. described a microfluidic detection platform incorporating an integrated microfluidic mixing/reaction chip and a micro-spectrometer (with fluorescence mode) for wavelengths of 300–1100 nm. The platform was optimised for portability and low cost [188].
Ideally, autonomous detection systems should be able to operate for long time periods such as weeks, months, or longer. The supply of power is limited for autonomous in situ microfluidic detection system operation in the field. This issue can be overcome by availing of increasingly efficient battery technology, small-scale energy harvesting, or reducing the energy consumption. Ultra-low power electronic and optoelectronic components have already been developed and reported [189], but it is noticeable that many of the analytically successful microfluidic systems described in this review rely on off-chip components such as fluid control, detector, or data-processing elements; these components may be too expensive or power-hungry to fulfil the needs of dispersed, low-cost monitoring applications. Such systems may find applications as high throughput, low cost-per-sample alternatives to the established instrumental techniques for laboratory analysis of heavy metals. Numerous researchers have achieved good agreement between microfluidic detection systems and laboratory-based methods such as AAS, GFAAS, ICP-OES, and ICP-MS. Nevertheless, more extensive “real-world” validation of microfluidic detection methods is needed for them to become competitive with analytically powerful laboratory methods.
6. Conclusions
In recent years, microfluidic technology has undergone rapid developments which have increased the feasibility of their application to water quality monitoring and to environmental monitoring in general. Numerous microfluidic detection devices based on optical and electrochemical detection principles have been developed by various research groups around the world. Many of these systems have achieved impressive analytical performances and good correlation with “gold standard” laboratory-based detection methods. However, microfluidic analytical technology has not been established as a robust and reliable approach to routine water monitoring applications, and the full potential of microfluidic detection systems in the field of environmental monitoring has not yet been achieved.
Relatively few microfluidic detection systems have been fully automated and transformed into autonomous devices capable of operating in the field for long time periods. Further improvements in wireless connectivity and widespread implementation of “Internet of Things” technologies and infrastructure will be important to overcome certain challenges associated with autonomous monitoring. Increased collaboration between scientists from different fields is needed to allow for efficient microfluidic detection system design. Scale-up from laboratory prototype to commercial scale production is still hindered by high initial costs, but manufacturing of microfluidic components is becoming increasingly accessible. Ongoing improvements in 3-D printing capabilities will improve the manufacturing of microfluidic detection systems in the future, making the production more cost effective and accessible to researchers with limited expertise in, or access to, traditional fabrication techniques.
Significant analytical and practical barriers remain; the previous two decades have demonstrated that the challenge of achieving the required analytical specifications over long-term deployments in variable and chemically complex sample matrices featuring significant particulate and bio-fouling potential is far from trivial. This is particularly the case for parameters such as heavy metals, which need to be measured at low concentrations. Nevertheless, it can be reasonably expected that microfluidic detection systems will play an important role in environmental monitoring for these and other parameters in the near future, as well as potentially providing cost-effective alternatives to laboratory-based detection methods.
Author Contributions
J.C. and A.L. developed the concept of the article. A.L. wrote the outline of the paper, completed literature searches, and wrote the initial draft. J.C. completed further literature searches and reviewed and edited the paper with the addition of further material. Both authors have read and agreed to the published version of the manuscript.
Funding
A.L.’s research was funded by the Irish Research Council under grant GOIPG/2016/301 and by Institute of Technology Carlow under the President’s Research Fellowship Programme fund.
Acknowledgments
A.L. would like to thank David Ryan for his support and advice throughout her research project.
Conflicts of Interest
The authors declare no conflict of interest.
References
- Koop, S.H.A.; van Leeuwen, C.J. The challenges of water, waste and climate change in cities. Environ. Dev. Sustain. 2017, 19, 385–418. [Google Scholar] [CrossRef] [Green Version]
- Petrusevski, B.; Sharma, S.; Schippers, J.C.; Shordt, K. Arsenic in drinking water. Delft IRC Int. Water Sanit. Cent. 2007, 17, 36–44. [Google Scholar]
- Fernandez-Luqueno, F.; López-Valdez, F.; Gamero-Melo, P.; Luna-Suárez, S.; Aguilera-González, E.N.; Martínez, A.I.; Pérez-Velázquez, I.R. Heavy metal pollution in drinking water-a global risk for human health: A review. Afr. J. Environ. Sci. Technol. 2013, 7, 567–584. [Google Scholar] [CrossRef]
- Choprapawon, C.; Rodcline, A. Chronic arsenic poisoning in Ronpibool Nakhon Sri Thammarat, the southern province of Thailand. In Arsenic; Springer: Dordrecht, The Netherlands, 1997; pp. 69–77. [Google Scholar] [CrossRef]
- Mandal, B.K.; Suzuki, K.T. Arsenic round the world: A review. Talanta 2002, 58, 201–235. [Google Scholar] [CrossRef]
- Kapaj, S.; Peterson, H.; Liber, K.; Bhattacharya, P. Human health effects from chronic arsenic poisoning—A review. J. Environ. Sci. Health Part A 2006, 41, 2399–2428. [Google Scholar] [CrossRef] [PubMed]
- Rahimzadeh, M.R.; Rahimzadeh, M.R.; Kazemi, S.; Moghadamnia, A.A. Cadmium toxicity and treatment: An update. Casp. J. Intern. Med. 2017, 8, 135. [Google Scholar] [CrossRef]
- Achmad, R.T.; Ibrahim, E. Effects of chromium on human body. Annu. Res. Rev. Biol. 2017, 13, ARRB-33462. [Google Scholar] [CrossRef] [Green Version]
- Agrawal, S.; Berggren, K.L.; Marks, E.; Fox, J.H. Impact of high iron intake on cognition and neurodegeneration in humans and in animal models: A systematic review. Nutr. Rev. 2017, 75, 456–470. [Google Scholar] [CrossRef] [Green Version]
- Kondakis, X.G.; Makris, N.; Leotsinidis, M.; Prinou, M.; Papapetropoulos, T. Possible health effects of high manganese concentration in drinking water. Arch. Environ. Health An Int. J. 1989, 44, 175–178. [Google Scholar] [CrossRef]
- Satoh, H. Occupational and environmental toxicology of mercury and its compounds. Ind. Health 2000, 38, 153–164. [Google Scholar] [CrossRef] [Green Version]
- Risher, J.F.; Amler, S.N. Mercury exposure: Evaluation and intervention: The inappropriate use of chelating agents in the diagnosis and treatment of putative mercury poisoning. Neurotoxicology 2005, 26, 691–699. [Google Scholar] [CrossRef] [Green Version]
- Kitaura, H.; Nakao, N.; Yoshida, N.; Yamada, T. Induced sensitization to nickel in guinea pigs immunized with mycobacteria by injection of purified protein derivative with nickel. New Microbiol. 2003, 26, 101–108. [Google Scholar]
- Cavani, A. Breaking tolerance to nickel. Toxicology 2005, 209, 119–121. [Google Scholar] [CrossRef] [PubMed]
- Vinutha, K.; Jahagirdar, A.A.; Veena Devi, B.; Nanda, N. Removal of chromium from industrial wastewater. In Proceedings of the International Conference on Integrated Water Resource Management, Bangalore, India, 5–7 February 2007; p. 287. [Google Scholar]
- Delves, H.T. Dietary Sources of Copper. In Excerpta Medica; Elsevier: New York, NY, USA, 1980. [Google Scholar]
- Fitch, M.W.; Graham, D.W.; Arnold, R.G.; Agarwal, S.K.; Phelps, P.; Speitel, G.E.; Georgiou, G. Phenotypic characterization of copper-resistant mutants of Methylosinus trichosporium OB3b. Appl. Environ. Microbiol. 1993, 59, 2771–2776. [Google Scholar] [CrossRef] [PubMed] [Green Version]
- Sheikh, T.A.; Arshad, M.N.; Rahman, M.M.; Asiri, A.M.; Alamry, K.A. Development of highly efficient Co2+ ions sensor based on N, N′-(ethane-1,2-diyl) bis (2,5-dimethoxybenzenesulfonamide)(EBDMBS) fabricated glassy carbon electrode. J. Organomet. Chem. 2016, 822, 53–61. [Google Scholar] [CrossRef]
- Rao, N.S. Iron content in groundwaters of Visakhapatnam environs, Andhra Pradesh, India. Environ. Monit. Assess. 2008, 136, 437–447. [Google Scholar] [CrossRef]
- Asgharipour, M.R.; Sirousmehr, A.R. Comparison of three techniques for estimating phytotoxicity in municipal solid waste compost. Ann. Biol. Res. 2012, 3, 1094–1101. [Google Scholar]
- Vilar, M.; Barciela, J.; García-Martín, S.; Pena, R.M.; Herrero, C. Comparison of different permanent chemical modifiers for lead determination in Orujo spirits by electrothermal atomic absorption spectrometry. Talanta 2007, 71, 1629–1636. [Google Scholar] [CrossRef]
- Chakraborty, P.; Babu, P.R.; Sarma, V.V. A new spectrofluorometric method for the determination of total arsenic in sediments and its application to kinetic speciation. Int. J. Environ. Anal. Chem. 2012, 92, 133–147. [Google Scholar] [CrossRef]
- Sarma, H.; Deka, S.; Deka, H.; Saikia, R.R. Accumulation of Heavy Metals in Selected Medicinal Plants. In Reviews of Environmental Contamination and Toxicology; Springer: New York, NY, USA, 2012; Volume 214, pp. 63–86. [Google Scholar] [CrossRef]
- Cleary, J.; Maher, D.; Diamond, D. Development and Deployment of a Microfluidic Platform for Water Quality Monitoring. In Smart Sensors for Real-Time Water Quality Monitoring; Smart Sensors, Measurement and Instrumentation; Mukhopadhyay, S., Mason, A., Eds.; Springer: Berlin/Heidelberg, Germany, 2013; Volume 4, pp. 154–196. [Google Scholar] [CrossRef] [Green Version]
- Bagheri, H.; Afkhami, A.; Saber-Tehrani, M.; Khoshsafar, H. Preparation and characterization of magnetic nanocomposite of Schiff base/silica/magnetite as a preconcentration phase for the trace determination of heavy metal ions in water, food and biological samples using atomic absorption spectrometry. Talanta 2012, 97, 87–95. [Google Scholar] [CrossRef] [PubMed]
- Sohrabi, M.R.; Matbouie, Z.; Asgharinezhad, A.A.; Dehghani, A. Solid phase extraction of Cd (II) and Pb (II) using a magnetic metal-organic framework, and their determination by FAAS. Microchim. Acta 2013, 180, 589–597. [Google Scholar] [CrossRef]
- Gomez, M.R.; Cerutti, S.; Sombra, L.L.; Silva, M.F.; Martínez, L.D. Determination of heavy metals for the quality control in argentinian herbal medicines by ETAAS and ICP-OES. Food Chem. Toxicol. 2007, 45, 1060–1064. [Google Scholar] [CrossRef] [PubMed]
- Obiajunwa, E.I.; Pelemo, D.A.; Owolabi, S.A.; Fasasi, M.K.; Johnson-Fatokun, F.O. Characterisation of heavy metal pollutants of soils and sediments around a crude-oil production terminal using EDXRF. Nucl. Instrum. Methods Phys. Res. Sect. B Beam Interact. Mater. At. 2002, 194, 61–64. [Google Scholar] [CrossRef]
- Djedjibegovic, J.; Larssen, T.; Skrbo, A.; Marjanovic, A.; Sober, M. Contents of cadmium, copper, mercury and lead in fish from the Neretva river (Bosnia and Herzegovina) determined by inductively coupled plasma mass spectrometry (ICP-MS). Food Chem. 2012, 131, 469–476. [Google Scholar] [CrossRef]
- Faraji, M.; Yamini, Y.; Saleh, A.; Rezaee, M.; Ghambarian, M.; Hassani, R. A nanoparticle-based solid-phase extraction procedure followed by flow injection inductively coupled plasma-optical emission spectrometry to determine some heavy metal ions in water samples. Anal. Chim. Acta 2010, 659, 172–177. [Google Scholar] [CrossRef] [PubMed]
- Crocker, J.; Bartram, J. Comparison and cost analysis of drinking water quality monitoring requirements versus practice in seven developing countries. Int. J. Environ. Res. Public Health 2014, 11, 7333–7346. [Google Scholar] [CrossRef]
- Kabir, F.; Chowdhury, S. Arsenic removal methods for drinking water in the developing countries: Technological developments and research needs. Environ. Sci. Pollut. Res. 2017, 24, 24102–24120. [Google Scholar] [CrossRef]
- Cui, F.; Rhee, M.; Singh, A.; Tripathi, A. Microfluidic sample preparation for medical diagnostics. Annu. Rev. Biomed. Eng. 2015, 17, 267–286. [Google Scholar] [CrossRef]
- Lin, Y.; Gritsenko, D.; Feng, S.; Teh, Y.C.; Lu, X.; Xu, J. Detection of heavy metal by paper-based microfluidics. Biosens. Bioelectron. 2016, 83, 256–266. [Google Scholar] [CrossRef]
- Whitesides, G.M. The origins and the future of microfluidics. Nature 2006, 442, 368. [Google Scholar] [CrossRef]
- Gai, H.; Li, Y.; Yeung, E.S. Optical Detection Systems on Microfluidic Chips. Top. Curr. Chem. 2011, 171–201. [Google Scholar] [CrossRef]
- Nge, P.N.; Rogers, C.I.; Woolley, A.T. Advances in microfluidic materials, functions, integration, and applications. Chem. Rev. 2013, 113, 2550–2583. [Google Scholar] [CrossRef] [Green Version]
- Yang, H.; Gijs, M.A. Micro-optics for microfluidic analytical applications. Chem. Soc. Rev. 2018, 47, 1391–1458. [Google Scholar] [CrossRef] [PubMed]
- Manz, A.; Graber, N.; Widmer, H.A. Miniaturized total chemical analysis systems: A novel concept for chemical sensing. Sens. Actuators B Chem. 1990, 1, 244–248. [Google Scholar] [CrossRef]
- Chiu, D.T.; deMello, A.J.; Di Carlo, D.; Doyle, P.S.; Hansen, C.; Maceiczyk, R.M.; Wootton, R.C. Small but perfectly formed? Successes, challenges, and opportunities for microfluidics in the chemical and biological sciences. Chem 2017, 2, 201–223. [Google Scholar] [CrossRef] [Green Version]
- Einav, S.; Gerber, D.; Bryson, P.D.; Sklan, E.H.; Elazar, M.; Maerkl, S.J.; Glenn, J.S.; Quake, S.R. Discovery of a hepatitis C target and its pharmacological inhibitors by microfluidic affinity analysis. Nat. Biotechnol. 2008, 26, 1019. [Google Scholar] [CrossRef] [Green Version]
- Gerber, D.; Maerkl, S.J.; Quake, S.R. An in vitro microfluidic approach to generating protein-interaction networks. Nat. Methods 2009, 6, 71. [Google Scholar] [CrossRef]
- Walsh, C.L.; Babin, B.M.; Kasinskas, R.W.; Foster, J.A.; McGarry, M.J.; Forbes, N.S. A multipurpose microfluidic device designed to mimic microenvironment gradients and develop targeted cancer therapeutics. Lab Chip 2009, 9, 545–554. [Google Scholar] [CrossRef]
- Dossi, N.; Susmel, S.; Toniolo, R.; Pizzariello, A.; Bontempelli, G. Application of microchip electrophoresis with electrochemical detection to environmental aldehyde monitoring. Electrophoresis 2009, 30, 3465–3471. [Google Scholar] [CrossRef] [PubMed]
- Llopis, X.; Pumera, M.; Alegret, S.; Merkoçi, A. Lab-on-a-chip for ultrasensitive detection of carbofuran by enzymatic inhibition with replacement of enzyme using magnetic beads. Lab Chip 2009, 9, 213–218. [Google Scholar] [CrossRef] [PubMed]
- Pol, R.; Céspedes, F.; Gabriel, D.; Baeza, M. Microfluidic lab-on-a-chip platforms for environmental monitoring. TrAC Trends Anal. Chem. 2017, 95, 62–68. [Google Scholar] [CrossRef]
- Ullah, N.; Mansha, M.; Khan, I.; Qurashi, A. Nanomaterial-based optical chemical sensors for the detection of heavy metals in water: Recent advances and challenges. TrAC Trends Anal. Chem. 2018, 100, 155–166. [Google Scholar] [CrossRef]
- Liu, X.; Yao, Y.; Ying, Y.; Ping, J. Recent advances in nanomaterial-enabled screen-printed electrochemical sensors for heavy metal detection. TrAC Trends Anal. Chem. 2019. [Google Scholar] [CrossRef]
- Waheed, A.; Mansha, M.; Ullah, N. Nanomaterials-based electrochemical detection of heavy metals in water: Current status, challenges and future direction. TrAC Trends Anal. Chem. 2018, 105, 37–51. [Google Scholar] [CrossRef]
- Li, Y.; Chen, Y.; Yu, H.; Tian, L.; Wang, Z. Portable and smart devices for monitoring heavy metal ions integrated with nanomaterials. TrAC Trends Anal. Chem. 2018, 98, 190–200. [Google Scholar] [CrossRef]
- Herold, K.E.; Rasooly, A. (Eds.) Lab on a Chip Technology: Fabrication and Microfluidics; Caister Academic Press: Norfolk, UK, 2009; Volume 1. [Google Scholar]
- Yogarajah, N.; Tsai, S.S. Detection of trace arsenic in drinking water: Challenges and opportunities for microfluidics. Environ. Sci. Water Res. Technol. 2015, 1, 426–447. [Google Scholar] [CrossRef]
- Becker, H.; Locascio, L.E. Polymer microfluidic devices. Talanta 2002, 56, 267–287. [Google Scholar] [CrossRef]
- Manz, A.; Harrison, D.J.; Verpoorte, E.M.; Fettinger, J.C.; Paulus, A.; Ludi, H.; Widmer, H.M. Planar chips technology for miniaturization and integration of separation techniques into monitoring systems: Capillary electrophoresis on a chip. J. Chromatogr. A 1992, 593, 253–258. [Google Scholar] [CrossRef]
- Liang, W.; Lin, H.; Chen, J.; Chen, C. Utilization of nanoparticles in microfluidic systems for optical detection. Microsyst. Technol. 2016, 22, 2363–2370. [Google Scholar] [CrossRef]
- Baker, C.A.; Duong, C.T.; Grimley, A.; Roper, M.G. Recent advances in microfluidic detection systems. Bioanalysis 2009, 1, 967–975. [Google Scholar] [CrossRef] [Green Version]
- Mohod, C.V.; Dhote, J. Review of heavy metals in drinking water and their effect on human health. Int. J. Innov. Res. Sci. Eng. Technol. 2013, 2, 2992–2996. [Google Scholar]
- Marle, L.; Greenway, G.M. Microfluidic devices for environmental monitoring. TrAC Trends Anal. Chem. 2005, 24, 795–802. [Google Scholar] [CrossRef]
- Lu, Q.; Copper, C.L.; Collins, G.E. Ultraviolet absorbance detection of colchicine and related alkaloids on a capillary electrophoresis microchip. Anal. Chim. Acta 2006, 572, 205–211. [Google Scholar] [CrossRef]
- Billot, L.; Plecis, A.; Chen, Y. Multi-reflection based on chip label free molecules detection. Microelectron. Eng. 2008, 85, 1269–1271. [Google Scholar] [CrossRef]
- Petersen, N.J.; Mogensen, K.B.; Kutter, J.P. Performance of an in-plane detection cell with integrated waveguides for UV/Vis absorbance measurements on microfluidic separation devices. Electrophoresis 2002, 23, 3528–3536. [Google Scholar] [CrossRef]
- Gustafsson, O.; Mogensen, K.B.; Ohlsson, P.D.; Liu, Y.; Jacobson, S.C.; Kutter, J.P. An electrochromatography chip with integrated waveguides for UV absorbance detection. J. Micromech. Microeng. 2008, 18. [Google Scholar] [CrossRef]
- Llobera, A.; Wilke, R.; Buttgenbach, S. Poly (dimethylsiloxane) hollow Abbe prism with microlenses for detection based on absorption and refractive index shift. Lab Chip 2004, 4, 24–27. [Google Scholar] [CrossRef]
- Yeh, P.; Yeh, N.; Lee, C.H.; Ding, T.J. Applications of LEDs in optical sensors and chemical sensing device for detection of biochemicals, heavy metals, and environmental nutrients. Renew. Sustain. Energy Rev. 2017, 75, 461–468. [Google Scholar] [CrossRef]
- Lace, A.; Ryan, D.; Bowkett, M.; Cleary, J. Arsenic monitoring in water by colorimetry using an optimized leucomalachite green method. Molecules 2019, 24, 339. [Google Scholar] [CrossRef] [Green Version]
- Lace, A.; Ryan, D.; Bowkett, M.; Cleary, J. Arsenic detection in water using microfluidic detection systems based on the leucomalachite green method. Anal. Methods 2019, 11, 5431–5438. [Google Scholar] [CrossRef]
- Lace, A.; Ryan, D.; Bowkett, M.; Cleary, J. Chromium Monitoring in Water by Colorimetry Using Optimised 1,5-Diphenylcarbazide Method. Int. J. Environ. Res. Public Health 2019, 16, 1803. [Google Scholar] [CrossRef] [Green Version]
- O’Toole, M.; Lau, K.T.; Schazmann, B.; Shepherd, R.; Nesterenko, P.N.; Paull, B.; Diamond, D. Novel integrated paired emitter-detector diode (PEDD) as a miniaturized photometric detector in HPLC. Analyst 2006, 131, 938–943. [Google Scholar] [CrossRef] [Green Version]
- O’Toole, M.; Barron, L.; Shepherd, R.; Nesterenko, P.; Paull, B.; Diamond, D. Paired emitter-detector diode detection with dual wavelength monitoring for enhanced sensitivity to transition metals in ion chromatography with post-column reaction. Analyst 2009, 134, 124–130. [Google Scholar]
- Donohoe, A.; McCaul, M.; Lacour, G.; Navarro-Hérnandez, C.; Fanjul-Bolado, P.; Diamond, D. Development of cost-effective sensors for the in-situ monitoring of heavy metals. In Proceedings of the Analytical Research Forum 2017, London, UK, 7 July 2017. [Google Scholar]
- Milani, A.; Statham, P.J.; Mowlem, M.C.; Connelly, D.P. Development and application of a microfluidic in-situ analyzer for dissolved Fe and Mn in natural waters. Talanta 2015, 136, 15–22. [Google Scholar] [CrossRef]
- Du, W.B.; Fang, Q.; He, Q.H.; Fang, Z.L. High-throughput nanoliter sample introduction microfluidic chip-based flow injection analysis system with gravity-driven flows. Anal. Chem. 2005, 77, 1330–1337. [Google Scholar] [CrossRef]
- Nuriman Kuswandi, B.; Verboom, W. Optical fiber chemical sensing of Hg (II) ions in aqueous samples using a microfluidic device containing a selective tripodal chromoionophore-PVC film. Sens. Actuators B Chem. 2011, 157, 438–443. [Google Scholar] [CrossRef]
- Busa, L.; Mohammadi, S.; Maeki, M.; Ishida, A.; Tani, H.; Tokeshi, M. Advances in microfluidic paper-based analytical devices for food and water analysis. Micromachines 2016, 7, 86. [Google Scholar] [CrossRef]
- Satarpai, T.; Shiowatana, J.; Siripinyanond, A. Paper based analytical device for sampling, on-site preconcentration and detection of ppb lead in water. Talanta 2016, 154, 504–510. [Google Scholar] [CrossRef] [PubMed]
- Chauhan, S.; Upadhyay, L.S.B. An efficient protocol to use iron oxide nanoparticles in microfluidic paper device for arsenic detection. MethodsX 2018, 5, 1528–1533. [Google Scholar] [CrossRef] [PubMed]
- Cai, L.; Fang, Y.; Mo, Y.; Huang, Y.; Xu, C.; Zhang, Z.; Wang, M. Visual quantification of Hg on a microfluidic paper-based analytical device using distance-based detection technique. AIP Adv. 2017, 7, 085214. [Google Scholar] [CrossRef] [Green Version]
- Sharifi, H.; Tashkhourian, J.; Hemmateenejad, B. A 3D origami paper-based analytical device combined with PVC membrane for colorimetric assay of heavy metal ions: Application to determination of Cu(II) in water samples. Anal. Chim. Acta 2020, 1126, 114–123. [Google Scholar] [CrossRef] [PubMed]
- Chowdury, M.; Walji, N.; Mahmud, M.; MacDonald, B. Paper based microfluidic device with a gold nanosensor to detect arsenic contamination of groundwater in Bangladesh. Micromachines 2017, 8, 71. [Google Scholar] [CrossRef] [Green Version]
- Devadhasan, J.P.; Kim, J. A chemically functionalized paper-based microfluidic platform for multiplex heavy metal detection. Sens. Actuators B Chem. 2018, 273, 18–24. [Google Scholar] [CrossRef]
- Sun, J.; Xianyu, Y.; Jiang, X. Point-of-care biochemical assays using gold nanoparticle-implemented microfluidics. Chem. Soc. Rev. 2014, 43, 6239–6253. [Google Scholar] [CrossRef] [PubMed]
- Li, D.-E.; Lin, C.-H. Microfluidic chip for droplet-based AuNP synthesis with dielectric barrier discharge plasma and on-chip mercury ion detection. RSC Adv. 2018, 8, 16139–16145. [Google Scholar] [CrossRef] [Green Version]
- Kamnoet, P.; Aeungmaitrepirom, W.; Menger, R.F.; Henry, C. Highly selective simultaneous Cu (II), Co (II), Ni (II), Hg (II), Mn (II) determination in water samples on microfluidic paper-based analytical devices. Analyst 2021. [Google Scholar] [CrossRef]
- Grasianto Fukuyama, M.; Mott, D.M.; Koseki, Y.; Kasai, H.; Hibara, A. Organic nanocrystal enrichment in paper microfluidic analysis. Sens. Actuators B Chem. 2021, 2021, 129548. [Google Scholar] [CrossRef]
- Jain, R.; Thakur, A.; Kaur, P.; Kim, K.-H.; Devi, P. Advances in Imaging-Assisted Sensing Techniques for Heavy Metals in Water: Trends, Challenges, and Opportunities. TrAC Trends Anal. Chem. 2019, 123, 115758. [Google Scholar] [CrossRef]
- Reyes, D.R.; Iossifidis, D.; Auroux, P.A.; Manz, A. Micro total analysis systems. 1. Introduction theory, and technology. Anal. Chem. 2002, 74, 2623–2636. [Google Scholar] [CrossRef]
- Hata, K.; Kichise, Y.; Kaneta, T.; Imasaka, T. Hadamard transform microchip electrophoresis combined with diode laser fluorometry. Anal. Chem. 2003, 75, 1765–1768. [Google Scholar] [CrossRef]
- Zukauskas, A.; Shur, M.S.; Gaska, R. Introduction to Solid-State Lighting; John Wiley & Sons: Hoboken, NJ, USA, 2002. [Google Scholar]
- Kovac, J.; Peternai, L.; Lengyel, O. Advanced light emitting diodes structures for optoelectronic applications. Thin Solid Films 2003, 433, 22–26. [Google Scholar] [CrossRef]
- Miyaki, K.; Guo, Y.; Shimosaka, T.; Nakagama, T.; Nakajima, H.; Uchiyama, K. Fabrication of an integrated PDMS microchip incorporating an LED-induced fluorescence device. Anal. Bioanal. Chem. 2005, 382, 810–816. [Google Scholar] [CrossRef]
- Auroux, P.A.; Iossifidis, D.; Reyes, D.R.; Manz, A. Micro total analysis systems. 2. Analytical standard operations and applications. Anal. Chem. 2002, 74, 2637–2652. [Google Scholar] [CrossRef] [PubMed]
- Gao, J.; Yin, X.F.; Fang, Z.L. Integration of single cell injection, cell lysis, separation and detection of intracellular constituents on a microfluidic chip. Lab Chip 2004, 4, 47–52. [Google Scholar] [CrossRef] [PubMed]
- Rezende, L.C.; Emery, F.S. Fluorescence quenching of two meso-substituted tetramethyl BODIPY dyes by Fe (III) cation. J. Braz. Chem. Soc. 2015, 26, 1048–1053. [Google Scholar] [CrossRef]
- Bell, J.; Climent, E.; Hecht, M.; Buurman, M.; Rurack, K. Combining a droplet-based microfluidic tubing system with gated indicator releasing nanoparticles for mercury trace detection. ACS Sens. 2016, 1, 334–338. [Google Scholar] [CrossRef]
- Kou, S.; Nam, S.W.; Shumi, W.; Lee, M.H.; Bae, S.W.; Du, J.; Kim, J.S.; Hong, J.I.; Peng, X.; Yoon, J.; et al. Microfluidic detection of multiple heavy metal ions using fluorescent chemosensors. Bull. Korean Chem. Soc. 2009, 30, 1173–1176. [Google Scholar]
- Morakot, N.; Tomapatanaget, B.; Ngeon-Tae, W.; Aeungmaitrepirom, W.; Tuntulani, T. Synthesis and fluorescence sensing properties of calix[4]arenes containing fluorophores. Supramol. Chem. 2005, 17, 655–659. [Google Scholar] [CrossRef]
- Faye, D.; Lefevre, J.P.; Delaire, J.A.; Leray, I. A selective lead sensor based on a fluorescent molecular probe grafted on a PDMS microfluidic chip. J. Photochem. Photobiol. A Chem. 2012, 234, 115–122. [Google Scholar] [CrossRef]
- Zhao, L.; Wu, T.; Lefevre, J.P.; Leray, I.; Delaire, J.A. Fluorimetric lead detection in a microfluidic device. Lab Chip 2009, 9, 2818–2823. [Google Scholar] [CrossRef]
- Wu, T.; Zhao, L.; Faye, D.; Lefevre, J.P.; Delaire, J.; Leray, I. Determination of lead in water by combining precolumn adsorption and fluorimetric detection in a microfluidic device. Anal. Methods 2012, 4, 989–994. [Google Scholar] [CrossRef]
- Saha, S.; Mahato, P.; Baidya, M.; Ghosh, S.K.; Das, A. An interrupted PET coupled TBET process for the design of a specific receptor for Hg 2+ and its intracellular detection in MCF7 cells. Chem. Commun. 2012, 48, 9293–9295. [Google Scholar] [CrossRef]
- Lu, H.; Qi, S.; Mack, J.; Li, Z.; Lei, J.; Kobayashi, N.; Shen, Z. Facile Hg2+ detection in water using fluorescent self-assembled monolayers of a rhodamine-based turn-on chemodosimeter formed via a “click” reaction. J. Mater. Chem. 2011, 21, 10878–10882. [Google Scholar] [CrossRef]
- Xu, L.; Xu, Y.; Zhu, W.; Sun, X.; Xu, Z.; Qian, X. Modulating the selectivity by switching sensing media: A bifunctional chemosensor selectivity for Cd2+ and Pb2+ in different aqueous solutions. RSC Adv. 2012, 2, 6323–6328. [Google Scholar] [CrossRef]
- Xiang, Y.; Tong, A.; Jin, P.; Ju, Y. New fluorescent rhodamine hydrazone chemosensor for Cu (II) with high selectivity and sensitivity. Org. Lett. 2006, 8, 2863–2866. [Google Scholar] [CrossRef] [PubMed]
- Kim, H.; Rao, B.A.; Jeong, J.; Angupillai, S.; Choi, J.S.; Nam, J.O.; Lee, C.S.; Son, Y.A. A rhodamine scaffold immobilized onto mesoporous silica as a fluorescent probe for the detection of Fe (III) and applications in bio-imaging and microfluidic chips. Sens. Actuators B Chem. 2016, 224, 404–412. [Google Scholar] [CrossRef]
- Zhang, H.; Faye, D.; Lefèvre, J.P.; Delaire, J.A.; Leray, I. Selective fluorimetric detection of cadmium in a microfluidic device. Microchem. J. 2013, 106, 167–173. [Google Scholar] [CrossRef]
- Peng, G.; He, Q.; Lu, Y.; Huang, J.; Lin, J.M. Flow injection microfluidic device with on-line fluorescent derivatization for the determination of Cr (III) and Cr (VI) in water samples after solid phase extraction. Anal. Chim. Acta 2017, 955, 58–66. [Google Scholar] [CrossRef]
- Kang, K.A.; Wang, J.; Jasinski, J.B.; Achilefu, S. Fluorescence manipulation by gold nanoparticles: From complete quenching to extensive enhancement. J. Nanobiotechnol. 2011, 9, 16. [Google Scholar] [CrossRef] [Green Version]
- Lafleur, J.P.; Senkbeil, S.; Jensen, T.G.; Kutter, J.P. Gold nanoparticle-based optical microfluidic sensors for analysis of environmental pollutants. Lab Chip 2012, 12, 4651–4656. [Google Scholar] [CrossRef]
- Jebrail, M.J.; Wheeler, A.R. Let’s get digital: Digitizing chemical biology with microfluidics. Curr. Opin. Chem. Biol. 2010, 14, 574–581. [Google Scholar] [CrossRef]
- Zhang, Q.; Zhang, X.; Zhang, X.; Jiang, L.; Yin, J.; Zhang, P.; Han, S.; Wang, Y.; Zheng, G. A feedback-controlling digital microfluidic fluorimetric sensor device for simple and rapid detection of mercury (II) in costal seawater. Mar. Pollut. Bull. 2019, 144, 20–27. [Google Scholar] [CrossRef]
- Wang, X.; Kong, L.; Gan, Y.; Liang, T.; Zhou, S.; Sun, J.; Wan, H.; Wang, P. Microfluidic-based fluorescent electronic eye with CdTe/CdS core-shell quantum dots for trace detection of cadmium ions. Anal. Chim. Acta 2020, 1131, 126–135. [Google Scholar] [CrossRef] [PubMed]
- Schwarz, M.A.; Hauser, P.C. Recent developments in detection methods for microfabricated analytical devices. Lab Chip 2001, 1, 1–6. [Google Scholar] [CrossRef] [PubMed]
- Esch, M.B.; Locascio, L.E.; Tarlov, M.J.; Durst, R.A. Detection of Viable Cryptosporidium P arvum Using DNA-Modified Liposomes in a Microfluidic Chip. Anal. Chem. 2001, 73, 2952–2958. [Google Scholar] [CrossRef] [PubMed]
- Broyles, B.S.; Jacobson, S.C.; Ramsey, J.M. Sample filtration, concentration, and separation integrated on microfluidic devices. Anal. Chem. 2003, 75, 2761–2767. [Google Scholar] [CrossRef]
- Bromberg, A.; Mathies, R.A. Homogeneous immunoassay for detection of TNT and its analogues on a microfabricated capillary electrophoresis chip. Anal. Chem. 2003, 75, 1188–1195. [Google Scholar] [CrossRef]
- Barnett, N.W.; Francis, P.S. Chemiluminescence: Liquid-Phase. In Encyclopedia of Analytical Science; Worsfold, P.J., Townshend, A., Poole, C.F., Eds.; Elsevier: Oxford, UK, 2005; pp. 511–521. [Google Scholar]
- Nogami, T.; Hashimoto, M.; Tsukagoshi, K. Metal ion analysis using microchip CE with chemiluminescence detection based on 1, 10-phenanthroline–hydrogen peroxide reaction. J. Sep. Sci. 2009, 32, 408–412. [Google Scholar] [CrossRef]
- Sun, H.; Li, W.; Dong, Z.Z.; Hu, C.; Leung, C.H.; Ma, D.L.; Ren, K. A suspending-droplet mode paper-based microfluidic platform for low-cost, rapid, and convenient detection of lead (II) ions in liquid solution. Biosens. Bioelectron. 2018, 99, 361–367. [Google Scholar] [CrossRef]
- Som-Aum, W.; Li, H.; Liu, J.; Lin, J.M. Determination of arsenate by sorption pre-concentration on polystyrene beads packed in a microfluidic device with chemiluminescence detection. Analyst 2008, 133, 1169–1175. [Google Scholar] [CrossRef]
- Khan, P.; Idrees, D.; Moxley, M.A.; Corbett, J.A.; Ahmad, F.; von Figura, G.; Sly, W.S.; Waheed, A.; Hassan, M.I. Luminol-based chemiluminescent signals: Clinical and non-clinical application and future uses. Appl. Biochem. Biotechnol. 2014, 173, 333–355. [Google Scholar] [CrossRef] [Green Version]
- Som-Aum, W.; Threeprom, J.; Li, H.; Lin, J.M. Determination of chromium (III) and total chromium using dual channels on glass chip with chemiluminescence detection. Talanta 2007, 71, 2062–2068. [Google Scholar] [CrossRef]
- Lv, J.; Zhang, Z. A microchip with air sampling and chemiluminescence detection for analyzing iron in nature water and in whole blood. Anal. Lett. 2004, 37, 1401–1410. [Google Scholar] [CrossRef]
- Chen, G.; Guo, Z.; Zeng, G.; Tang, L. Fluorescent and colorimetric sensors for environmental mercury detection. Analyst 2015, 140, 5400–5443. [Google Scholar] [CrossRef] [PubMed]
- Ge, L.; Yu, J.; Ge, S.; Yan, M. Lab-on-paper-based devices using chemiluminescence and electrogenerated chemiluminescence detection. Anal. Bioanal. Chem. 2014, 406, 5613–5630. [Google Scholar] [CrossRef] [PubMed]
- Alahmad, W.; Uraisin, K.; Nacapricha, D.; Kaneta, T. A miniaturized chemiluminescence detection system for a microfluidic paper-based analytical device and its application to the determination of chromium (III). Anal. Methods 2016, 8, 5414–5420. [Google Scholar] [CrossRef]
- Bhandari, P.; Narahari, T.; Dendukuri, D. ‘Fab-Chips’: A versatile, fabric-based platform for low-cost, rapid and multiplexed diagnostics. Lab Chip 2011, 11, 2493–2499. [Google Scholar] [CrossRef] [PubMed]
- Li, Y.; Liu, N.; Liu, H.; Wang, Y.; Hao, Y.; Ma, X.; Wang, C. A novel label-free fluorescence assay for one-step sensitive detection of Hg 2+ in environmental drinking water samples. Sci. Rep. 2017, 7, 45974. [Google Scholar] [CrossRef] [Green Version]
- Liu, R.; Zhang, P.; Li, H.; Zhang, C. Lab-on-cloth integrated with gravity/capillary flow chemiluminescence (GCF-CL): Towards simple, inexpensive, portable, flow system for measuring trivalent chromium in water. Sens. Actuators B Chem. 2016, 236, 35–43. [Google Scholar] [CrossRef]
- Wang, W.; Mai, Z.; Chen, Y.; Wang, J.; Li, L.; Su, Q.; Li, X.; Hong, X. A label-free fiber optic SPR biosensor for specific detection of C-reactive protein. Sci. Rep. 2017, 7, 16904. [Google Scholar] [CrossRef]
- Sadrolhosseini, A.R.; Noor, A.S.M.; Maarof Moksin, M. Applications of surface plasmon resonance based on a metal nanoparticle. In Plasmonics-Principles and Applications; Kim, K.Y., Ed.; IntechOpen: London, UK, 2012; pp. 253–282. [Google Scholar]
- Olaru, A.; Bala, C.; Jaffrezic-Renault, N.; Aboul-Enein, H.Y. Surface plasmon resonance (SPR) biosensors in pharmaceutical analysis. Crit. Rev. Anal. Chem. 2015, 45, 97–105. [Google Scholar] [CrossRef]
- Tabassum, R.; Gupta, B.D. Simultaneous estimation of vitamin K1 and heparin with low limit of detection using cascaded channels fiber optic surface plasmon resonance. Biosens. Bioelectron. 2016, 86, 48–55. [Google Scholar] [CrossRef] [PubMed]
- Motalebizadeh, A.; Bagheri, H.; Asiaei, S.; Fekrat, N.; Afkhami, A. New portable smartphone-based PDMS microfluidic kit for the simultaneous colorimetric detection of arsenic and mercury. RSC Adv. 2018, 8, 27091–27100. [Google Scholar] [CrossRef] [Green Version]
- Nguyen, N.L.T.; Kim, E.J.; Chang, S.K.; Park, T.J. Sensitive detection of lead ions using sodium thiosulfate and surfactant-capped gold nanoparticles. Biochip J. 2016, 10, 65–73. [Google Scholar] [CrossRef]
- Gómez-de Pedro, S.; Lopes, D.; Miltsov, S.; Izquierdo, D.; Alonso-Chamarro, J.; Puyol, M. Optical microfluidic system based on ionophore modified gold nanoparticles for the continuous monitoring of mercuric ion. Sens. Actuators B Chem. 2014, 194, 19–26. [Google Scholar] [CrossRef]
- Apilux, A.; Siangproh, W.; Praphairaksit, N.; Chailapakul, O. Simple and rapid colorimetric detection of Hg (II) by a paper-based device using silver nanoplates. Talanta 2012, 97, 388–394. [Google Scholar] [CrossRef]
- Johnston, H.J.; Hutchison, G.; Christensen, F.M.; Peters, S.; Hankin, S.; Stone, V. A review of the in vivo and in vitro toxicity of silver and gold particulates: Particle attributes and biological mechanisms responsible for the observed toxicity. Crit. Rev. Toxicol. 2010, 40, 328–346. [Google Scholar] [CrossRef] [PubMed]
- Lapresta-Fernández, A.; Fernandez, A.; Blasco, J. Nanoecotoxicity effects of engineered silver and gold nanoparticles in aquatic organisms. TrAC Trends Anal. Chem. 2012, 32, 40–59. [Google Scholar] [CrossRef]
- Pourreza, N.; Golmohammadi, H.; Rastegarzadeh, S. Highly selective and portable chemosensor for mercury determination in water samples using curcumin nanoparticles in a paper based analytical device. RSC Adv. 2016, 6, 69060–69066. [Google Scholar] [CrossRef]
- Wackerlig, J.; Lieberzeit, P.A. Molecularly imprinted polymer in nanoparticles in chemical sensing-synthesis, characterization and application. Sens. Actuators B Chem. 2015, 207, 144–157. [Google Scholar] [CrossRef]
- Chen, L.; Xu, S.; Li, J. Recent advances in molecular imprinting technology: Current status, challenges and highlighted applications. Chem. Soc. Rev. 2011, 40, 2922–2942. [Google Scholar] [CrossRef]
- Shrivastav, A.M.; Gupta, B.D. Ion-imprinted nanoparticles for the concurrent estimation of Pb (II) and Cu (II) ions over a two channel surface plasmon resonance-based fiber optic platform. J. Biomed. Opt. 2018, 23, 017001. [Google Scholar] [CrossRef]
- Wongkaew, N.; He, P.; Kurth, V.; Surareungchai, W.; Baeumner, A.J. Multi-channel PMMA microfluidic biosensor with integrated IDUAs for electrochemical detection. Anal. Bioanal. Chem. 2013, 405, 5965–5974. [Google Scholar] [CrossRef] [PubMed] [Green Version]
- Wang, J. Portable electrochemical systems. TrAC Trends Anal. Chem. 2002, 21, 226–232. [Google Scholar] [CrossRef]
- Dong, H.; Li, C.M.; Zhang, Y.F.; Cao, X.D.; Gan, Y. Screen-printed microfluidic device for electrochemical immuneoassay. Lab Chip 2007, 7, 1752–1758. [Google Scholar] [CrossRef] [PubMed]
- Gencoglu, A.; Minerick, A.R. Electrochemical detection techniques in micro- and nanofluidic devices. Microfluid. Nanofluid. 2014, 17, 781–807. [Google Scholar] [CrossRef]
- Hong, Y.; Wu, M.; Chen, G.; Dai, Z.; Zhang, Y.; Chen, G.; Dong, X. 3D printed microfluidic device with microporous Mn2O3-modified screen printed electrode for real-time determination of heavy metal ions. ACS Appl. Mater. Interfaces 2016, 8, 32940–32947. [Google Scholar] [CrossRef]
- Morozan, A.; Jaouen, F. Metal organic frameworks for electrochemical applications. Energy Environ. Sci. 2012, 5, 9269–9290. [Google Scholar] [CrossRef]
- Yang, G.; Yan, W.; Wang, J.; Yang, H. Fabrication and formation mechanism of Mn2O3 hollow nanofibers by single-spinneret electrospinning. CrystEngComm 2014, 16, 6907–6913. [Google Scholar] [CrossRef]
- Li, Q.; Yin, L.; Li, Z.; Wang, X.; Qi, Y.; Ma, J. Copper doped hollow structured manganese oxide mesocrystals with controlled phase structure and morphology as anode materials for lithium ion battery with improved electrochemical performance. ACS Appl. Mater. Interfaces 2013, 5, 10975–10984. [Google Scholar] [CrossRef]
- Le, T.S.; Da Costa, P.; Huguet, P.; Sistat, P.; Pichot, F.; Silva, F.; Renaud, L.; Cretin, M. Upstream microelectrodialysis for heavy metals detection on boron doped diamond. J. Electroanal. Chem. 2012, 670, 50–55. [Google Scholar] [CrossRef]
- Li, S.; Zhang, C.; Wang, S.; Liu, Q.; Feng, H.; Ma, X.; Guo, J. Electrochemical microfluidics techniques for heavy metal ion detection. Analyst 2018, 143, 4230–4246. [Google Scholar] [CrossRef]
- Nguyen, H.L.; Cao, H.H.; Nguyen, D.T.; Nguyen, V.A. Sodium dodecyl sulfate doped polyaniline for enhancing the electrochemical sensitivity of mercury ions. Electroanalysis 2017, 29, 595–601. [Google Scholar] [CrossRef]
- Adkins, J.; Boehle, K.; Henry, C. Electrochemical paper-based microfluidic devices. Electrophoresis 2015, 36, 1811–1824. [Google Scholar] [CrossRef]
- Nie, Z.; Nijhuis, C.A.; Gong, J.; Chen, X.; Kumachev, A.; Martinez, A.W.; Narovlyansky, M.; Whitesides, G.M. Electrochemical sensing in paper-based microfluidic devices. Lab Chip 2010, 10, 477–483. [Google Scholar] [CrossRef] [Green Version]
- Shi, J.; Tang, F.; Xing, H.; Zheng, H.; Lianhua, B.; Wei, W. Electrochemical detection of Pb and Cd in paper-based microfluidic devices. J. Braz. Chem. Soc. 2012, 23, 1124–1130. [Google Scholar] [CrossRef]
- Shen, L.L.; Zhang, G.R.; Li, W.; Biesalski, M.; Etzold, B.J. Modifier-free microfluidic electrochemical sensor for heavy-metal detection. ACS Omega 2017, 2, 4593–4603. [Google Scholar] [CrossRef] [PubMed] [Green Version]
- Hutton, E.A.; van Elteren, J.T.; Ogorevc, B.; Smyth, M.R. Validation of bismuth film electrode for determination of cobalt and cadmium in soil extracts using ICP–MS. Talanta 2004, 63, 849–855. [Google Scholar] [CrossRef]
- Rehacek, V.; Hotovy, I.; Vojs, M. Bismuth-coated diamond-like carbon microelectrodes for heavy metals determination. Sens. Actuators B Chem. 2007, 127, 193–197. [Google Scholar] [CrossRef]
- Zou, Z.; Jang, A.; MacKnight, E.; Wu, P.M.; Do, J.; Bishop, P.L.; Ahn, C.H. Environmentally friendly disposable sensors with microfabricated on-chip planar bismuth electrode for in situ heavy metal ions measurement. Sens. Actuators B Chem. 2008, 134, 18–24. [Google Scholar] [CrossRef]
- Nantaphol, S.; Channon, R.B.; Kondo, T.; Siangproh, W.; Chailapakul, O.; Henry, C.S. Boron doped diamond paste electrodes for microfluidic paper-based analytical devices. Anal. Chem. 2017, 89, 4100–4107. [Google Scholar] [CrossRef] [PubMed]
- Luong, J.H.; Male, K.B.; Glennon, J.D. Boron-doped diamond electrode: Synthesis, characterization, functionalization and analytical applications. Analyst 2009, 134, 1965–1979. [Google Scholar] [CrossRef] [Green Version]
- Compton, R.G.; Foord, J.S.; Marken, F. Electroanalysis at diamond-like and doped-diamond electrodes. Electroanal. Int. J. Devoted Fundam. Pract. Asp. Electroanal. 2003, 15, 1349–1363. [Google Scholar] [CrossRef]
- Pungjunun, K.; Chaiyo, S.; Jantrahong, I.; Nantaphol, S.; Siangproh, W.; Chailapakul, O. Anodic stripping voltammetric determination of total arsenic using a gold nanoparticle-modified boron-doped diamond electrode on a paper-based device. Microchim. Acta 2018, 185, 324. [Google Scholar] [CrossRef] [PubMed]
- Subramanian, V.; Lee, S.; Jena, S.; Kanti Jana, S.; Ray, D.; Kim, S.J.; Thalappil, P. Enhancing the sensitivity of point-of-use electrochemical microfluidic sensors by ion concentration polarization—A case study on arsenic. Sens. Actuators B Chem. 2020, 304, 127340. [Google Scholar] [CrossRef]
- Díaz-González, M.; Fernández-Sánchez, C. Decentralized analysis of water contaminants using compact (bio)electroanalytical tools. Curr. Opin. Environ. Sci. Health 2019, 10, 47–56. [Google Scholar] [CrossRef]
- Jarup, L. Hazards of heavy metal contamination. Br. Med. Bull. 2003, 68, 167–182. [Google Scholar] [CrossRef] [PubMed] [Green Version]
- Sartore, L.; Barbaglio, M.; Borgese, L.; Bontempi, E. Polymer-grafted QCM chemical sensor and application to heavy metal ions real time detection. Sens. Actuators B Chem. 2011, 155, 538–544. [Google Scholar] [CrossRef] [Green Version]
- Qiao, X.; Zhang, X.; Tian, Y.; Meng, Y. Progresses on the theory and application of quartz crystal microbalance. Appl. Phys. Rev. 2016, 3, 031106. [Google Scholar] [CrossRef]
- Ghaedi, M.; Ahmadi, F.; Shokrollahi, A. Simultaneous preconcentration and determination of copper, nickel, cobalt and lead ions content by flame atomic absorption spectrometry. J. Hazard. Mater. 2007, 142, 272–278. [Google Scholar] [CrossRef]
- Grabchev, I.; Staneva, D.; Dumas, S.; Chovelon, J.M. Metal ions and protons sensing properties of new fluorescent 4-N-methylpiperazine-1, 8-naphthalimide terminated poly(propyleneamine) dendrimer. J. Mol. Struct. 2011, 999, 16–21. [Google Scholar] [CrossRef]
- Shen, C.Y.; Yeh, R.; Chung, M.H.; Hwang, R.C. Analytical Performance and Characterization of a Quartz Crystal Microbalance for the Detection of Cu (II) Ions in Water. J. Electr. Electron. Eng. 2016, 4, 103–108. [Google Scholar] [CrossRef]
- Wang, S.H.; Shen, C.Y.; Lin, Y.M.; Du, J.C. Piezoelectric sensor for sensitive determination of metal ions based on the phosphate-modified dendrimer. Smart Mater. Struct. 2016, 25, 085018. [Google Scholar] [CrossRef]
- Clever, G.H.; Kaul, C.; Carell, T. DNA–metal base pairs. Angew. Chem. Int. Ed. 2007, 46, 6226–6236. [Google Scholar] [CrossRef] [PubMed]
- Miyake, Y.; Togashi, H.; Tashiro, M.; Yamaguchi, H.; Oda, S.; Kudo, M.; Tanaka, Y.; Kondo, Y.; Sawa, R.; Fujimoto, T.; et al. MercuryII-mediated formation of thymine-HgII-thymine base pairs in DNA duplexes. J. Am. Chem. Soc. 2006, 128, 2172–2173. [Google Scholar] [CrossRef] [PubMed]
- Sheng, Z.H.; Han, J.H.; Zhang, J.P.; Zhao, H.; Jiang, L. Method for detection of Hg2+ based on the specific thymine-Hg2+-thymine interaction in the DNA hybridization on the surface of quartz crystal microbalance. Colloids Surf. B Biointerfaces 2011, 87, 289–292. [Google Scholar] [CrossRef] [PubMed]
- Dong, Z.-M.; Zhao, G.C. Quartz Crystal Microbalance Aptasensor for Sensitive Detection of Mercury (II) Based on Signal Amplification with Gold Nanoparticles. Sensors 2012, 12, 7080–7094. [Google Scholar] [CrossRef] [PubMed] [Green Version]
- Mei, S.H.J.; Liu, Z.; Brennan, J.D.; Li, Y. An Efficient RNA-Cleaving DNA Enzyme that Synchronizes Catalysis with Fluorescence Signaling. J. Am. Chem. Soc. 2003, 125, 412–420. [Google Scholar] [CrossRef] [PubMed]
- Ono, A.; Togashi, H. Highly selective oligonucleotide-based sensor for mercury (II) in aqueous solutions. Angew. Chem. Int. Ed. 2004, 43, 4300–4302. [Google Scholar] [CrossRef]
- Teh, H.B.; Li, H.; Yau Li, S.F. Highly sensitive and selective detection of Pb2+ions using a novel and simple DNAzyme-based quartz crystal microbalance with dissipation biosensor. Analyst 2014, 139, 5170–5175. [Google Scholar] [CrossRef]
- Can, N.; Omur, B.C.; Altındal, A. Adsorption kinetics of cd2+ ions onto MgPz thin film. Anadolu Üniversitesi Bilim Ve Teknol. Derg. A-Uygul. Bilimler Ve Mühendislik 2016, 17, 622–632. [Google Scholar] [CrossRef] [Green Version]
- Drescher, K.; Shen, Y.; Bassler, B.L.; Stone, H.A. Biofilm streamers cause catastrophic disruption of flow with consequences for environmental and medical systems. Proc. Natl. Acad. Sci. USA 2013, 110, 4345–4350. [Google Scholar] [CrossRef] [Green Version]
- van Hullebusch, E.; Zandvoort, M.; Lens, P. Metal immobilisation by biofilms: Mechanisms and analytical tools. Rev. Environ. Sci. Biotechnol. 2003, 2, 9–33. [Google Scholar] [CrossRef]
- Zeng, W.; Jacobi, I.; Beck, D.J.; Li, S.; Stone, H.A. Characterization of syringe-pump-driven induced pressure fluctuations in elastic microchannels. Lab Chip 2015, 15, 1110–1115. [Google Scholar] [CrossRef] [PubMed]
- Atencia, J.; Beebe, D.J. Steady flow generation in microcirculatory systems. Lab Chip 2006, 6, 567. [Google Scholar] [CrossRef] [PubMed]
- Niessner, R. Measuring the invisible. Anal. Chem. 2010, 82, 7863. [Google Scholar] [CrossRef] [PubMed]
- Boehle, K.E.; Doan, E.; Henry, S.; Beveridge, J.R.; Pallickara, S.L.; Henry, C.S. Single board computing system for automated colorimetric analysis on low-cost analytical devices. Anal. Methods 2018, 10, 5282–5290. [Google Scholar] [CrossRef]
- Wu, Y.-T.; Yang, C.-; Ko, C.-H.; Wang, Y.-N.; Liu, C.-C.; Fu, L.-M. Microfluidic detection platform with integrated micro-spectrometer system. Chem. Eng. J. 2020, 393, 124700. [Google Scholar] [CrossRef]
- Capitan-Vallvey, L.F.; Palma, A.J. Recent developments in handheld and portable optosensing—A review. Anal. Chim. Acta 2011, 696, 27–46. [Google Scholar] [CrossRef] [PubMed]
Figure 1.
(a) Diagram of the microfluidic chip; (b) photograph of the tinted polymethyl methacrylate (PMMA) chip [71]. Figure reprinted with permission from Elsevier.
Figure 1.
(a) Diagram of the microfluidic chip; (b) photograph of the tinted polymethyl methacrylate (PMMA) chip [71]. Figure reprinted with permission from Elsevier.

Figure 2.
Diagram illustrating the uncapping reaction between 2,4-bis(4-dialkylaminophenyl)-3-hydroxy-4-alkylsulfanylcyclobut-2-enone (APC) and Hg (top) and the microfluidic detection system setup (bottom) [94]. Copyright (2016) American Chemical Society.
Figure 2.
Diagram illustrating the uncapping reaction between 2,4-bis(4-dialkylaminophenyl)-3-hydroxy-4-alkylsulfanylcyclobut-2-enone (APC) and Hg (top) and the microfluidic detection system setup (bottom) [94]. Copyright (2016) American Chemical Society.

Figure 3.
A diagram of the fabrication process of SD-μPADs by Sun et al. [118]. (A) The manufacturing process of superhydrophobic coating on the paper substrate. A negative-relief Teflon stamp was placed onto a polydimethylsiloxane (PDMS)-coated glass slide and then removed to obtain a thin liquid PDMS coating. Following this, the stamp was pressed onto paper and heated at 90 °C for 15 min. Teflon stamp was peeled off, making a paper chip with superhydrophobic patterns. (B) The configuration of the paper-based chip. The zones and channels are hydrophilic, while the rest regions are superhydrophobic. (C) Diagram of lead (II) detection on the chip. The water samples were added to the reaction zone. After three minutes, the chip was turned by 90°, which enabled the droplet to travel to the detection zone and react with the iridium (III) complex. Figure reprinted with permission from Elsevier.

Figure 4.
Images of a microfluidic chip for the continuous monitoring of Hg (II) [135]. (a) Microfluidic chip with optical fiber for coupling with photomultiplier detector. (b) Detailed view of the chip with integrated micromixer and 2cm optical channel. Figure reproduced with permission from Elsevier.

Figure 5.
(a,b) Photographic images of the microfluidic device without and with the screen printed electrodes (SPE); (c) photograph of SPE; (d) the computational domain of microfluidic chip combined with work electrode; (e) the velocity outline of microfluidic cell. Figure adapted from Hong et al. [147]. Copyright (2016) American Chemical Society.

Figure 6.
Diagram of the microfluidic detection device developed on paper (blue) and graphite foil (black) by Shen et al. [157]. Figure reproduced with permission from American Chemistry Society.
Figure 6.
Diagram of the microfluidic detection device developed on paper (blue) and graphite foil (black) by Shen et al. [157]. Figure reproduced with permission from American Chemistry Society.


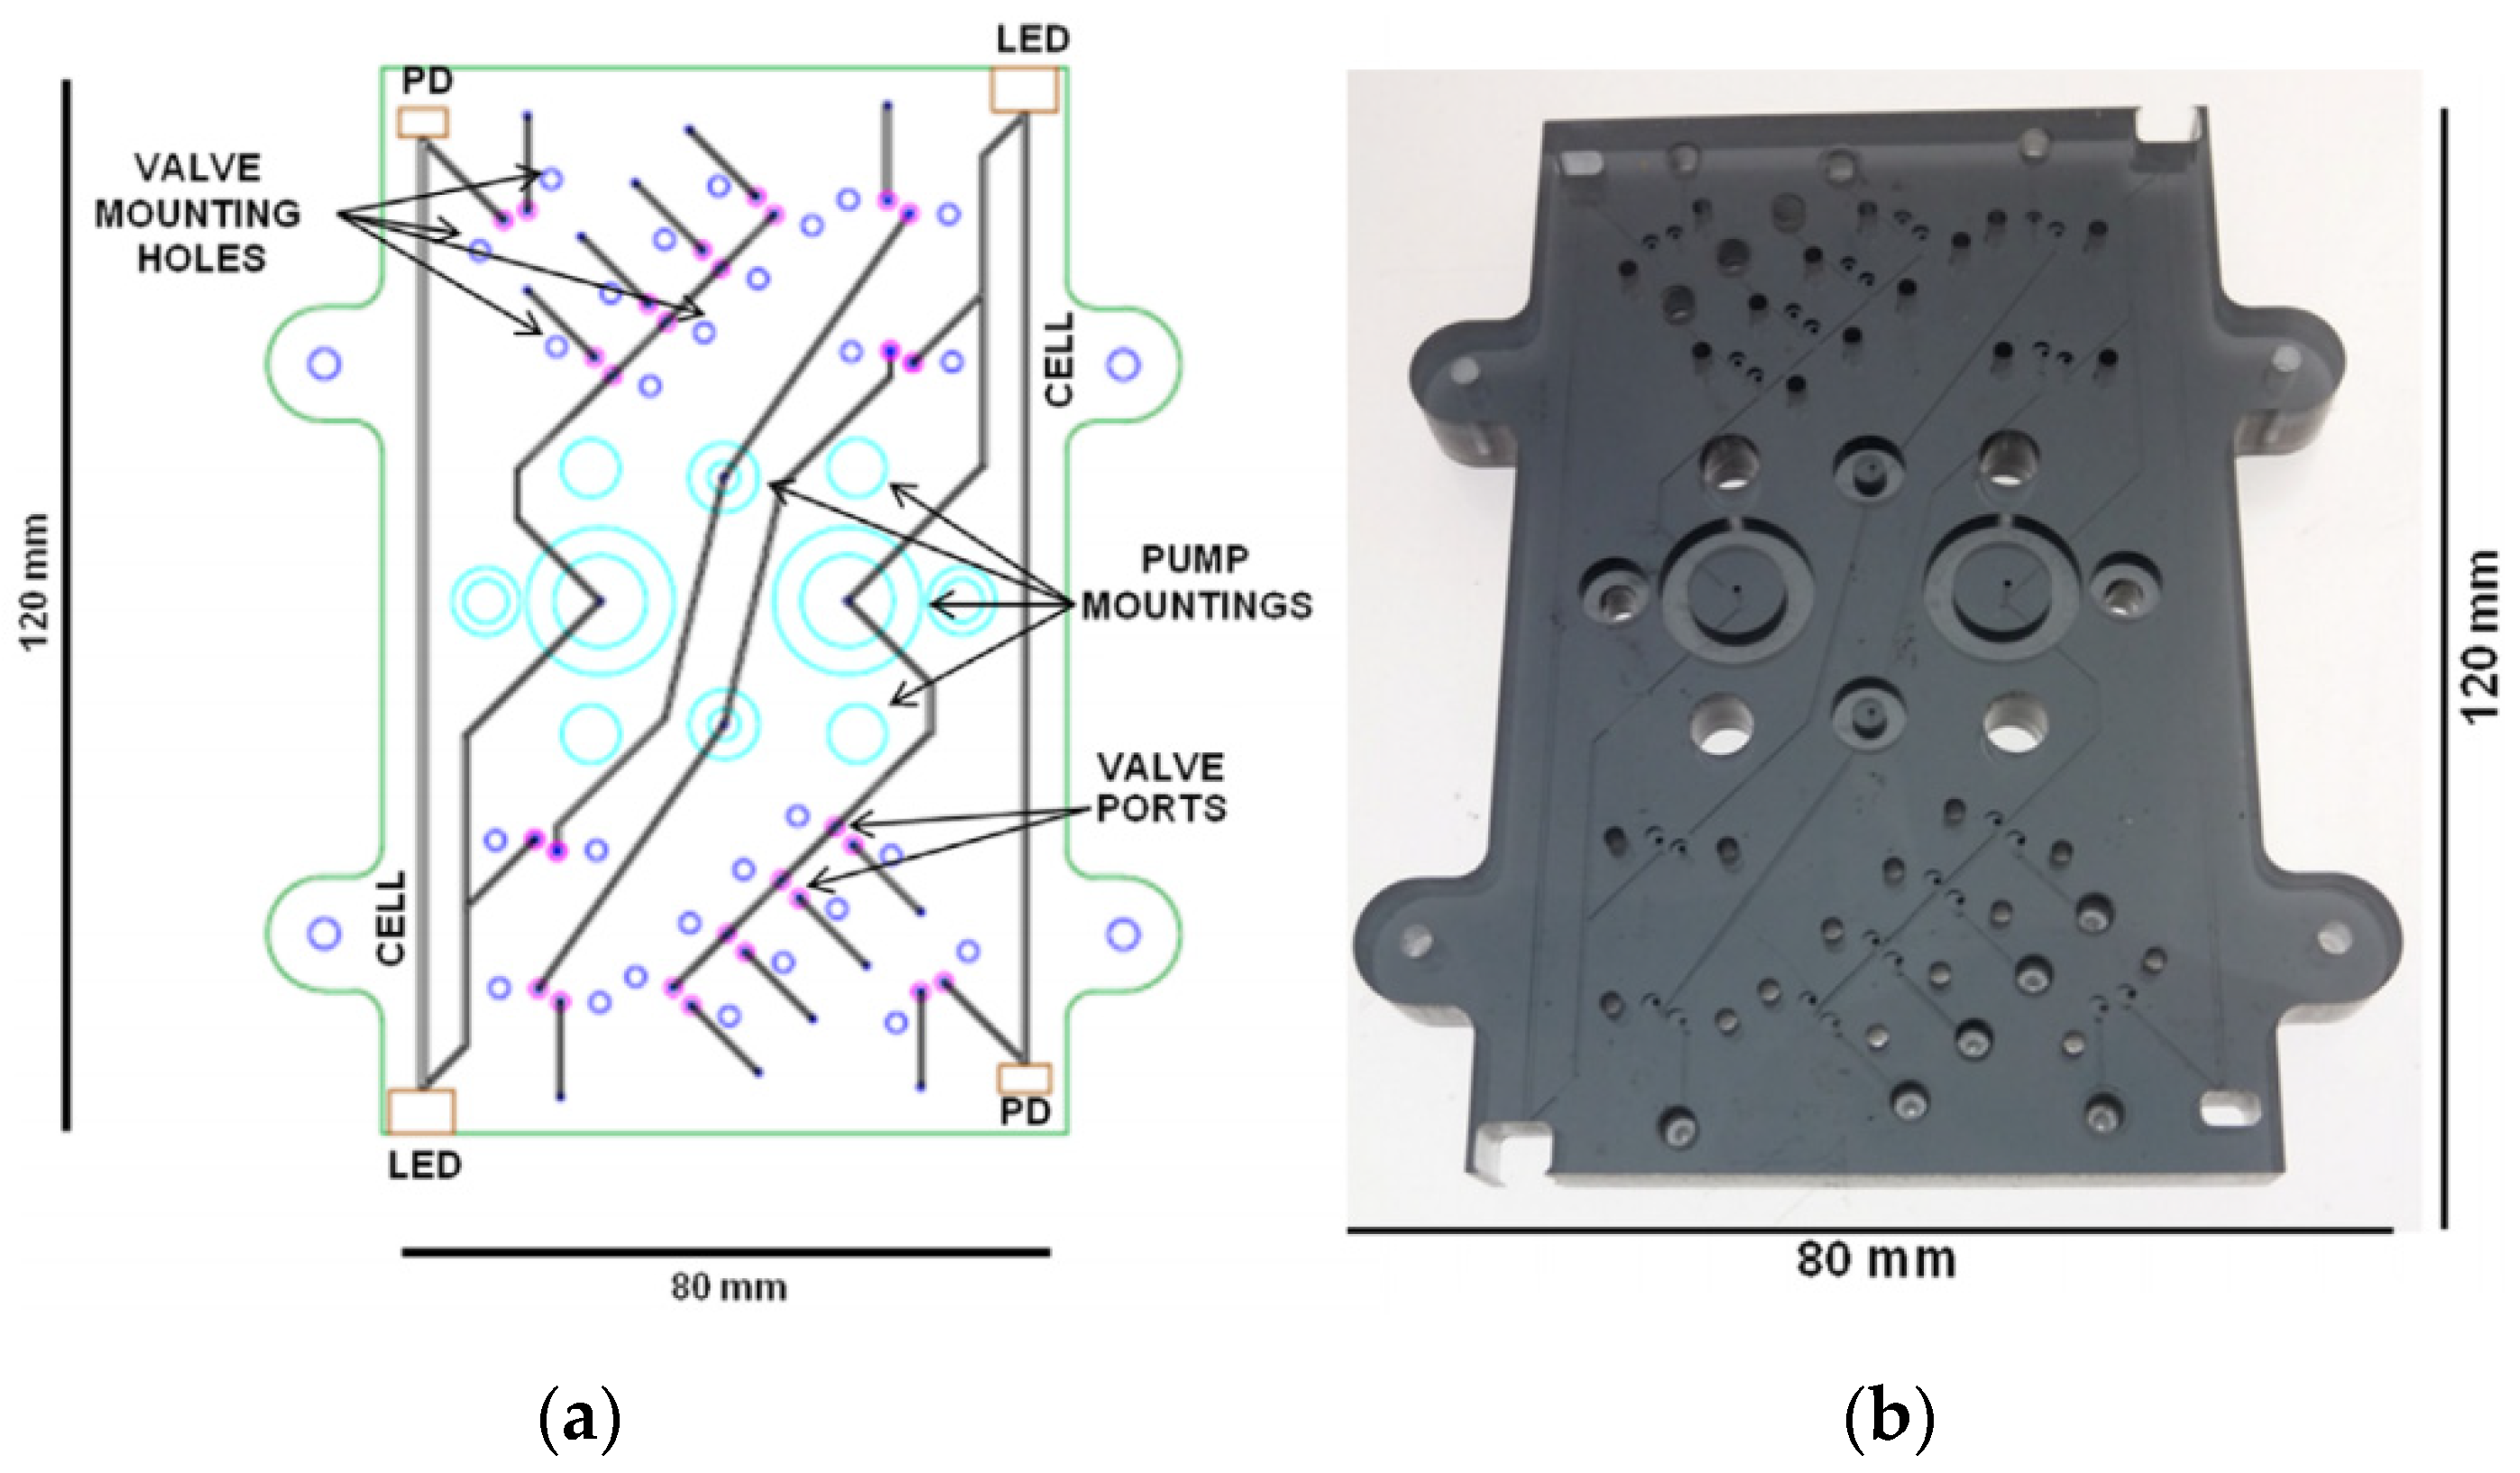
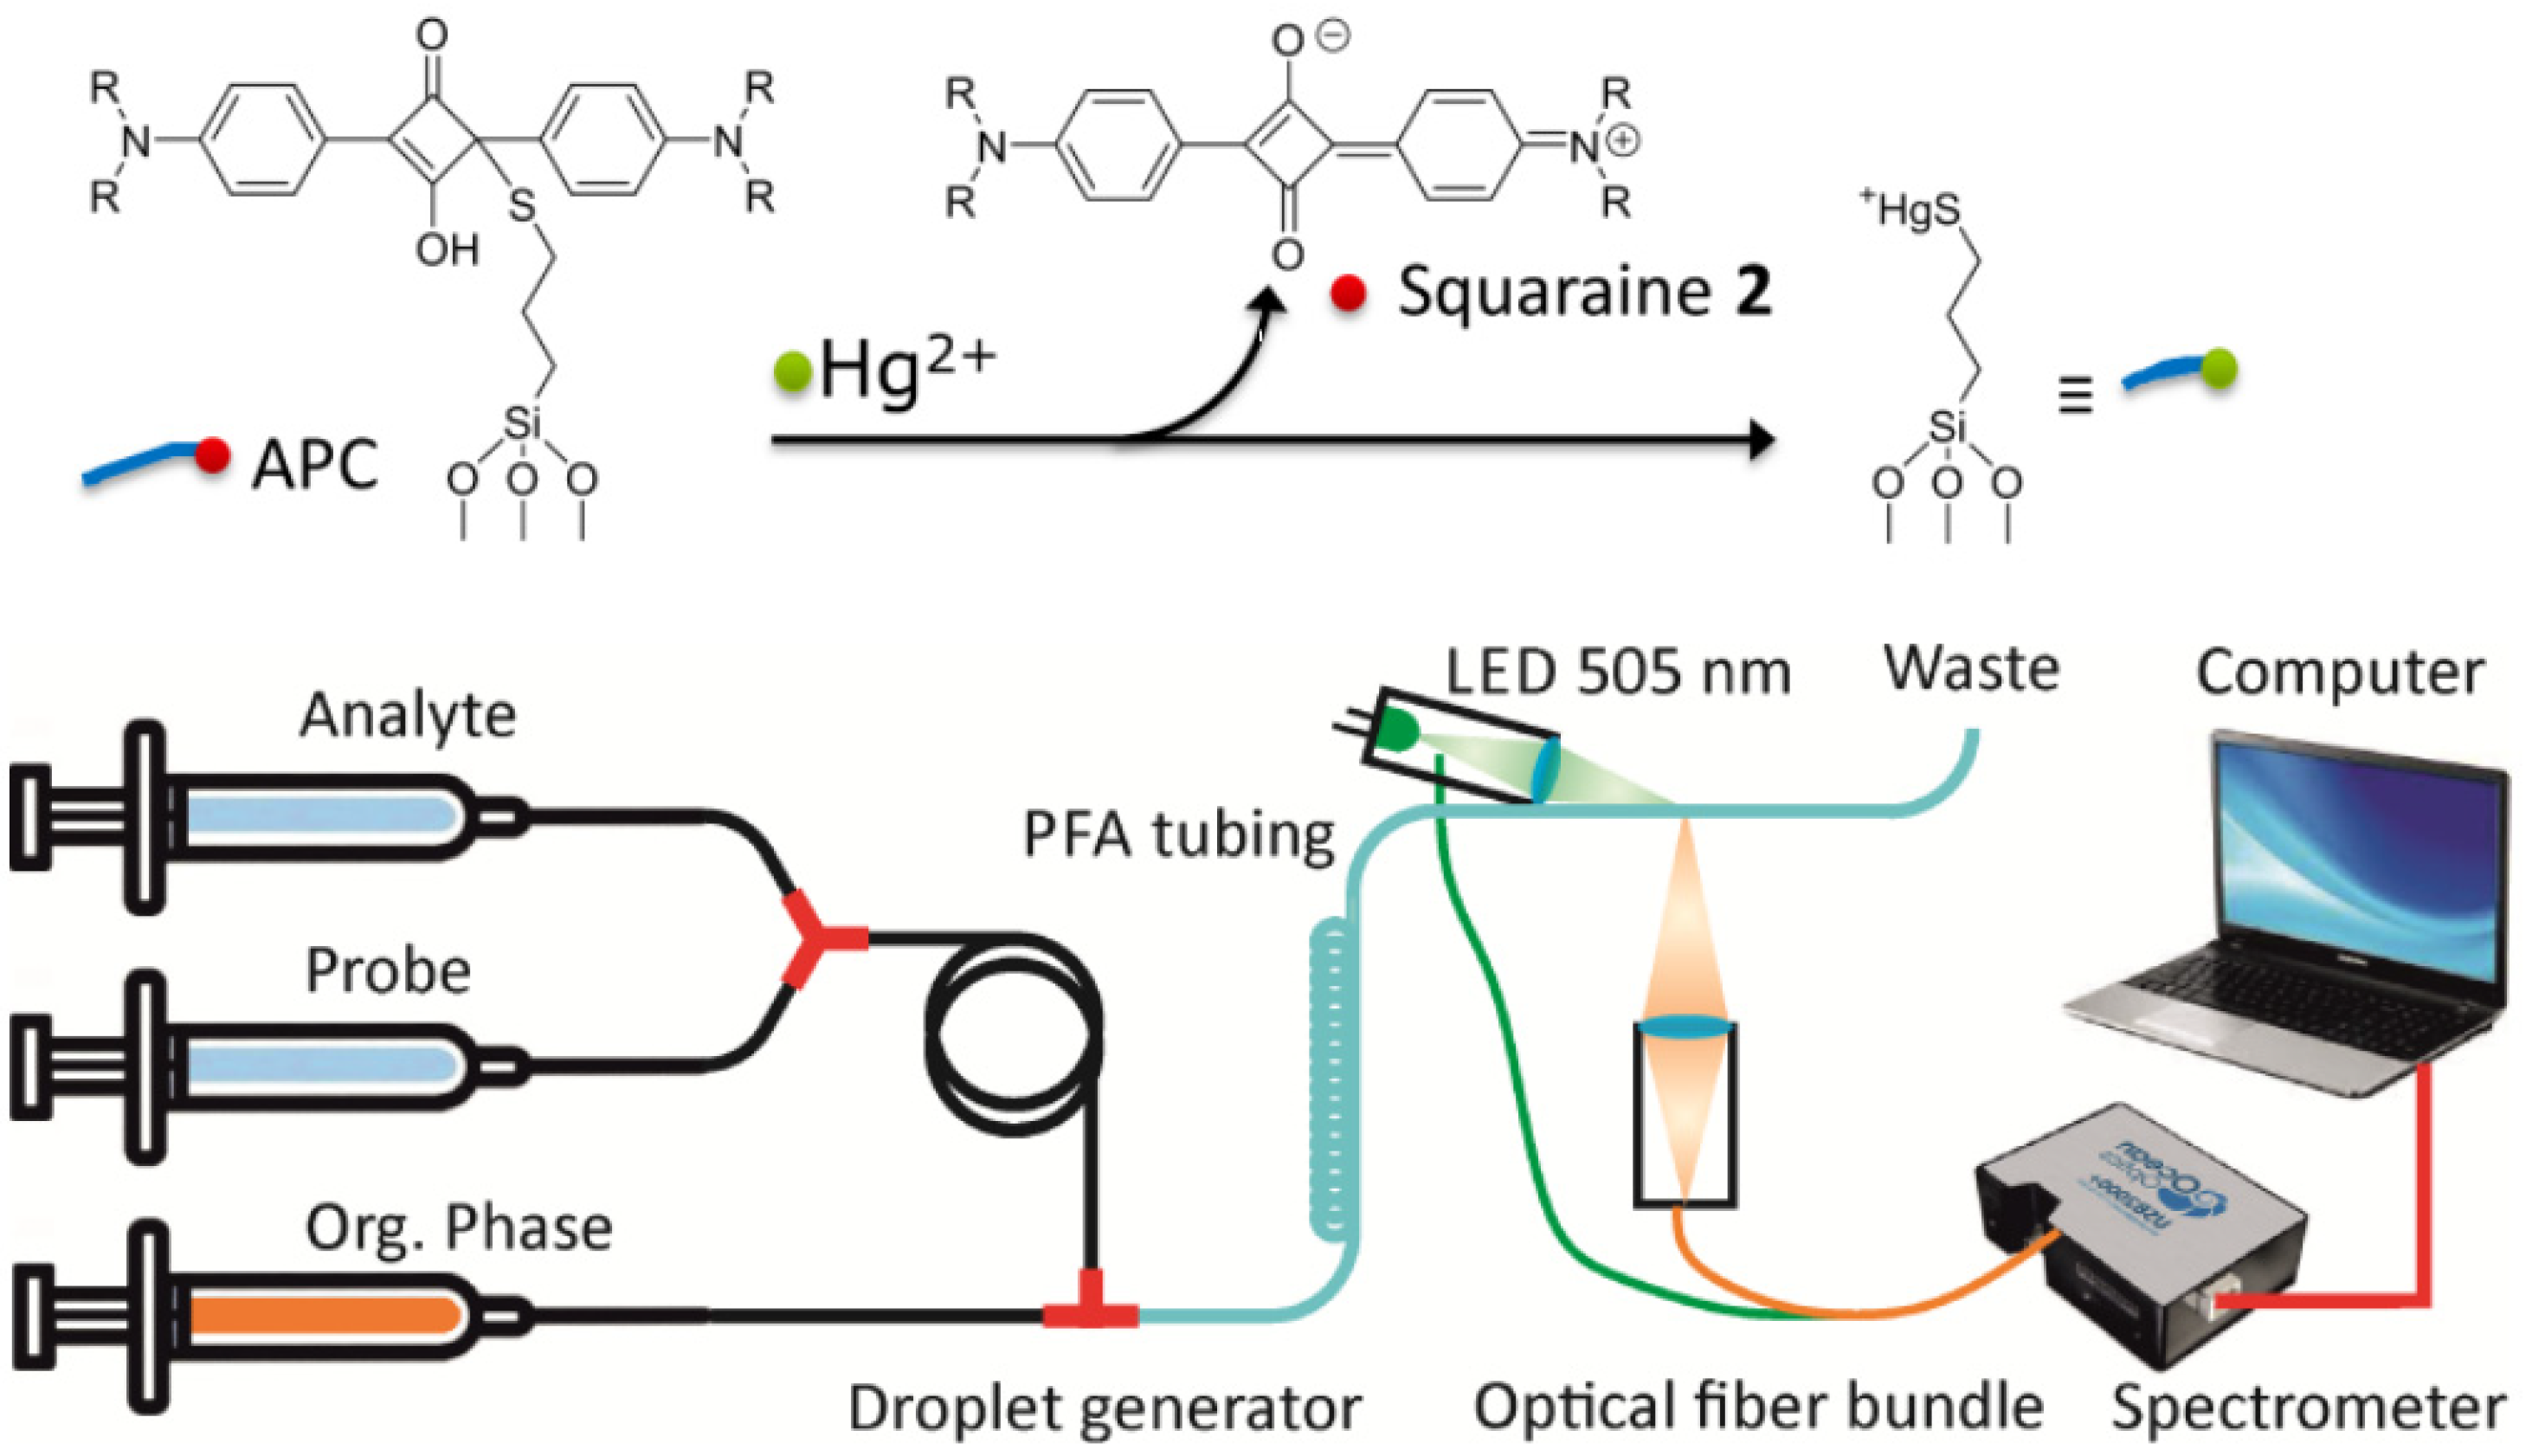
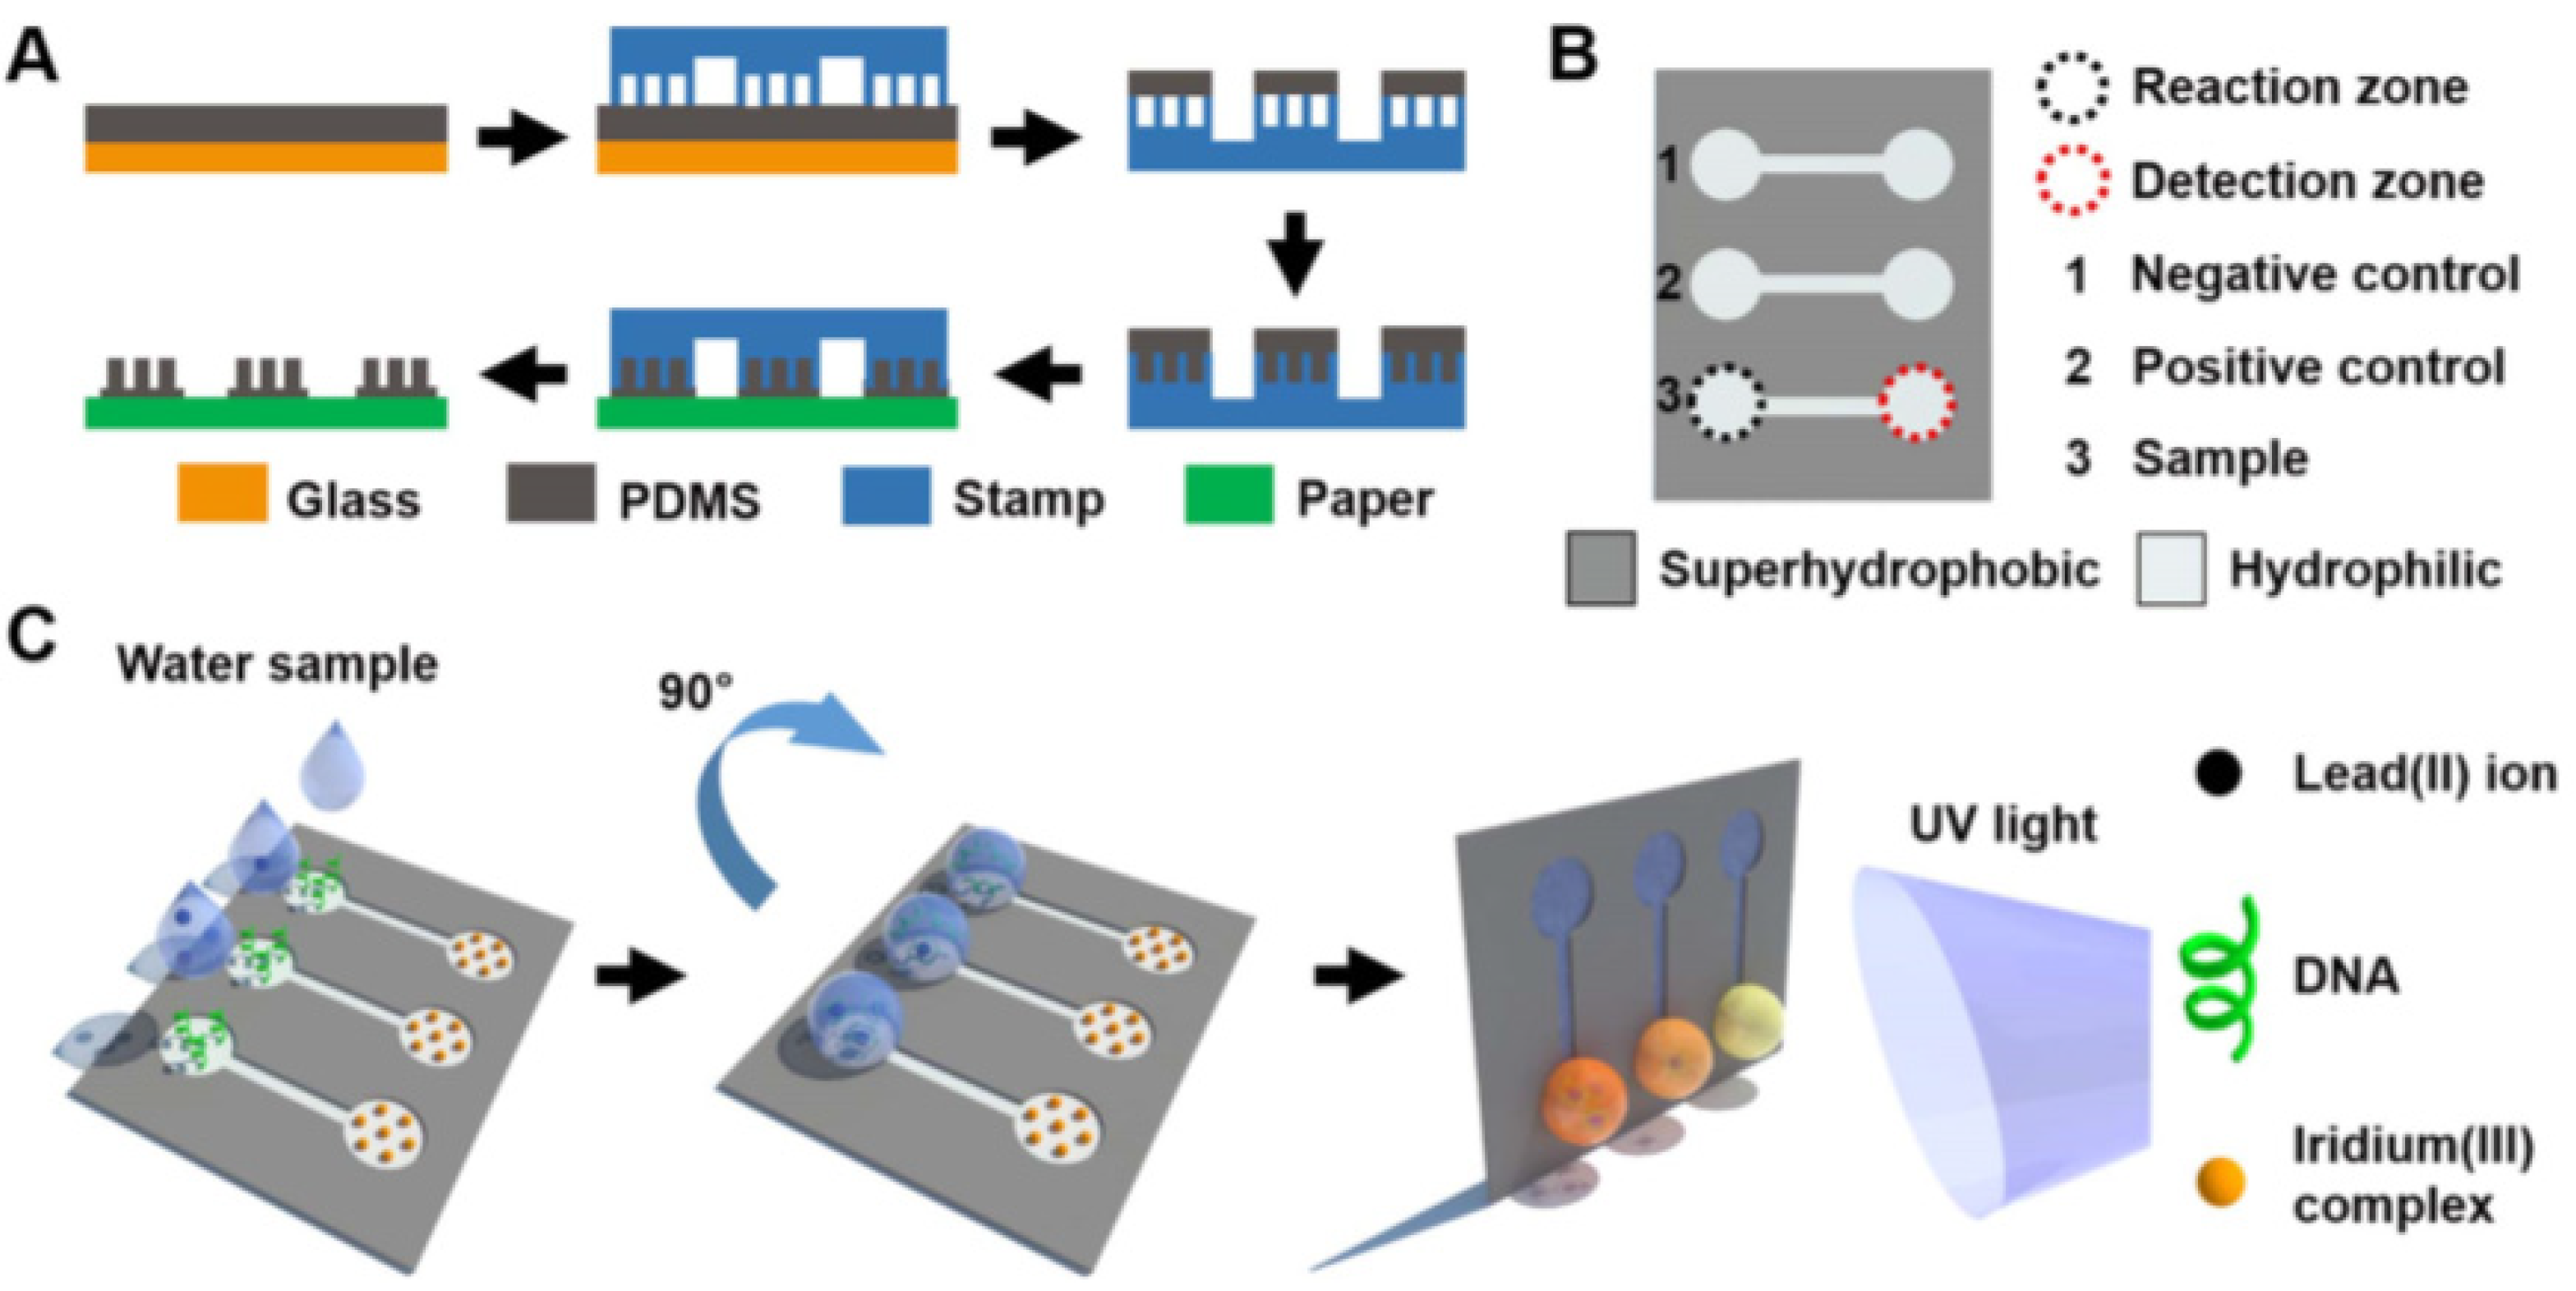
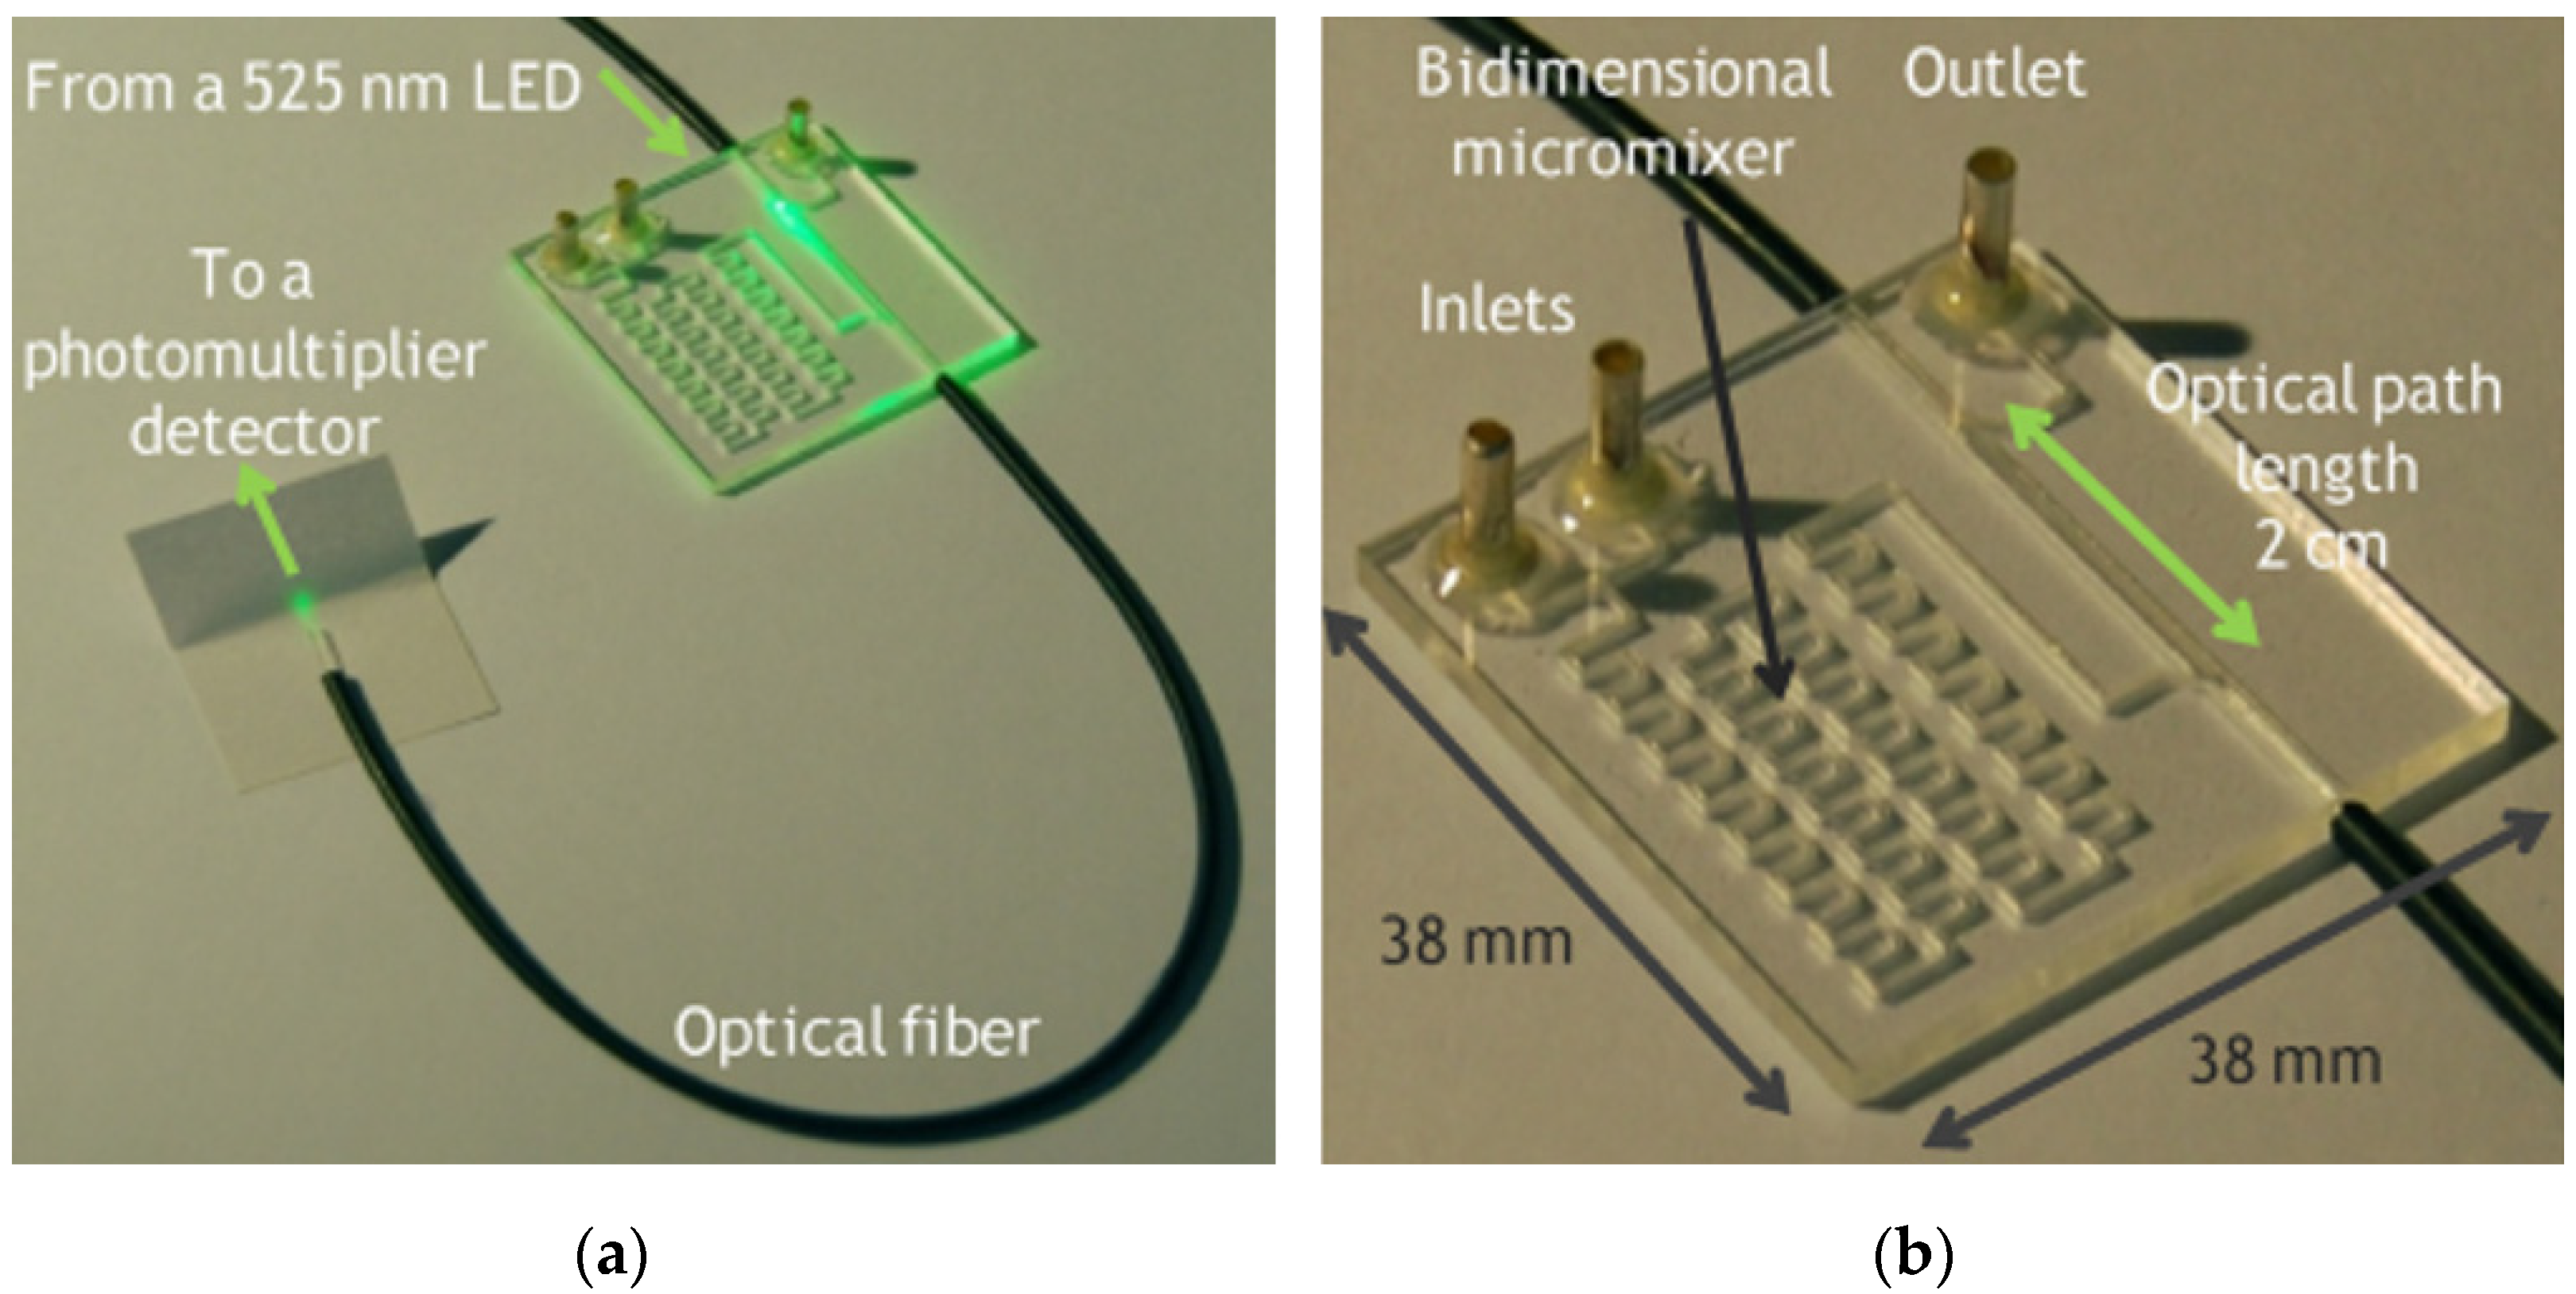
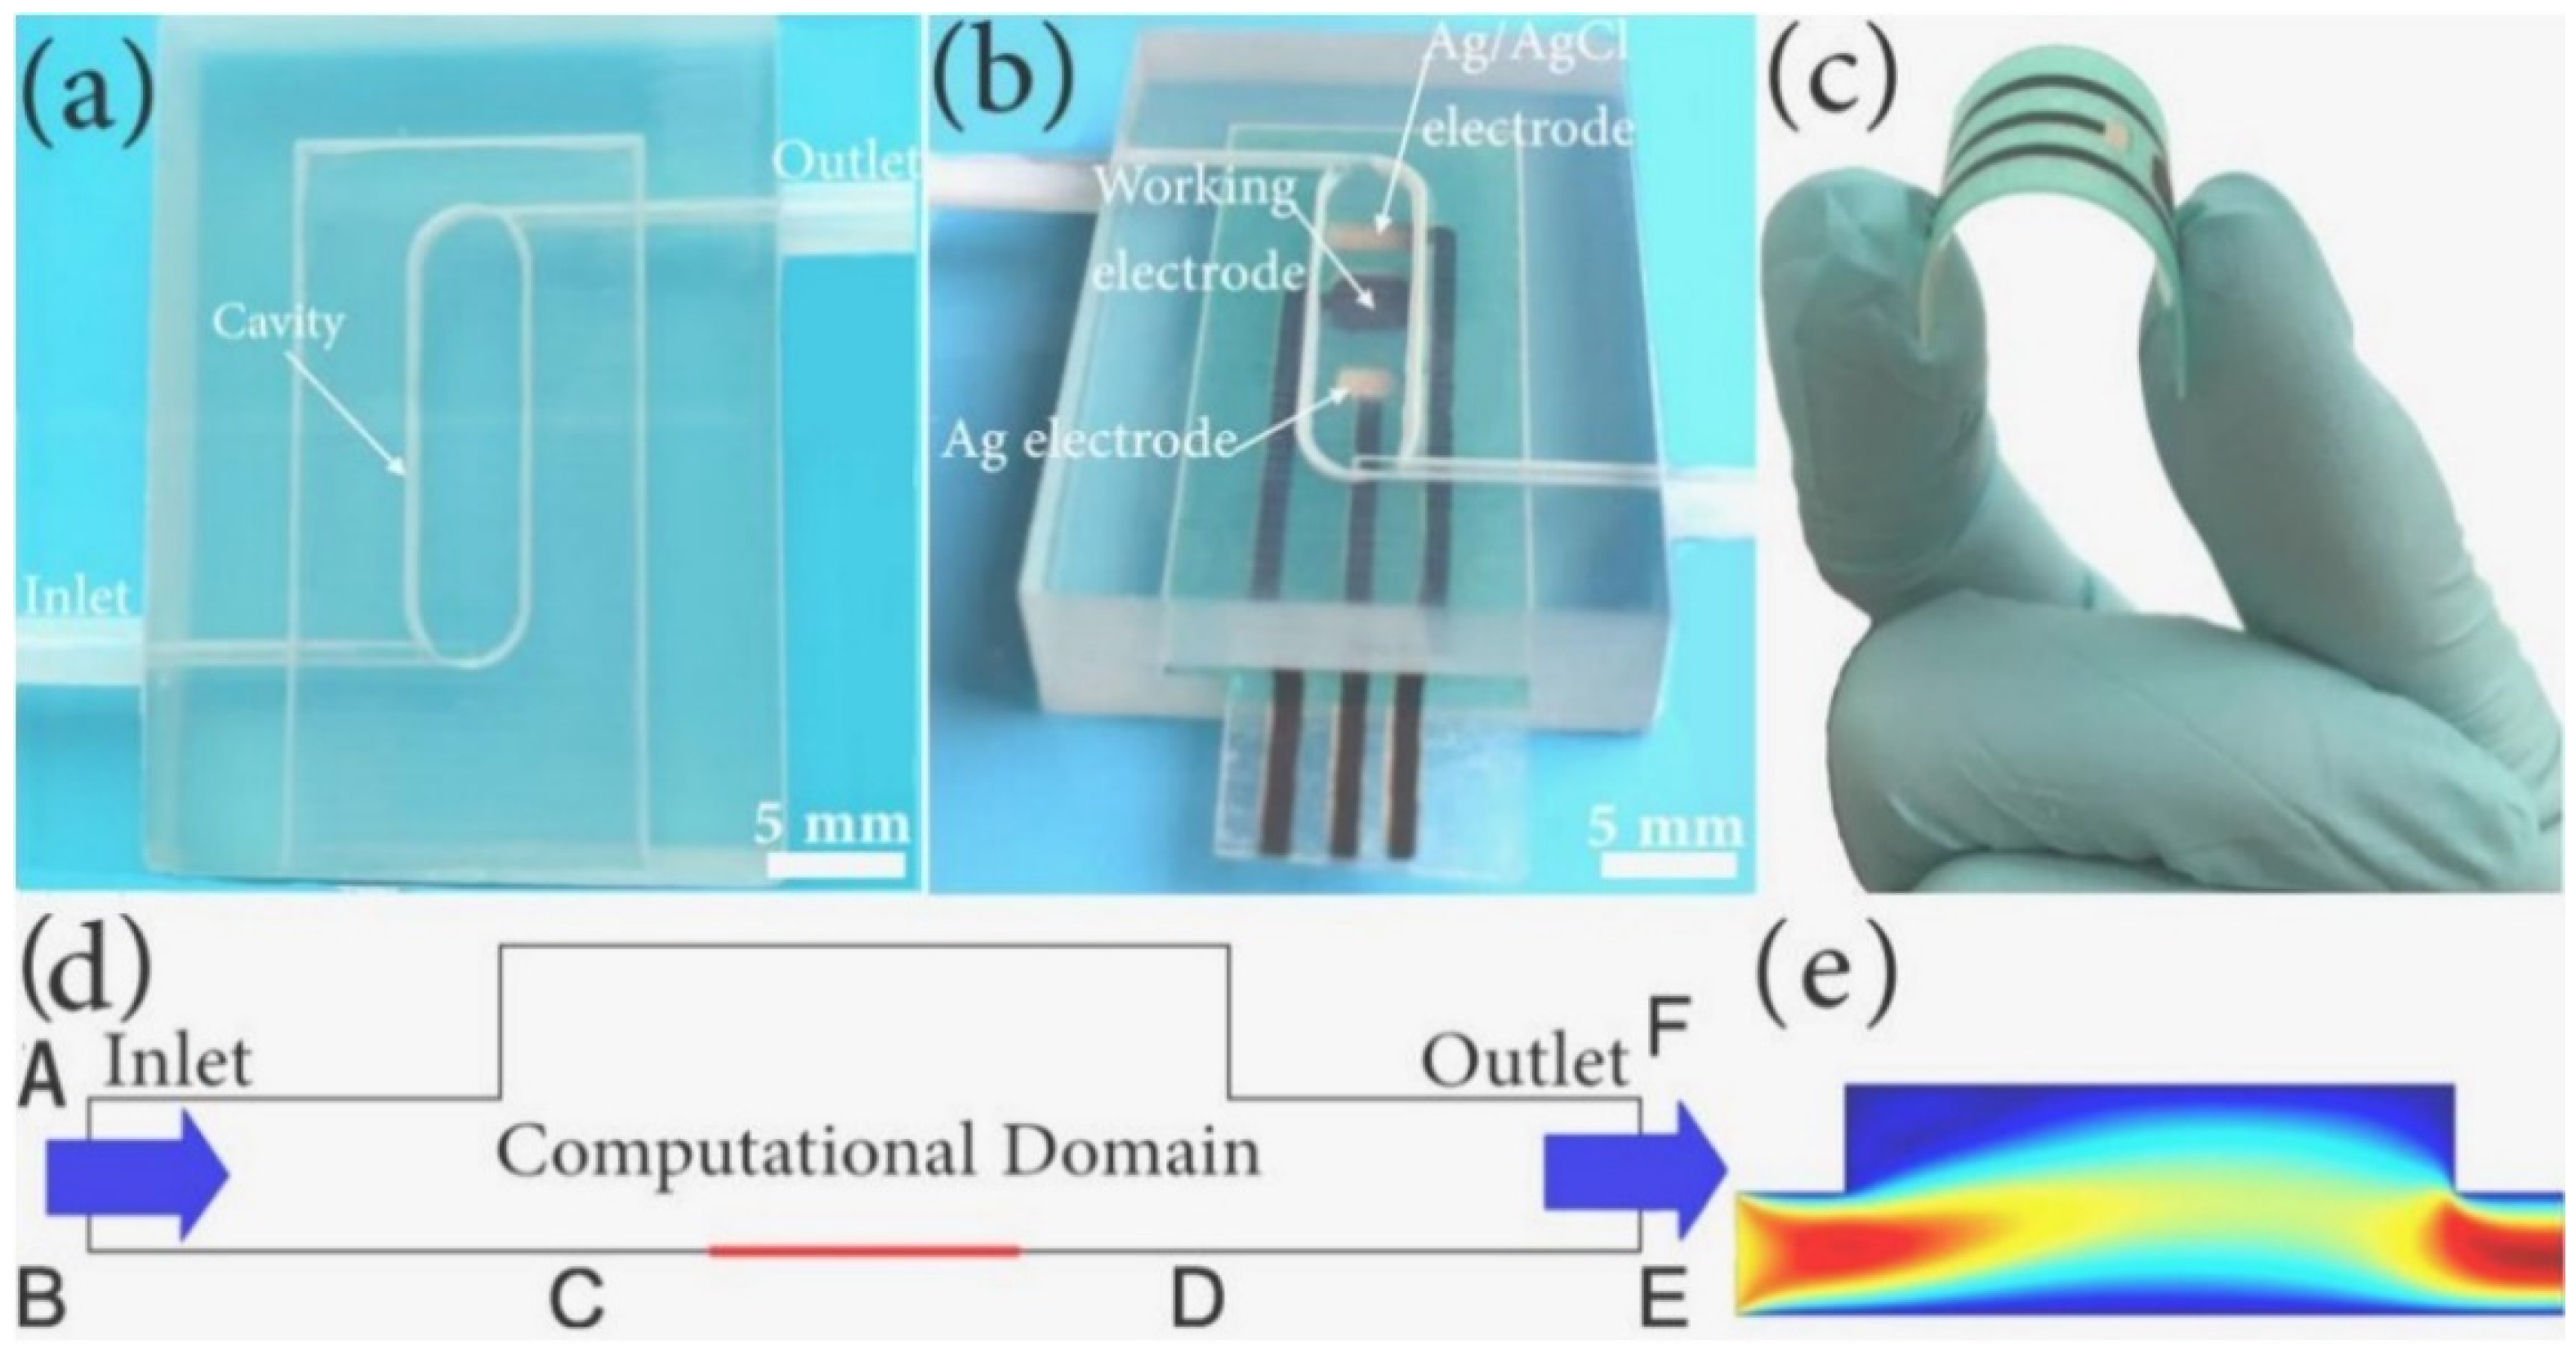
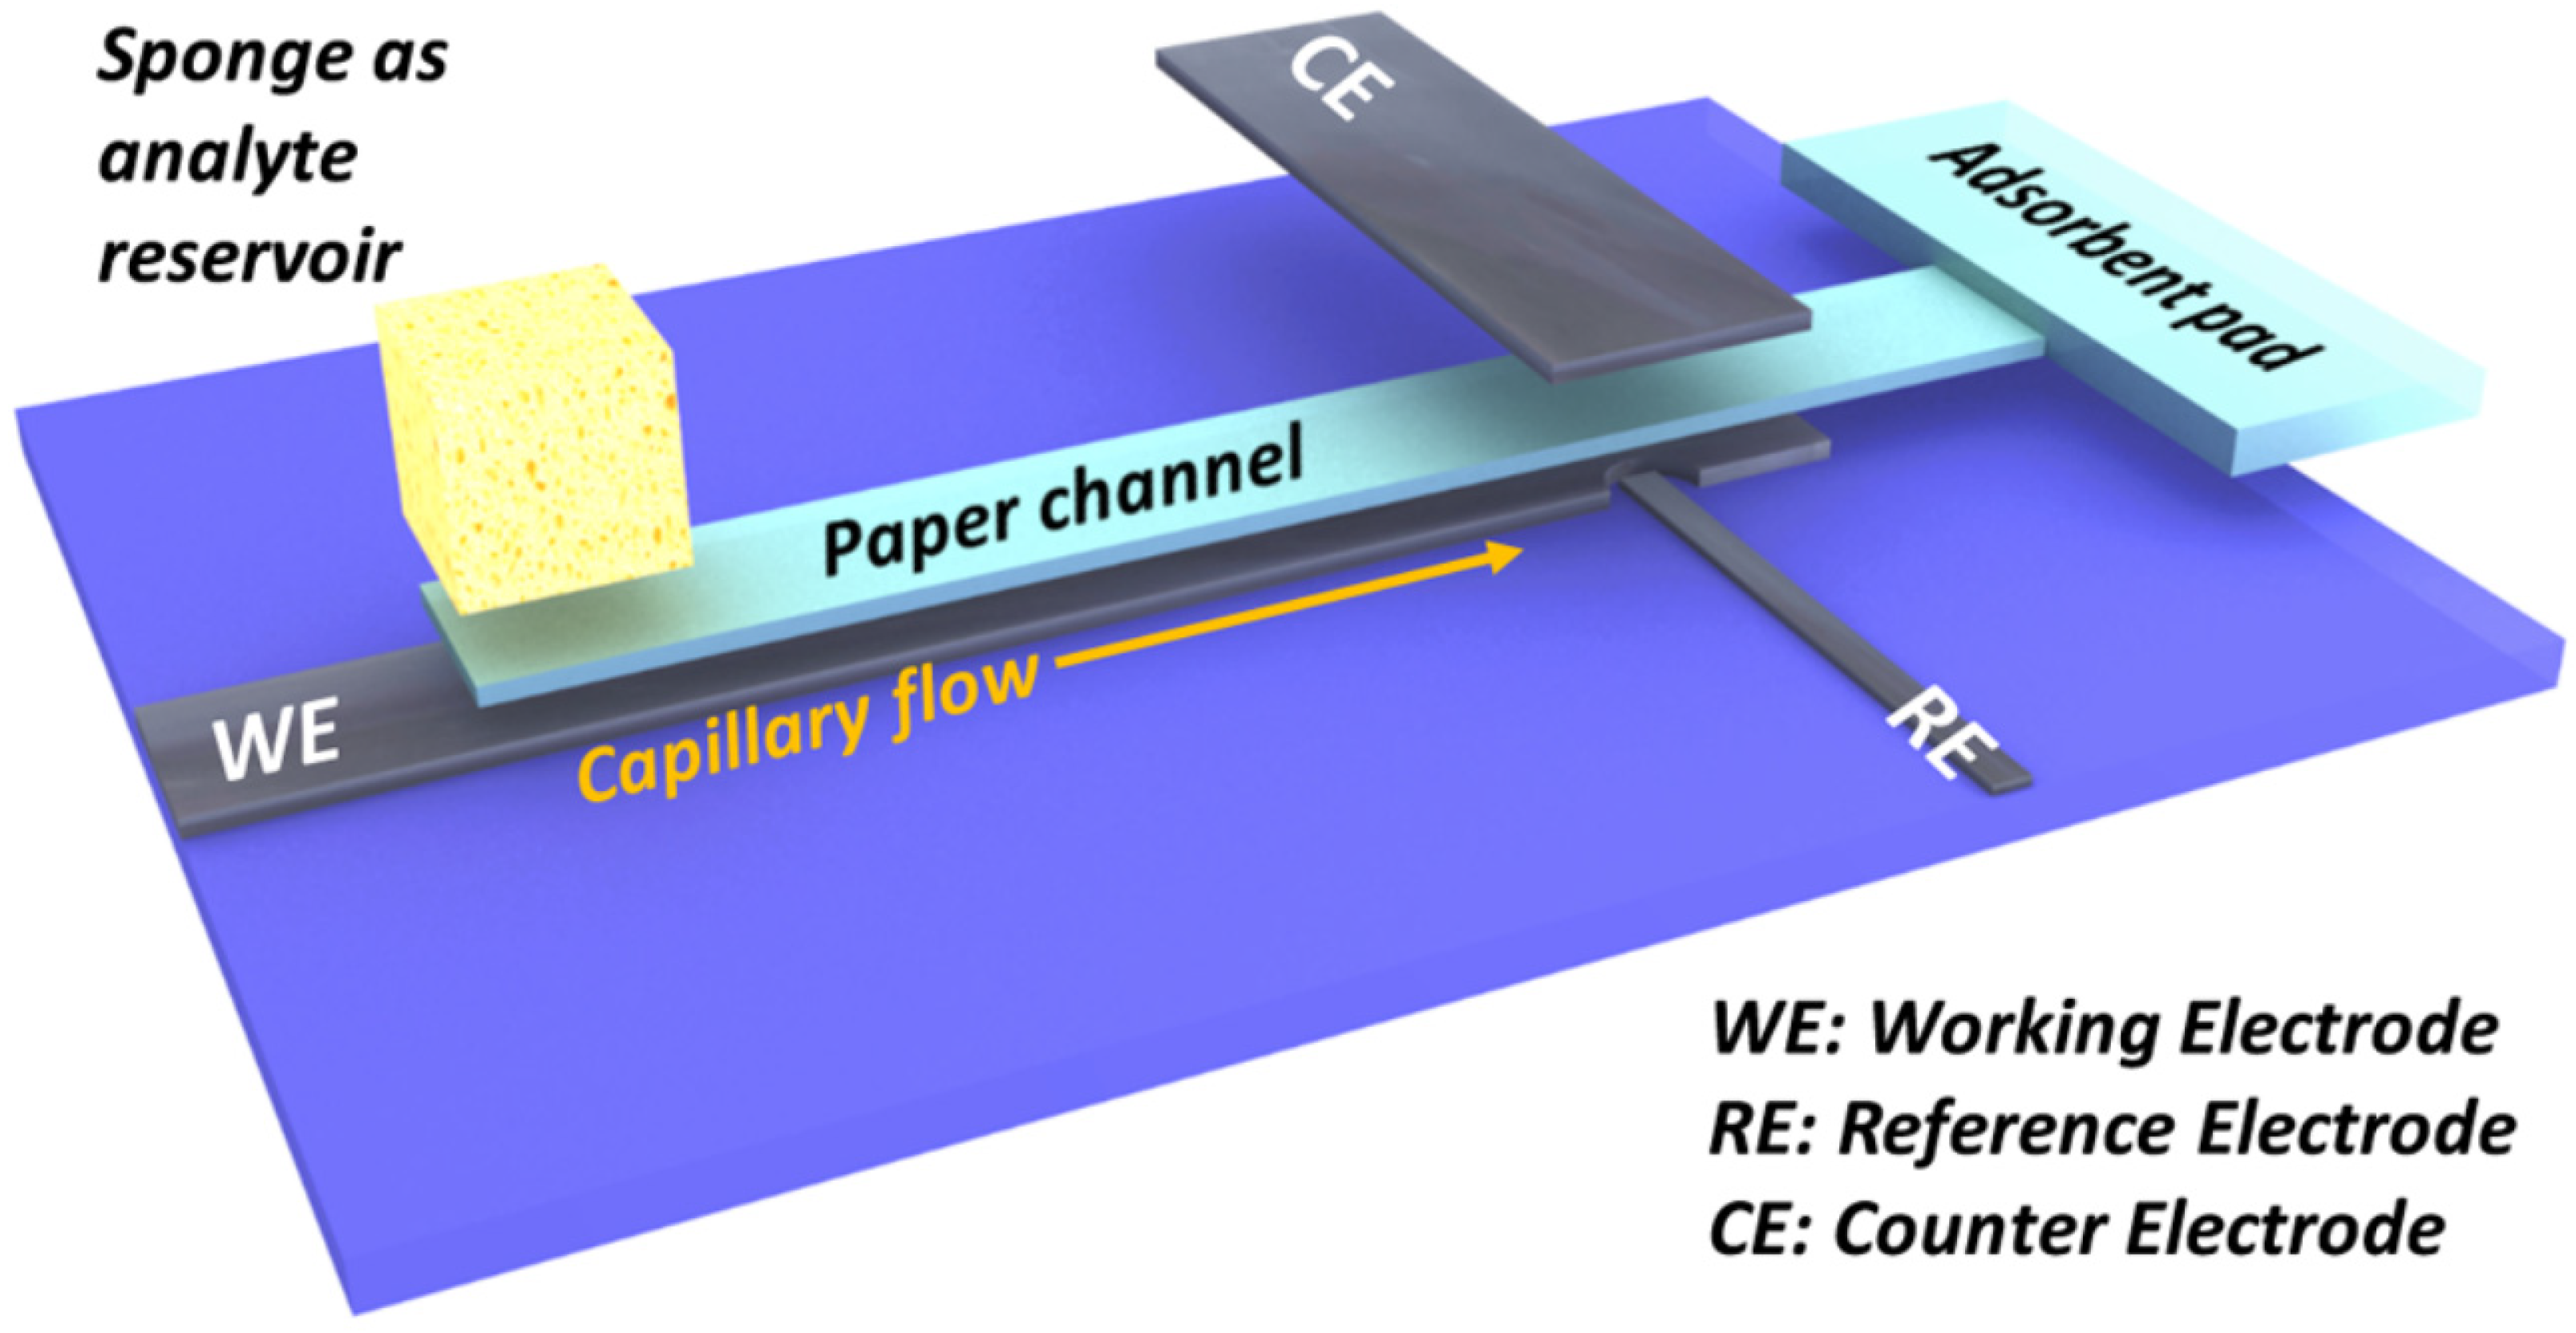
| Americas | Argentina, Bolivia, Canada, Chile, Dominica, El Salvador, Honduras, Mexico, Nicaragua, Peru, United States of America, |
| Africa | Ghana, South Africa, Zimbabwe |
| Asia | Bangladesh, China, Cambodia, India, Iran, Japan, Myanmar, Pakistan, Philippines, Nepal, Sri Lanka, Taiwan, Thailand, Vietnam |
| Europe | Austria, Bulgaria, Croatia, France, Finland, Germany, Greece, Hungary, Italy, Poland, Romania, Russia, Serbia, United Kingdom, |
| Oceania | Australia, New Zealand |
Table 2.
Drinking water quality guidelines (μg L−1) for heavy metals.
| Heavy Metal | Symbol | WHO | EU | US EPA | Oxidation States | Health Effects |
|---|---|---|---|---|---|---|
| Arsenic | As | 10 | 10 | 10 | III, V | Skin damage, renal system failure, cancer [5,6]. |
| Cadmium | Cd | 3 | 5 | 5 | II | Cardiovascular issues, osteoporosis, cancer [7]. |
| Chromium | Cr | 50 | 50 | 100 | III, VI | Teeth abnormalities, diarrhoea, kidney failure [8,15]. |
| Copper | Cu | 2000 | 2000 | 1300 | I, II | Liver damage, gastrointestinal problems [16,17]. |
| Cobalt | Co | - | - | 100 | II, III | Cardiovascular and pulmonary system issues [18]. |
| Iron | Fe | - | 200 | 300 | II, III | Haemochromatosis, gastrointestinal issues [9,19]. |
| Lead | Pb | 10 | 10 | 15 | II | Nervous system impairment, brain damage, cancer [20,21]. |
| Manganese | Mn | 100 | 50 | 50 | II, IV | Neurological defects [10]. |
| Mercury | Hg | 1 | 1 | 2 | I, II | Renal failure, neurological disorders, cancer [11,12]. |
| Nickel | Ni | 70 | 20 | - | II | Dermatitis, kidney failure, cardiovascular disease [13,14]. |
Table 3.
Summary of various microfluidic detection methods for heavy metals.
| Detection Principle | Mechanism | Target Analyte | LOD | Linear Range | References |
|---|---|---|---|---|---|
| Absorbance | Cell diffusing mixing technology with PAN and ferrozine | Fe (II) Mn (II) | Mn 28 nM, Fe 27 nM | Fe 27–200 nM, Mn 0.028–6 μM | [71] |
| Absorbance | Flow injection analysis using phenantroline | Fe (II) | 1.0 µM | 1.0–100 µM | [72] |
| Absorbance | Chromoionophre PVC film | Hg (II) | 0.5 µM | 1.0× 10⁻⁶–2.5 × 10⁻⁴ M | [73] |
| Absorbance | µPADs using sodium rhodizonate | Pb (II) | 10 μg L−1 | 10–100 μg L−1 | [75] |
| Absorbance | Iron oxide nanoparticles and µPADs | As (III) | 0.01 mg L−1 | 0.01–0.90 mg L−1 | [76] |
| Absorbance | Distance based detection using µPADs | Hg (II) | 0.93 mg L−1 | 1–30 mg L−1 | [77] |
| Absorbance | µPADs and gold nanoparticles | As (III) | - | 1–50 μg L−1 | [79] |
| Absorbance | Chemically patterned µPADs | Ni (II) Cr (VI) Hg (II) | Ni 0.24 mg L−1, Cr 0.18 mg L−1, Hg 0.19 mg L−1 | - | [80] |
| Absorbance | Droplet-based AuNP synthesis with dielectric barrier discharge plasma | Hg (II) | 0.2 mg L−1 | - | [82] |
| Absorbance | Leucomalachite green dye | As (III) | 0.19 mg L−1 | 0.07–3 mg L−1 | [65] |
| Surface plasmon resonance | Gold nanoparticles | Hg (II), As (III) | - | Hg 0.71–1.28 mg L−1, As 0.01–0.054 mg L−1 | [133] |
| Surface plasmon resonance | Gold nanoparticles | Hg (II) | 11 µg L−1 | 11–100 µg L−1 | [135] |
| Surface plasmon resonance | Curcumin nanoparticles | Hg (II) | 0.003 mg L−1 | 0.01–0.4 mg L−1 | [139] |
| Surface plasmon resonance | µPADs with silver nanoparticles | Hg (II) | 12 mg L−1 | 12–75 mg L−1 | [136] |
| Surface plasmon resonance | Molecularly imprinted nanoparticles | Cu (II) Pb (II) | Cu 8.18 × 10⁻⁴, Pb 4.06 × 10⁻⁶ | 4.06–1000 µg L−1 | [142] |
| Fluorescence | Droplet based sensor using nanoparticles | Hg (II) | 0.02 μg L−1 | 0.02–200 μg L−1 | [94] |
| Fluorescence | BODIPY and nanoparticles | Cd (II) | 5.62 mg L−1 | 5.62–112.41 mg L−1 | [95] |
| Fluorescence | Calix-DANS3-OH | Pb (II) | 42 μg L−1 | - | [97] |
| Fluorescence | Calix-DANS3-OH | Pb (II) | 5 μg L−1 | - | [98] |
| Fluorescence | Precolumn adsorption and fluorometric detection using Calix- DANS4 | Pb (II) | 2 μg L−1 | 2.07–16.5 μg L−1 | [99] |
| Fluorescence | Rhodamine 6G silica particle embedded onto mesoporous silica | Fe (III) | - | 2–8 μg L−1 | [104] |
| Fluorescence | Flow injection detection | Cd (II) | 0.45 μg L−1 | 1.12–22.40 μg L−1 | [105] |
| Fluorescence | On line fluorescent derivatisation | Hg (II) | 0.006 mg L−1 | 6.21–14.041 mg L−1 | [106] |
| Fluorescence | Gold nanoparticles | Hg (II) | 0.6 μg L−1 | 0.6–60 μg L−1 | [108] |
| Fluorescence | Digital microfluidics (DMF) | Hg (II) | 0.7 μg L−1 | 0.7–10 μg L−1 | [110] |
| Chemiluminescence | 1,10 phenanthroline based | Cu (II) Co (II) Fe (II) | Cu 0.47 mg L−1, Co 35.35 mg L−1, Fe 55.84 mg L−1 | Cu 0.47–6.73 mg L−1 | [117] |
| Chemiluminescence | G-quadruplex based luminescence | Pb (II) | - | 2–200 μg L−1 | [118] |
| Chemiluminescence | Luminol with heteropoly acid complex | As (V) | 6.6 μg L−1 | 0.075–3.74 mg L−1 | [119] |
| Chemiluminescence | Luminol oxidation reaction | Cr (III) Cr (VI) | 0.312 × 10⁻⁴ ng L−1 | 0.052 × 10⁻³– 0.052 × 10⁻¹ ng L−1 | [121] |
| Chemiluminescence | Microchip with air sampling | Fe (II) | 0.017 mg L−1 | 0.06–2.79 mg L−1 | [122] |
| Chemiluminescence | µPADs | Cr (III) | 0.2 mg L−1 | 0.05–1 mg L−1 | [125] |
| Chemiluminescence | Lab on a cloth | Cr (III) | 0.006 mg L−1 | 0.01–100 mg L−1 | [128] |
| Chemiluminescence | Luminol oxidation reaction | Co (II) | 2 ng L−1 | 5.89–5.89 × 10⁷ ng L−1 | [123] |
| Electrochemical | Microporous SPE modified with Mn2O3 | Cd (II) Pb (II) | Cd 0.5 μg L−1, Pb 0.2 μg L−1 | Cd 0.5 to 8 μg L−1, Pb 10–100 μg L−1 | [147] |
| Electrochemical | Microelectrodialyser combined with boron doped diamond electrode | Pb (II) | 4 μg L−1 | 20–100 μg L−1 | [151] |
| Electrochemical | SPE coupled with PANi-SDS | Hg (II) | 0.481 μg L−1 | 1.203–7.021 μg L−1 | [153] |
| Electrochemical | SPCE combined with paper strips | Cd (II) Pb (II) | Pb 2 μg L−1, Cd 2.3 μg L−1 | 2–100 μg L−1 | [156] |
| Electrochemical | µPADs with carbon based sensor | Cd (II) Pb (II) | Cd 1.2 μg L−1, Pb 1.8 μg L−1 | 20–100 μg L−1 | [157] |
| Electrochemical | µPADs with boron doped diamond paste electrodes (BDDPEs) | Cd (II) Pb (II) | Pb 1 μg L−1, Cd 25 μg L−1 | Cd 25–200 μg L−1, Pb 1–200 μg L−1 | [161] |
| Electrochemical | SPE based on bismuth electrode detection | Cd (II) Pb (II) | Cd 9.3 μg L−1, Pb 8 μg L−1 | 25–400 μg L−1 | [160] |
| Electrochemical | µPADs with gold nanoparticles | As (III) As (V) | 0.02 mg L−1 | 0.1–1.5 mg L−1 | [164] |
| Quartz crystal microbalance | Phosphate modified dendrimers | Cu (II) | - | 0.006–6.355 μg L−1 | [172] |
| Quartz crystal microbalance | Aptasensor with gold nanoparticles | Hg (II) | 0.048 mg L−1 | - | [177] |
| Quartz crystal microbalance | DNAzymes and gold nanoparticles | Pb (II) | 0.013 mg L−1 | 0.013–0.062 mg L−1 | [180] |
| Quartz crystal microbalance | Phosphate modified dendrimers | Cu (II) | 0.006 μg L−1 | 0.006–60 μg L−1 | [173] |
| Quartz crystal microbalance | Magnesium porphyrazine | Cd (II) | 10 mg L−1 | - | [181] |
Publisher’s Note: MDPI stays neutral with regard to jurisdictional claims in published maps and institutional affiliations. |
© 2021 by the authors. Licensee MDPI, Basel, Switzerland. This article is an open access article distributed under the terms and conditions of the Creative Commons Attribution (CC BY) license (http://creativecommons.org/licenses/by/4.0/).
Share and Cite
MDPI and ACS Style
Lace, A.; Cleary, J. A Review of Microfluidic Detection Strategies for Heavy Metals in Water. Chemosensors 2021, 9, 60. https://0-doi-org.brum.beds.ac.uk/10.3390/chemosensors9040060
AMA Style
Lace A, Cleary J. A Review of Microfluidic Detection Strategies for Heavy Metals in Water. Chemosensors. 2021; 9(4):60. https://0-doi-org.brum.beds.ac.uk/10.3390/chemosensors9040060
Chicago/Turabian StyleLace, Annija, and John Cleary. 2021. "A Review of Microfluidic Detection Strategies for Heavy Metals in Water" Chemosensors 9, no. 4: 60. https://0-doi-org.brum.beds.ac.uk/10.3390/chemosensors9040060
Note that from the first issue of 2016, this journal uses article numbers instead of page numbers. See further details here.