
A Sensitive and Portable Deep-UV Absorbance Detector with a Microliter Gas Cell Compatible with Micro GC


1
School of Engineering, University of Limerick, V94 T9PX Limerick, Ireland
2
Bernal Institute, University of Limerick, V94 T9PX Limerick, Ireland
3
ICPEES (UMR 7515), CNRS and Université de Strasbourg, F-67000 Strasbourg, France
4
In’Air Solutions, 67000 Strasbourg, France
5
Health Research Institute, University of Limerick, V94 T9PX Limerick, Ireland
*
Author to whom correspondence should be addressed.
Chemosensors 2021, 9(4), 63; https://0-doi-org.brum.beds.ac.uk/10.3390/chemosensors9040063
Submission received: 21 February 2021
/
Revised: 22 March 2021
/
Accepted: 24 March 2021
/
Published: 27 March 2021
(This article belongs to the Special Issue Advances in Analytical Systems for Gaseous Mixture)
Abstract
:Deep-UV absorption spectrometry for detection of toxic airborne gases, for instance, Benzene, Toluene, Ethylbenzene, and Xylenes (BTEX) has drawn considerable attention owing to its high sensitivity and reliability. However, the development of a deep-UV absorbance detector having good sensitivity, portability, and a low-volume gas cell with applicability for a micro Gas Chromatography (μGC) is challenging. Herein we present a novel, self-referenced, and portable deep-UV absorbance detector with a microliter (275 μL) gas cell having minimal dead volume. It has excellent compatibility with μGC for detection of individual BTEX components in a mixed sample at a sub-ppm level. The design consists of the latest, portable, and cost-effective optical and electronic components, i.e., deep-UV LED, hollow-core waveguide, and photodiodes. The detector directly measures the absorbance values in volts using an integrated circuit with a log-ratio amplifier. The prototype was tested with direct injection of toluene-N2 (1.5 ppm to 50 ppm) and good linearity (R2 = 0.99) with a limit of detection of 196 ppb was obtained. The absorbance detector with μGC setup was tested with a BTEX mixture in N2 at different GC column temperatures. All the BTEX species were sequentially separated and detected with an individual peak for a concentration range of 2.5 ppm to 10 ppm.

1. Introduction
Indoor air quality has attracted significant attention for improving the comfort and health of indoor occupants. Poor indoor air quality is becoming a serious health concern as it can lead to health problems, impaired learning, and reduced productivity [1]. Indoor air mainly contains Volatile Organic Compounds (VOCs), airborne particles, microorganisms, household odours, and gases. VOCs constitute a considerable portion of indoor airborne pollutants [2,3,4]. Among these VOCs, Benzene, Toluene, Ethylbenzene, and Xylenes (BTEX) pose an alarming threat to human health. They are aromatic hydrocarbons and its common indoor emission sources are coal burning, cigarette smoking, combustion, use of cleaning products, laser printing, floor adhesives, paint, wood panelling, and evaporation of fuel from an adjoining garage [5,6,7]. The infiltration of outside air can also contribute to high BTEX levels, particularly near industrial sources or high road traffic. Long-term exposure to airborne BTEX causes fatigue, respiratory, kidney, nervous system, mental, and cardiovascular-related problems [8,9,10,11]. Among BTEX, benzene is carcinogenic, as classified by the International Agency for Research on Cancer [12]. There are strict regulations about the exposure limit of BTEX in indoor spaces. For instance, the National Institute of Occupational Safety and Health (NIOSH) and the Occupational Safety and Health Administration (OSHA) have set an exposure limit of 0.1 ppm and 1 ppm, respectively, for benzene in indoor spaces. For toluene, the exposure limit established by NIOSH and OSHA is 100 ppm and 200 ppm, respectively [13,14].
A highly sensitive gas detector having excellent reliability and ease of integration for instance with GC is therefore needed for monitoring of BTEX in indoor spaces. Sensors coupled with micro gas chromatography (μGC), usually called BTEX analysers, can detect each component in the BTEX mixture [15,16,17]. Optical gas sensors have demonstrated high sensitivity and selectivity for detection of different airborne gases. They have a quick time response with minimal drift and poisoning issues in comparison to other sensing methods for instance electrochemical sensors and metal-oxide semiconductor gas sensors [14]. BTEX molecules absorb strongly in the wavelength range of 240 nm to 275 nm [18]. Thus, absorption spectrometry offers a sensitive, rapid, and non-destructive approach for airborne BTEX detection. This optical detection method is self-referenced and reliable with a minimal cross-response to other molecules. Such optical sensors are based on directly measuring the inherent physical property of a molecule, i.e., absorbance of a molecule at a specific wavelength, which effectively acts as a fingerprint. Recent advancements in optoelectronics and optofluidics have led to the development of LEDs, photodiodes, and hollow-core waveguides (HCW), for the UV-range which can be exploited to develop a portable deep UV absorbance detector.
LEDs provide a portable and quasi-monochromatic UV emission source with good spatial stability, low power input, and lower cost compared to conventional UV emission sources, like mercury lamps. Aside from their cost and bulk size, it is not possible to achieve the target wavelength range for BTEX with Deuterium and Xenon lamps without costly optical filters. For the detection part, photodiodes offer a portable and an efficient UV photodetector: They exhibit good photocurrent linearity, visible-blindness, low-dark current, high quantum efficiency, low input power and noise, portability, and low cost [19]. In addition to a UV source and photodetector, a gas cell with a high length-to-volume is required to have a compact instrument compatible with GC for the detection of BTEX mixture at ppb or sub-ppm level. In view of these constraints, Hollow-Core Waveguides (HCW) is an excellent candidate that can be applied as a miniature gas cell with an efficient radiation transmission. HCWs transmit UV radiation in a leaky-mode through the reflection of the emitted radiation inside the co-axial hollow core. Aluminium is considered to be an efficient coating material for deep-UV radiation compared to other metals, for instance silver, and it has good chemical compatibility with airborne BTEX molecules [20].
BTEX components have overlapping spectra and the detection of individual component with high sensitivity in BTEX mixture is challenging. However, an absorbance detector compatible with μGC can separate, identify, and detect each molecule of BTEX mixture. Such a photometer needs a gas cell with a microliter inner volume and larger length having minimum dead volume to detect each BTEX molecule with an individual peak. Previous research on BTEX detection was primarily focussed on the sensitivity of the sensor and mostly an individual BTEX molecule was tested. Eckhardt et al. [21,22] developed a detector with an aluminium-coated HCW (length, 1 m and diameter, 1 mm) as a gas cell, deuterium lamp (30 W) as UV source, and CCD-based spectrometer as a UV detector. The setup was coupled with GC and tested for detection of aromatics compounds like ethylbenzene and bromobenzene. Its main limitations are the high volume of the gas cell (785 μL) and the overall size of the spectrophotometer (emission source and detector). Bui et al. [23] employed deep-UV LED (λpeak = 260 nm) and photodiodes for the direct detection of BTEX with good sensitivity (152 μA·U-ppm−1; limit of detection of 0.66 ppm for toluene). An aluminium-based gas cell (length, 40 cm and inner diameter, 2 mm) was used with an inner volume of 1256 μL. The higher inner volume of the gas cell, which limits its use for GC application. Khan et al. [24] demonstrated a simple toluene detector using UV-LED, HCWs, and spectrometer. Two types of HCWs were investigated: Glass-coated HCW and aluminium-based HCW. A limit of detection of 8.15 ppm was reported with aluminium-coated glass HCW with an inner volume of 275 μL. The sensitivity and high dead volume are its main drawbacks, which limit its application for GC analysis.
In this paper, the development of deep-UV absorbance detector compatible with μGC for detection of the individual BTEX components is reported. The design is based on using deep-UV LED, photodiodes, and HCW with a microliter volume gas cell with negligible dead-volume. The design allows direct measurement of absorbance without mono-chromator and ease of coupling with μGC. To the best of our knowledge, a sensitive and portable deep-UV absorbance detector based on deep-UV LED, photodiodes, and HCW with microliter volume having good compatibility with μGC has not been reported in the literature.
2. Materials and Methods
2.1. Instrumentation
The schematic of the absorbance detector developed is shown in Figure 1. The instrumentation employed in the development of deep-UV detector were fibre-coupled deep-UV LED, glass HCW coated with aluminium, and photodiodes. A fibre-coupled deep-UV LED (Mightex System, Pleasanton, CA, USA) driven by a stable current source (0–100 mA) was used as an UV emission source. The peak wavelength and power range of this LED were 260 nm and 54–80 μW, respectively. The LED was integrated with a fibre-coupled beam splitter (50:50, QP400-025-SR, Ocean Optics, EW Duiven, the Netherlands) to divide the light into two, one acted as a reference while the other served as a test beam passing through the gas cell.
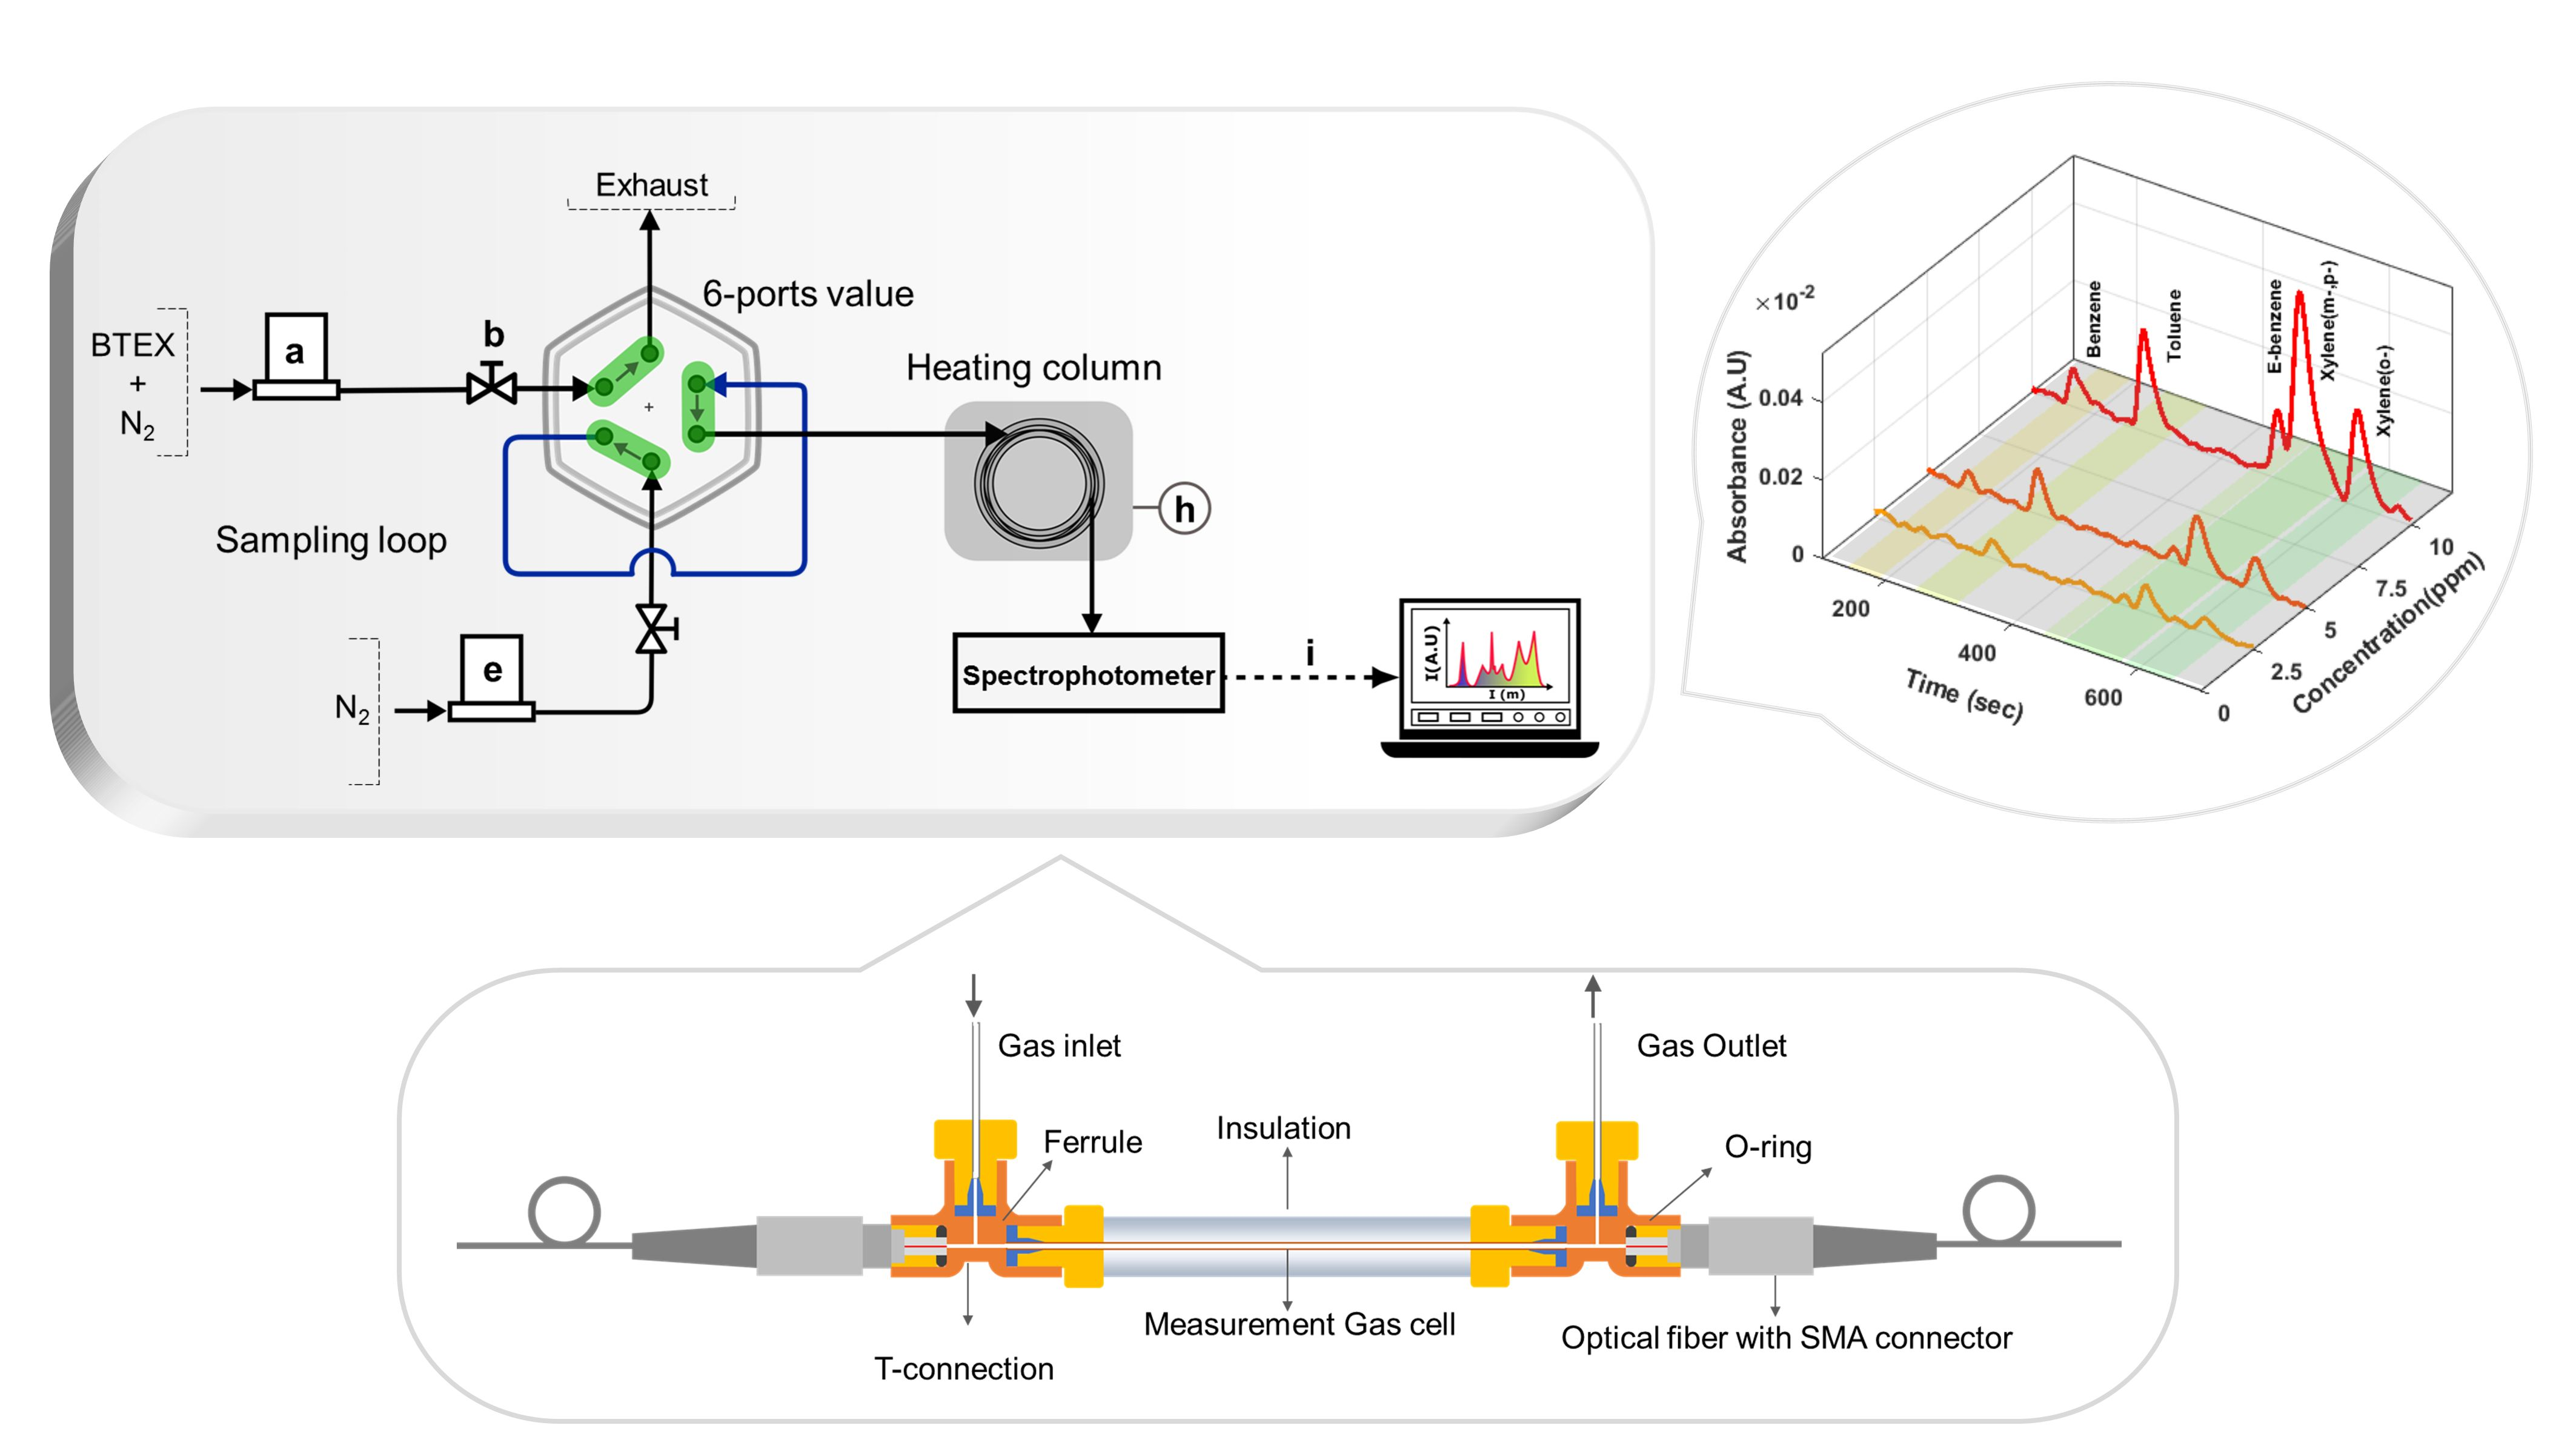
An aluminium-based HCW (Doku Engineering, Sendai, Japan), which is composed of a capillary glass tube coated with aluminium, was installed as a gas cell. The HCW of length 34 cm and the inner volume of 275 μL (inner diameter, 1 mm) was fixed in-between the PEEK T-assemblies (IDEX Health & Science, Oak Harbor, WA, USA) to achieve a low-volume gas cell with a minimal dead volume. PEEK exhibits excellent chemical resistance and high melting point (343 °C) with sufficient mechanical properties for our application, and can be readily machined [25]. As shown in Figure 1a, custom-made ferrules and nuts were fixed at the end of the HCW to achieve a leakage-free connection. A PEEK T-assembly was micromachined and coupled with the HCW (via ferrules and nuts) and optical fibre-connector to get a leakage free fluidic-optics connection. All the components were fixed tightly to minimise the dead-volume of the assembly. The HCW with T-assemblies was positioned on an optical bench using 3D printed connectors and fixtures. The connectors were designed using Solidworks (Dassault Systèmes, Vélizy-Villacoublay, France) and 3D printed (Ultimaker 3, Geldermalsen, the Netherlands) using ABS (acrylonitrile butadiene styrene). The rendered image of the 3D-printed holder for T-assembly is shown in Figure 2. The holder was designed to accommodate a gas supply tube, HCW, and the SMA connector (head) of optical fibre. It was designed to minimize leakages and to achieve flexibility and robustness in connecting the gas tubing and optical fibre with the HCW.
The 3D-printed holders were placed at the two ends of the HCW as illustrated in Figure 1a. A silicone sealant was applied at the external surfaces near the inlet and outlet to ensure the sealing of the connectors. The HCW assembly was covered with Styrofoam and aluminium sheet for thermal insulation and protection. The opto-mechanical components (i.e., LED and photodiodes) were aligned on the optical breadboard (MB3090/M, Thorlabs, Maisons-Laffitte, France) using 3D-printed housings. The board was equipped with vibration-isolating feet to avoid baseline shifts due to mechanical movement. The gas cell was thermally insulated to minimise thermal-induced noise. The 3D-printed housing for HCW is shown in Figure S1.
For the desired wavelength range (245 nm to 275 nm), SiC photodiodes (SG01S, Sglux, Berlin, Germany) were employed. The photodiode selected for the test section shown in Figure 1b has a spectral sensitivity of 120 mA/W (active area 0.06 mm2) for a wavelength range of 225 to 285 nm without any external optical filters. A photodiode (S12742, Hamamatsu, Massy, France) with a built-in interference filter was employed as a reference photodiode. The photodiode has a peak wavelength of 254 nm with a spectral response width of 10 nm allowing the deep-UV photometry with negligible influence of stray light. It has spectral sensitivity of 18 mA/W at a wavelength of 254 nm with an active area of 13 mm2. For spectral analysis, the emission spectra of the LED was recorded using a mini-spectrometer (C10082CH, Hamamatsu, Hamamatsu City, Japan) to analyse the spectral emission of the LED. Each photodiode was assembled inside a 3D-printed housing, which was fixed on the optical breadboard. The housing was equipped with an SMA connector to align and transmit the beam of UV light from the gas cell onto the active area of photodiode. The setup was optically insulated to avoid the exposure of any stray light.
An integrated circuit was developed for processing the photocurrents from the photodiodes to compute the absorbance in volts, similar as reported by Bui et al. [23]. A log-ratio amplifier (LOG101 Texas Instruments, RS Components, Beauvais, France) was used to process the photocurrent using logarithmic computation of the two photocurrents. The circuitry was enclosed in a metallic box connected with the ground, as shown in Figure 1b, to minimise the influence of external electromagnetic waves. A low-pass electronic filter was integrated with the amplifier circuit to remove high-frequency noise. The schematic diagram of electronic and optical components is shown in Figure 1a,b. A multimeter (Keithley 2000, Farnell, Limonest, France) was used to record signal from amplifier in volts, and a lab-VIEW based data acquisition system was developed to record the data (time scale 0.1 s) on PC. The data post-processing was performed using Matlab and Spectragryph [26].
2.2. Gas Mixture Generation and Gas Chromatography Analysis
For direct toluene injection, a toluene-N2 cylinder (100 ppm ±2%) was used, and different concentrations were generated by diluting it with different N2 gas flow using mass flow controllers (Bronkhorst, Montigny-lès-Cormeilles, France). The gas generation setup is shown in Figure S2. For GC analysis, a BTEX cylinder (Air Products, Schiltigheim, France) with a total concentration of 60 ppm was used as a source of BTEX injection. Each component of BTEX mixture constitutes a concentration of 10 ppm ±2%. Similarly, to the generation of gaseous toluene mixture, the dilution bench was used to generate a BTEX-N2 mixture with a total concentration of 30 ppm and 15 ppm. A pressure controller (IQP600, 0–10 bar ±5% Bronkhorst, Montigny-lès-Cormeilles, France) was installed to maintain the supply of carrier gas inside the GC setup.
A PDMS based GC column was selected due to its polarity and molecular structure, which is compatible with BTEX molecules. The methyl-groups (-CH3) in the molecular structure of PDMS are non-polar and can be replaced with other groups to tune the polarity for the desired application. PDMS (94%) and cyanopropylphenyl (6%) was used for coating the column. The column with a length of 20 m (Inner diameter 180 μm, RXi-624Sil MS) was coiled into a small circle with a diameter of 7.5 cm. The coiled column was placed inside an aluminium plate (10 cm × 10 cm × 1 cm) for uniform heat transfer using an electrical resistor with a thermocouple placed under the column. The column was thermally insulated, and its temperature was regulated via a controller (CAL3300, Farnell, Limonest, France). The gas flow rate inside the μGC during the different phases of chromatography was controlled using a solenoid 6-ports value (MTV-6LL-N32UF-1, Takasago Fluidic Systems, Nagoya, Japan). The 6-ports value was coupled with a sampling loop of volume 200 μL (PEEK Interchim, Montluçon, France). The μGC setup with the absorbance detector is shown in Figure 3.
3. Results and Discussion
The absorbance detector is designed to directly measure the absorbance of the gas components as a voltage, which is recorded with a multimeter. The emitted UV radiation of the LED is sensitive towards the input current and temperature of the LED. To minimize the fluctuation of the signal, a referencing technique is applied. The UV light emitted from the LED is split into two beams using a fibre-coupled beam splitter, one beam Io acts as a reference, while the other serves as a measurement beam I, passes through the gas cell, as represented in Figure 1b. The two intensities (i.e., Io and I) are recorded using photodiodes, which generate photocurrents io and i, respectively. The photocurrents generated are proportional to the intensity of the incident UV light. A log-ratio amplifier processes the two photocurrents to compute the absorbance by taking a logarithmic ratio of io and i, and gives a single output in volts. The output voltage represents the absorbance according to the Beer-Lambert equation which can be expressed as
where Av is the absorbance in volts, io and i represents the photocurrents from the reference photodiode and test photodiode, respectively.
The absorption spectrum of the target BTEX molecules, were initially investigated and compared with the emission spectrum of the LED. The absorption data of the molecules were collected from high-resolution transmission molecular absorption database (HITRAN) [18] and were mapped with the emission spectrum of the LED as shown in Figure 4a. The emission spectrum of the LED was recorded using the mini-spectrometer (C10082CH, Hamamatsu, Hamamatsu city, Japan) without passing through the gas cell. The LED spectrum covers a significant portion of the absorption spectra of the BTEX components for a wavelength range of 245 nm to 275 nm with a peak at 260 nm. The maximum peak absorption cross-sections σ of benzene, toluene, ethylbenzene, m-xylene, o-xylene, and p-xylene with the corresponding peak wavelength are summarized in Table 1. For comparison, the integrated absorbance for wavelength range (245 nm to 275 nm) was calculated by using area integral of the absorption spectrum as given in Figure 4b. This data is important during detection of the BTEX mixture, as the detection of the components is dictated by their corresponding absorbance. p-xylene shows the highest absorption, while benzene shows the lowest absorption, implying that detection of p-xylene is easier compared to other components.
3.1. Detection of Toluene
The absorbance detector was first tested with a direct injection of different concentrations of toluene in N2. The experiments were carried out by first injecting pure N2, followed by injection of the toluene-N2 mixture for 5 min. When the toluene molecules were injected into the gas cell, the output voltage recorded increased due to the absorbance of toluene molecules. For instance, the recorded signal for the toluene-N2 mixture of 5 ppm and 20 ppm is shown in Figure 5. Each concentration was injected three times with pure N2 injections in-between. A significant rise in the signal was observed, as the toluene concentrations were injected into the cell. High spikes were observed in the absorbance signal at the instant when the toluene cylinder value was turned ON. The gas dynamics inside the capillary tube at the instant of valve opening could be the reason for these instant spikes. No such spikes were observed in case of BTEX detection with μGC, which is discussed in the following section.
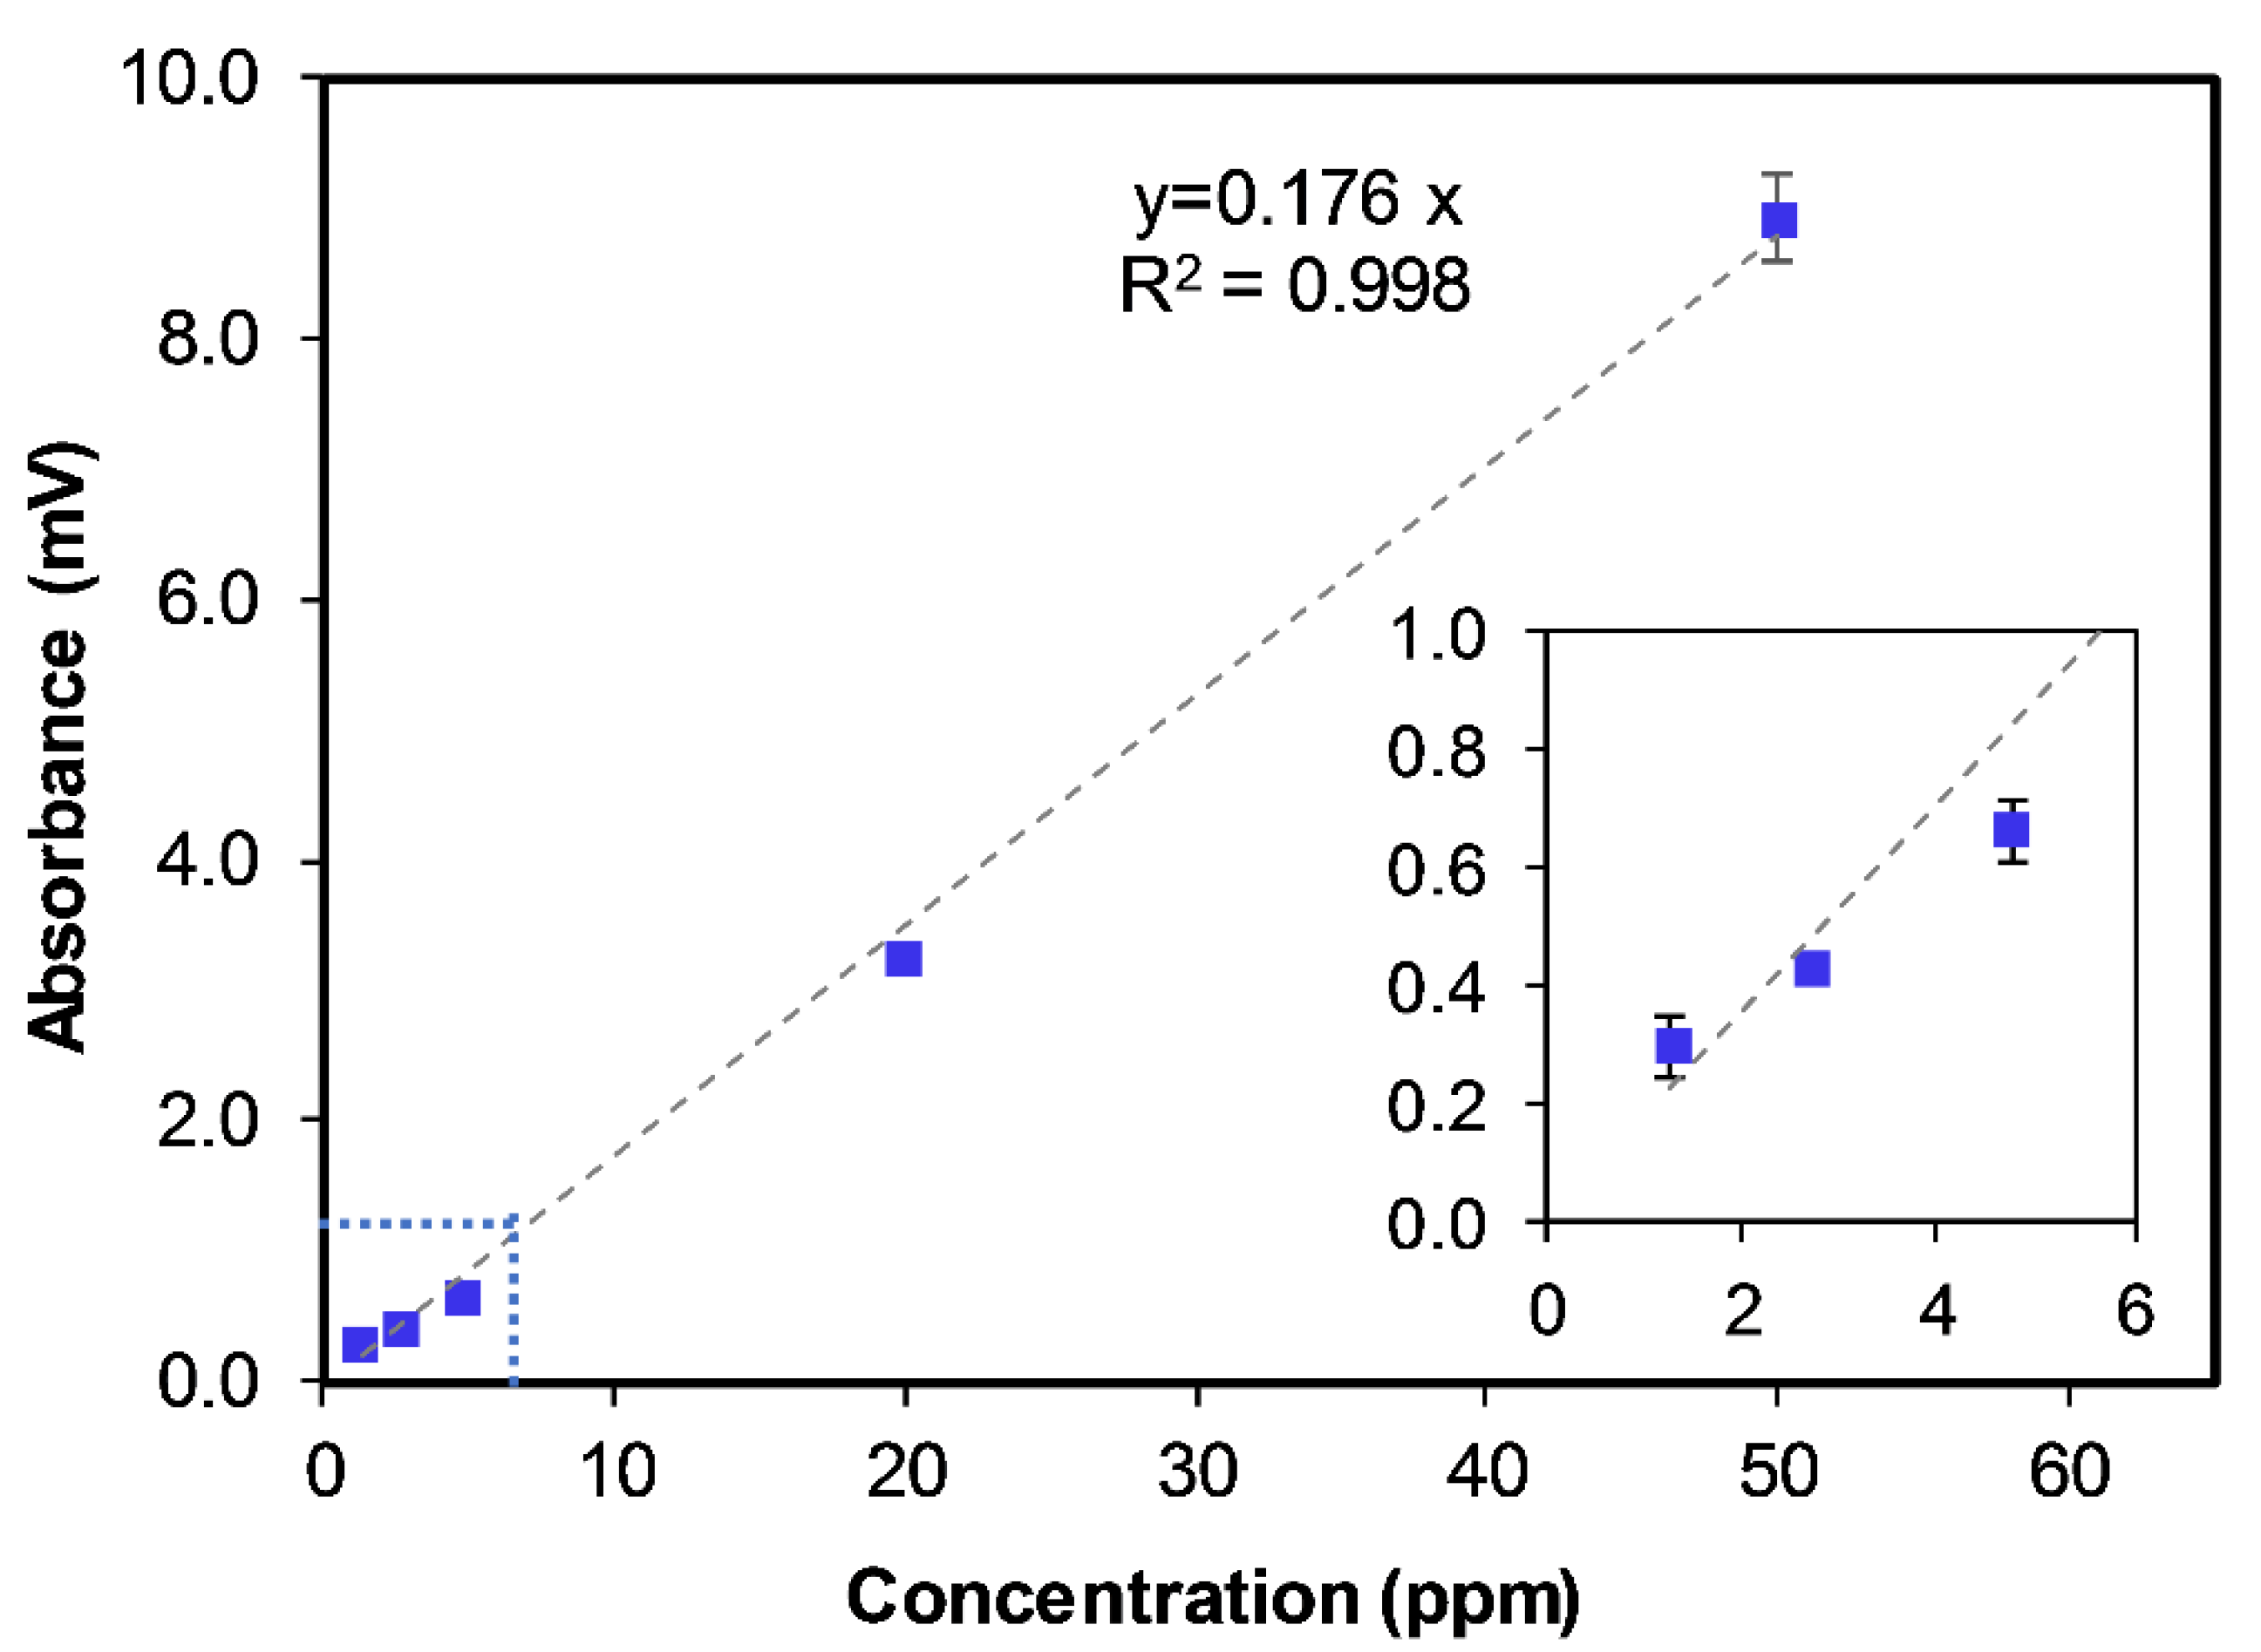
The experimental device was then tested with direct injection of a toluene-N2 concentration of 1.5 ppm to 50 ppm. A calibration curve for concentrations (1.5 ppm to 50 ppm) of toluene is shown in Figure 6. Each data point on the calibration curve represents an average of three observations while each observation is an average of absorbance values for five mins. The design demonstrated good linearity (R2 = 0.99) for the investigated concentration range 1.5–50 ppm with a sensitivity of 1.76 × 10⁻⁴ A·U-ppm−1. A limit of detection of 196 ppb was derived from the curve by using a concentration corresponding to a signal with value three times higher than the baseline noise. The baseline noise was calculated by using a standard deviation of the blank obtained with pure nitrogen flow for a time duration of 250 s (Figure S3) and repeated three times.
3.2. Detection of BTEX with μGC
The detector was then tested for detection of BTEX mixtures by coupling it with the μGC setup developed by our research group. The μGC process for separation and detection of the BTEX mixture was carried out in two modes, i.e., the sampling mode and analysis mode, as described in the Section 2.1. The separation and detection of BTEX were conducted in the analysis mode. In the sampling mode, the BTEX species were sampled into a loop of fixed volume (200 μL) at a flow rate of 30–50 mL/min (P = 1 bar, T = 25 °C) for 15 s. The carrier gas N2 was passing through the column and detector at a flow rate of 2.45 mL/min. The transition from sampling mode to analysis mode was carried out with the 6-ports valve. During the analysis mode, the 6-ports valve was turned ON and the BTEX components were injected into the μGC. The separated species were then injected into the absorbance detector as shown in Figure 3. In the GC analysis, the 6-ports valve switches very rapidly between sampling and analysis modes, whereas the pressure was maintained constant by a forward pressure controller. There was no valve opening/closing involved, therefore no spikes were observed at the instant of injection of BTEX.
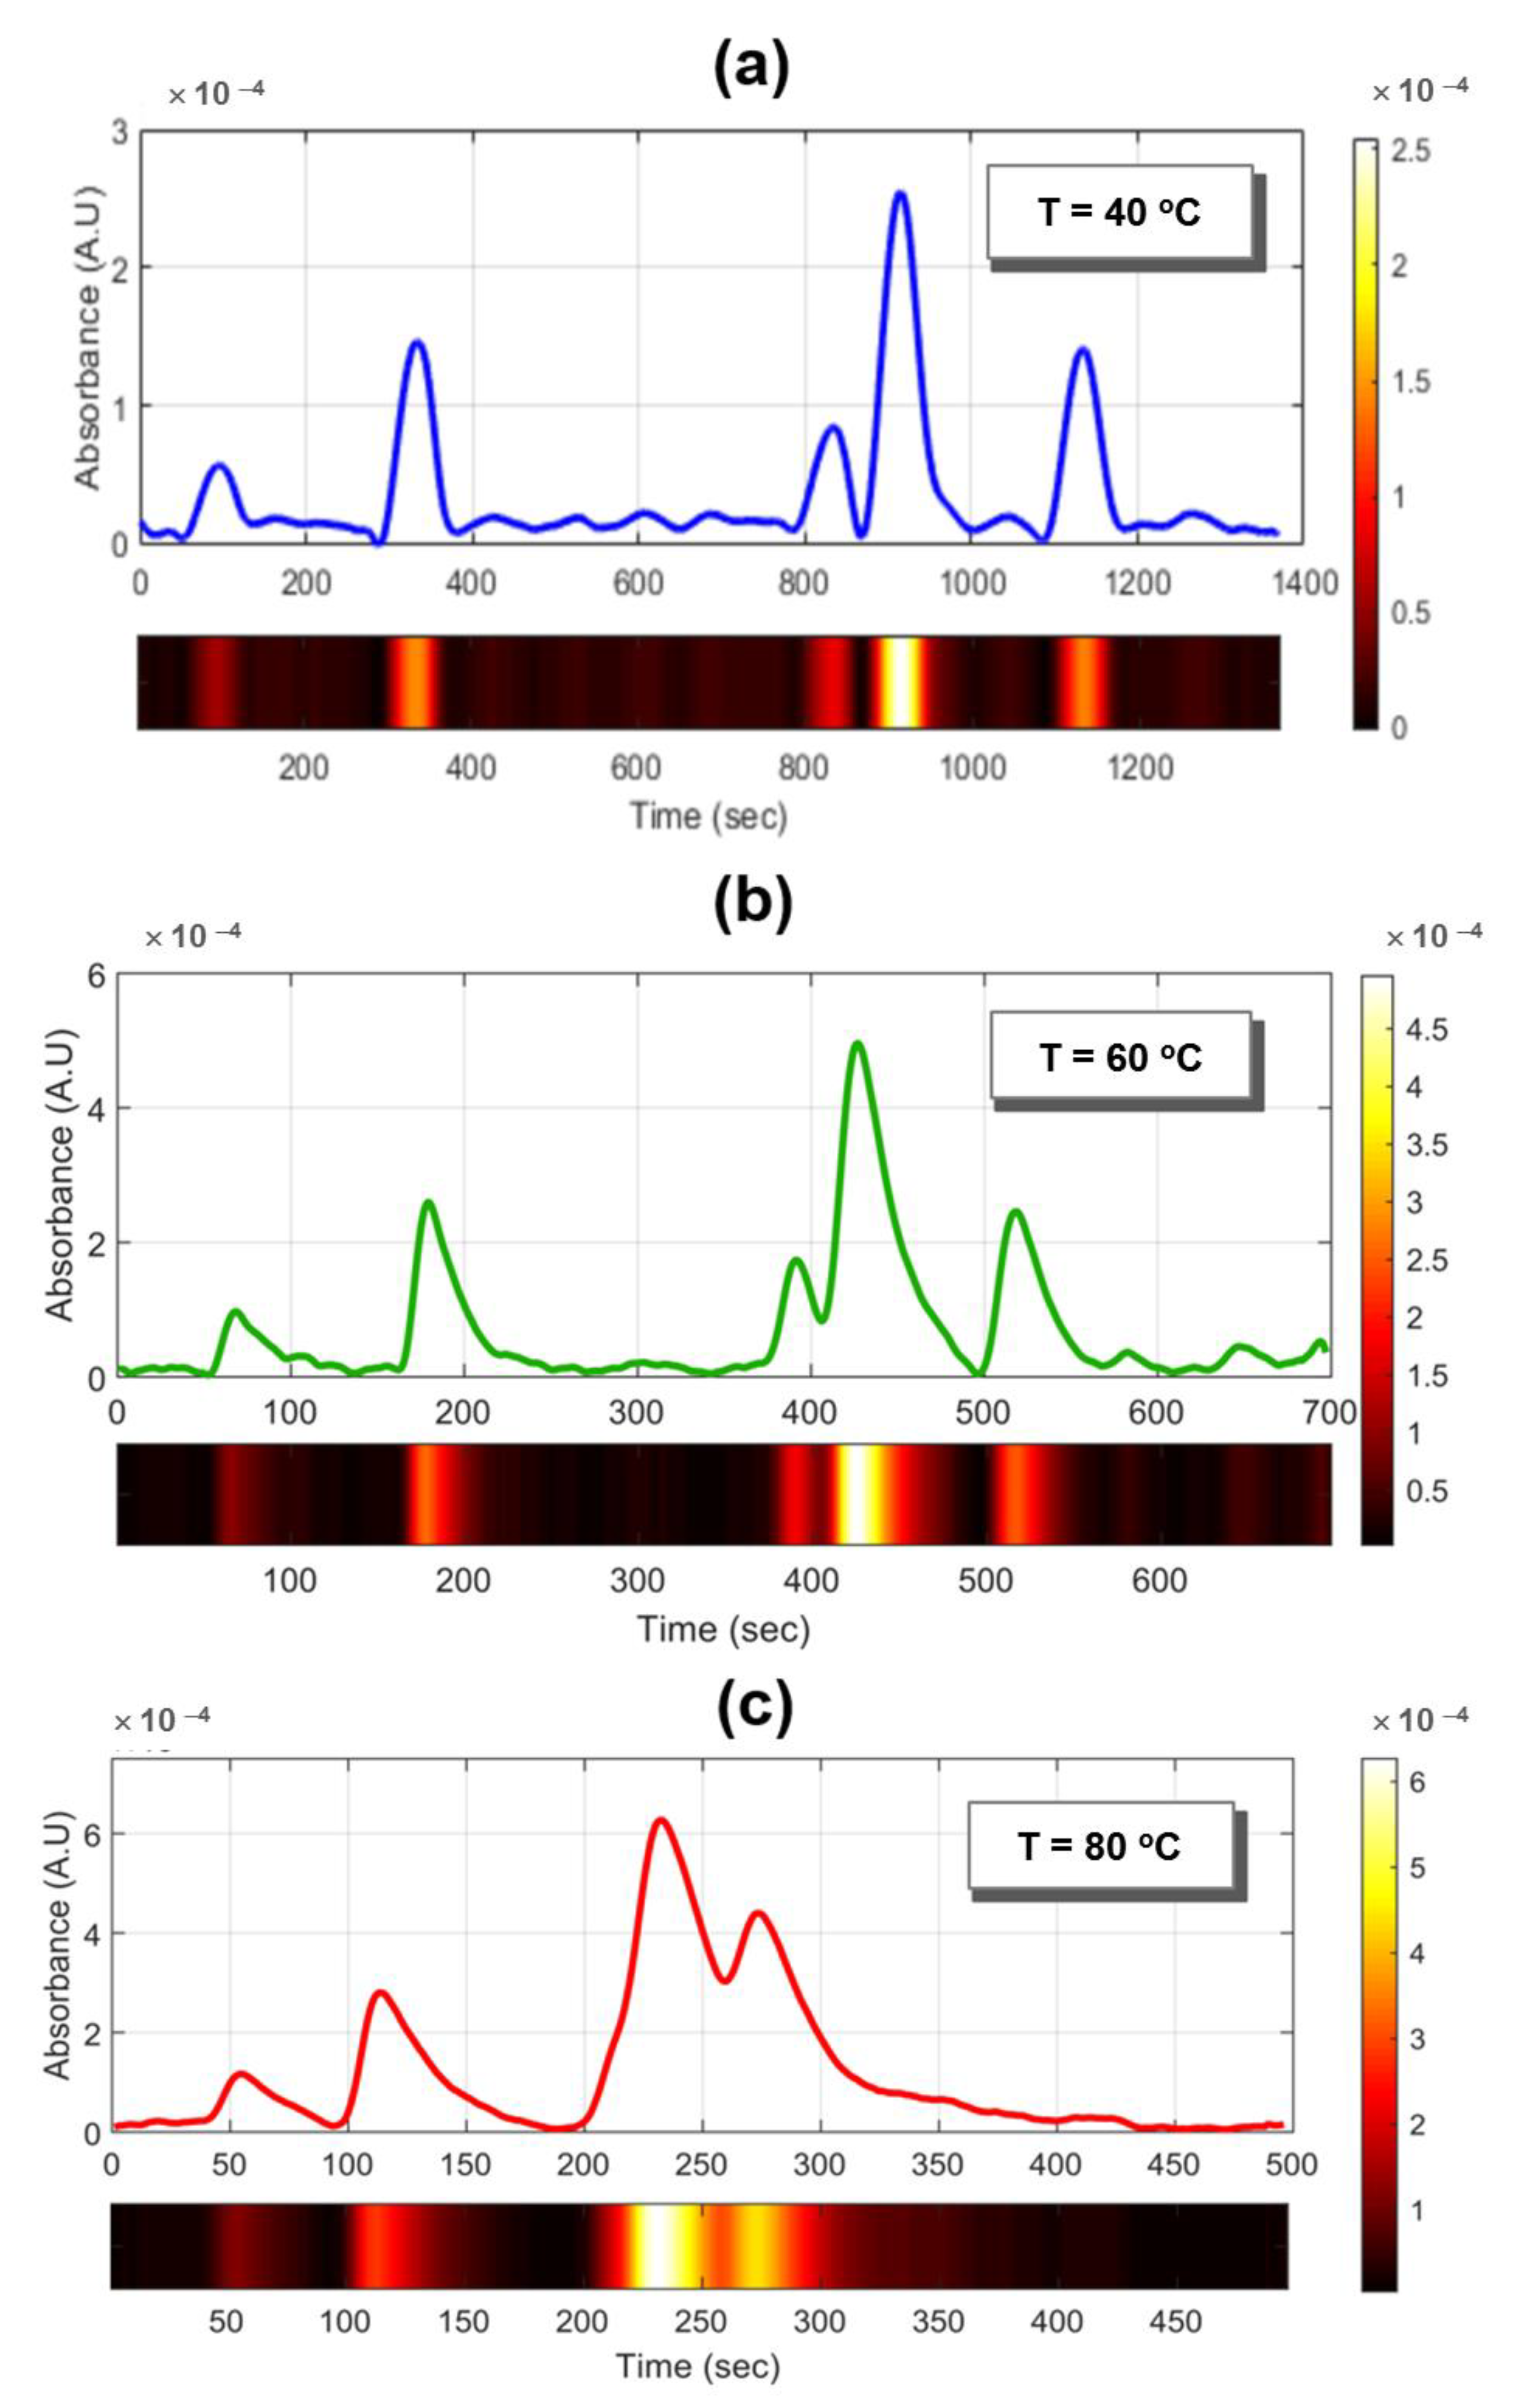
A total BTEX-N2 mixture of 60 ppm with each compound of 10 ppm was injected into GC. The μGC column’s temperature was maintained at 60 °C. A chromatogram of 700 s was recorded in which all the peaks were separated, corresponding to benzene, toluene, ethylbenzene, (m-,p-) xylenes, and o-xylene in temporal sequence, as shown in Figure 7 (red line). Each peak represents an individual BTEX molecule. The elution sequence of BTEX molecule is performed according to the boiling points of BTEX components. The boiling points of m-xylene and p-xylene are very close (i.e., 139.1 °C and 138.4 °C, respectively) so that they exhibit coelution. (m-,p-) xylenes have the highest peak followed by o-xylene, toluene, ethylbenzene, and benzene, which is in accordance with the absorbance value of the components for the wavelength range of 245 nm to 275 nm (see Figure 4b). The device was then tested for total BTEX-N2 mixture of 30 ppm and 15 ppm, and the concentration of the individual molecule was 5 ppm (orange line) and 2.5 ppm (yellow line), respectively. The chromatograms for the separated BTEX species are shown in Figure 7. All the BTEX components were detected for all three concentrations injected. However, a weak signal was obtained for 2.5 ppm with no clear signal for benzene and ethylbenzene. This is due to the relatively lower absorption coefficient of benzene and ethylbenzene.
An area of each peak was calculated for the BTEX molecule and plotted for the three concentrations (10 ppm, 5 ppm, 2.5 ppm) as shown in Figure 8. The detector demonstrated good linearity for all the BTEX components with R2 ~ 0.99. It should be noted that only three data points were used for calibration due to the limitation of the BTEX cylinder and MFCs employed in the concentration generation setup. A sensitivity of 1.91 × 10⁻⁴ A·U-ppm−1, 6.55 × 10⁻⁴ A·U-ppm−1, 1.34 × 10⁻⁴ A·U-ppm−1, 9.58 × 10⁻⁴ A·U-ppm−1, and 5.70 × 10⁻⁴ A·U-ppm−1 was calculated for benzene, toluene, ethylbenzene, (m-,p-) xylenes, and o-xylene, respectively. The pattern of sensitivities is according to the absorbance cross-section values of the species.
Furthermore, experiments were conducted at a different column temperature of 40 °C, 60 °C, and 80 °C as illustrated in Figure 9. At the lowest temperature, i.e., 40 °C, all the BTEX were distinctively separated at a cost of extended time for the chromatogram (see Figure 9a). At the highest temperature, i.e., 80 °C, a chromatogram was obtained in a shorter time with lower values for peaks resolution. The peak for ethylbenzene is not discernible for the case of 80 °C, as observed in Figure 9c. Therefore, the optimal temperature was found to be 60 °C, as already reported by Nasreddine et al. [27], where they used a photo-ionisation detection module. The peaks-resolution values for BTEX components at the three studied temperatures are summarized in Table 2. The degree of separation between the two peaks (a and b) was quantified by using a resolution, R, as given by [28],
where tr and w represent the retention time and baseline width (full width at half maximum—FWHM), respectively. At lower temperature (i.e., 40 °C), peak resolutions have higher values (about two times higher) compared to those obtained with the column temperature of 60 °C.
During testing all the gases were flushed into the systems from cylinders with a negligible level of humidity. Although the detector signal is not affected by humidity in the air. However, humidity could absorb into the reflective surface of the HCW and decrease the transmission of UV radiation with time. Nafion membrane at the inlet or quartz lining of the aluminium coating are usually used to avoid the negative effects of humidity on the sensing system [20].
4. Conclusions
A novel, self-referenced deep-UV absorbance detector was developed for the detection of BTEX components. The absorbance detector composed of portable devices: UV-LED, HCW as a gas cell, and photodiodes. The detector directly measures the absorbance values in volts. The design is based on using a log-ratio amplifier, which used the photocurrents from a reference and measurement photodiodes to compute the absorbance in volts according to Beer–Lambert law. The design was tested with direct injection of toluene and with a mixture of BTEX species. For toluene, the detector response increases linearly with the gaseous toluene concentration in the range 1.5–50 ppm, i.e., toluene levels consistent with the exposure limits of 100–200 ppm given by NIOSH and OSHA. A corresponding sensitivity and limit of detection of 1.76 × 10⁻⁴ A·U-ppm−1 and 196 ppb, respectively, were obtained for toluene. The absorbance detector was also coupled with μGC set up, enabling the separation of BTEX components prior to their detection by UV absorbance detector. All the BTEX components were separated and detected with an individual peak correspond to each BTEX molecule for a concentration range of 10 ppm to 2.5 ppm. The design was also tested at a different column temperature of 40, 60, and 80 °C. The proposed detection device has low volume with minimal dead-volume and directly measures the absorbance with a stable signal. The design has tremendous potential to be employed for the chromatographic studies of different analytes in media like gas or liquid.
Supplementary Materials
The following are available online at https://0-www-mdpi-com.brum.beds.ac.uk/article/10.3390/chemosensors9040063/s1, Figure S1: The rendered image of the 3D printed housing for HCW. Multiple housing/holders were 3D printed and installed on the optical breadboard to support and align the HCW; Figure S2: Gas generation setup for different concentrations of Toluene in N2. MFC- Mass Flow Controller; Figure S3: The signal (absorbance) recorded for gaseous nitrogen flow. The box represents the time window for calculating the noise (i.e., the standard deviation).
Author Contributions
Conceptualization, S.K.; methodology, S.K., D.N., and S.L.C.; validation, S.K.; formal analysis, S.K.; resources, S.L.C. and D.N.; writing—original draft preparation, S.K.; writing—review and editing, S.K., D.N., and S.L.C.; visualization, S.K.; supervision, S.L.C. and D.N.; project administration, S.L.C. and D.N.; funding acquisition, S.L.C. and D.N. All authors have read and agreed to the published version of the manuscript.
Funding
This work was funded by European Union’s Horizon 2020 research and innovation programme under the Marie Skłodowska-Curie Innovative Training Network-MIGRATE (Miniaturized Gas flow foR Applications with Enhanced Thermal Effects), grant agreement No. 643095 [H2020-MSCA-ITN-2014]. This work has also received funding from the Clean Sky 2 Joint Undertaking under the European Union’s Horizon 2020 research and innovation program under grant agreement No 687014 (MACAO Project).
Institutional Review Board Statement
Not applicable.
Informed Consent Statement
Not applicable.
Data Availability Statement
The data presented in this study are available on request from the corresponding author. The data are not publicly available because the authors want to keep priority for conference presentations.
Acknowledgments
The authors appreciate the technical support from Peter C. Hauser, Department of Chemistry, University of Basel Switzerland, in the development of electronic circuitry for data acquisition.
Conflicts of Interest
The authors declare no conflict of interest.
References
- Environmental Protection Agency (EPA). Introduction to Indoor Air Quality Indoor Air Quality (IAQ). 2018. Available online: https://www.epa.gov/indoor-air-quality-iaq/introduction-indoor-air-quality (accessed on 15 October 2019).
- Cincinelli, A.; Martellini, T. Indoor Air Quality and Health. Int. J. Environ. Res. Public Health 2017, 14, 11. [Google Scholar]
- Koppmann, R. Chemistry of Volatile Organic Compounds in the Atmosphere. In Handbook of Hydrocarbon and Lipid Microbiology; Springer: Berlin/Heidelberg, Germany, 2010; pp. 267–277. [Google Scholar]
- Noziere, B.; Kalberer, M.; Claeys, M.; Allan, J.; D’Anna, B.; Decesari, S.; Finessi, E.; Glasius, M.; Grgić, I.; Hamilton, J.F.; et al. The Molecular Identification of Organic Compounds in the Atmosphere: State of the Art and Challenges. Chem. Rev. 2015, 115, 3919–3983. [Google Scholar] [CrossRef] [PubMed]
- Wallace, L.A. Major sources of benzene exposure. Environ. Health Perspect. 1989, 82, 165–169. [Google Scholar] [CrossRef] [PubMed]
- Ilgen, E.; Karfich, N.; Levsen, K.; Angerer, J.; Schneider, P.; Heinrich, J.; Wichmann, H.-E.; Dunemann, L.; Begerow, J. Aromatic hydrocarbons in the atmospheric environment: Part I. Indoor versus outdoor sources, the influence of traffic. Atmos. Environ. 2001, 35, 1235–1252. [Google Scholar] [CrossRef]
- Ayoko, G.A. Volatile Organic Compounds in Indoor Environments. Environ. Chem. 2004, 4, 1–35. [Google Scholar]
- WHO. Exposure to Benzene: A Major Public Health Concern; WHO: Geneva, Switzerland, 2010. [Google Scholar]
- Baan, R.; Grosse, Y.; Straif, K.; Secretan, B.; El Ghissassi, F.; Bouvard, V. A review of human carcinogens—Part F: Chemical agents and related occupations. Lancet Oncol. 2009, 10, 1143–1144. [Google Scholar] [CrossRef]
- Patnaik, P. A Comprehensive Guide to the Hazardous Properties of Chemical Substances; John Wiley: Hoboken, NJ, USA, 2007. [Google Scholar]
- Kandyala, R.; Raghavendra, S.P.; Rajasekharan, S. Xylene: An overview of its health hazards and preventive measures. J. Oral Maxillofac. Pathol. 2010, 14, 1. [Google Scholar] [CrossRef] [PubMed] [Green Version]
- Pyatt, D.; Hays, S. A review of the potential association between childhood leukemia and benzene. Chem. Biol. Interact. 2010, 184, 151–164. [Google Scholar] [CrossRef]
- Barson, M.E. NIOSH-Pocket Guide to Chemical Hazards; The National Institute for Occupational Safety and Health: Pittsburgh, PA, USA, 2005. [Google Scholar]
- Khan, S.; Le Calvé, S.; Newport, D. A Review of Optical Interferometry Techniques for VOC Detection. Sens. Actuators A Phys. 2020, 302, 111782. [Google Scholar] [CrossRef]
- Allouch, A.; Le Calvé, S.; Serra, C.A. Portable, miniature, fast and high sensitive real-time analyzers: BTEX detection. Sens. Actuators B Chem. 2013, 182, 446–452. [Google Scholar] [CrossRef]
- Khan, S.; Newport, D.; Le Calvé, S. Low-volume PEEK gas cell for BTEX detection using portable deep-UV absorption spectrophotometry. Spectrochim. Acta Part A Mol. Biomol. Spectrosc. 2020, 243, 118727. [Google Scholar] [CrossRef]
- Nasreddine, R.; Person, V.; Serra, C.A.; Schoemaecker, C.; Le Calvé, S. Portable novel micro-device for BTEX real-time monitoring: Assessment during a field campaign in a low consumption energy junior high school classroom. Atmos. Environ. 2016, 126, 211–217. [Google Scholar] [CrossRef]
- Gordon, I.E.; Rothman, L.S.; Hill, C.; Kochanov, R.V.; Tan, Y.; Bernath, P.F.; Birk, M.; Boudon, V.; Campargue, A.; Chance, K.V. The HITRAN2016 molecular spectroscopic database. J. Quant. Spectrosc. Radiat. Transf. 2017, 203, 3–69. [Google Scholar] [CrossRef]
- Macka, M.; Piasecki, T.; Dasgupta, P.K. Light-Emitting Diodes for Analytical Chemistry. Annu. Rev. Anal. Chem. 2014, 7, 183–207. [Google Scholar] [CrossRef] [PubMed]
- Khan, S.; Newport, D.; Le Calvé, S. Gas Detection Using Portable Deep-UV Absorption Spectrophotometry: A Review. Sensors 2019, 19, 5210. [Google Scholar] [CrossRef] [Green Version]
- Eckhardt, H.S.; Klein, K.F.; Spangenberg, B.; Sun, T.; Grattan, K.T.V. Fibre-optic UV systems for gas and vapour analysis. J. Phys. Conf. Ser. 2007, 85, 1. [Google Scholar] [CrossRef] [Green Version]
- Eckhardt, H.S.; Sun, T.; Graubner, K.; Klein, K.-F.; Grattan, K.T.V. Fiber-optic based gas sensing in the UV region. Opt. Fibers Sens. Med. Diagn. Treat. Appl. VI 2006, 6083, 60830. [Google Scholar]
- Bui, D.A.; Hauser, P.C. A deep-UV light-emitting diode-based absorption detector for benzene, toluene, ethylbenzene, and the xylene compounds. Sens. Actuators B Chem. 2016, 235, 622–626. [Google Scholar] [CrossRef]
- Khan, S.; Newport, D.; le Calvé, S. Development of a Toluene Detector Based on Deep UV Absorption Spectrophotometry Using Glass and Aluminum Capillary Tube Gas Cells with a LED Source. Micromachines 2019, 10, 193. [Google Scholar] [CrossRef] [PubMed] [Green Version]
- Schweitzer, P.A. Mechanical and Corrosion-Resistant Properties of Plastics and Elastomers; CRC Press: Boca Raton, FL, USA, 2000. [Google Scholar]
- Menges, F. Spectragryph-optical spectroscopy software. 2019. Version 2017, 1, 2016–2017. [Google Scholar]
- Nasreddine, R.; Person, V.; Serra, C.A.; le Calvé, S. Development of a novel portable miniaturized GC for near real-time low level detection of BTEX. Sens. Actuators B Chem. 2016, 224, 159–169. [Google Scholar] [CrossRef]
- Harvey, D. Modern Analytical Chemistry. Anal. Chem. 1962, 34, 798. [Google Scholar]
Figure 1.
(a) Schematic of ultraviolet (UV) absorbance detector: Gas cell with gas and optics connectors. (b) Schematic for measuring the absorbance in volts. LabVIEW based data acquisition (DAQ) system was used to record the data.
Figure 1.
(a) Schematic of ultraviolet (UV) absorbance detector: Gas cell with gas and optics connectors. (b) Schematic for measuring the absorbance in volts. LabVIEW based data acquisition (DAQ) system was used to record the data.

Figure 2.
The rendered image of the 3D-printed holder for the two ends of the absorbance detector. The T-assembly with connected optical fibre, gas tube, and hollow-core waveguide (HCW) was placed inside the holder, and covered by the top lid to minimise any misalignment and vibrations. The whole assembly was then fixed on the optical bread board with screws.

Figure 3.
Schematic of the μGC setup with the absorbance detector. Sampling mode, i.e., 6-ports value—OFF (top) and the analysis mode, i.e., 6-ports value—ON (bottom) for GC.
Figure 3.
Schematic of the μGC setup with the absorbance detector. Sampling mode, i.e., 6-ports value—OFF (top) and the analysis mode, i.e., 6-ports value—ON (bottom) for GC.

Figure 4.
(a) LEDs emission spectrum mapped on the absorption spectrum of benzene, toluene and m-xylene, p-xylene and o-xylene. Data was sourced from HITRAN [18] and then plotted according to the scale. Each spectrum is normalized by its maximum peak value. (b) The area integral of BTEX components for a wavelength range 245–275 nm.

Figure 5.
Absorbance signal in milli-volts recorded for the toluene-N2 mixture of 5 ppm and 20 ppm. Pure nitrogen was injected in-between the different gaseous toluene injections.
Figure 5.
Absorbance signal in milli-volts recorded for the toluene-N2 mixture of 5 ppm and 20 ppm. Pure nitrogen was injected in-between the different gaseous toluene injections.

Figure 6.
Calibration curve representing the absorbance vs. the gaseous toluene concentration in the range 1.5–50 ppm. The error bars represent the standard deviation of absorbance for three experiments.
Figure 6.
Calibration curve representing the absorbance vs. the gaseous toluene concentration in the range 1.5–50 ppm. The error bars represent the standard deviation of absorbance for three experiments.

Figure 7.
Chromatograms obtained for the toluene-N2 concentration of 10 ppm, 5 ppm, and 2.5 ppm at column temperature 60 °C.
Figure 7.
Chromatograms obtained for the toluene-N2 concentration of 10 ppm, 5 ppm, and 2.5 ppm at column temperature 60 °C.

Figure 8.
Peak’s area of different concentration (i.e., 10 ppm, 5 ppm, and 2.5 ppm) of BTEX—N2 at column temperature of 60 °C. B, T, E, X1, and X2 represent benzene, toluene, ethylbenzene, (m-,p-) xylenes, and o-xylene, respectively. The error bar represents the standard deviation of absorbance for three experiments.

Figure 9.
Chromatograms obtained with the μGC coupled to our spectrometer for 10 ppm of BTEX components at column temperatures (a) 40 °C, (b) 60 °C, and (c) 80 °C.
Figure 9.
Chromatograms obtained with the μGC coupled to our spectrometer for 10 ppm of BTEX components at column temperatures (a) 40 °C, (b) 60 °C, and (c) 80 °C.


Table 1.
Maximum peak absorption cross-section σ of Benzene, Toluene, Ethylbenzene, and Xylenes (BTEX) components at the corresponding peak wavelengths [18].
Table 1.
Maximum peak absorption cross-section σ of Benzene, Toluene, Ethylbenzene, and Xylenes (BTEX) components at the corresponding peak wavelengths [18].
| Molecule | Peak Wavelength (nm) | Maximum Peak Absorption Cross-Section σ × 10−18 (cm2-Molecule−1) |
|---|---|---|
| Benzene | 253.0 | 7.73 |
| Toluene | 266.8 | 1.21 |
| m-xylene | 270.6 | 1.15 |
| o-xylene | 259.7 | 0.77 |
| p-xylene | 272.3 | 3.07 |
Table 2.
Peak-resolution values for BTEX components at different temperatures.
| Temp (°C) | Benzene–Toluene | Toluene–Ethylbenzene | Ethylbenzene– (m-,p-) Xylenes | (m-,p-) Xylenes– (o-)Xylene | Time (1st–Last Peak) sec |
|---|---|---|---|---|---|
| 40 | 9.35 | 17.88 | 2.65 | 6.75 | 1038 |
| 60 | 4.37 | 9.76 | 1.5 | 2.85 | 450 |
| 80 | 2.06 | 3.57 a | 1.06 | 220 | |
a Ethyl benzene coeluted with m-xylene and p-xylene.
Publisher’s Note: MDPI stays neutral with regard to jurisdictional claims in published maps and institutional affiliations. |
© 2021 by the authors. Licensee MDPI, Basel, Switzerland. This article is an open access article distributed under the terms and conditions of the Creative Commons Attribution (CC BY) license (http://creativecommons.org/licenses/by/4.0/).
Share and Cite
MDPI and ACS Style
Khan, S.; Newport, D.; Le Calvé, S. A Sensitive and Portable Deep-UV Absorbance Detector with a Microliter Gas Cell Compatible with Micro GC. Chemosensors 2021, 9, 63. https://0-doi-org.brum.beds.ac.uk/10.3390/chemosensors9040063
AMA Style
Khan S, Newport D, Le Calvé S. A Sensitive and Portable Deep-UV Absorbance Detector with a Microliter Gas Cell Compatible with Micro GC. Chemosensors. 2021; 9(4):63. https://0-doi-org.brum.beds.ac.uk/10.3390/chemosensors9040063
Chicago/Turabian StyleKhan, Sulaiman, David Newport, and Stéphane Le Calvé. 2021. "A Sensitive and Portable Deep-UV Absorbance Detector with a Microliter Gas Cell Compatible with Micro GC" Chemosensors 9, no. 4: 63. https://0-doi-org.brum.beds.ac.uk/10.3390/chemosensors9040063
Note that from the first issue of 2016, this journal uses article numbers instead of page numbers. See further details here.