
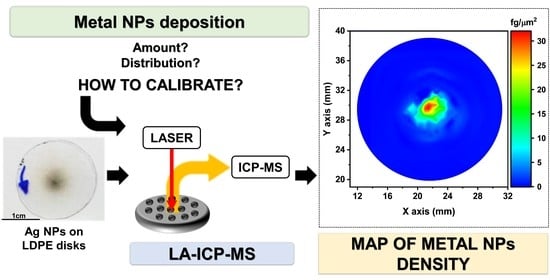
Quantitative Determination of the Surface Distribution of Supported Metal Nanoparticles: A Laser Ablation–ICP–MS Based Approach

 ,
,  ,
,  ,
,
Abstract
:
1. Introduction
2. Materials and Methods
2.1. Samples Preparation and Characterization
2.2. LA-ICP-MS Analysis
2.3. Ag Dissolution and ICP-MS Analysis
3. Results
3.1. Characterization of Ag-Loaded Disks
3.2. Setup of the Calibration Protocol
3.3. Validation of the Calibration Protocol
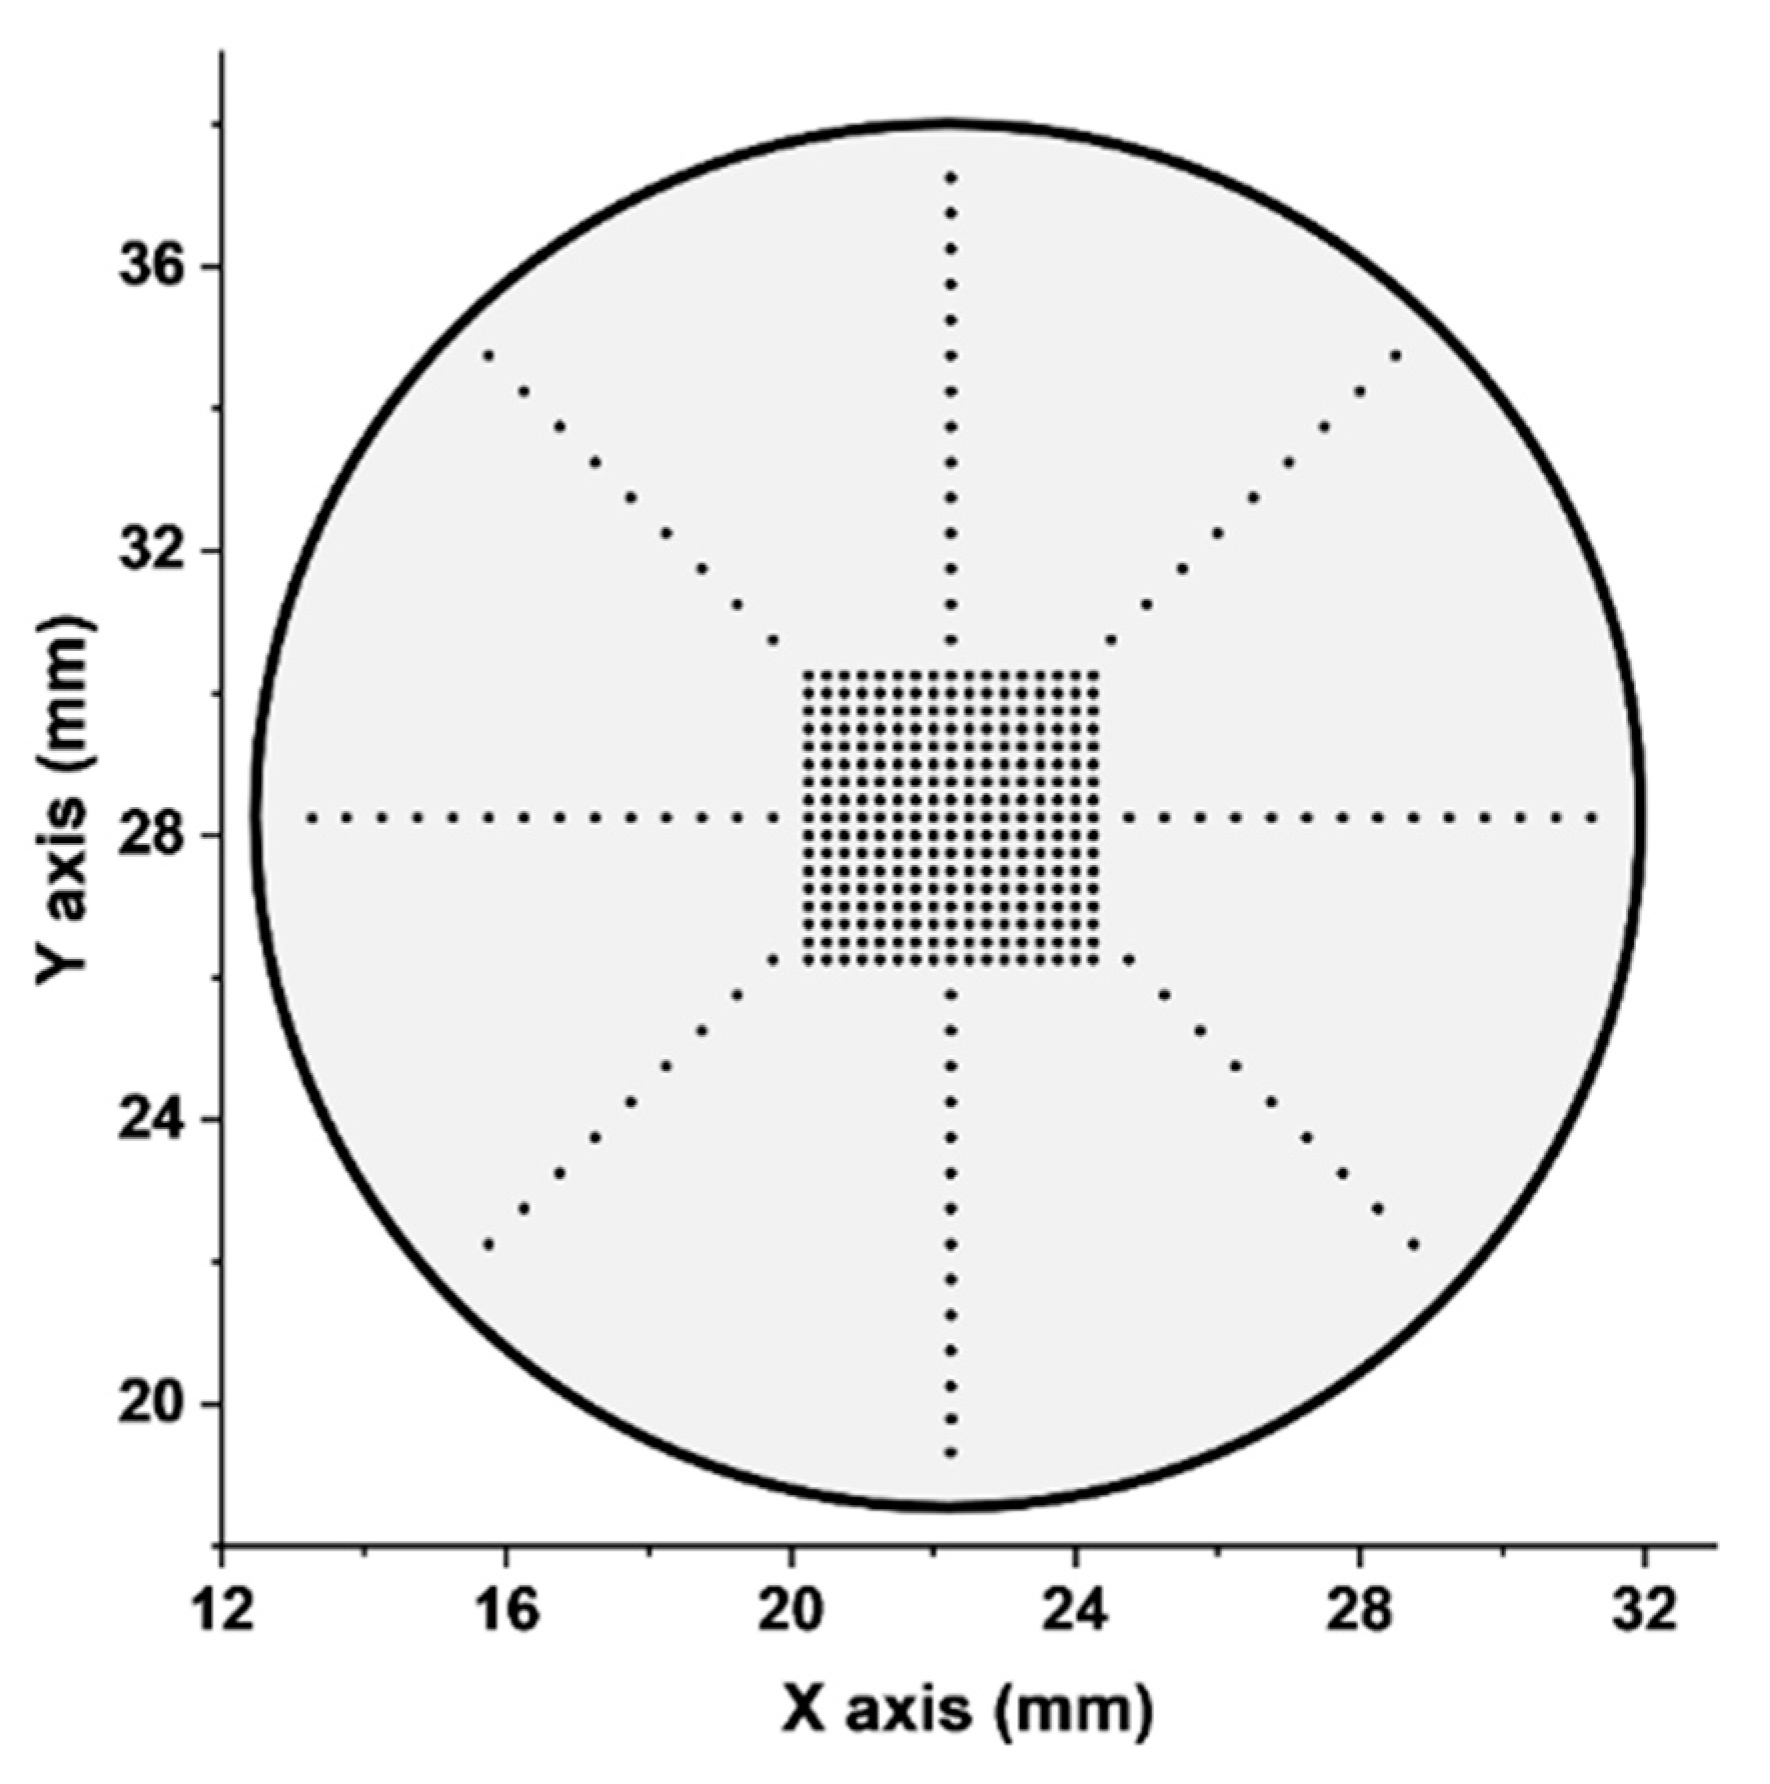
3.4. Choice of the Ablation Pattern
4. Conclusions
Author Contributions
Funding
Institutional Review Board Statement
Informed Consent Statement
Data Availability Statement
Conflicts of Interest
References
- Ndolomingo, M.J.; Bingwa, N.; Meijboom, R. Review of supported metal nanoparticles: Synthesis methodologies, advantages and application as catalysts. J. Mater. Sci. 2020, 55, 6195–6241. [Google Scholar] [CrossRef]
- Liu, L.; Corma, A. Metal Catalysts for Heterogeneous Catalysis: From Single Atoms to Nanoclusters and Nanoparticles. Chem. Rev. 2018, 118, 4981–5079. [Google Scholar] [CrossRef] [Green Version]
- Campelo, J.M.; Luna, D.; Luque, R.; Marinas, J.M.; Romero, A.A. Sustainable Preparation of Supported Metal Nanoparticles and Their Applications in Catalysis. ChemSusChem 2009, 2, 18–45. [Google Scholar] [CrossRef]
- Zou, X.; Wang, J.; Liu, X.; Wang, C.; Jiang, Y.; Wang, Y.; Xiao, X.; Ho, J.C.; Li, J.; Jiang, C.; et al. Rational Design of Sub-Parts per Million Specific Gas Sensors Array Based on Metal Nanoparticles Decorated Nanowire Enhancement-Mode Transistors. Nano Lett. 2013, 13, 3287–3292. [Google Scholar] [CrossRef] [PubMed]
- Gutés, A.; Hsia, B.; Sussman, A.; Mickelson, W.; Zettl, A.; Carraro, C.; Maboudian, R. Graphene decoration with metal nanoparticles: Towards easy integration for sensing applications. Nanoscale 2012, 4, 438–440. [Google Scholar] [CrossRef]
- Spanu, D.; Binda, G.; Dossi, C.; Monticelli, D. Biochar as an alternative sustainable platform for sensing applications: A review. Microchem. J. 2020, 159, 105506. [Google Scholar] [CrossRef]
- Nava, G.; Fumagalli, F.; Gambino, S.; Farella, I.; Dell’Erba, G.; Beretta, D.; Divitini, G.; Ducati, C.; Caironi, M.; Cola, A.; et al. Towards an electronic grade nanoparticle-assembled silicon thin film by ballistic deposition at room temperature: The deposition method, and structural and electronic properties. J. Mater. Chem. C 2017, 5, 3725–3735. [Google Scholar] [CrossRef]
- Ko, S.H.; Park, I.; Pan, H.; Grigoropoulos, C.P.; Pisano, A.P.; Luscombe, C.K.; Fréchet, J.M.J. Direct Nanoimprinting of Metal Nanoparticles for Nanoscale Electronics Fabrication. Nano Lett. 2007, 7, 1869–1877. [Google Scholar] [CrossRef] [PubMed]
- Kelly, P.; Arnell, R. Magnetron sputtering: A review of recent developments and applications. Vacuum 2000, 56, 159–172. [Google Scholar] [CrossRef]
- Spanu, D.; Bestetti, A.; Hildebrand, H.; Schmuki, P.; Altomare, M.; Recchia, S. Photocatalytic reduction and scavenging of Hg(II) over templated-dewetted Au on TiO2 nanotubes. Photochem. Photobiol. Sci. 2019, 18, 1046–1055. [Google Scholar] [CrossRef] [PubMed]
- Voevodin, A.A.; Donley, M.S.; Zabinski, J.S. Pulsed laser deposition of diamond-like carbon wear protective coatings: A review. Surf. Coat. Technol. 1997, 92, 42–49. [Google Scholar] [CrossRef]
- Lorenz, M.; Ramachandra Rao, M.S. 25 years of pulsed laser deposition. J. Phys. D Appl. Phys. 2014, 47, 030301. [Google Scholar] [CrossRef]
- Wenderich, K.; Mul, G. Methods, Mechanism, and Applications of Photodeposition in Photocatalysis: A Review. Chem. Rev. 2016, 116, 14587–14619. [Google Scholar] [CrossRef]
- Huang, L.; Liu, X.; Wu, H.; Wang, X.; Wu, H.; Li, R.; Shi, L.; Li, C. Surface state modulation for size-controllable photodeposition of noble metal nanoparticles on semiconductors. J. Mater. Chem. A 2020, 8, 21094–21102. [Google Scholar] [CrossRef]
- Mohanty, U.S. Electrodeposition: A versatile and inexpensive tool for the synthesis of nanoparticles, nanorods, nanowires, and nanoclusters of metals. J. Appl. Electrochem. 2011, 41, 257–270. [Google Scholar] [CrossRef]
- Quinn, B.M.; Dekker, C.; Lemay, S.G. Electrodeposition of Noble Metal Nanoparticles on Carbon Nanotubes. J. Am. Chem. Soc. 2005, 127, 6146–6147. [Google Scholar] [CrossRef]
- Fu, X.; Yu, H.; Peng, F.; Wang, H.; Qian, Y. Facile preparation of RuO2/CNT catalyst by a homogenous oxidation precipitation method and its catalytic performance. Appl. Catal. A Gen. 2007, 321, 190–197. [Google Scholar] [CrossRef]
- Spanu, D.; Dal Santo, V.; Malara, F.; Naldoni, A.; Turolla, A.; Antonelli, M.; Dossi, C.; Marelli, M.; Altomare, M.; Schmuki, P.; et al. Photoelectrocatalytic oxidation of As(III) over hematite photoanodes: A sensible indicator of the presence of highly reactive surface sites. Electrochim. Acta 2018, 292, 828–837. [Google Scholar] [CrossRef]
- Chávez, F.; Pérez-Sánchez, G.F.; Goiz, O.; Zaca-Morán, P.; Peña-Sierra, R.; Morales-Acevedo, A.; Felipe, C.; Soledad-Priego, M. Sensing performance of palladium-functionalized WO3 nanowires by a drop-casting method. Appl. Surf. Sci. 2013, 275, 28–35. [Google Scholar] [CrossRef]
- Torres-Rivero, K.; Torralba-Cadena, L.; Espriu-Gascon, A.; Casas, I.; Bastos-Arrieta, J.; Florido, A. Strategies for surface modification with ag-shaped nanoparticles: Electrocatalytic enhancement of screen-printed electrodes for the detection of heavy metals. Sensors 2019, 19, 4249. [Google Scholar] [CrossRef] [Green Version]
- Xie, F.; Baker, M.S.; Goldys, E.M. Homogeneous Silver-Coated Nanoparticle Substrates for Enhanced Fluorescence Detection. J. Phys. Chem. B 2006, 110, 23085–23091. [Google Scholar] [CrossRef]
- Cui, F.; Hua, Z.; Wei, C.; Li, J.; Gao, Z.; Shi, J. Highly dispersed Au nanoparticles incorporated mesoporous TiO2 thin films with ultrahigh Au content. J. Mater. Chem. 2009, 19, 7632. [Google Scholar] [CrossRef]
- Zhang, X.B.; Pei, Z.L.; Gong, J.; Sun, C. Investigation on the electrical properties and inhomogeneous distribution of ZnO:Al thin films prepared by dc magnetron sputtering at low deposition temperature. J. Appl. Phys. 2007, 101, 014910. [Google Scholar] [CrossRef]
- Czajkowski, K.M.; Świtlik, D.; Langhammer, C.; Antosiewicz, T.J. Effective Optical Properties of Inhomogeneously Distributed Nanoobjects in Strong Field Gradients of Nanoplasmonic Sensors. Plasmonics 2018, 13, 2423–2434. [Google Scholar] [CrossRef] [PubMed] [Green Version]
- Ianoul, A.; Bergeron, A. Spatially Inhomogeneous Enhancement of Fluorescence by a Monolayer of Silver Nanoparticles. Langmuir 2006, 22, 10217–10222. [Google Scholar] [CrossRef]
- Newbury, D.E.; Ritchie, N.W.M. Is Scanning Electron Microscopy/Energy Dispersive X-ray Spectrometry (SEM/EDS) Quantitative? Scanning 2013, 35, 141–168. [Google Scholar] [CrossRef]
- de Moura Souza, F.; Pollo Paniz, F.; Pedron, T.; Coelho dos Santos, M.; Lemos Batista, B. A high-throughput analytical tool for quantification of 15 metallic nanoparticles supported on carbon black. Heliyon 2019, 5, e01308. [Google Scholar] [CrossRef] [Green Version]
- Bland, G.D.; Lowry, G.V. Multistep Method to Extract Moderately Soluble Copper Oxide Nanoparticles from Soil for Quantification and Characterization. Anal. Chem. 2020, 92, 9620–9628. [Google Scholar] [CrossRef]
- Wajid, A. On the accuracy of the quartz-crystal microbalance (QCM) in thin-film depositions. Sens. Actuators A Phys. 1997, 63, 41–46. [Google Scholar] [CrossRef]
- Snook, G.A.; Chen, G.Z.; Fray, D.J.; Hughes, M.; Shaffer, M. Studies of deposition of and charge storage in polypyrrole–chloride and polypyrrole–carbon nanotube composites with an electrochemical quartz crystal microbalance. J. Electroanal. Chem. 2004, 568, 135–142. [Google Scholar] [CrossRef]
- Pozebon, D.; Scheffler, G.L.; Dressler, V.L. Recent applications of laser ablation inductively coupled plasma mass spectrometry (LA-ICP-MS) for biological sample analysis: A follow-up review. J. Anal. At. Spectrom. 2017, 32, 890–919. [Google Scholar] [CrossRef]
- Limbeck, A.; Galler, P.; Bonta, M.; Bauer, G.; Nischkauer, W.; Vanhaecke, F. Recent advances in quantitative LA-ICP-MS analysis: Challenges and solutions in the life sciences and environmental chemistry. Anal. Bioanal. Chem. 2015, 407, 6593–6617. [Google Scholar] [CrossRef] [Green Version]
- Binda, G.; Di Iorio, A.; Monticelli, D. The what, how, why, and when of dendrochemistry: (paleo)environmental information from the chemical analysis of tree rings. Sci. Total Environ. 2021, 758, 143672. [Google Scholar] [CrossRef]
- Chew, D.; Drost, K.; Marsh, J.H.; Petrus, J.A. LA-ICP-MS imaging in the geosciences and its applications to geochronology. Chem. Geol. 2021, 559, 119917. [Google Scholar] [CrossRef]
- Giussani, B.; Monticelli, D.; Rampazzi, L. Role of laser ablation–inductively coupled plasma–mass spectrometry in cultural heritage research: A review. Anal. Chim. Acta 2009, 635, 6–21. [Google Scholar] [CrossRef] [PubMed]
- Monticelli, D.; Civati, D.; Giussani, B.; Dossi, C.; Spanu, D.; Recchia, S. A viscous film sample chamber for Laser Ablation Inductively Coupled Plasma—Mass Spectrometry. Talanta 2018, 179, 100–106. [Google Scholar] [CrossRef]
- Asogan, D.; Sharp, B.L.; Connor, C.J.P.O.; Green, D.A.; Hutchinson, R.W. An open, non-contact cell for laser ablation-inductively coupled plasma-mass spectrometry. J. Anal. At. Spectrom. 2009, 24, 917. [Google Scholar] [CrossRef]
- Horak, F.; Nagl, A.; Föttinger, K.; Limbeck, A. Application of micro-dried droplets for quantitative analysis of particulate inorganic samples with LA-ICP-MS demonstrated on surface-modified nanoparticle TiO2 catalyst materials. Microchim. Acta 2020, 187, 641. [Google Scholar] [CrossRef]
- Benešová, I.; Dlabková, K.; Zelenák, F.; Vaculovič, T.; Kanický, V.; Preisler, J. Direct Analysis of Gold Nanoparticles from Dried Droplets Using Substrate-Assisted Laser Desorption Single Particle-ICPMS. Anal. Chem. 2016, 88, 2576–2582. [Google Scholar] [CrossRef]
- Wegner, K.; Piseri, P.; Tafreshi, H.V.; Milani, P. Cluster beam deposition: A tool for nanoscale science and technology. J. Phys. D Appl. Phys. 2006, 39, R439–R459. [Google Scholar] [CrossRef]
- Barborini, E.; Conti, A.M.; Kholmanov, I.; Piseri, P.; Podestà, A.; Milani, P.; Cepek, C.; Sakho, O.; Macovez, R.; Sancrotti, M. Nanostructured TiO2 Films with 2 eV Optical Gap. Adv. Mater. 2005, 17, 1842–1846. [Google Scholar] [CrossRef]
- Barborini, E.; Piseri, P.; Milani, P. A pulsed microplasma source of high intensity supersonic carbon cluster beams. J. Phys. D Appl. Phys. 1999, 32, L105–L109. [Google Scholar] [CrossRef]
- Dossi, C.; Binda, G.; Monticelli, D.; Pozzi, A.; Recchia, S.; Spanu, D. Exploiting Laser-Ablation ICP-MS for the Characterization of Salt-Derived Bismuth Films on Screen-Printed Electrodes: A Preliminary Investigation. Biosensors 2020, 10, 119. [Google Scholar] [CrossRef]
- Jochum, K.P.; Weis, U.; Stoll, B.; Kuzmin, D.; Yang, Q.; Raczek, I.; Jacob, D.E.; Stracke, A.; Birbaum, K.; Frick, D.A.; et al. Determination of Reference Values for NIST SRM 610-617 Glasses Following ISO Guidelines. Geostand. Geoanalytical Res. 2011, 35, 397–429. [Google Scholar] [CrossRef]
- Monticelli, D.; Castelletti, A.; Civati, D.; Recchia, S.; Dossi, C. How to Efficiently Produce Ultrapure Acids. Int. J. Anal. Chem. 2019, 2019, 1–5. [Google Scholar] [CrossRef] [PubMed]
- Spanu, D.; Butti, L.; Boldrocchi, G.; Bettinetti, R.; Monticelli, D. High-throughput, Multi-batch System for the Efficient Microwave Digestion of Biological Samples. Anal. Sci. 2020, 36, 889–892. [Google Scholar] [CrossRef] [PubMed] [Green Version]
- Boldrocchi, G.; Monticelli, D.; Mazzoni, M.; Spanu, D.; Bettinetti, R. Accumulation of Selected Trace Elements in Shads from Three Lakes: First Insights from Italian Pre-Alpine Area. Biol. Trace Elem. Res. 2021. [Google Scholar] [CrossRef]
- Recchia, S.; Spanu, D.; Bianchi, D.; Dossi, C.; Pozzi, A.; Monticelli, D. Understanding microwave vessel contamination by chloride species. Talanta 2016, 159. [Google Scholar] [CrossRef] [PubMed]
- Fahmy, H.M.; Salah Eldin, R.E.; Abu Serea, E.S.; Gomaa, N.M.; AboElmagd, G.M.; Salem, S.A.; Elsayed, Z.A.; Edrees, A.; Shams-Eldin, E.; Shalan, A.E. Advances in nanotechnology and antibacterial properties of biodegradable food packaging materials. RSC Adv. 2020, 10, 20467–20484. [Google Scholar] [CrossRef]
- Cruz, M.C.; Ruano, G.; Wolf, M.; Hecker, D.; Castro Vidaurre, E.; Schmittgens, R.; Rajal, V.B. Plasma deposition of silver nanoparticles on ultrafiltration membranes: Antibacterial and anti-biofouling properties. Chem. Eng. Res. Des. 2015, 94, 524–537. [Google Scholar] [CrossRef] [Green Version]
- Gupta, S.; Uhlmann, P.; Agrawal, M.; Chapuis, S.; Oertel, U.; Stamm, M. Immobilization of Silver Nanoparticles on Responsive Polymer Brushes. Macromolecules 2008, 41, 2874–2879. [Google Scholar] [CrossRef]
- Niu, B.; Hua, T.; Xu, B. Robust Deposition of Silver Nanoparticles on Paper Assisted by Polydopamine for Green and Flexible Electrodes. ACS Sustain. Chem. Eng. 2020, 8, 12842–12851. [Google Scholar] [CrossRef]
- Albiter, E.; Valenzuela, M.A.; Alfaro, S.; Valverde-Aguilar, G.; Martínez-Pallares, F.M. Photocatalytic deposition of Ag nanoparticles on TiO2: Metal precursor effect on the structural and photoactivity properties. J. Saudi Chem. Soc. 2015, 19, 563–573. [Google Scholar] [CrossRef] [Green Version]
- Pagliaro, M.; Della Pina, C.; Mauriello, F.; Ciriminna, R. Catalysis with Silver: From Complexes and Nanoparticles to MORALs and Single-Atom Catalysts. Catalysts 2020, 10, 1343. [Google Scholar] [CrossRef]
- Pulit-Prociak, J.; Banach, M. Silver nanoparticles—A material of the future…? Open Chem. 2016, 14, 76–91. [Google Scholar] [CrossRef]
- Lin, J.; Liu, Y.; Yang, Y.; Hu, Z. Calibration and correction of LA-ICP-MS and LA-MC-ICP-MS analyses for element contents and isotopic ratios. Solid Earth Sci. 2016, 1, 5–27. [Google Scholar] [CrossRef] [Green Version]
- Liu, Y.; Hu, Z.; Gao, S.; Günther, D.; Xu, J.; Gao, C.; Chen, H. In situ analysis of major and trace elements of anhydrous minerals by LA-ICP-MS without applying an internal standard. Chem. Geol. 2008, 257, 34–43. [Google Scholar] [CrossRef]
- Liu, Y.; Hu, Z.; Li, M.; Gao, S. Applications of LA-ICP-MS in the elemental analyses of geological samples. Chin. Sci. Bull. 2013, 58, 3863–3878. [Google Scholar] [CrossRef] [Green Version]


| Laser Parameters | |
|---|---|
| Laser frequency (Hz) | 2 |
| Spot diameter (μm) | 5 (round-shaped) |
| Laser fluence (J/cm2) | 1.35 |
| Dwell time for each spot (s) | 10 |
| Delay spot-by-spot (s) | 5 |
| Helium flux (L/min) | 0.85 |
| ICP–MS Parameters | |
| RF power (kW) | 1.55 |
| Auxiliary gas flux (L/min) | 0.8 |
| Cooling gas flux (L/min) | 14 |
| Makeup gas flux (L/min) | 0.9 |
| Dwell time (ms) | 10 |
| m/z channel | 107Ag |
| Sample | Volume Integral of Interpolated Surface (cts) | Volume Integral Difference (cts) | Extracted Ag Mass (μg) |
|---|---|---|---|
| 10 s as-deposited | 1.91 × 10¹¹ | 0 | 0 |
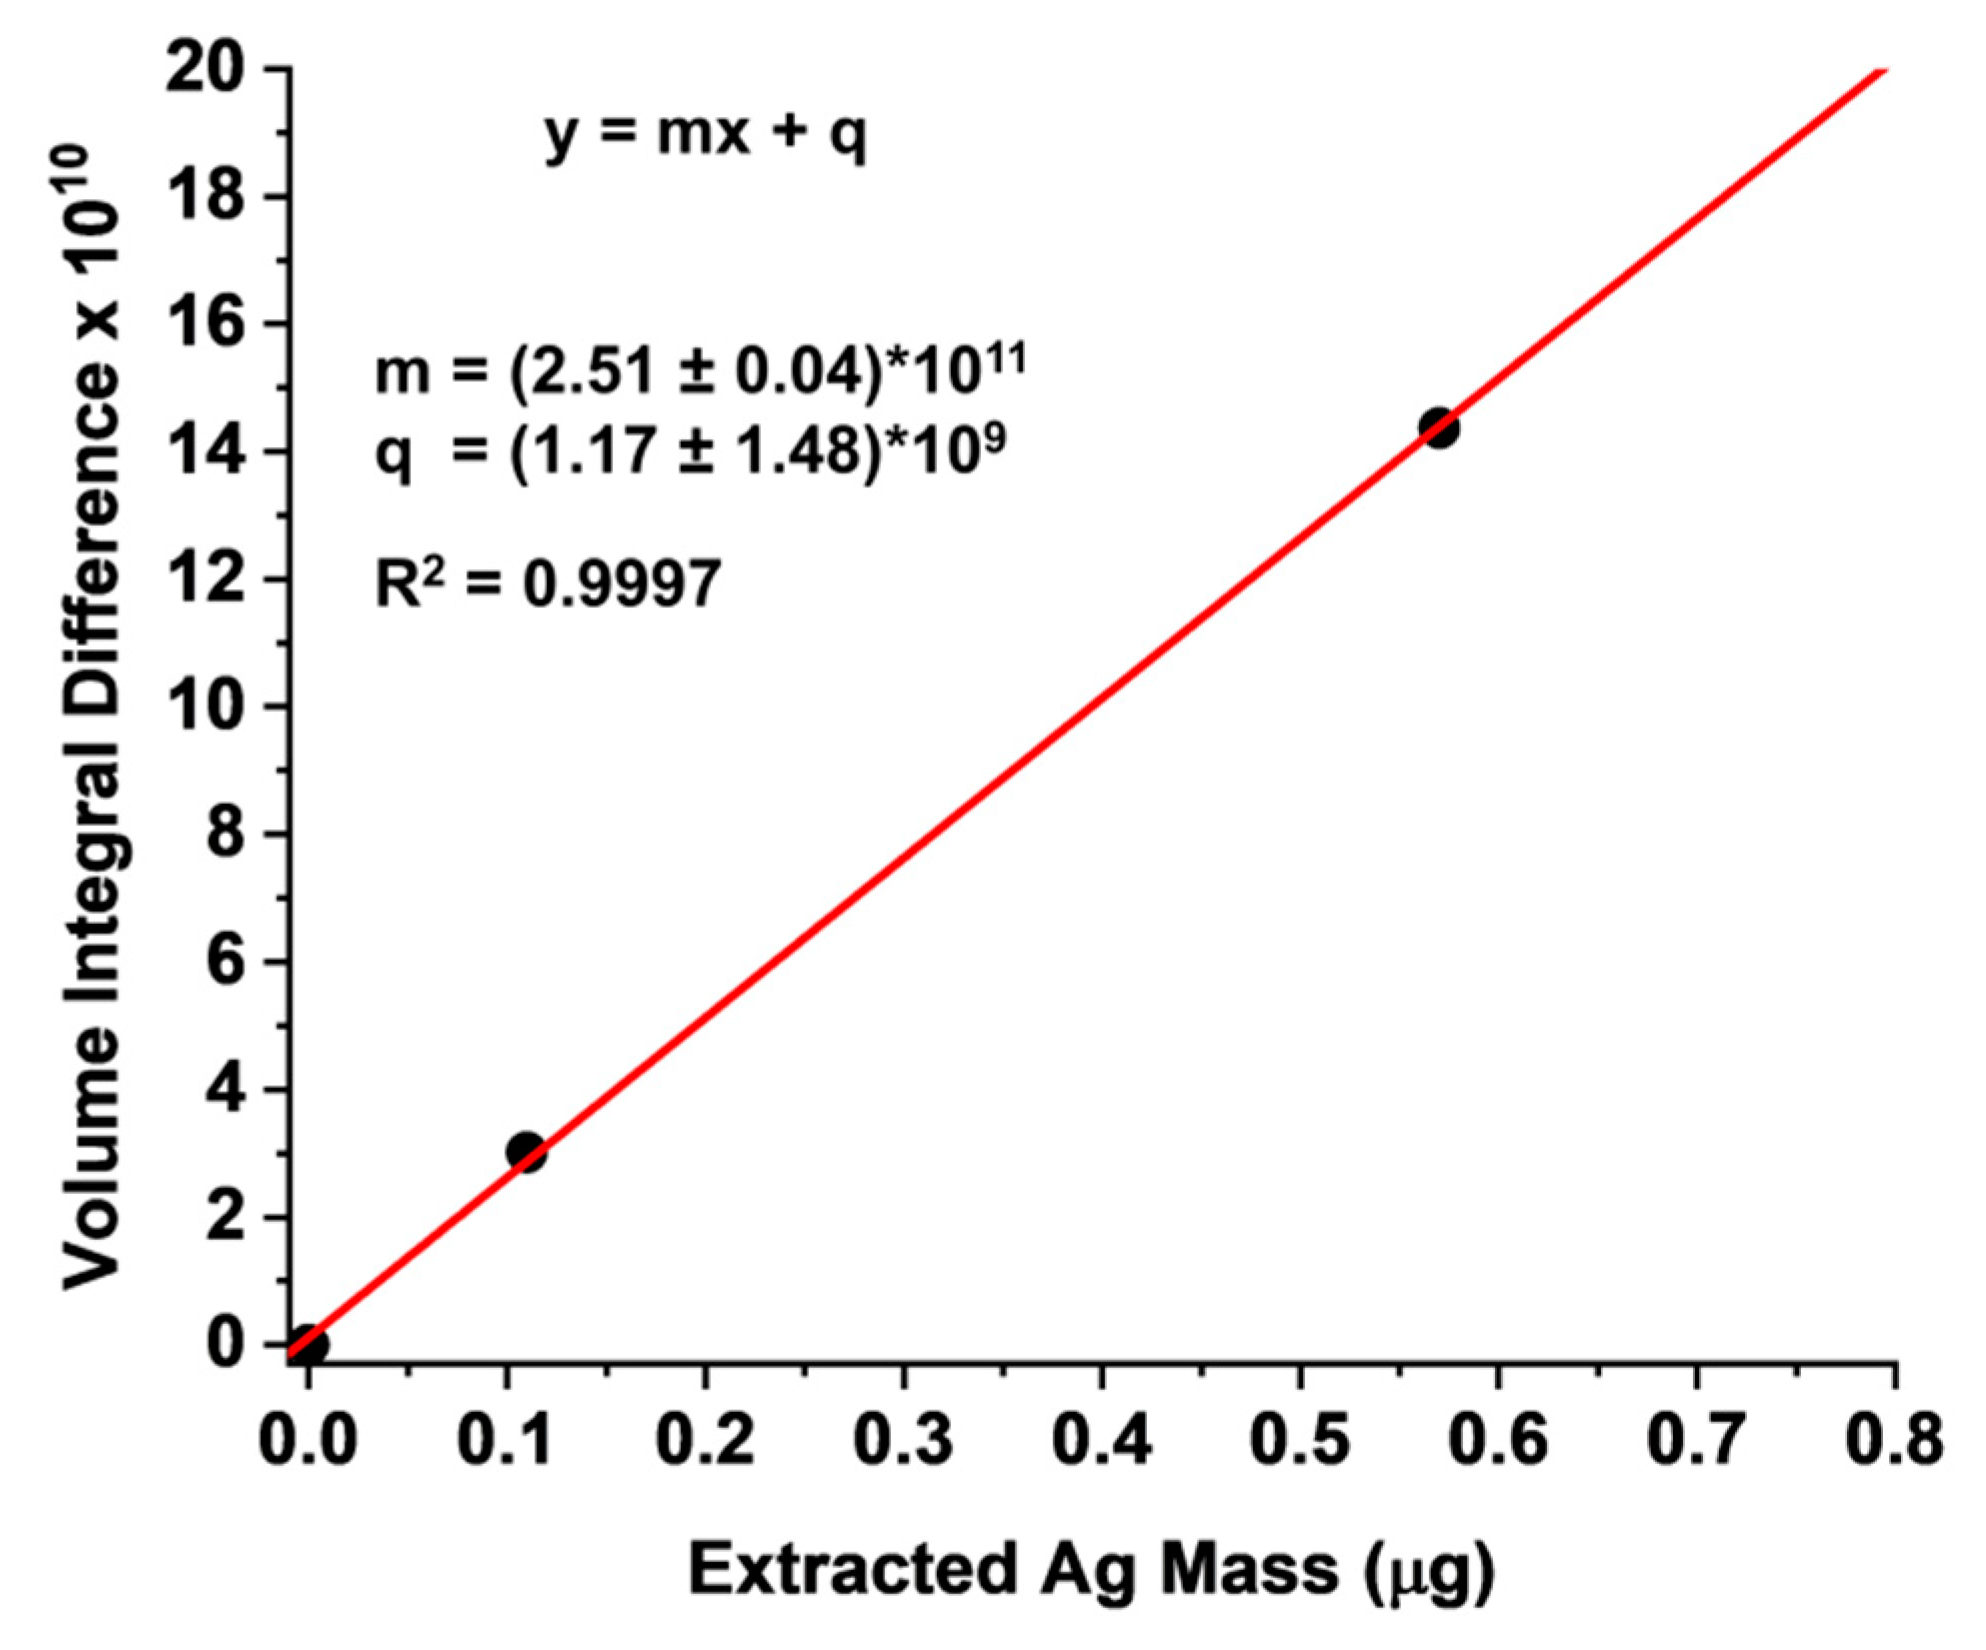
| 10 s extr.#1 | 4.74 × 10¹⁰ | 1.43 × 10¹¹ | 0.57 ± 0.010 |
| 10 s extr.#2 | 1.73 × 10¹⁰ | 3.02 × 10¹⁰ | 0.11 ± 0.004 |
| Sample | Volume Integral of Interpolated Surface (cts) | Calculated Ag Mass (μg) |
|---|---|---|
| 5s as-deposited | 1.01 × 10¹¹ | 0.40 |
| 5s incorporated | 9.40 × 10¹⁰ | 0.37 |
| Sample | Number of Ablated Spots | Required Analysis Time (min) | Volume Integral of Interpolated Surface (cts) | Calculated Ag Mass (μg) |
|---|---|---|---|---|
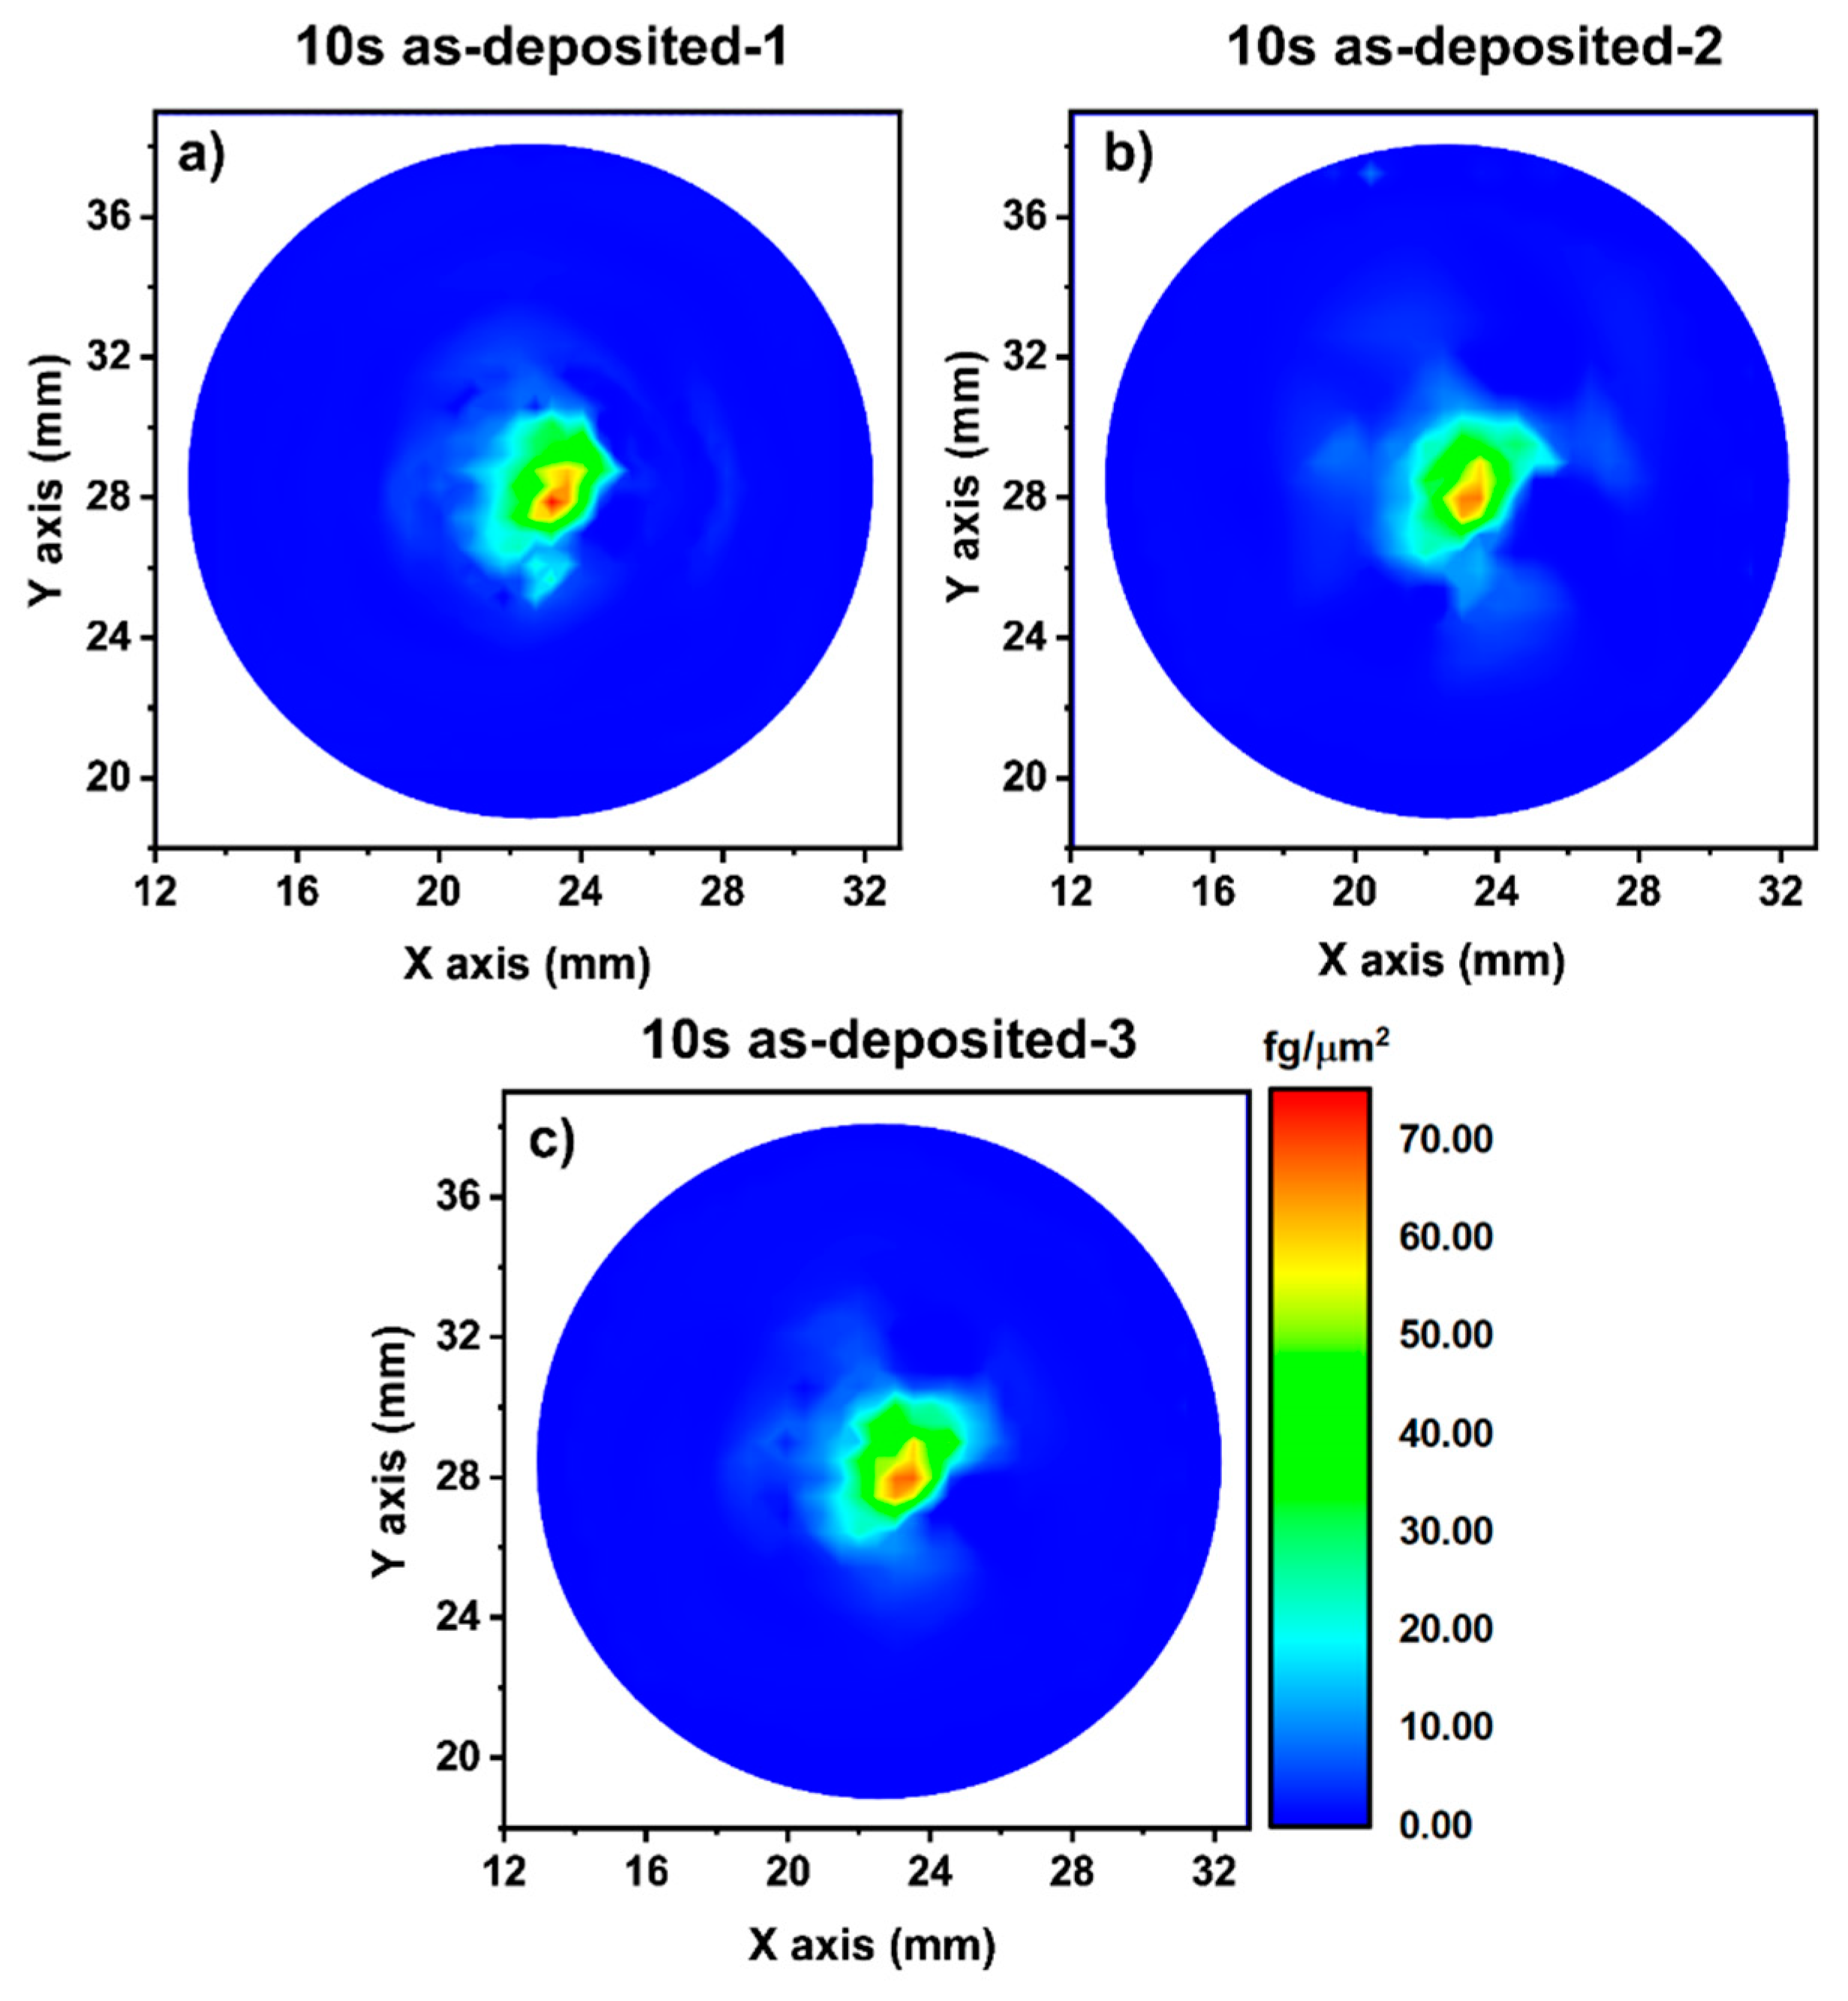
| 10 s as-deposited-1 | 381 | ~100 | 1.91 × 10¹¹ | 0.76 |
| 10 s as-deposited-2 | 190 | ~50 | 1.87 × 10¹¹ | 0.75 |
| 10 s as-deposited-3 | 95 | ~25 | 1.91 × 10¹¹ | 0.76 |
Publisher’s Note: MDPI stays neutral with regard to jurisdictional claims in published maps and institutional affiliations. |
© 2021 by the authors. Licensee MDPI, Basel, Switzerland. This article is an open access article distributed under the terms and conditions of the Creative Commons Attribution (CC BY) license (https://creativecommons.org/licenses/by/4.0/).
Share and Cite
Spanu, D.; Binda, G.; Marelli, M.; Rampazzi, L.; Recchia, S.; Monticelli, D. Quantitative Determination of the Surface Distribution of Supported Metal Nanoparticles: A Laser Ablation–ICP–MS Based Approach. Chemosensors 2021, 9, 77. https://0-doi-org.brum.beds.ac.uk/10.3390/chemosensors9040077
Spanu D, Binda G, Marelli M, Rampazzi L, Recchia S, Monticelli D. Quantitative Determination of the Surface Distribution of Supported Metal Nanoparticles: A Laser Ablation–ICP–MS Based Approach. Chemosensors. 2021; 9(4):77. https://0-doi-org.brum.beds.ac.uk/10.3390/chemosensors9040077
Chicago/Turabian StyleSpanu, Davide, Gilberto Binda, Marcello Marelli, Laura Rampazzi, Sandro Recchia, and Damiano Monticelli. 2021. "Quantitative Determination of the Surface Distribution of Supported Metal Nanoparticles: A Laser Ablation–ICP–MS Based Approach" Chemosensors 9, no. 4: 77. https://0-doi-org.brum.beds.ac.uk/10.3390/chemosensors9040077