Article

Efficient Oxidase Biosensors Based on Bioelectrocatalytic Surfaces of Electrodeposited Ferrocenyl Polycyclosiloxanes—Pt Nanoparticles

by
Alvaro Boluda
1,
Carmen M. Casado
2,
Beatriz Alonso
2 and
M. Pilar García Armada
1,*
1
Department of Industrial Chemical Engineering, Escuela Técnica Superior de Ingenieros Industriales, Universidad Politécnica de Madrid, José Gutierrez Abascal, 2, 28006 Madrid, Spain
2
Department of Inorganic Chemistry, Universidad Autónoma de Madrid, Cantoblanco, 28049 Madrid, Spain
*
Author to whom correspondence should be addressed.
Submission received: 9 March 2021 / Revised: 5 April 2021 / Accepted: 10 April 2021 / Published: 15 April 2021

Abstract

:
The in-situ synthesis of catalytic surfaces with metallic nanoparticles must overcome the issues related to particle aggregation and polydispersity in the particle size. This work achieves it by using two electrodeposited ferrocenyl polycyclosiloxane polymers (MFPP and FPP) as templates for electro-synthesize Pt nanoparticles (PtNPS). In addition, this new electrode surface combines two efficient electrocatalysts: Ferrocene and Pt nanoparticles, with synergistic biocatalytic properties that constitute an electrocatalytic framework for the covalent immobilization of xanthine oxidase. In this work, we present the results of the kinetic, electrochemical and analytical studies of the prepared electrodes. These results showed that the PtNPs/FPP system is the best bioelectrocatalytic surface and improves other more complex xanthine oxidase devices based on the hydrogen peroxide oxidation, allowing the use of lower measuring potential with good sensitivity, wider linear ranges and low detection limits. In addition, this electrode provides the novelty of allowing the measurement of xanthine through the enzymatic consumption of oxygen at potential −0.1 V with a sensitivity of 1.10 A M−1 cm−2, linear ranges of 0.01–0.1 and 0.1–1.4 mM, low detection limit (48 nM) and long-term stability. The new device has been successfully applied to the determination of xanthine in fish meat.

1. Introduction

The purine derivative, Xanthine (3,7-dihydropurine-2,6-dione), is produced during the degradation of adenosine triphosphate (ATP). This degradation can be caused by microbial growth in animal tissue following the pathway: ATP > adenosine diphosphate > adenosine monophosphate > inosine monophosphate > inosine > hipoxanthine > xanthine > uric acid [1,2]. Hipoxanthine (HX) and xanthine (X), as precursors of uric acid, are early indicators of an abnormal purine degradation and serve as markers of various human diseases such as gout, xanthinuria, hyperuricemia, and tumorhyperthermia [1].
On the other hand, regarding to the food industry, fish meat easily degrades during storage due to its high nutrient content, and one of the most important reasons affecting its freshness is the formation of nucleotides and nucleoside metabolites from the degradation of ATP. The freshness assessment traditionally follows two ways: The organoleptic control by experts or the chemical determination by a target biomarker [3]. Instant trimethyl amine, volatile amine, histamine and H2S have been proposed as fish freshness indicators [4], although HX and X are interesting biomarkers because after the death of a fish, adenosine triphosphate (ATP) gets degraded into xanthine, and its concentration increases during storage with time. Therefore, the presence of X in fish meat or their derived products is effective for the estimation of its freshness level.
Up to date, there exist several analytical methods and assays, even some of them commercially available, for HX and X detection in biological samples. These methods include several chromatographic methods, mass spectrometry, capillary electrophoresis and spectrophotometric methods [3,5,6,7]. These methods offer high selectivity and low detection limits, but they need highly expensive equipment, long assay-times and qualified human resources. For this reason, researchers continue working on new faster, cheaper, easy to use, selective and sensitive sensor approaches. For in the situ fish and seafood analysis, the electrochemical biosensors are the most used analytical devices due to their high selectivity and sensitivity, low cost, and portability [8]. The biorecognition element used in the majority of these electrochemical biosensors is the enzyme xanthine oxidase (XO, EC 1.17.3.2). XO is a complex oxidoreductase enzyme with two completely symmetrical structural units, which are composed of one molybdo-pterin (MO-Pt) cofactor, one flavin adenine dinucleotide cofactor (FAD) and two distinct iron-sulphur centres (2Fe-2S) [9]. In the HX or X oxidation, the Mo atom undergoes reduction process from Mo6+ to Mo4+ and the oxygen, coordinated with Mo, is transferred to HX and X to finally form uric acid [10] (Scheme 1). In aerobic conditions, the dissolved molecular O2 regenerates the molybdenum centre forming hydrogen peroxide. Hydrogen peroxide and/or uric acid, both generated in the enzymatic reaction, are the most used for the indirect determination of X or HX with XO biosensors, generally at anodic potentials. The cathodic zone is less used since, in most cases, the reduction of hydrogen peroxide occurs at the same potential as that of the oxygen present. However, in cases where this does not happen and it is possible to separate both reactions, the reduction of hydrogen peroxide, or the measurement of the decrease in oxygen by enzymatic consumption, can be very useful to avoid interferences from other components of the sample.
As XO catalyses both reactions, all the XO biosensors, based on the uric acid as well as hydrogen peroxide or oxygen consumption measurements, offer the total concentration of hypoxanthine and xanthine present in the samples [11,12]. In samples were both intermediates coexist, this fact constitutes a demerit of electrochemical biosensors versus the chromatographic techniques. However, the majority of reported XO electrochemical devices leave out this question and present their devices as X or HX biosensors [5,13] depending on the analyte used to characterize it. Actually, the usefulness of the HX + X total concentration was successfully validated as food aging index years ago, and the relationship between changes in HX + X contents and the aging degradation is clearly demonstrated [11,12,14].
In relation with the biosensor design, the main stage in the preparation of sensitive and stable XO electrochemical biosensors is the selection of the best enzyme support. The valuable features are a large specific surface area, chemical stability, good mechanical performance, biocompatibility, and the best electrical and/or electrocatalytic properties. Some of the reported enzyme supports include polymerized conducting polymer film [10], although, the design of ultra-sensitive electrochemical biosensors has been drastically benefited by the inclusion of nanomaterials. Nanomaterials as graphene, carbon nanotubes or metallic nanoparticles, with size-dependent properties, provide large specific surfaces with tuneable structures, sizes, and surface chemistry. In addition, they also possess biocompatibility, catalytic activity and synergistic effect with other electrode components that enhance the analytical performance and the electrical conductivity of the electrochemical biosensors. Some recent examples of nanomaterials used for XO biosensors are multi-walled carbon nanotubes (MWCNT) [12], copper-based metal organic framework nanofibers [11], zinc oxide [4], nanocomposites as Pd, Pt, or Au in reduced expanded graphene oxide [1], Au-MWCNT [15], and Au-MWCNT-PEDOT [2], silver-doped zinc oxide nanoparticles [16], or reduced graphene oxide-carboxymethylcellulose- Pt nanoparticles/PAMAM dendrimer/magnetic nanoparticles hybrids [8].
Another important item in the electrochemical biosensors’ design is the choice of the best enzyme immobilization technique. In order to immobilize XO onto the electrode surface, different approaches, with several advantages and disadvantages, have been used [13]. The physical absorption method, through van der Waals forces or electrostatic interactions, causes no damage to enzyme, but the leakage of enzyme occurs and these biosensors exhibit poor storage stability and sensitivity to changes in the solution sample properties as pH or ionic strength, although show short response time. The entrapment in sol–gel, polymer matrices or membranes is also a simple immobilization method with extended linear dynamic ranges that does not cause damage to enzyme, but these devices show low reproducibility and low sensitivity due to the diffusion barriers restrictions. The covalent binding is the most widely used immobilization procedure because of its advantages of stability, inexistence of diffusion barriers, no enzyme leakage and short response time. This category includes three-dimensional crosslinking with formation of covalent bonds through bifunctional reagents as glutaraldehyde. Crosslinking is the best method to stabilize previously adsorbed XO and prevents its leakage. Its only disadvantages are the possible risks of blocking the enzyme’s active site, avoided by co-crosslinking with bovine serum albumin (BSA), or the substrate diffusion limitation in the crosslinked enzyme layer.
For several decades, our research group has worked in the design, synthesis and biosensing applications of ferrocenyl dendrimers and polymers with several frameworks [17]. Ferrocenyl functionalization is particularly interesting because of its ability to modify electrodes, due to the solubility change associated to the ferrocene oxidation [17]. All the electrode surfaces prepared with these ferrocenyl macromolecules demonstrated to be excellent electro- or bioelectrocatalysts as well as enzyme supports, to develop biosensors of first, second and third generations [18,19,20]. In the last years, we have developed several composite electrode materials based on ferrocenyl dendrimers and polymers with metallic nanoparticles, with improved properties as enzyme supports and bioelectrocatalyst [20,21,22]. The Pt surfaces are not good catalysts of hydrogen peroxide; however, ferrocene compounds have proven to be excellent catalysts for these reactions, as mentioned in the introduction section. Why then use Pt? In all our work in which we have combined various ferrocenyl polymers with gold or platinum nanoparticles, we have demonstrated that a synergistic effect significantly increases the effectiveness of the composite in comparison with its individual elements (including the metallic NPs). So far, and due to this poor catalytic effect of platinum in comparison with the gold nanoparticles, we have used Pt coatings as basis for the electrodeposition of ferrocenyl macromolecules. In this work, for the first time, we are going to use the polymer ferrocenyl as a platform or template for the formation of PtNPs with the intention of studying how the synergy ferrocene-Pt improves the catalysis of hydrogen peroxide and the efficiency of oxidase biosensors.
In this work, we study the kinetic advantages of electrodes modified with films of two ferrocenyl (FPP) and permethylferrocenyl (MFPP) polymers containing cyclic siloxanes as framework (Scheme 2) [23,24] and their use as templates to form a new nanocomposite with electrodeposited Pt nanoparticles (PtNPs). These polymers were used earlier as efficient mediators for aerobic and anaerobic glucose electrochemical biosensors in both, anodic and cathodic operation modes, and as template to in situ synthesize gold nanoparticles to covalent immobilization and direct electrochemistry of horseradish peroxidase (HRP) [20,25]. Now, in order to design the new X biosensor, we search for synergistic catalytic effects to determine the hydrogen peroxide produced in the enzymatic reactions or the oxygen consumption in the enzymatic oxidation of X. We chose Pt based on our expertise in the excellent properties of ferrocenyl compounds-Pt surfaces as catalyst of the hydrogen peroxide oxidation and the oxygen reduction [18,21].
In this article, we propose a simple strategy for the development of an efficient XO amperometric biosensor, based on electrodeposited ferrocenyl polycyclotetrasiloxane polymers. These films are used as templates for the in situ electrodeposition of PtNPs, and finally, XO is immobilized by cross-linking on these surfaces. The work includes the detailed description of the morphology and the study of the electrochemical behaviour, kinetics and analytical characteristics of the modified electrodes. We demonstrate that the synergistic effect of PtNPs—polyferrocenyl polycyclosiloxane polymer greatly improves the kinetics and the sensitivity of the new XO/PtNPs/FPP biosensor.

2. Materials and Methods

2.1. Materials

The polymers were synthesized according to earlier described procedure [23,24], by hydrosilylation of 1,1′-divinylferrocene, or 1,1′-divinyl(octamethyl)ferrocene, with 1,3,5,7-tetramethylcyclotetrasiloxane. Xanthine oxidase microbial (XO, 10 units mg−1), xanthine, bovine serum albumin (BSA), glutaraldehyde (25 wt % solution in water) and K2PtCl6·H2O (≥99.9%) were purchased from Merck-Sigma-Aldrich Spain (Merck Life Science S.L.U. María de Molina 40 −2° floor 28006 Madrid, Spain). The normalization of hydrogen peroxide solutions was carried out by the permanganate titration method. Ultrapure water was used to prepare all the solutions. The solutions used in the electrode modifications and in the hydrogen peroxide measurement were deoxygenated by bubbling high-purity nitrogen. High-purity oxygen was used to saturate the solutions in the aerobic measurements.

2.2. Instruments

Ecochemie BV Autolab PGSTAT 12 was used for the electrochemical measurements, equipped with a conventional three-electrode cell with a Pt disk (∅ 3 mm) as working electrode, an auxiliary electrode (Pt wire), and two types of reference electrodes for organic (BAS non-aqueous Ag/ClAg RE) or aqueous media (saturated Calomel RE, SCE). The steady-state measurements were performed with an Autolab rotating-disc electrode. The scanning electron microscope images were obtained with an UHR Philips XL30S FEG. Finally, the electrochemical impedance spectroscopy (EIS) experimental conditions were: 0.2 V, 0.1–10,000 Hz frecuency range, and AC perturbation of 10 mV in a 10 mM K3Fe(CN)6/K4Fe(CN)6 (1:1)/0.1 M KCl solution.

2.3. Preparation of Modified Electrodes

The Pt disk electrodes, previously polished with 0.1 μm alumina powder and washed in an ultrasonic bath, were cycled in 0.5 M H2SO4 until a stationary cyclic voltammogram was achieved. Next, the polymer films were deposited at 1.0 V (vs. Ag/Ag+) on the dry Pt electrodes, from solutions composed by approx. 0.3 mM Fc and 0.1 M tetra-n-butylammonium hexafluorophosphate (TBAH) in dichloromethane. Finally, the modified electrodes were rinsed with dichloromethane and dried at room temperature. The surface coverages (Γ) were estimated from the electroactive ferrocenyl sites in the films by integrating the charge of the cyclic voltammetric waves, as the sum of both the oxidized and reduced form of the bound ferrocenyl moieties at any potential.
For the electrodeposition of PtNPs, the polymer-modified electrodes were dipped in a deaerated 2 mM K2PtCl6·H2O in 0.5 M HCl solution, and the best results were obtained at −0.2 V vs SCE applied potential during 15 min. After the modification, the electrodes were washed with phosphate buffer and deionized water.
The more efficient XO immobilization was implemented by dropping, on the top of modified electrodes, 5 μL of a 0.01 M phosphate buffer (pH 7.0) solution containing XO 40 Units mL−1 and BSA 80 μg mL−1 and it was kept under glutaraldehyde vapours for 20 min. Next, the electrode was allowed to dry in air at room temperature. Finally, the dried biosensors were rinsed thoroughly with the phosphate buffer and stored in dry at 4 °C when not in use.

2.4. Preparation of Fish Samples

Salmon and hake fishes were purchased from a local market and cut in several pieces to be stored at 4 °C in an airtight container for 1, 5, and 11 day-period. After these periods, samples of 10.0 g of each fish sample were mixed with distilled water, ground, filtered, and diluted to 50 mL in a volumetric flask. The electrochemical samples were prepared transferring 0.6 mL of the corresponding extract into the electrochemical cell containing 10 mL of phosphate buffer 0.01 M pH 7.4/NaClO4 0.1 M solution.

3. Results and Discussion

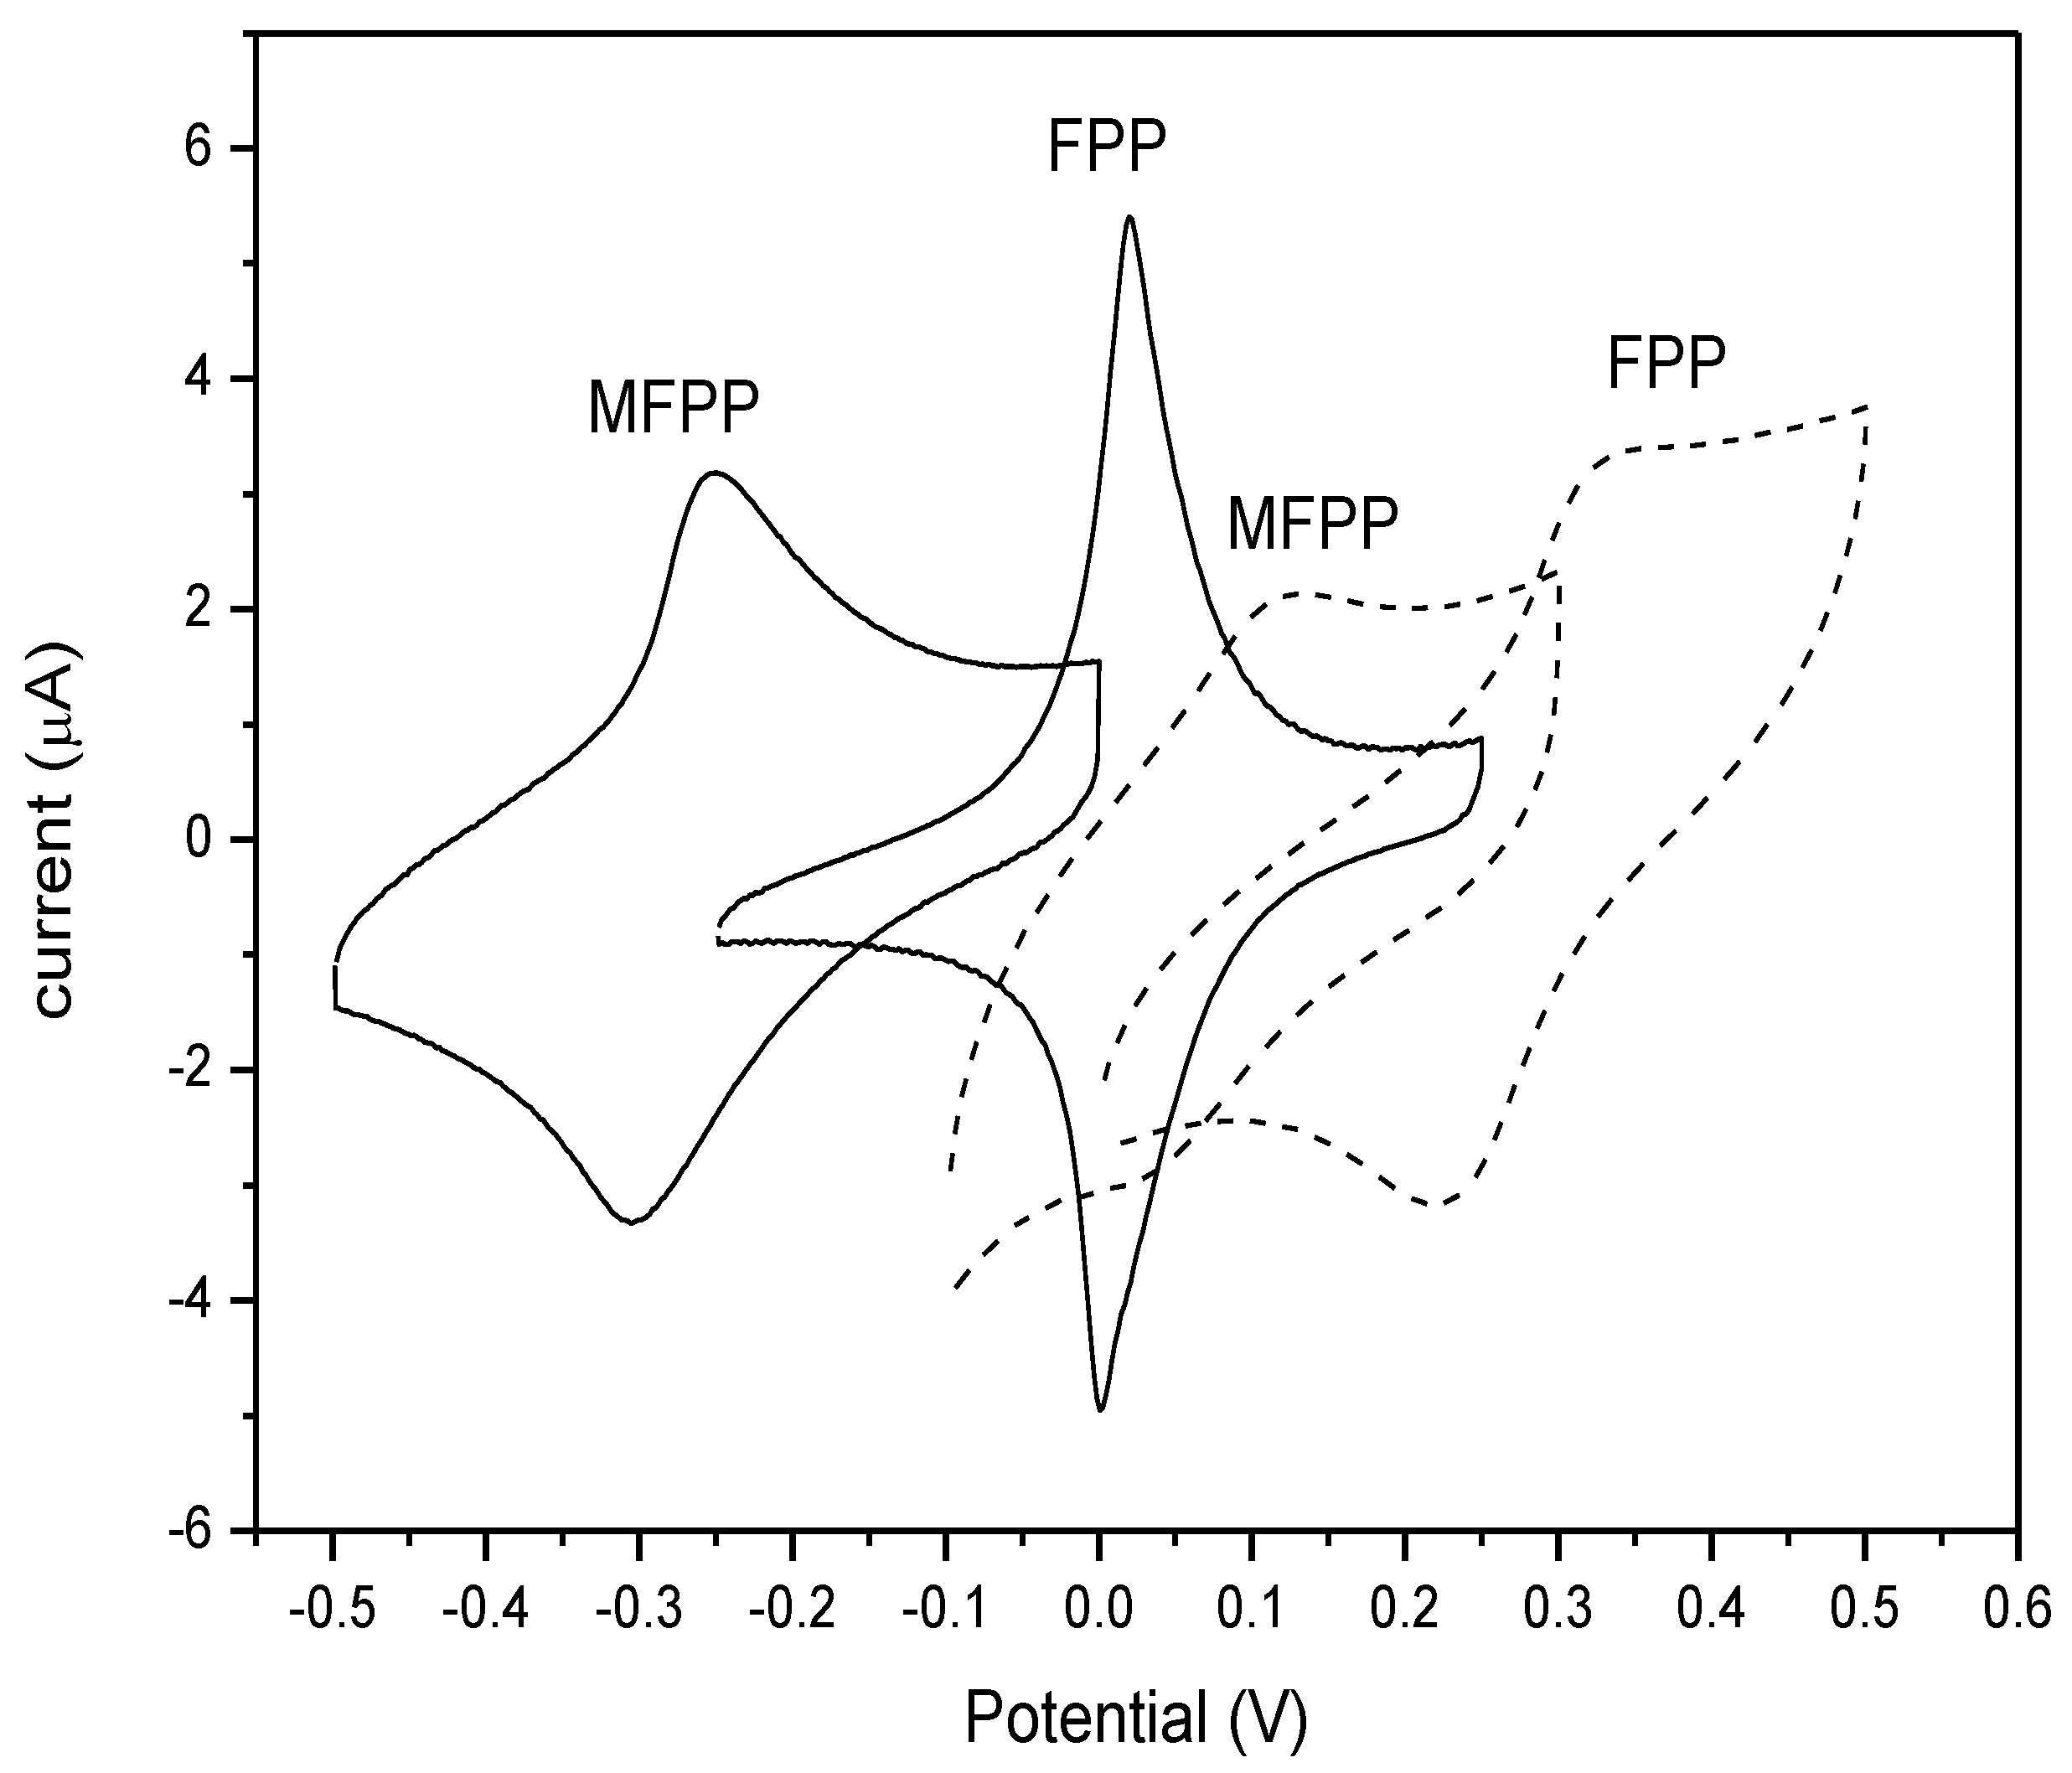
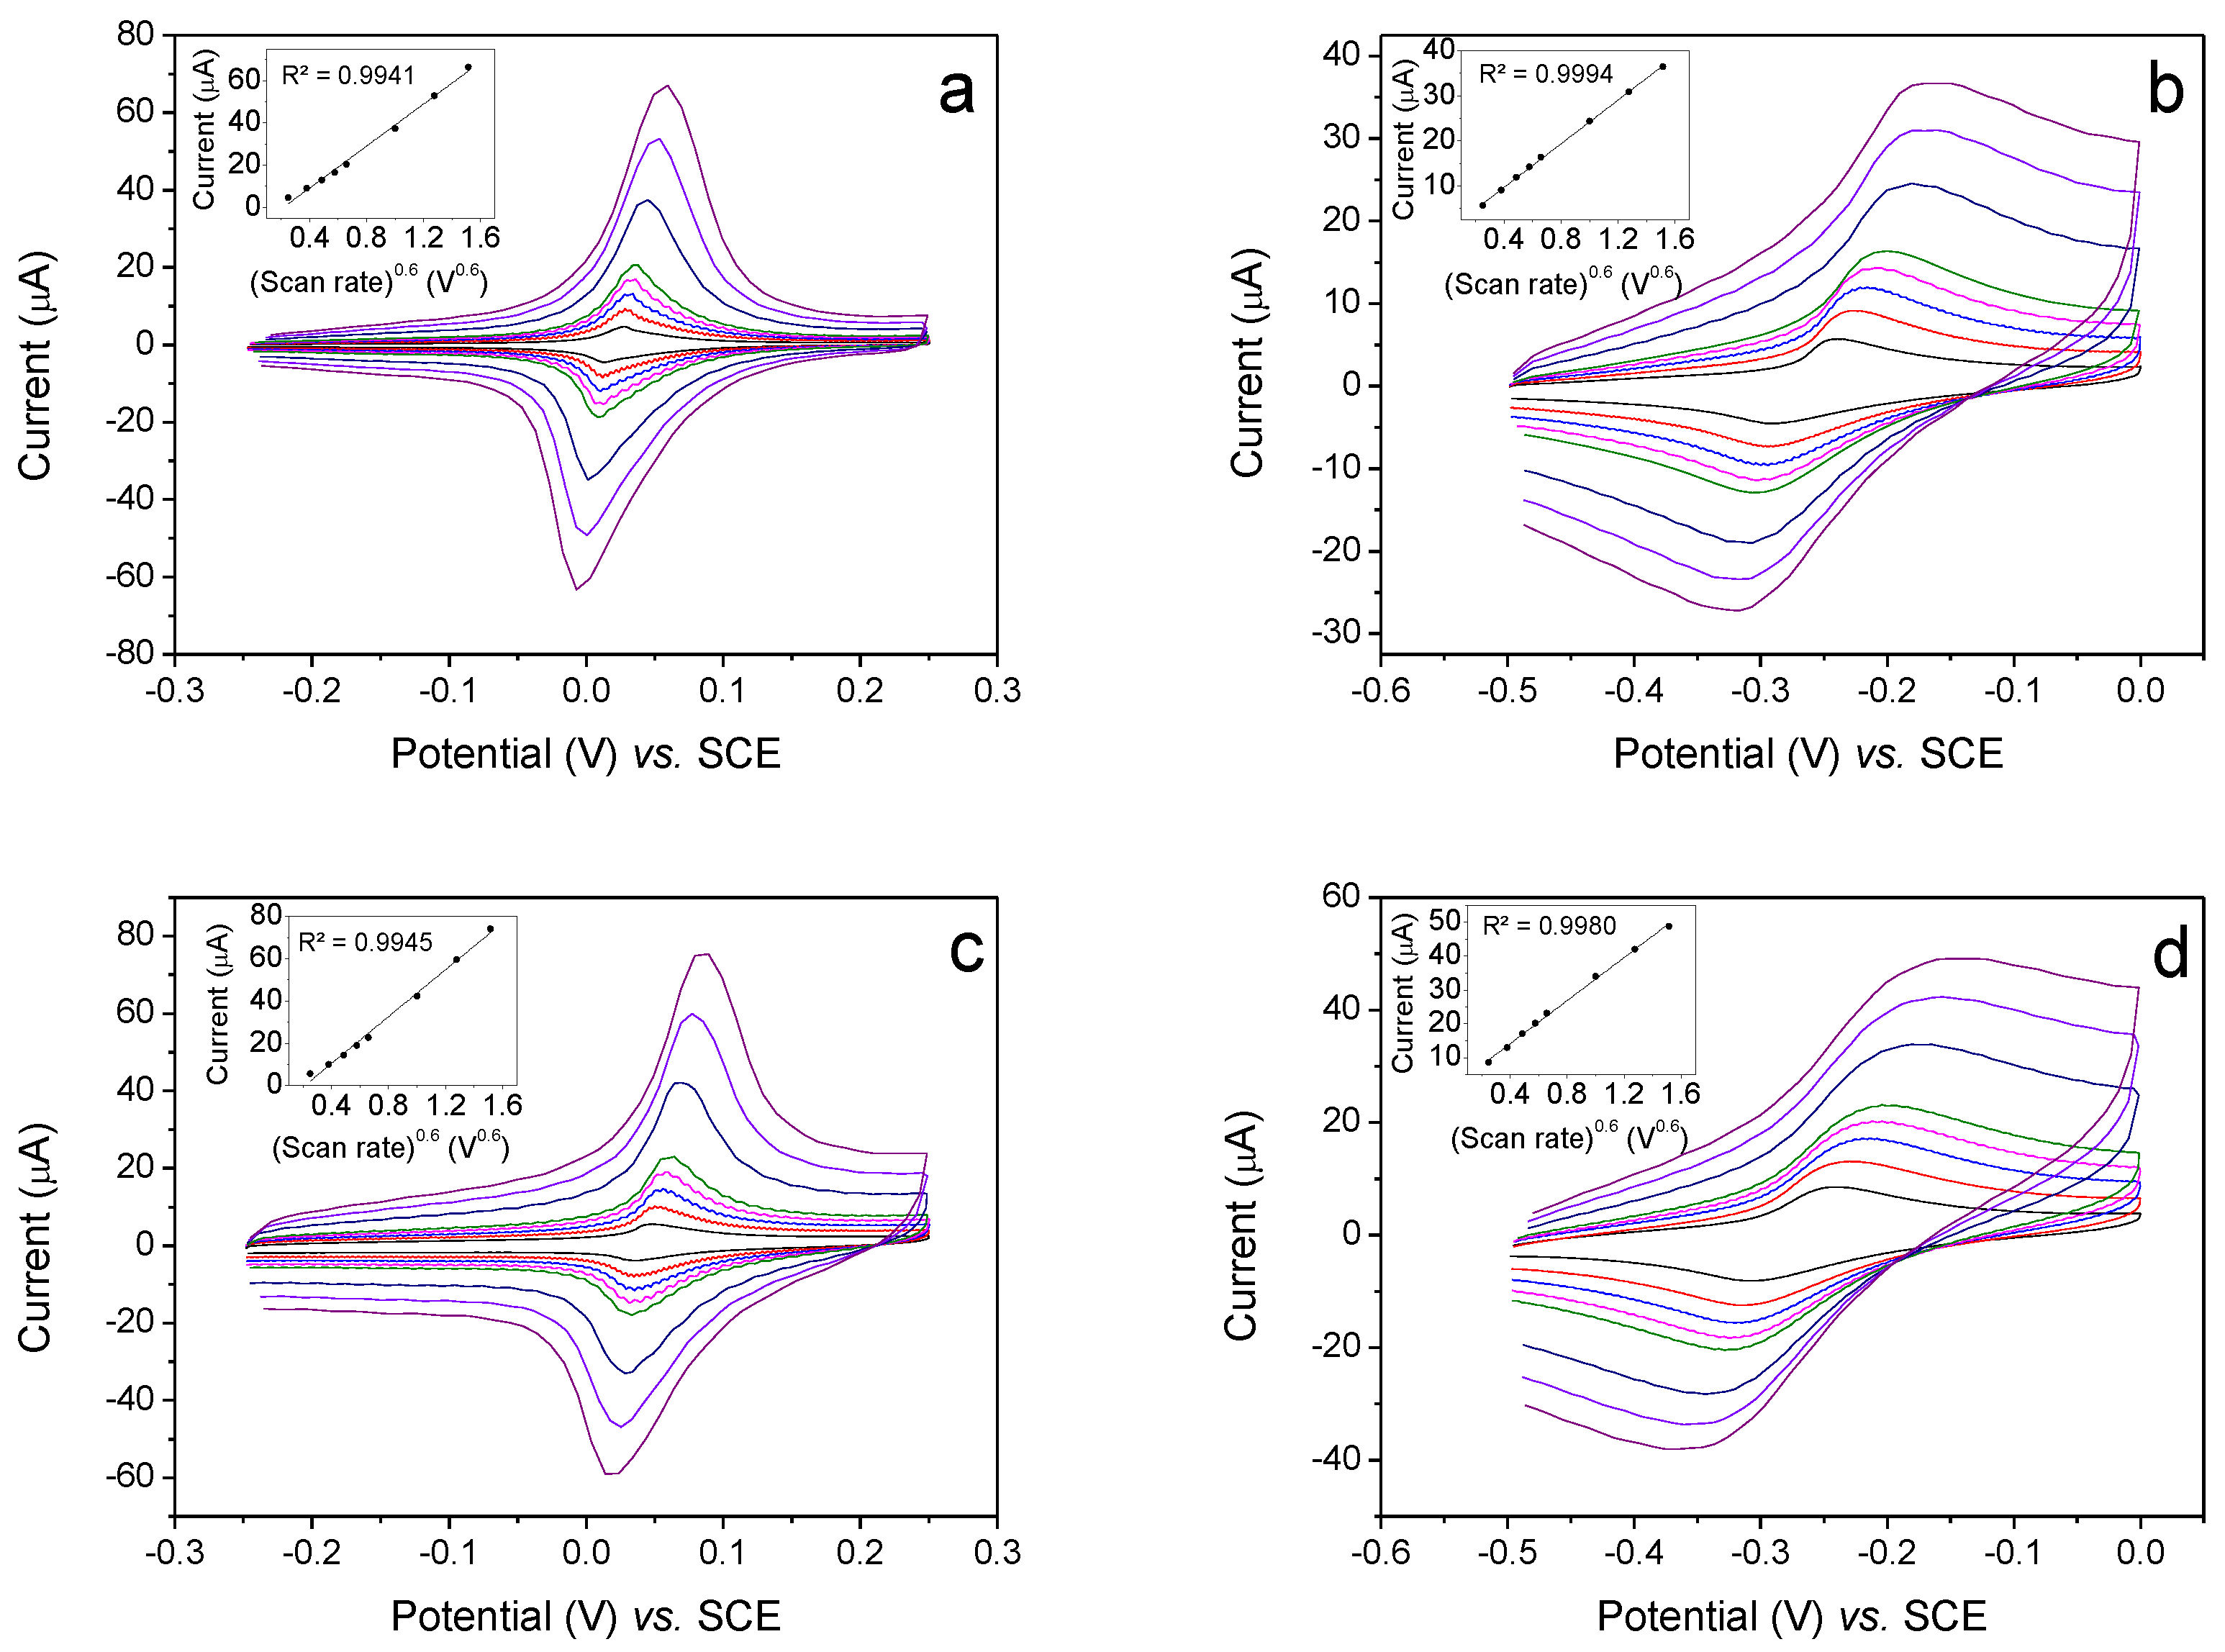
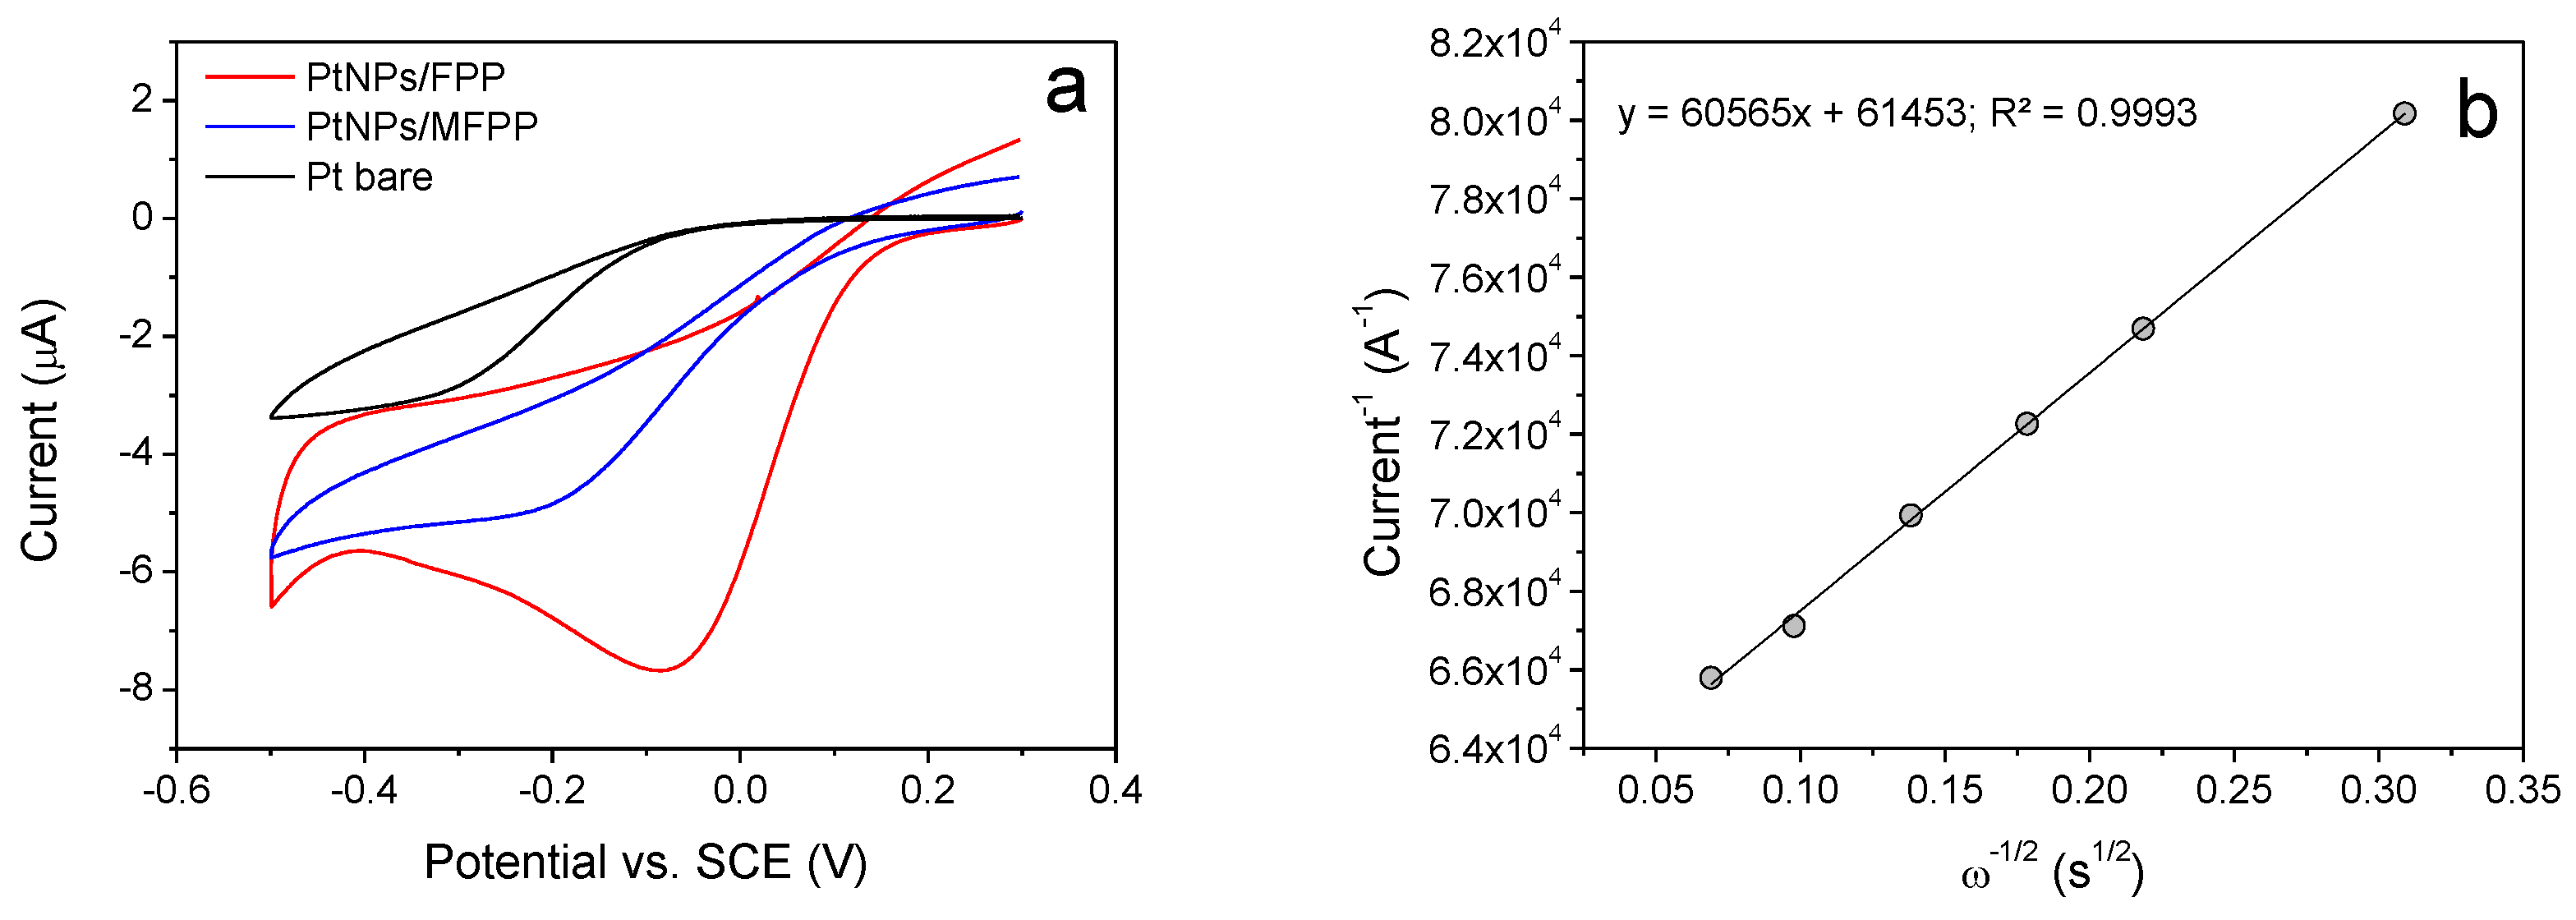
3.1. Electrochemistry, Kinetics and Morphology of Modified Electrodes

In order to select the best basis to prepare the X biosensor, we have carried out the electrochemical characterization of electrodes modified with both polymers. Figure 1 shows the cyclic voltammograms of FPP and MFPP modified electrodes, in aqueous and non-aqueous media. The electrodes showed reversible systems in both media, with formal potential (E0′) in aqueous solution of −0.275 and 0.028 V for the methylated and non-methylated polymer films, respectively, and ratio of peak currents of 1. The Figure displays differences in the voltammogram shapes of both modified electrodes. The FPP shows a half peak width (W1/2) of about 90 mV, in agreement with the Nernst prediction of 90.6/n, while the MFPP W1/2 is notably lower, about 40 mV, indicating the presence of strong attractive forces between the ferrocenyl centers. This fact was observed earlier with other ferrocenyl polymers in aqueous media [26] and the different behaviour in the two polymers is due to the hydrophobicity caused by the methyl groups in the MFPP polymer. As it can be seen, the methyl groups make the ferrocene redox system less reversible, with a separation between peak potentials (ΔEp) of 59 mV (MFPP) instead of 16.5 mV (FPP). Both values are consistent with electrodes modified with electroactive polymer films, and ΔEp is something greater than zero due to the sluggishness of the electron transfer inside the polymeric films at the measuring scan rate (0.1 V s−1) and indicates that possibly the electron transfer is slower in MFPP [27]. The presence of a larger diffusion tale in the MFPP voltammogram can confirm this hypothesis.
Next, the PtNPs were electro-synthesized on MFPP and FPP modified electrodes following the procedure described above. In order to predict which of the composites could show better properties to prepare electrocatalytic surfaces, we studied the variation of the current-potential curves with the scan rate (v) of the two types of modified electrodes, both with and without PtNPs (Figure 2). As it can be seen, the peak potentials shift with the scan rate increase is small. This fact is in accordance with the Laviron’s model for a fast electron transfer in a multilayer redox polymer-electrode [28]. Laviron stablished that if v/k1 tends to zero, being k1 the apparent homogeneous rate constant, the peak becomes identical to the reversible peak for a monolayer and the equilibrium establishes quickly in all the coating. However, when v/k1 tends to infinity the peak tends toward the reversible monolayer peak too because the reaction only can occur at the first layer. In both cases, anodic and cathodic peak current (ip) only varies linearly with v when v is large or small. In the middle range, ip will be proportional to vx (with x ≅ 0.6). The insets of Figure 2 show that the results of ip vs. v0.6 are in complete agreement with the Laviron’s model. This fact allows us to apply the monolayer adsorption model [29] in order to obtain the charge-transfer coefficients (α) and k1, and compare the kinetics of modified electrodes.
Although the variation of Ep with the scan rate is small, the graphs of the peak potential vs. the logarithm of the scan rate (not included) are increasing, yielding straight lines with cathodic and anodic slopes equal to −2.3 RT/αnF and 2.3 RT/α nF respectively, being α the charge transfer coefficient. This fact indicates some kinetics limitation to the polymer film-electrode charge transfer, and we can obtain α and k1 relying on the Laviron model [29]. The k1 values can be estimated from the supplied data for Ep < 200/n mV and α = 0.5, or with a relative error at the most of about 6% when 0.3 < α < 0.7. We used the polynomial fit of the data supplied by Laviron:
F n v R T k 1 = 0.0003 Δ E p 2 + 0.0047 Δ E p + 0.491   ( R 2 = 0.9992 ) .
Being F the Faraday constant, n the stoichiometric number of electrons involved, in our case n = 1, R the gas constant and T the absolute temperature. Table 1 collects the results of this study and the high values obtained for k1 in all the cases, allow us to affirm that all the modified electrodes show almost insignificant kinetic limitations, consistent with the behaviour showed in Figure 2. In addition, we observe that the PtNPs/FPP modified electrode is the best electrocatalytic surface.
Next, we studied the morphology of the best electrode, PtNPs/FPP, by scanning electron microscopy (UHRSEM). Figure 3 shows the micrographs of FPP and PtNPs/FPP electrode surfaces. The FPP polymer covers completely the Pt wire surface forming a dense film with uneven furrowed surface (Figure 3a). After the electrodeposition of the PtNPs, the micrograph (Figure 3b) reveals that, unlike gold particles [20], platinum particles do not cover the entire surface, but appear in isolated clusters or housed in the grooves of the polymer forming chains of nanoparticles about 3–6 nm. The effect of the polymer as a template becomes clear when the surface obtained is compared with a platinum wire subjected to the same process of electrodeposition of PtNPs [21]. In the PtNPs electrodeposition without template (on a Pt bare wire), a surface totally coated with PtNPs of average diameter of 90 nm is obtained. This surface has no mediating effect in oxidase biosensors due to the hindered communication with the active centre of the enzymes. For this reason, the role of ferrocenyl polymers as templates for metallic nanoparticles is of great importance in the development of new and more efficient biosensors.

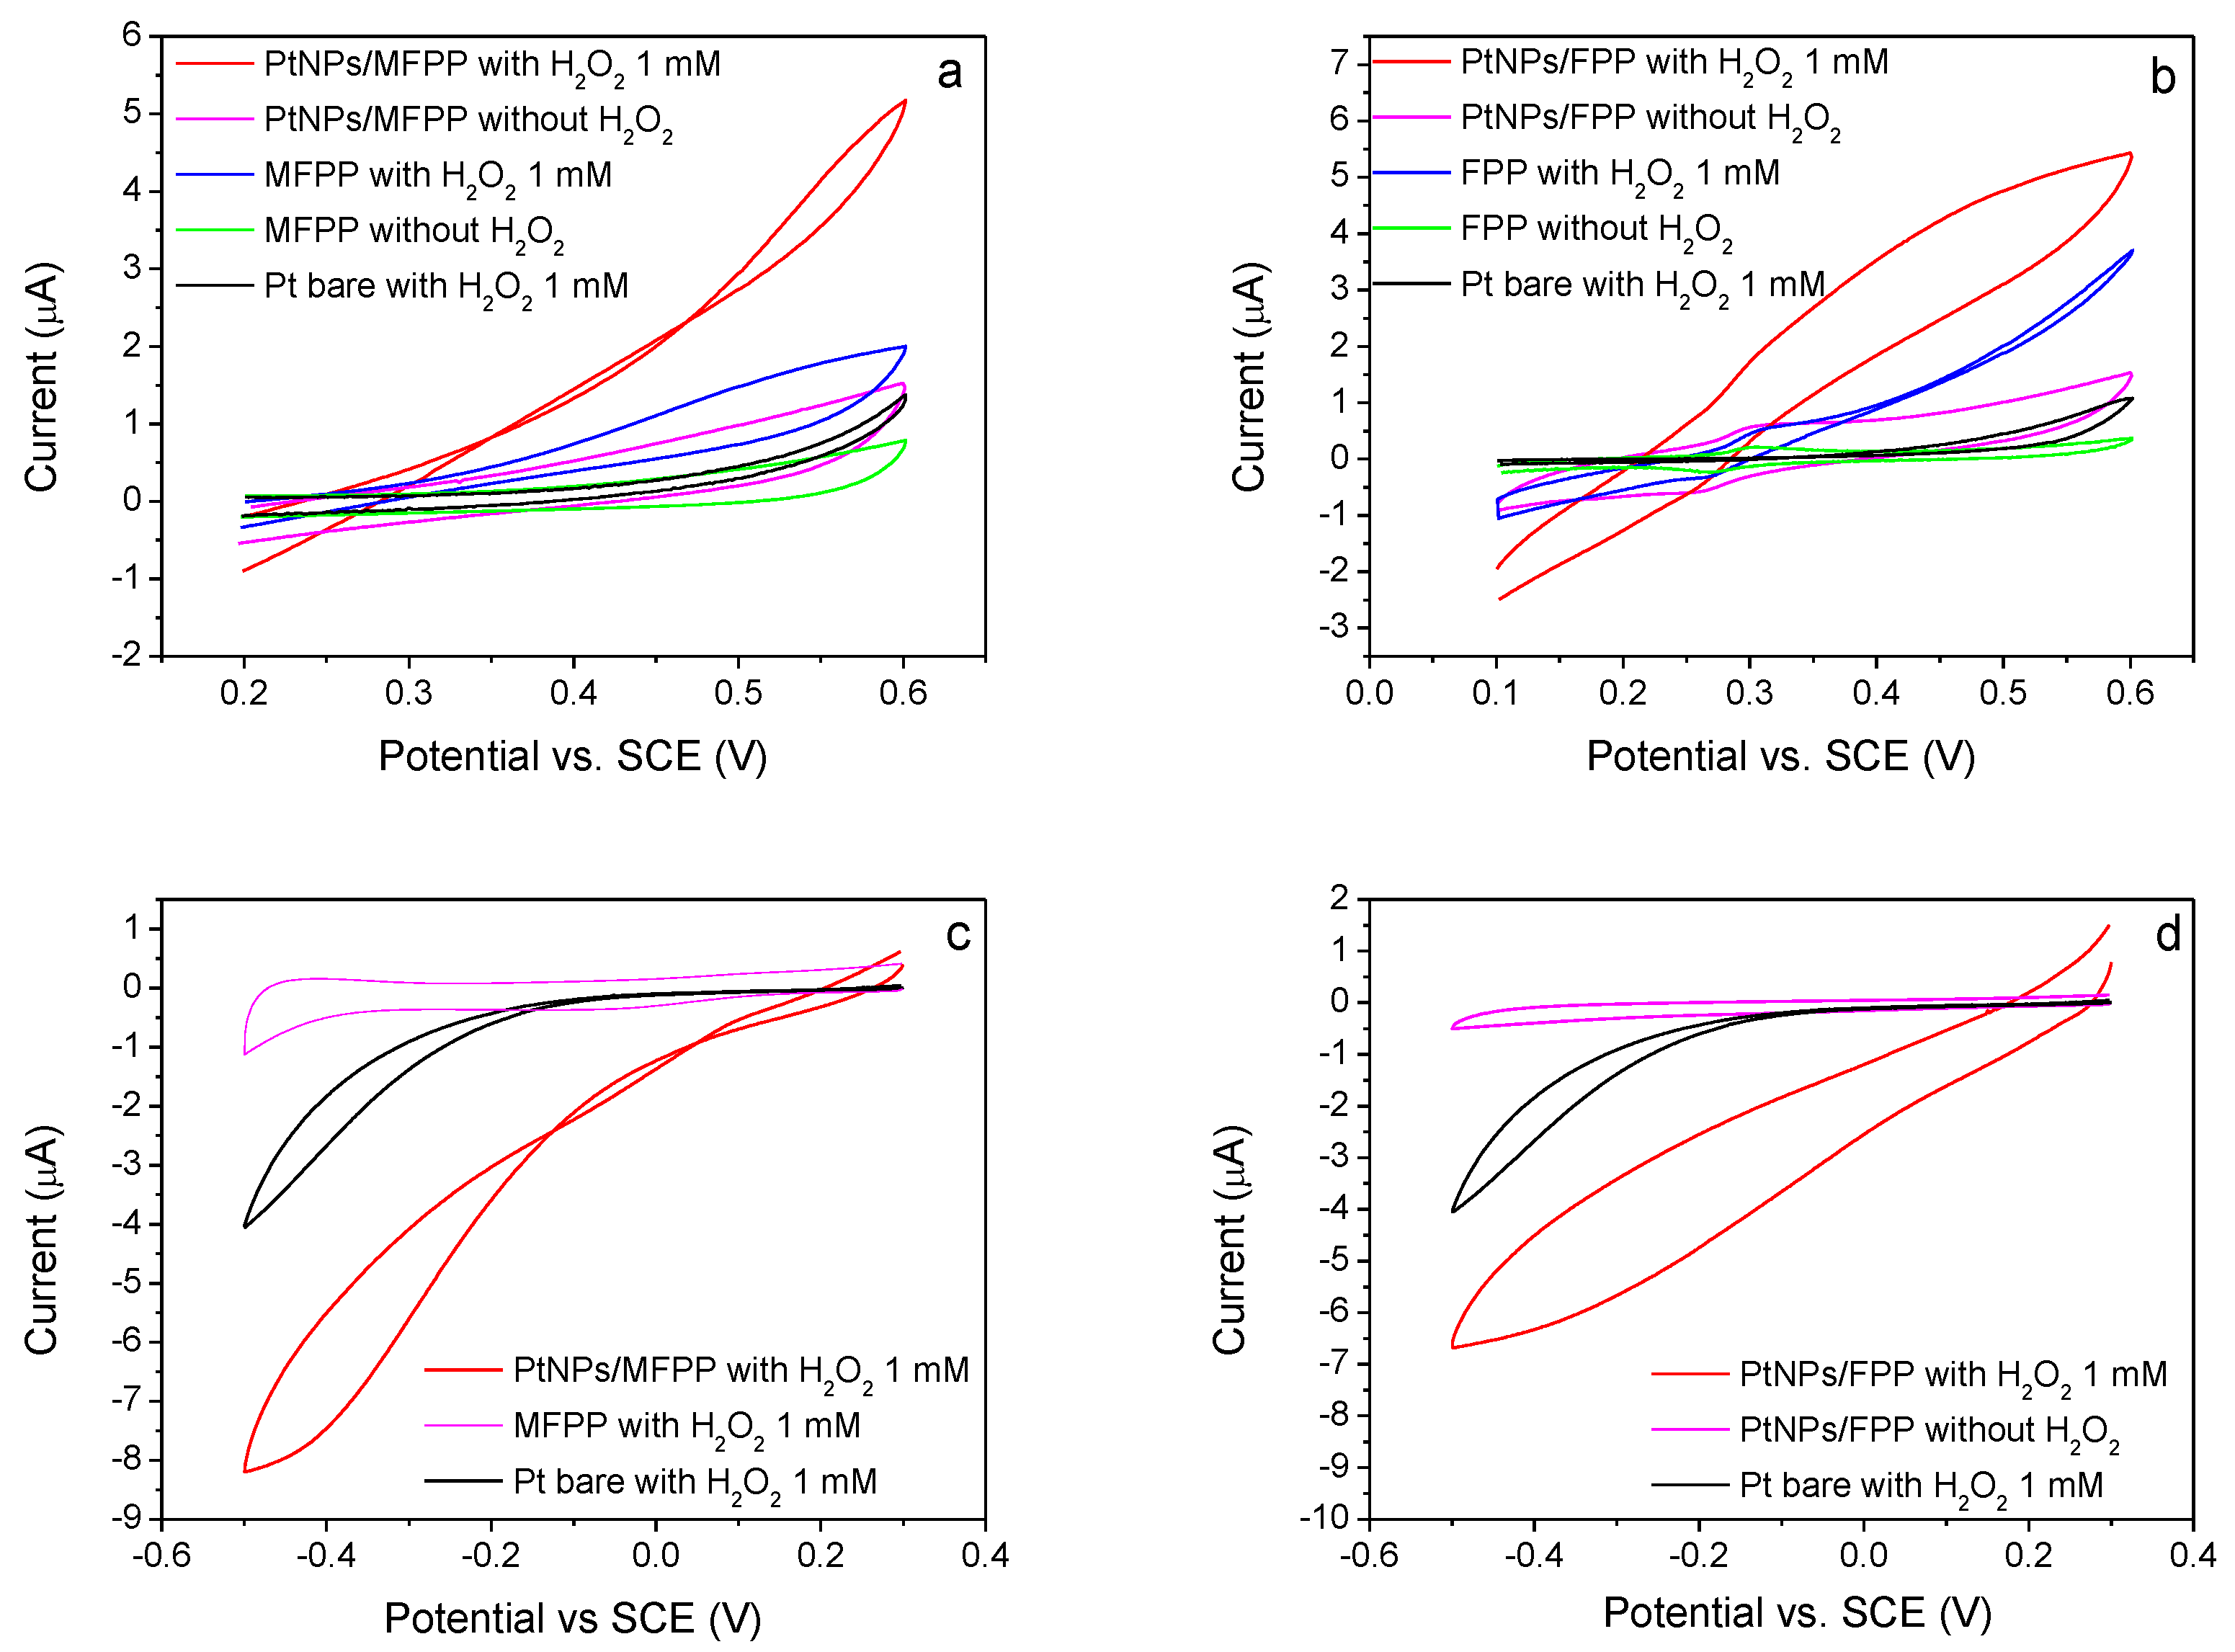
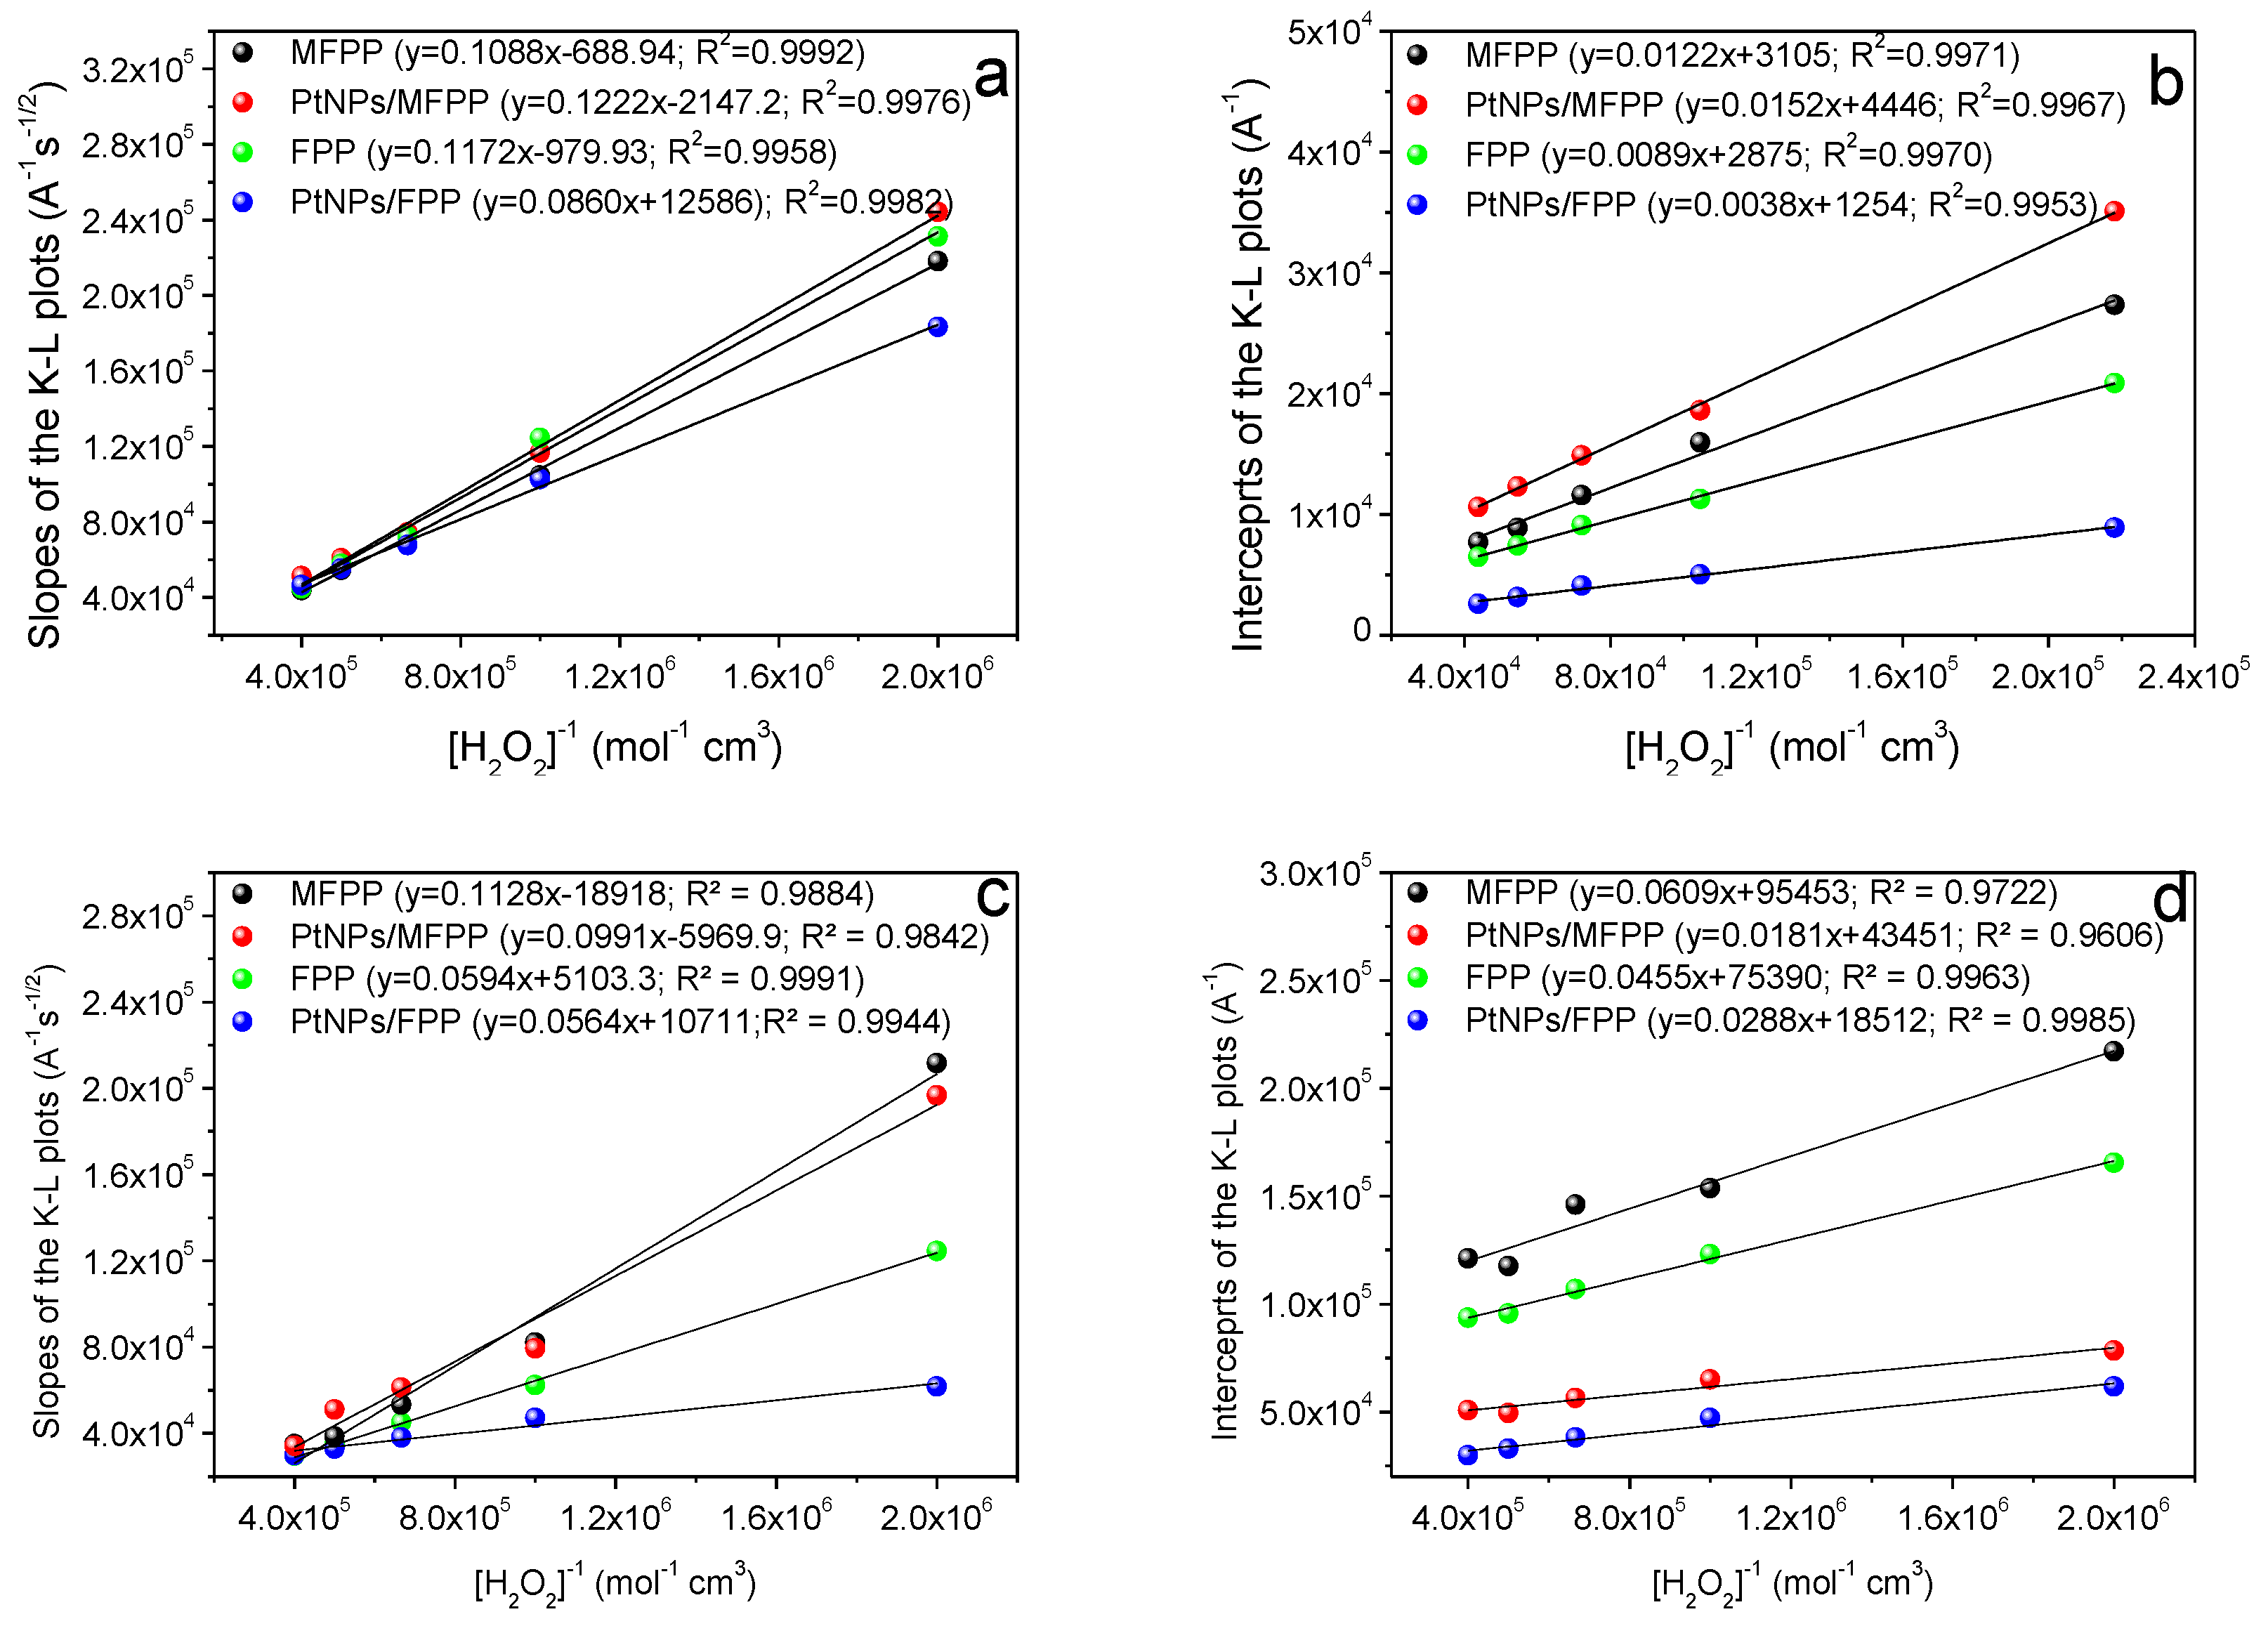
3.2. Hydrogen Peroxide Determination

As cited above, at the Pt surfaces, this determination is poor, requires a high overvoltage and it is usually not very selective due to the substances that could interfere, especially in real samples. Any development of an oxidase biosensor requires one of two properties. On the one hand, for development of second-generation biosensors, the surface of the mediator must contact physically and efficiently with the active centre of the enzyme. On the other hand, if the oxygen is used as natural mediator, an electrocatalytic effect on the oxidation of the hydrogen peroxide generated in the enzymatic reaction is needed. For the first option, the biosensor structure must be designed for each particular enzyme, while the second has a wide range of applications. The aerobic oxidase biosensors are usually based on the detection and measurement of the hydrogen peroxide enzymatically produced in the electrode surface. Since we hope that electrocatalytic surfaces can be used with different oxidase enzymes, we need to know the electrocatalytic properties of the new electrodes for the oxidation of hydrogen peroxide.
Figure 4 shows the cyclic voltammograms of the modified electrodes in absence and presence of hydrogen peroxide 1 mM in the both anodic and cathodic zones. This Figure let us see how the electrodes modified with PtNPs show an enhanced catalytic effect in relation with the polymer electrode in both anodic and cathodic measurements. This fact is attributable to the synergistic effect Ferrocene-PtNPs, since the increase in the signal occurs without any potential displacement in relation with the polymer electrodes, at a potential significantly lower than that of oxidation of hydrogen peroxide on Pt surfaces. On the other hand, we can also see how the PtNPs/FPP electrode shows better signal in the anodic zone than the PtNPs/MFPP one, while, in the cathodic measurements, both electrodes show similar catalytic behaviour. These differences can be explained based on the formal potentials of both systems in aqueous medium. In the MFPP electrodes, with E0′ = 0.07 V, the redox centres dispersed in the polymeric structure can only transport the electrons (redox catalysis) between the electrode and the polymer-solution interface in the anodic zone. Nevertheless, the FPP electrodes, due to its E0′ = 0.28 V, can, in addition, exchange electrons with the substrate (electrochemical catalysis), which may involve coordination to the ferrocene redox centre of the polymer. Most of the systems considered fast, work in redox catalysis. In addition, the electrochemical catalysis allows a greater decrease in the overpotential necessary to the electrochemical reaction and a higher current is observed for a given potential. In this case, the kinetic study of films corroborate this assert. In the cathodic zone, both electrodes could show both types of catalysis and a significant increase in the efficiency occurs, compared to the bare electrode. However, peroxide reduction occurs at a too negative potential to be of interest for biosensor development. This bad news becomes good news if we consider the determination of the analyte through the measurement of enzymatic oxygen consumption without the peroxide interference. This possibility will be studied in the next section.
The kinetics of the electrocatalytic reactions were studied by rotating-disc voltammetry. In view of the cyclic voltammograms, working potentials of 0.5 V and −0.1 V vs. SCE were selected respectively for this study. The linearity of the Levich plots (i vs. ω1/2) [30] (Figures S1 and S2) with the four electrode types at low rotation rates indicates mass-transport limited kinetics, while at high rotation rates, these plots deviate from linearity indicating some kinetic limitation. In these cases, the Koutecky–Levich equation [31,32] is used to determine the rate constant and the diffusion coefficients of the hydrogen peroxide oxidation at the modified electrodes:
1 i = 1 n F A C 0 ( 1 k o b s Γ 1 0.620   D 2 / 3 ν 1 / 6 ω 1 / 2 )
being n the number of electrons, F the Faraday constant, A the electrode area, ν the kinematic viscosity, D the diffusion coefficient, Γ the polymer coverage, ω the angular velocity, kobs the heterogeneous second-order rate constant and C0 the bulk hydrogen peroxide concentration. The optimal coverage of electrodes was determined measuring the response to hydrogen peroxide 1 mM solutions. In all the electrode types, these optimal values were between 1.0 × 10⁻¹⁰ and 5.0 × 10⁻¹⁰ mol Fc cm−2.
The diffusion coefficients, were evaluated from the slopes of the Koutecky–Levich plots (i−1 vs. ω−1/2) (Figure 5a), knowing that the number of electrons that participate in the oxidation and reduction reactions is 2. In the same way, the kobs values were obtained from the intercepts (Figure 5b), once the Γ values are known (see the Section 2).
Table 2 summarizes the average results of at least five electrodes with coverages within the optimal range.
The obtained diffusion coefficients are close to that of hydrogen peroxide in solution (1.71 × 10⁻⁵ cm2 s−1) [33], and higher with the FPP electrodes at cathodic potentials, in spite of the inhomogeneity of the electrode surfaces. This fact confirms that the overall reaction rate is diffusion-controlled. On the other hand, in view of the results of kobs, all the modified electrodes are very efficient in the hydrogen peroxide oxidation catalysis. In addition, these values show us again that PtNPs/FPP is the most efficient modified electrode in the anodic zone. Consequently, the PtNPs/FPP modified electrode was chosen to develop the X biosensor.

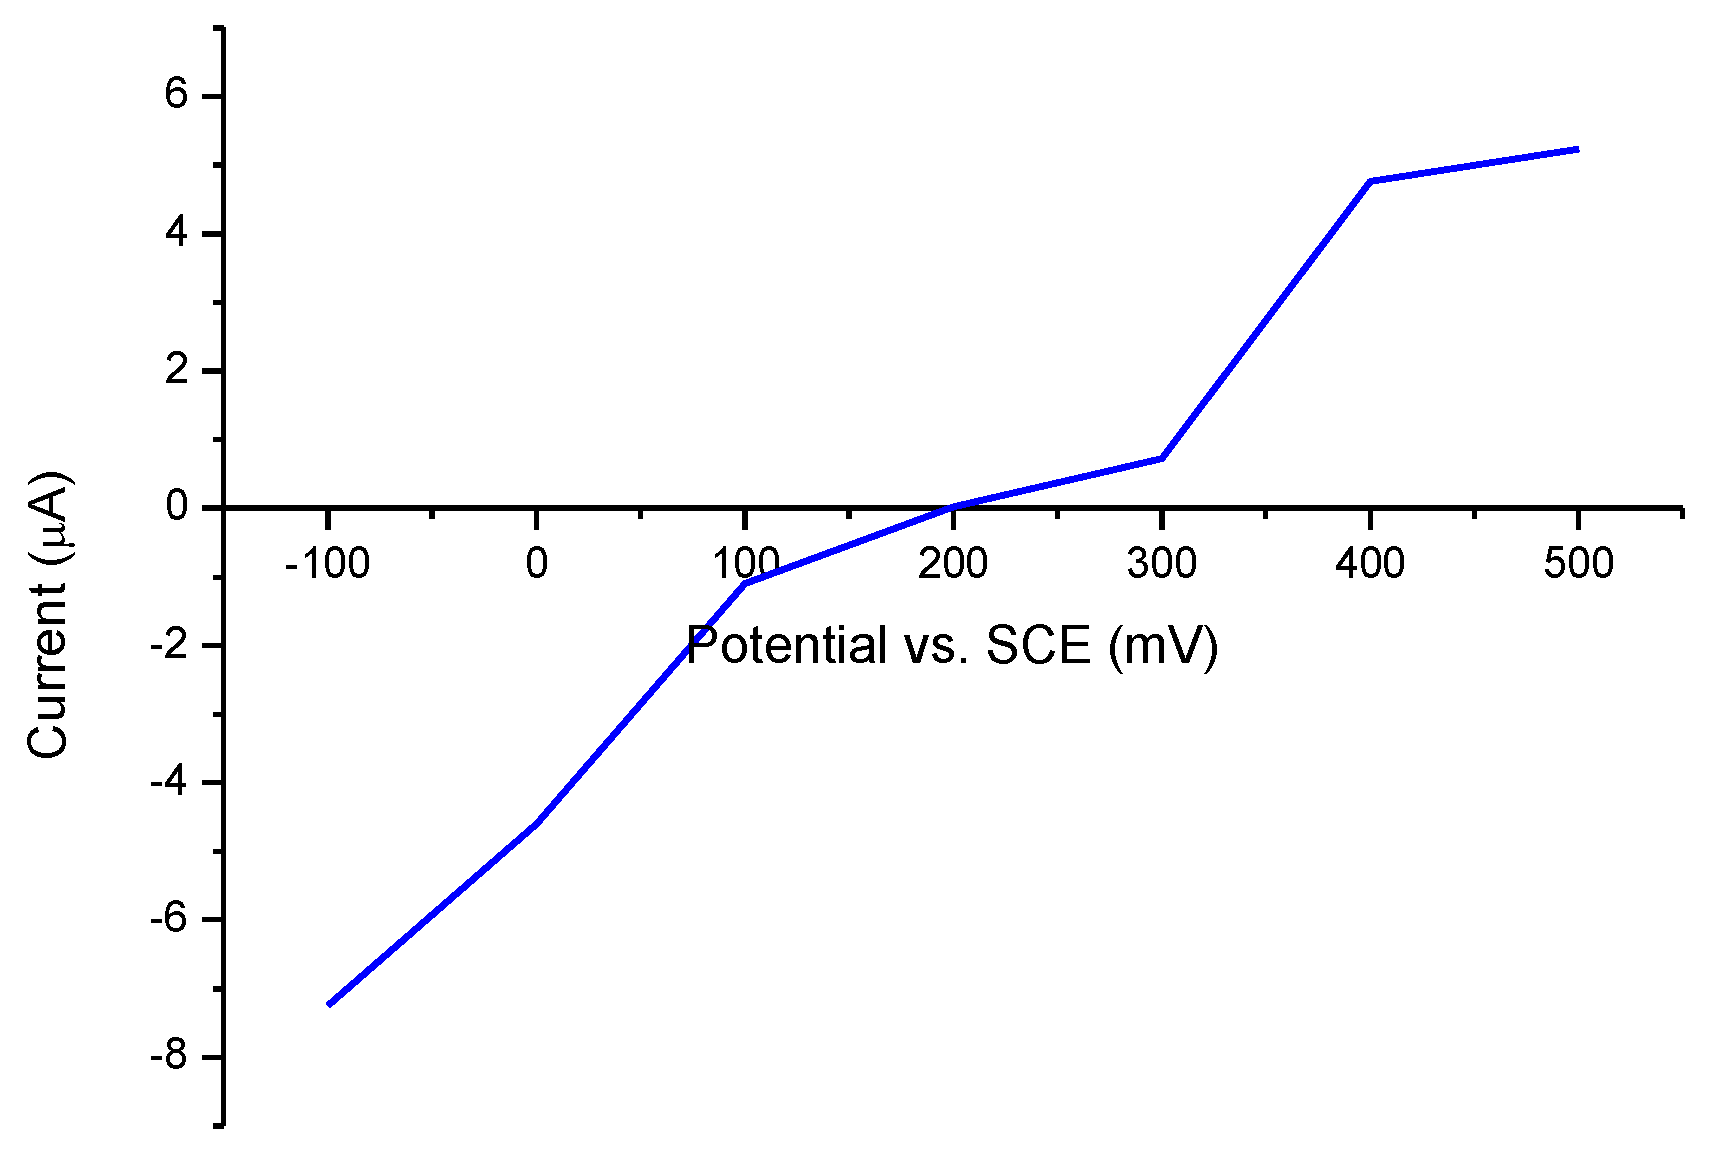
3.3. Oxygen Reduction Catalysis

Figure 6a shows the voltammograms of PtNPs/MFPP and PtNPs/FPP electrodes in oxygen saturated supporting electrolyte solution. As it can be seen, the oxygen reduction peak at the PtNPs/FPP electrode appears at about −0.08 V, almost 0.12 V less negative than PtNPs/MFPP, and 0.3 V less negative that those of hydrogen peroxide, indicating a lowering of the activation energy for the reaction. Note that the reduction of O2 at a bare Pt electrode is insignificant at potentials less negative than –0.2V. The current is also significantly enhanced in accordance with the electrocatalytic behaviour. In addition, the peak presents two waves, at −0.08 and −0.35 V that suggest that the oxygen reduction occurs through a two-stage pathway, with hydrogen peroxide as intermediate, which reduces in the second step at more negative potential [34,35]:
O 2 + 2 H + + 2 e H 2 O 2 H 2 O 2 + 2 H + + 2 e 2 H 2 O
this fact would mean an advantage for the determination of the enzymatic oxygen consumption, since the presence of peroxide would not cause significant interference, as already mentioned above. To ensure this hypothesis, the kinetics of the reduction of oxygen was studied at the PtNPs/FPP modified rotating-disk electrode. At higher rotation rates, the Levich plots deviate from linearity, indicating a kinetic limitation and that the limiting currents are not entirely transport controlled by the catalytic electron-transfer kinetics (Figure S3).
The rate constant and the number of transferred electrons was determined by the Koutecky–Levich equation with O2 diffusion coefficient 2.26 × 10⁻⁵ and their concentration in a saturated solution at 23 °C [36]. Figure 6b shows the Koutecky–Levich plot and the results are included in Table 2. The obtained value to n = 2 confirms the two-steps mechanism and the kobs value suggests that the measure of the enzymatic oxygen consumption is the best option if the cathodic zone is preferred to work.

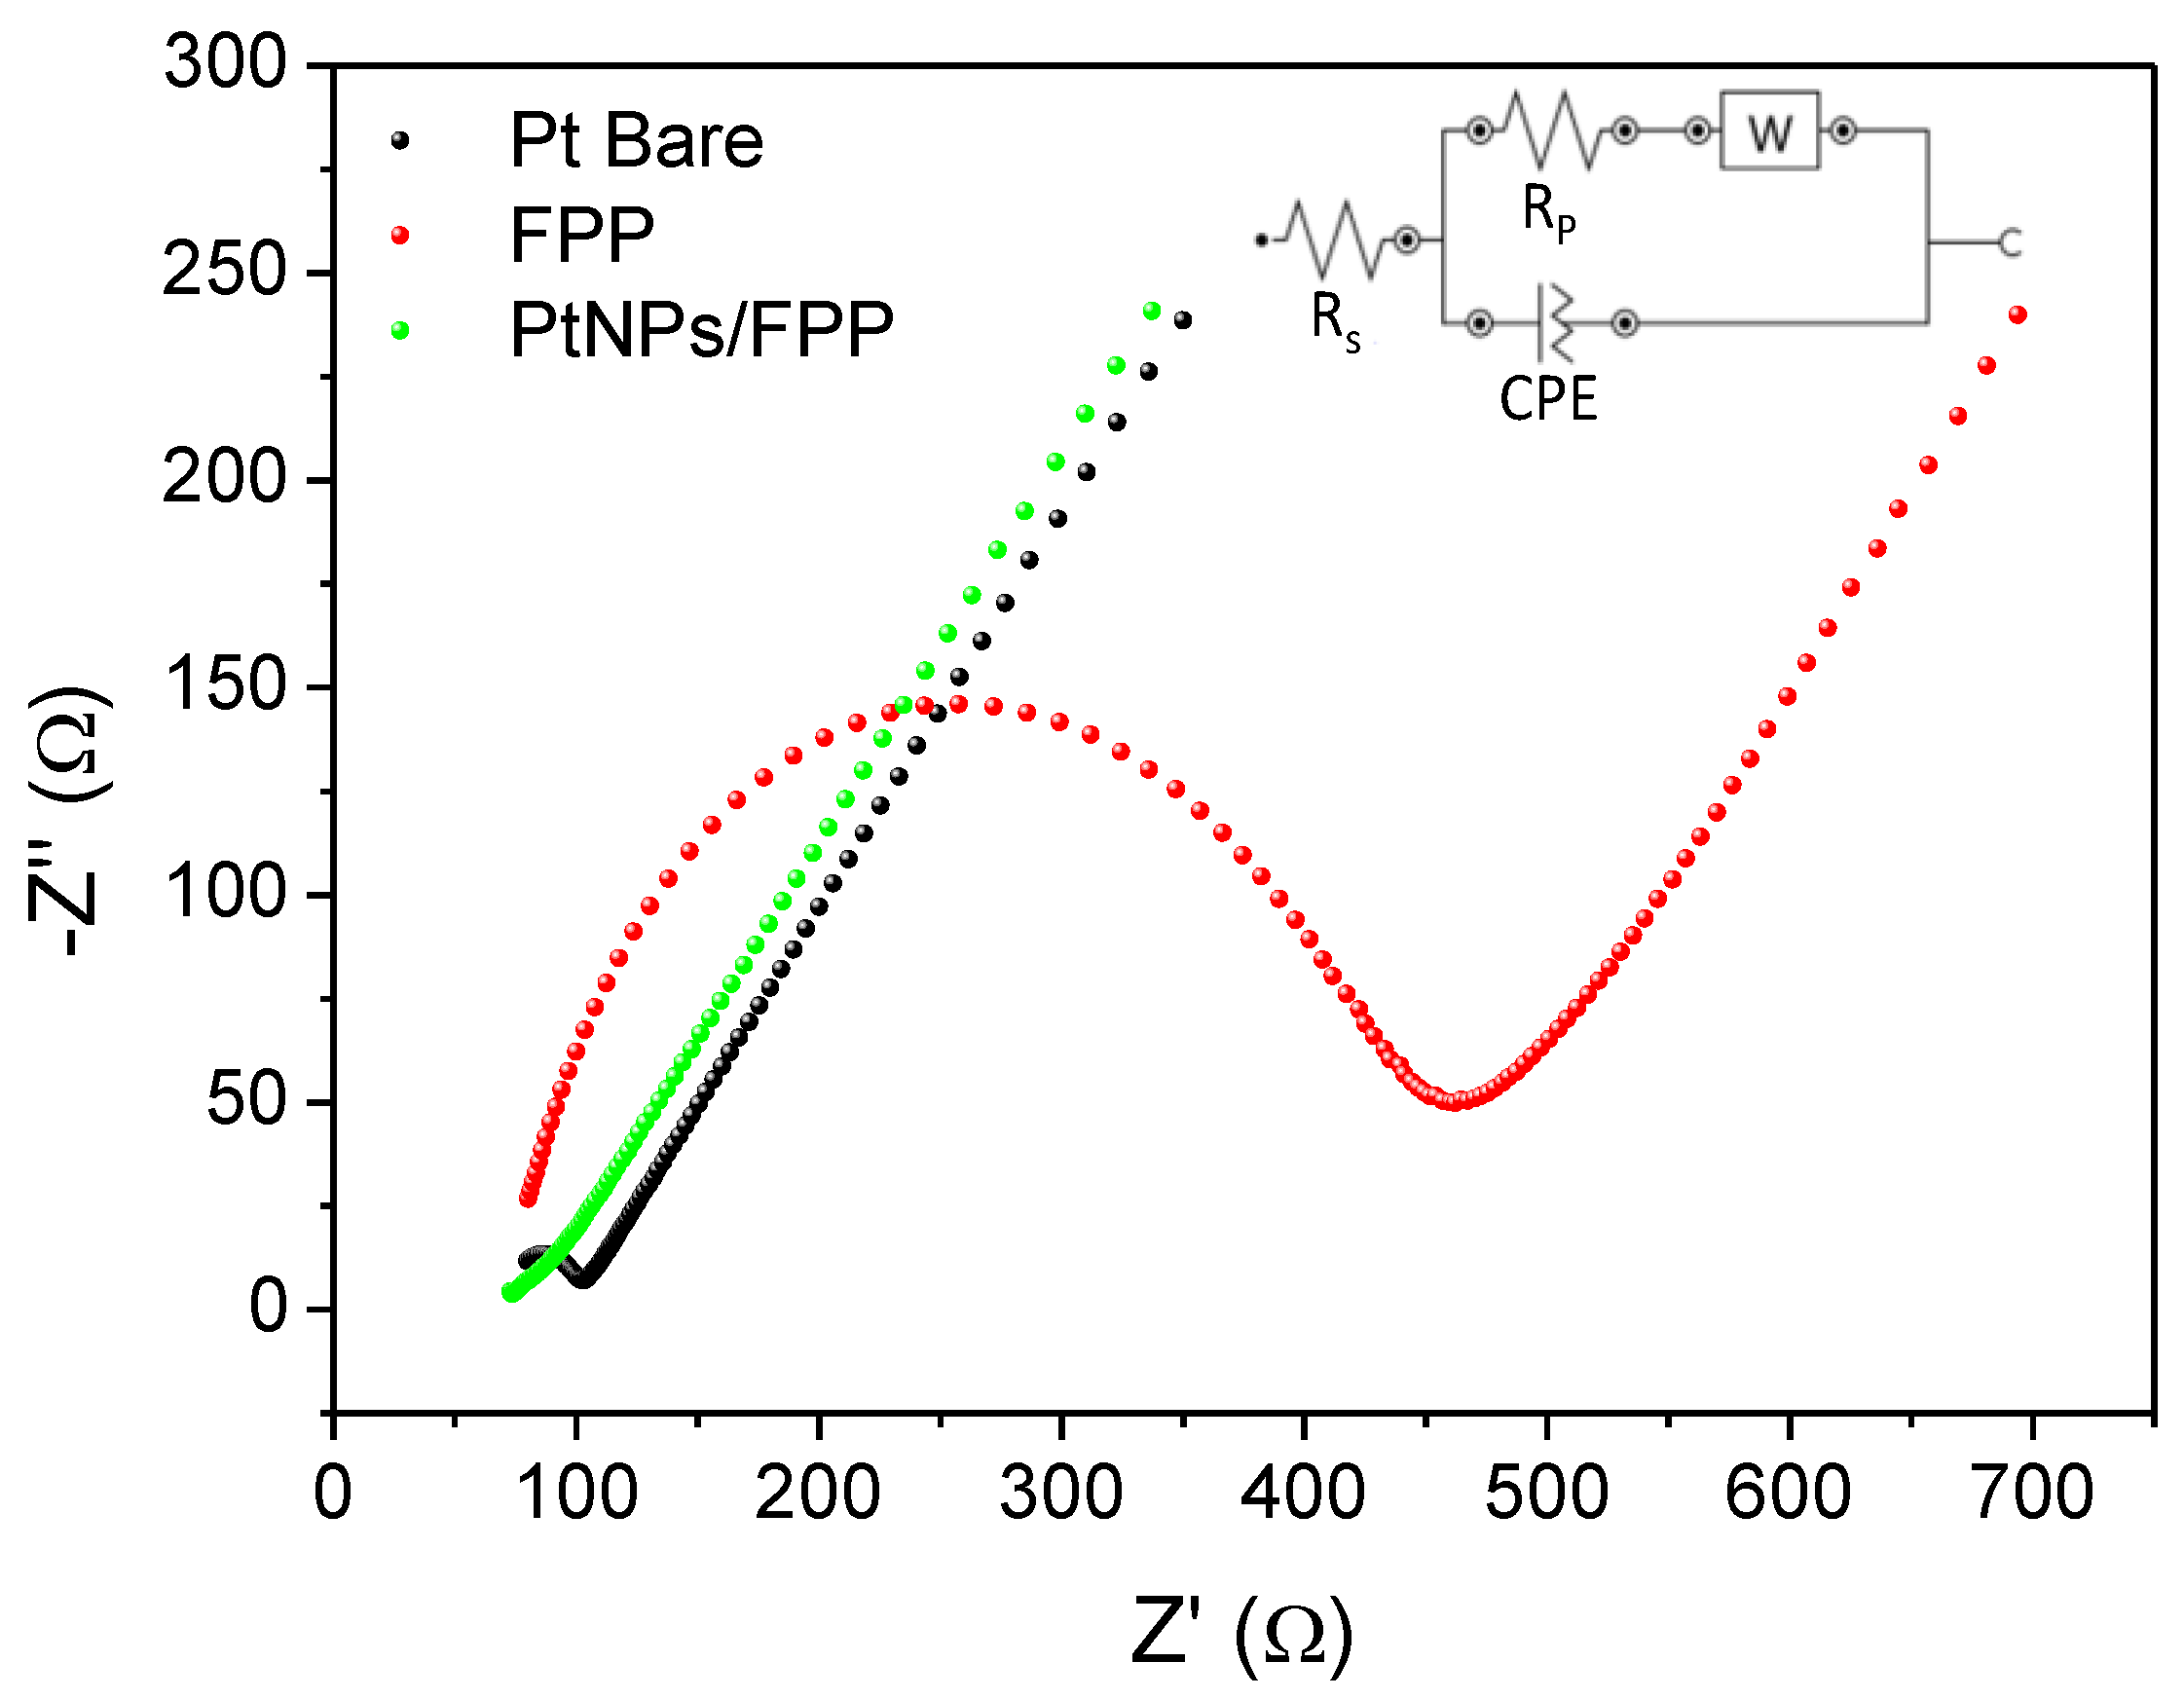
3.4. Electrochemical Impedance Spectroscopy (EIS)

Before the enzyme modification, we carried out the electrochemical impedance spectroscopy (EIS) study of PtNPs/FPP and FPP modified electrodes. The EIS technique enables the evaluation of the properties of the electrode interfaces. The interfaces can be modelled by an equivalent circuit, which includes the charge-transfer resistance, RCT, the Warburg impedance (diffusion of ions to the electrode interface), ZW, the double layer capacitance, Cdl, and the electrolyte resistance, Rs [37]. The Nyquist diagram represents the imaginary part vs. the real part of impedance. The plot is widely used to calculate RCT and Cdl and consists of a semi-circular part whose diameter represents RCT and, at low frequencies, a linear part characteristic of systems with diffusion-controlled current. However, for rough electrode surfaces, Cdl cannot correctly describe the electronic properties of the interface because the system deviates from the ideal capacitive behaviour, and a constant phase element, CPE, that reflects the non-homogeneity of the layer, must be introduced instead of Cdl. This constant phase element is a mathematical expression that represents various electrical elements, and is defined as:
CPE = A−1 (jw)n
being n the interface deviation from the Randles model, taking values between 0.5 and 1, and A a coefficient that becomes equal to Cdl when n = 1. Figure 7 displays the Nyquist plots obtained with both modified electrodes and a Pt bare electrode for comparison. More detailed results of fit and simulation of Pt bare, FPP and PtNPs/FPP modified electrodes are provided in Figures S4–S6 respectively as examples. In addition, Table 3 shows the values of the different results from the curve-fit EIS studies.
As can be seen from these results, the interfacial resistance of PtNPs/FPP modified electrode is very low in comparison with the FPP, and it is even lower than those of the Pt bare. This indicates a high electrode-electrolyte electron conduction pathway in all the film, and that an important synergistic effect exists between the two components of the coating, which improves the electrode.
Once RCT has been characterized, we can obtain the exchange current, i0 from the equation RCT = RT/nFi0. Subsequently, the electron transfer constant k0 can be obtained from the equation i0 = nFAk0C, being A the electrode area (the bare area of 0.07 cm2 has been used as reference in all the cases), and C the bulk concentration of the redox probe in mol cm−3 [38]. In agreement with all the previous results, the PtNPs/FPP electrode showed the higher k0, improving even that of Pt bare electrode and demonstrating that this is the best catalytic surface to develop the new biosensor.

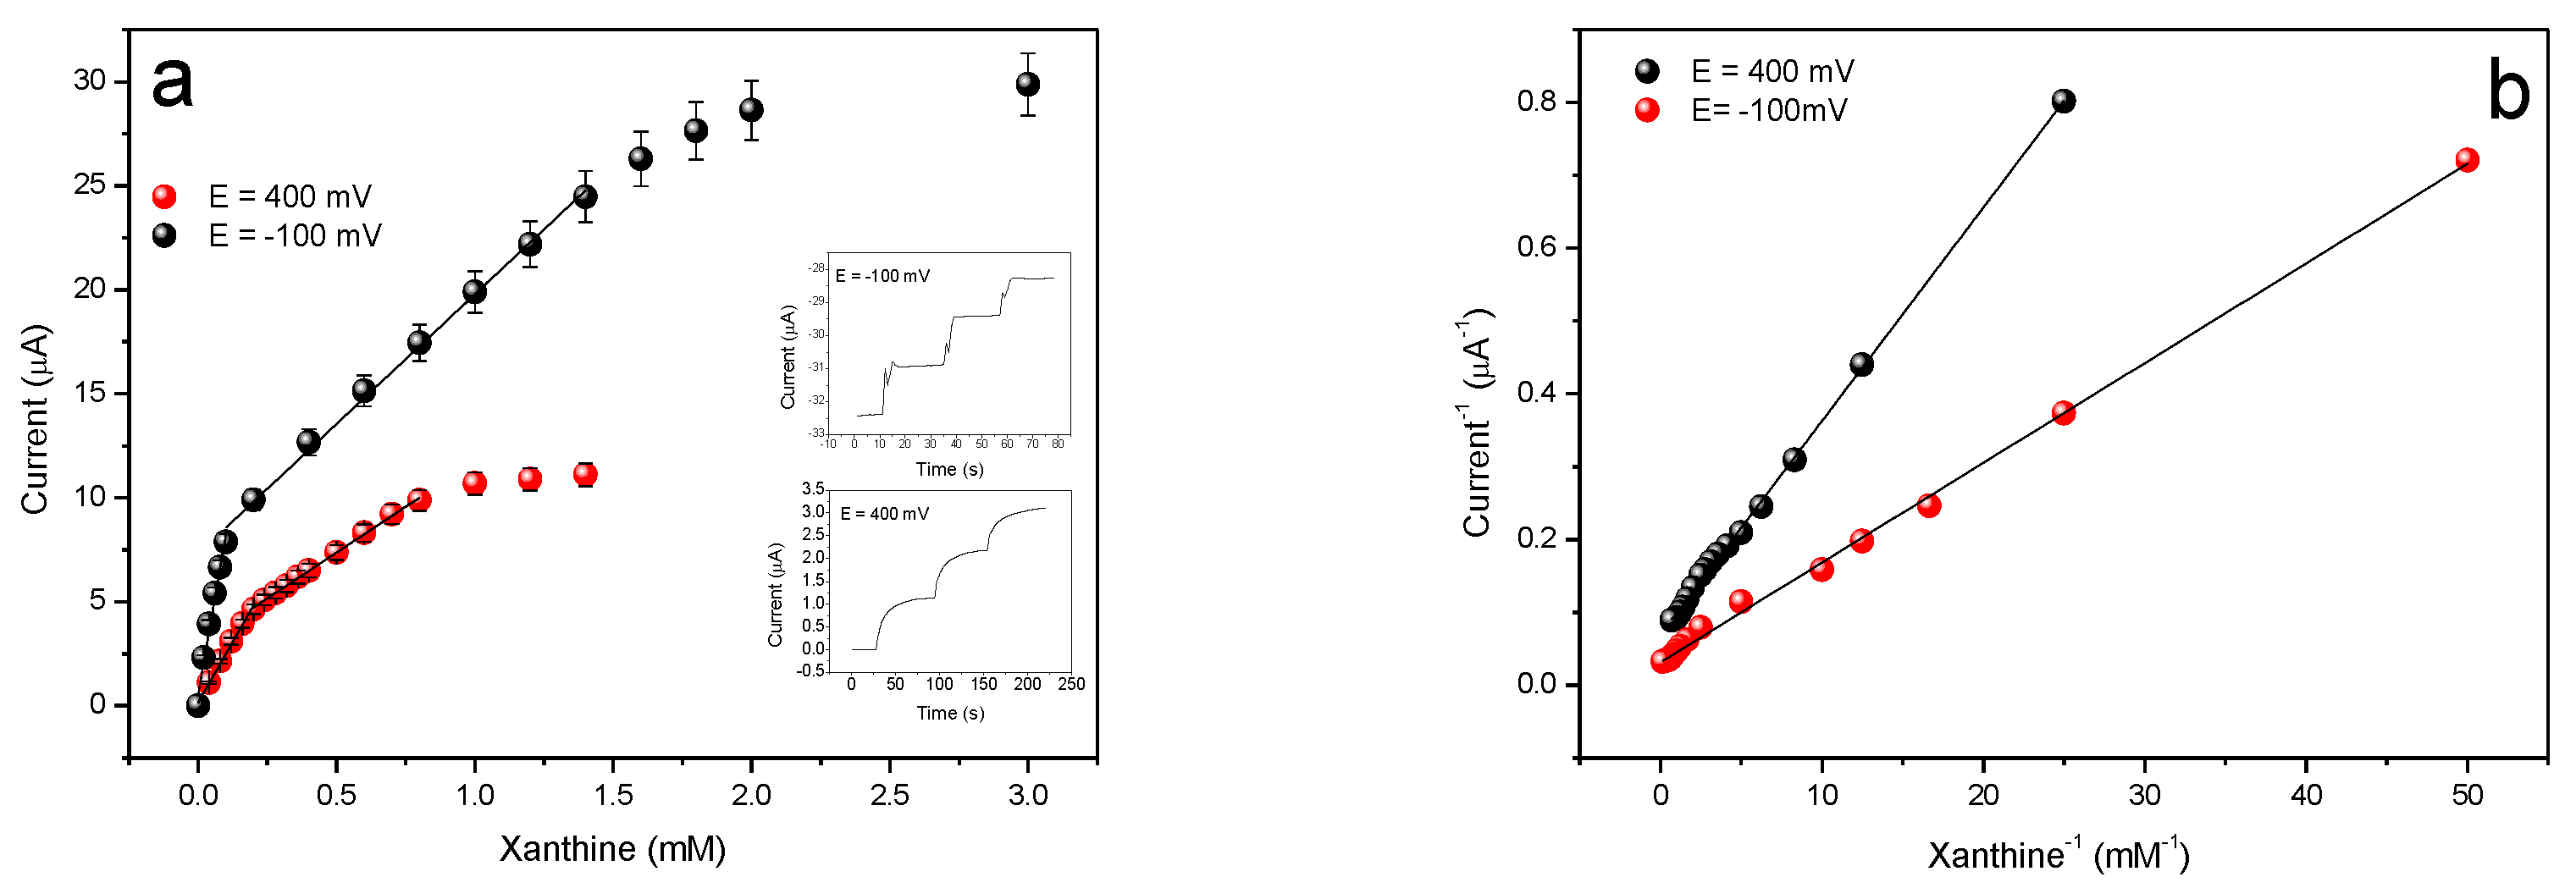
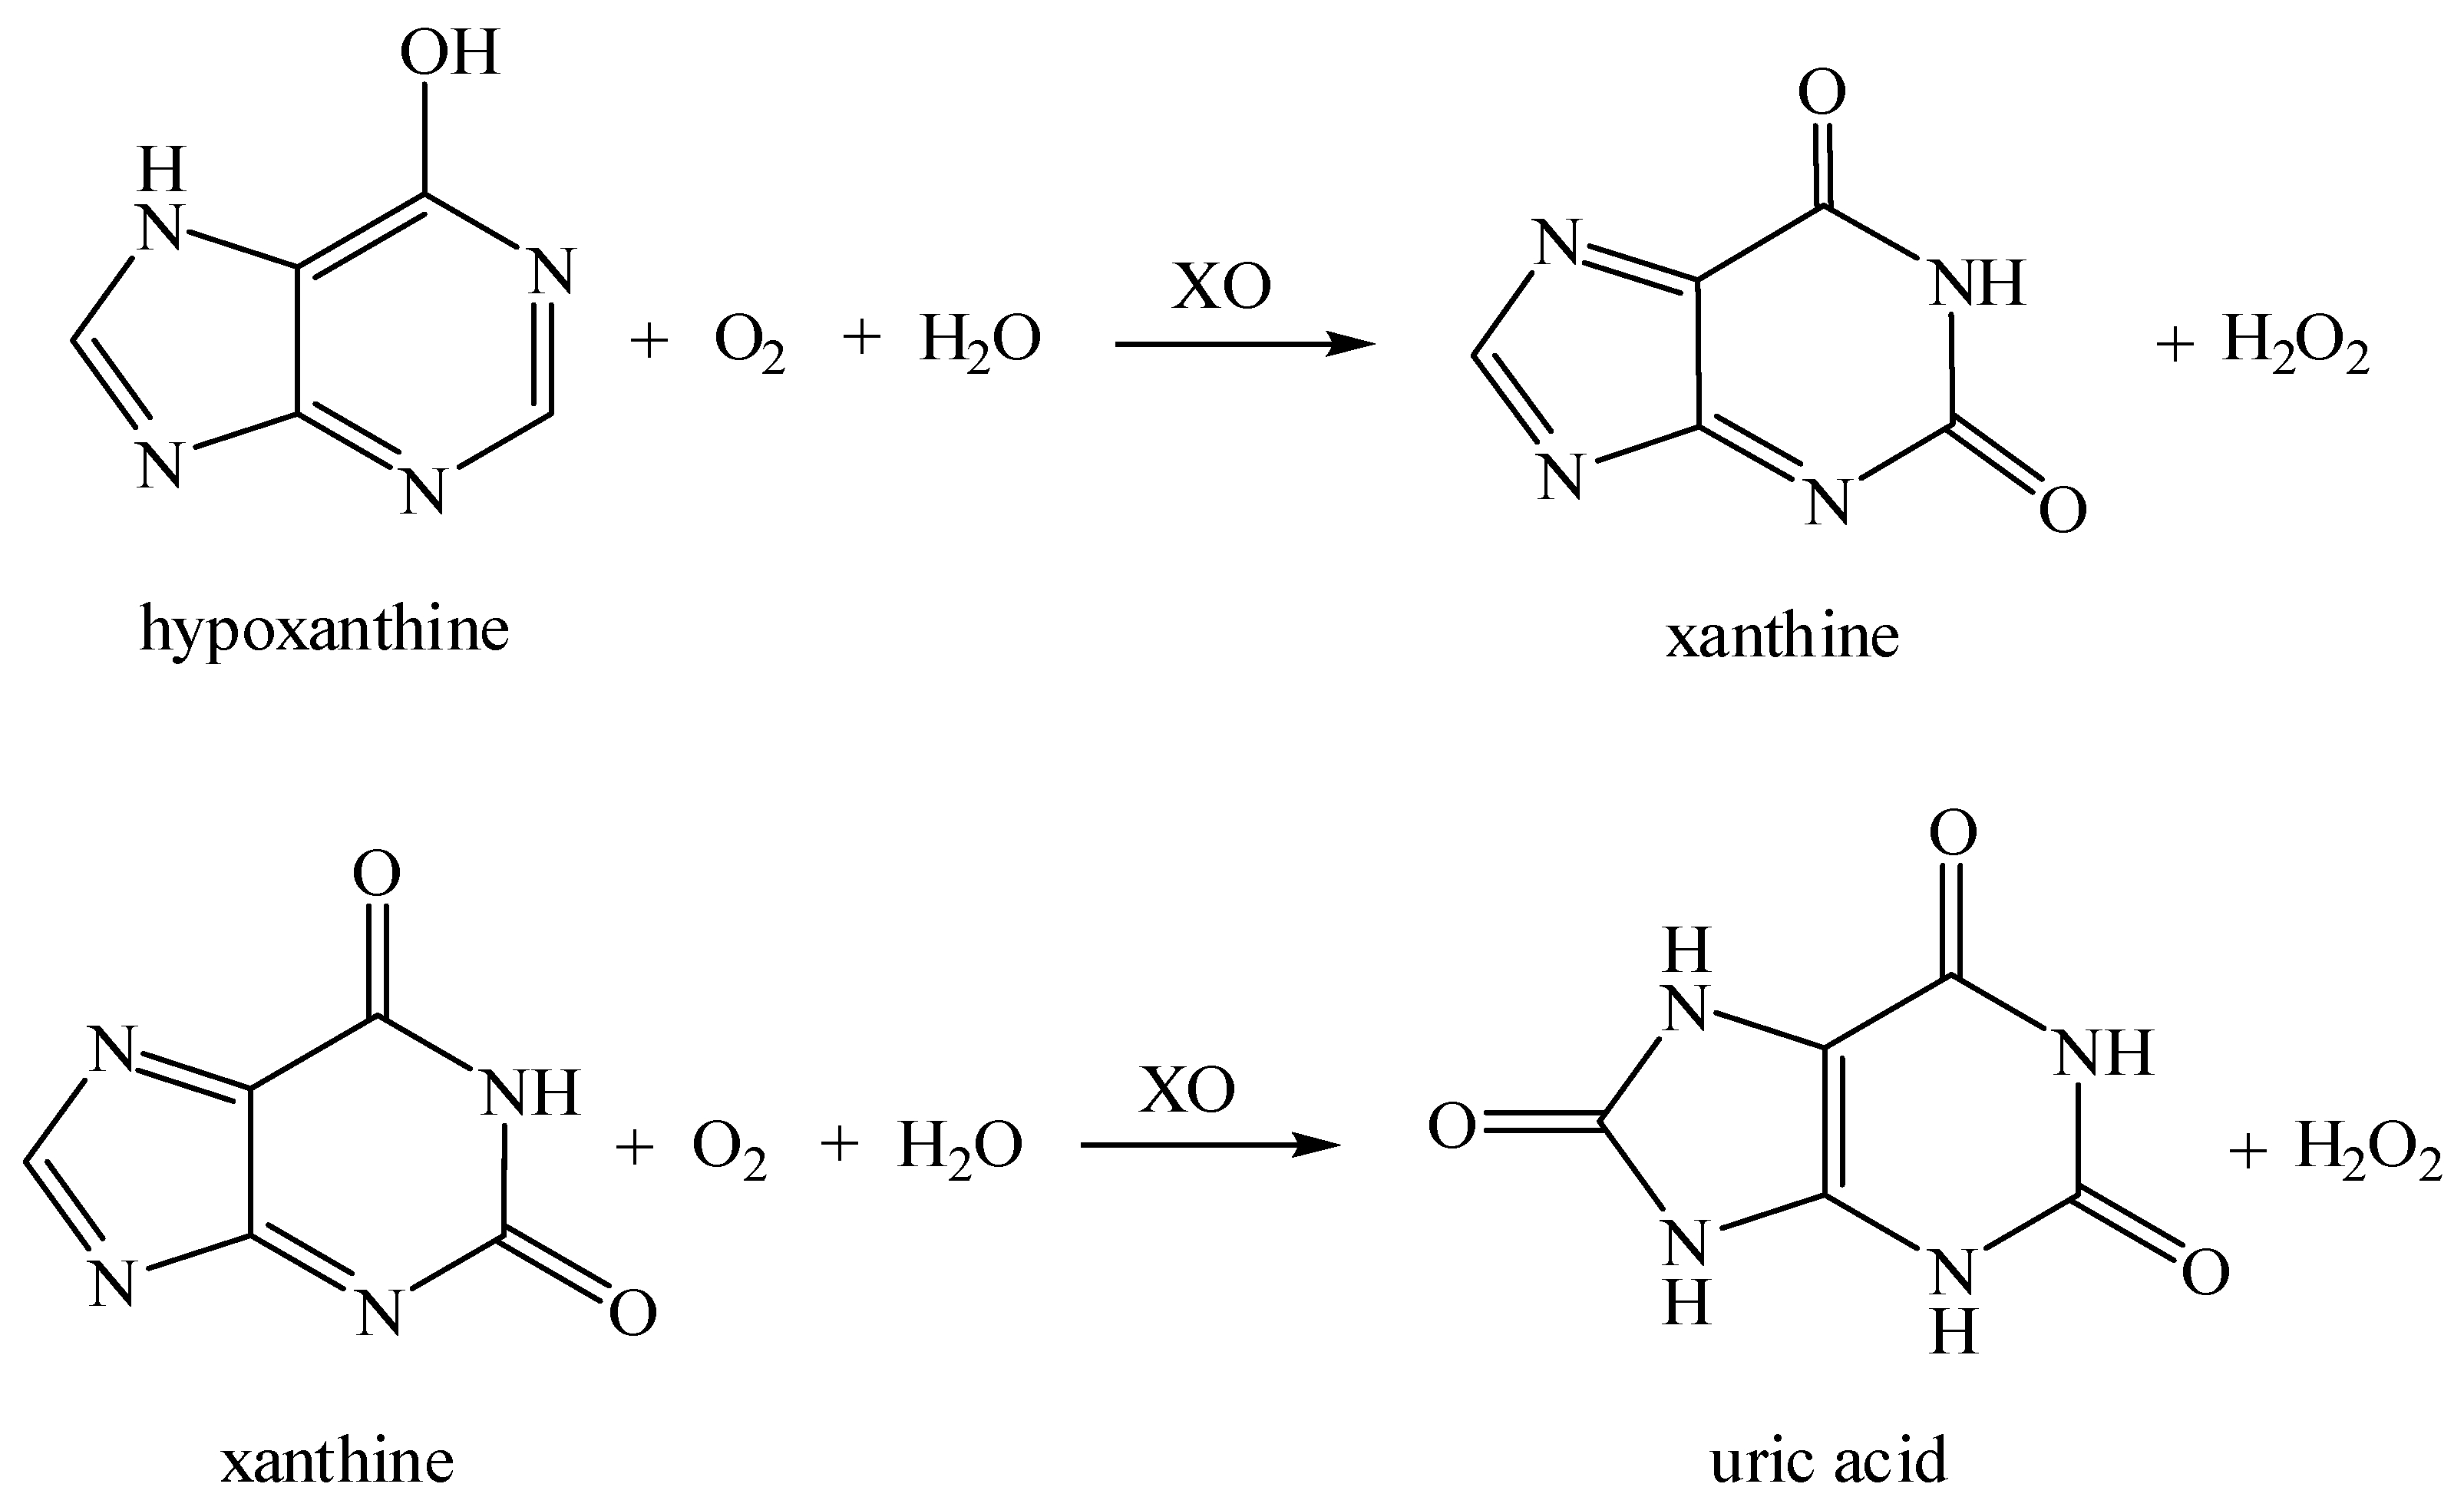
3.5. Xanthine Biosensor Characterization

The optimal xanthine biosensor was prepared as described in the experimental section. In order to select the working potential, we test the biosensor response at several potentials in presence of X 0.2 mM (Figure 8). As can be seen, the current intensity due to the oxidation of hydrogen peroxide generated by the enzymatic oxidation of xanthine increases linearly with the potential from 0.2 V to a value of 0.4 V, from which it begins to stabilize. In the cathodic zone, a quasi-linear increase is also observed from potential 0.1 V due to the oxygen reduction. Consequently, we chose potentials 0.4 and −0.1 V as optimal working potentials in order to avoid interferences, especially in the cathodic zone, where the reduction of hydrogen peroxide could affect the oxygen reduction signal.
Figure 9a shows the xanthine calibration plots at the selected working potentials, obtained from the steady-state response of XO/PtNPs/FPP biosensor prepared by to consecutive addition of aliquots of xanthine. It is clear that the biosensor is capable of detecting and measuring xanthine concentrations in both anodic and cathodic mode. As it can be seen, the cathodic zone, in which the oxygen consumption is measured, offers the best results, with sensitivity 1.10 A M−1 cm−2 and limit of detection (LOD) of 48 nM, compared to that obtained at +400 mV of 0.33 A M−1 cm−2. This is a novelty in the xanthine biosensors, especially considering that the measurements are carried out at very moderate potential (−100 mV vs. SCE) in comparison with other biosensors [18]. Nonetheless, the cathodic zone offers an interference-free working potential because most interferences occur in the anodic zone. It should be noted that both calibration curves show two marked sections in which the signal varies linearly with the xanthine concentration. This fact allows us to determine xanthine in the concentration ranges 0.01–0.1 and 0.1–1.4 mM at −100 mV, and 0.03–0.2 and 0.2–0.8 at +400 mV. The same phenomenon has been observed by other authors too [4,12] and let us to extend the applicability of the biosensor to higher concentrations that usual with good sensitivity.
In order to characterize fully the new biosensor, we determined the apparent Michaelis–Menten constants, K′M, and the apparent rate constants kapp from the double reciprocal Lineweaver–Burk equation (Figure 9b):
1 i = 1 k a p p 1 [ X ] + 1 k a p p K M
the Lineweaver–Burk plot can provide us with additional information on the overall rate-limiting step of the xanthine oxidation enzymatic reaction. The obtained overall rate constants at +400 mV and −100 mV were 0.034 and 0.104 AM−1 respectively. These values indicate very fast overall reaction rates with an effective enzymatic catalysis. Furthermore, the highest value obtained at −100 mV confirms that this is the best option for the measurement of xanthine. The Michaelis-Menten constant obtained at both potentials was 0.2 mM, similar to the obtained by other authors with other more complex biosensors [39]. This value indicates a high enzymatic activity.
Lineweaver–Burk graphs can also be used to identify the limiting step of an enzymatic oxidation reaction in biosensors with redox polymers as mediator in anaerobic measurements using the model developed by Savinell [40]. The reaction scheme includes diffusion of the substrate, the kinetics of the enzyme catalysis and of the enzyme–mediator interaction and the electrochemical regeneration of the mediator. In 2006, we reported an adaptation [19] of the Savinell’s model considering a new term relative to the presence of oxygen as natural mediator for oxidase enzymes. This extended model allows us to identify the rate-limiting step in the aerobic operation. The double reciprocal plots (Figure 9b) for both work potentials areas in agreement with the case I of the Savinell’s model, Case I, when the overall reaction rate is limited by a combination of the enzyme catalysis and the electron mediation reactions. This means that, in both cases, the applied potential is high enough that the rate of electrolysis is faster than the enzymatic catalysis and the electron mediation reactions and, consequently, neither the diffusion nor the electrolysis process controls the overall rate of the enzyme electrode. The Savinell model confirms that the selected potentials are adequate to measure Xanthine.
In view of all these results, we can assert that the new biosensor allows a new approach for the determination of xanthine, opening the possibility of using the anodic or cathodic zones depending on the possible presence of interfering substances. Furthermore, the new biosensor is very competitive with other reported xanthine biosensors (Table 4), offering wider linear ranges (LR), good limits of detection (LOD) and very good sensitivities, especially in the cathodic zone.

3.6. Interferences, Reproducibility, and Stability

Ascorbic acid (AA), uric acid (UA), and glucose are common interfering substances of the amperometric response of xanthine biosensors. In order to study the possible interference, these substances were investigated by amperometric measurements, at 0.4 and −0.1 V applied potentials. At 0.4 V, UA and glucose do not show any signal even at a 500-fold concentration of xanthine (40 μM). Unfortunately, AA has a similar oxidation potential and interferes the xanthine determination. Nevertheless, none of them caused interference at −100 mV. These results confirm the novelty provided by this new device: Its ability to determine xanthine with good sensitivity, in a wide range of concentration from 0.03 to 0.2 mM and from 0.2 to 0.8 mM, through the measurement of enzymatic oxygen consumption in a potential interfering-free.
The reproducibility of the biosensor was examined in a 100 μM xanthine solution (oxygen saturated), and the relative standard deviation was 1.5% (n = 5). The relative standard deviation of the electrode-to-electrode reproducibility assay was calculated to be 5.0%. The stability of the biosensors was evaluated during 24 days by intermittent measurements in presence of xanthine 100 μM, and their response remained unchanged during a period of 7 days. A 30% decrease of the initial response was detected for an electrode stored at 4 °C after the 24 days period.

3.7. Application to Fish Samples

The XO/PtNPs/FPP biosensor was applied for the determination of xanthine in hake and salmon meats. The samples were prepared as described in the Section 2.4, and the evolution of xanthine content was measured in a period of 1, 6, and 11 days by using the standard addition method. The results are in Table 5. Based on these results and the data provided by other authors, we can deduce that the sensor allows controlling the evolution of the formation of xanthine in the fish meat and therefore allows determining its degree of freshness. On the other hand, and according to other authors who have determined that the xanthine content in a freshly slaughtered fish (grass carp) was 0.04 ± 0.005 mg/5 g, we also deduce that the fish purchased in a local market was not as fresh as might be assumed.

4. Conclusions

Two new oxidase electrochemical sensors based on ferrocenyl polycyclosiloxane polymers (MFPP and FPP) and electro-synthesize Pt nanoparticles (PtNPS) have been developed. Both electrode types have been electrochemically and morphologically characterized. The kinetic studies demonstrated that the best electrocatalytical basis was the PtNPs/FPP modified electrode, with a homogeneous rate constant of 3.7 × 10⁵ s−1, and heterogeneous constants of 5.9 × 10⁴ M−1 s−1, 7.1 × 10³ and 2.7 × 10⁴ for the hydrogen peroxide oxidation and reduction, and the oxygen reduction respectively. The EIS results have demonstrated that the charge transfer process of the Fe(CN)64−/3− system was highly improved in the PtNPs/FPP electrode in comparison with the FPP and bare electrodes. The PtNPs/FPP modified electrode has been used as electrocatalytic platform to immobilize XO, and the system has been successfully used as versatile xanthine biosensor. The new device is able to work at both anodic and cathodic operation modes by measuring the oxidation of the hydrogen peroxide formed and either the oxygen consumption during the enzymatic reaction and the obtained Michaelis-Menten apparent constant indicates high enzymatic activity. The best conditions in the anodic measurements were at working potential of 0.4 V, with two wide linear sections (0.03–0.2 and 0.2–0.8 mM) and competitive LOD (30 nM) and sensibility (0.33 A M−1 cm−2). Furthermore, as already mentioned, this electrode shows the novelty of measuring xanthine through the enzymatic consumption of oxygen at potential −0.1 V with improved sensitivity of 1.10 A M−1 cm−2 in two wider linear ranges of 0.01–0.1 and 0.1–1.4 mM with low detection limit (48 nM). The new biosensor showed long-term stability and it has been successfully applied to the determination of xanthine in fish meat.

Supplementary Materials

The following are available online at https://0-www-mdpi-com.brum.beds.ac.uk/article/10.3390/chemosensors9040081/s1, Figure S1: Levich plots for catalytic oxidation of hydrogen peroxide with FPP, MFPP, PtNPs/FPP and PtNPs/FPP modified electrodes, Figure S2: Levich plots for catalytic reduction of hydrogen peroxide with FPP, MFPP, PtNPs/FPP and PtNPs/MFPP modified electrodes, Figure S3: Levich plot for catalytic reduction of oxygen at PtNPs/FPP modified electrode, Figure S4: Nyquist plot, fit and simulation, equivalent circuit and impedance data of Pt bare, Figure S5: Nyquist plot, fit and simulation, equivalent circuit and impedance data of a FPP modified electrode, Figure S6: Nyquist plot, fit and simulation, equivalent circuit and impedance data of a PtNPs/FPP modified electrode.

Author Contributions

Conceptualization, M.P.G.A. formal analysis, A.B. and M.P.G.A.; investigation, C.M.C., B.A. and M.P.G.A.; resources, C.M.C., B.A. and M.P.G.A.; data curation, A.B. and M.P.G.A. writing—original draft preparation, M.P.G.A.; writing—review and editing, M.P.G.A.; supervision, C.M.C., B.A., M.P.G.A.; project administration, M.P.G.A.; funding acquisition, B.A. and M.P.G.A. All authors have read and agreed to the published version of the manuscript.

Funding

This research was funded by the Spanish Dirección General de Proyectos de Investigación del Ministerio de Ciencia e Innovación (Projects No. CTQ-2009-12321-C02 and CTQ-2009-12321-C01).

Institutional Review Board Statement

Not applicable.

Informed Consent Statement

Not applicable.

Data Availability Statement

Not applicable.

Conflicts of Interest

The authors declare no conflict of interest.

References

  1. Dervisevic, M.; Dervisevic, E.; Senel, M.; Cevik, E.; Abasiyanik, F.M. Novel Amperometric Xanthine Biosensors Based on REGO-NP (Pt, Pd, and Au) Bionanocomposite Film. Food Anal. Methods 2017, 10, 1252–1263. [Google Scholar] [CrossRef]
  2. Sen, S.; Sarkar, P. A simple electrochemical approach to fabricate functionalized MWCNT-nanogold decorated PEDOT nanohybrid for simultaneous quantification of uric acid, xanthine and hypoxanthine. Anal. Chim. Acta 2020, 1114, 15–28. [Google Scholar] [CrossRef]
  3. Chena, J.; Lua, Y.; Yana, F.; Wua, Y.; Huanga, D.; Weng, Z. A fluorescent biosensor based on catalytic activity of platinum nanoparticles for freshness evaluation of aquatic products. Food Chem. 2020, 310, 125922. [Google Scholar] [CrossRef]
  4. Xue, G.; Yu, W.; Yutong, L.; Qiang, Z.; Xiuying, L.; Yiweia, T.; Jianrong, L. Construction of a novel xanthine biosensor using zinc oxide (ZnO) and the biotemplate method for detection of fish freshness. Anal. Methods 2019, 11, 1021–1026. [Google Scholar] [CrossRef]
  5. Dervisevic, M.; Dervisevic, E.; Şenel, M. Recent progress in nanomaterial-based electrochemical and optical sensors for hypoxanthine and xanthine. A review. Microchim. Acta 2019, 186, 749. [Google Scholar] [CrossRef] [PubMed]
  6. Wua, D.; Zhanga, M.; Chena, H.; Bhandari, B. Freshness monitoring technology of fish products in intelligent packaging. Crit. Rev. Food Sci. 2020, 61, 1279–1292. [Google Scholar] [CrossRef] [PubMed]
  7. Chen, Z.; Lina, Y.; Ma, X.; Guo, L.; Qiu, B.; Chena, G.; Lin, Z. Multicolor biosensor for fish freshness assessment with the naked eye. Sens. Actuators B 2017, 252, 201–208. [Google Scholar] [CrossRef]
  8. Borisova, B.; Sánchez, A.; Jiménez-Falcao, S.; Martín, M.; Salazar, P.; Parrado, C.; Pingarrón, J.M.; Villalonga, R. Reduced graphene oxide-carboxymethylcellulose layered withplatinum nanoparticles/PAMAM dendrimer/magnetic nanoparticleshybrids. Application to the preparation of enzyme electrochemicall biosensors. Sens. Actuators B 2016, 232, 84–90. [Google Scholar] [CrossRef]
  9. Chen, H.; Xiang, H.; Lei, H.; Zhang, D.; Liu, Y.; Qiu, Y.; Xu, L. Inhibition and molecular mechanism of diosmetin against xanthine oxidase by multiple spectroscopies and molecular docking. New J. Chem. 2020, 44, 6799–6809. [Google Scholar] [CrossRef]
  10. Wang, Z.; Ma, B.; Shen, C.; La, O.-M.; Tan, C.-P.; Cheong, L.-Z. Electrochemical Biosensing of Chilled Seafood Freshness by Xanthine Oxidase Immobilized on Copper-Based Metal–Organic Framework Nanofiber Film. Food Anal. Method. 2019, 12, 1715–1724. [Google Scholar] [CrossRef]
  11. Shan, D.; Wang, Y.; Xue, H.; Cosnier, S. Sensitive and selective xanthine amperometric sensors based on calcium carbonate nanoparticles. Sensor. Actuators B 2009, 136, 510–515. [Google Scholar] [CrossRef]
  12. Yazdanparast, S.; Benvidi, A.; Abbasi, S.; Rezaeinasab, M. Enzyme-based ultrasensitive electrochemical biosensor using poly(L-aspartic acid)/MWCNT bio-nanocomposite for xanthine detection: A meat freshness marker. Microchem. J. 2019, 149, 104000. [Google Scholar] [CrossRef]
  13. Pundir, C.S.; Devi, R. Biosensing methods for xanthine determination: A review. Enzyme Microb. Technol. 2014, 57, 55–62. [Google Scholar] [CrossRef]
  14. Yam, Y.; Kataho, N.; Watanabe, M.; Nakamura, T.; Asano, Y. Evaluation of beef aging by determination of hypoxanthine and xanthine contents: Application of a xanthine sensor. Food Chem. 1995, 52, 439–445. [Google Scholar] [CrossRef]
  15. Choudhury, S.R.; Umasankar, Y.; Bhushan, P.; Hirt, P.A.; MacQuhae, F.E.; Borda, L.J.; Lev-Tov, H.A.; Kirsner, R.; Bhansali, S. Nanocomposite Bienzymatic Sensor for Monitoring Xanthine in Wound Diagnostics. J. Electrochem. Soc. 2019, 166, B3295–B3301. [Google Scholar] [CrossRef]
  16. Sahyar, B.Y.; Kaplanb, M.; Ozsoz, M.; Celik, E.; Otles, S. Electrochemical xanthine detection by enzymatic method based on Ag doped ZnO nanoparticles by using polypyrrole. Bioelectrochemistry 2019, 130, 107327. [Google Scholar] [CrossRef] [PubMed]
  17. Casado, C.M.; Alonso, B.; Losada, J.; García-Armada, M.P.; Campagna, S.; Ceroni, P.; Puntoriero, F. (Eds.) Wiley Book on Designing Dendrimers; Wiley-VCH: Weinheim, Germany, 2012; pp. 219–262. ISBN 978-0-470-43355-3. [Google Scholar]
  18. Alonso, B.; García Armada, M.P.; Losada, J.; Cuadrado, I.; González, B.; Casado, C.M. Amperometric Enzyme Electrodes for Aerobic and Anaerobic Glucose Monitoring Prepared by Glucose Oxidase Immobilized in Mixed Ferrocene-Cobaltocenium Dendrimers. Biosens. Bioelectron. 2004, 19, 1617–1625. [Google Scholar] [CrossRef] [PubMed]
  19. García Armada, M.P.; Losada, J.; Zamora, M.; Alonso, B.; Cuadrado, I.; Casado, C.M. Electrocatalytical properties of polymethylferrocenyl dendrimers and their applications in biosensing. Bioelectrochemistry 2006, 69, 65–73. [Google Scholar] [CrossRef] [PubMed]
  20. Ospina, E.; García Armada, M.P.; Losada, J.; Alonso, B.; Casado, C.M. Polyferrocenyl Polycyclosiloxane/Gold Nanoparticles: An Efficient Electrocatalytic Platform for Immobilization and Direct Electrochemistry of HRP. J. Electrochem. Soc. 2016, 63, H826–H833. [Google Scholar] [CrossRef]
  21. García Armada, M.P.; Vallejo, E.; Villena, C.; Losada, J.; Casado, C.M.; Alonso, B. New acetaminophen amperometric sensor based on ferrocenyl dendrimers deposited onto Pt nanoparticles. J. Solid State Electrochem. 2016, 20, 1551–1563. [Google Scholar] [CrossRef]
  22. Villena, C.; Punjabi, D.; Casado, C.M.; Alonso, B.; Losada, J.; García Armada, M.P. Monodispersed Size-Controlled Gold Nanoparticles from Electrodeposited Aminoferrocenyl Dendrimer-Templates and Their Application as Efficient Hydrogen Peroxide Electrocatalyst. J. Electrochem. Soc. 2018, 165, B310–B322. [Google Scholar] [CrossRef]
  23. Casado, C.M.; Cuadrado, I.; Morán, M.; Alonso, B.; Lobete, F.; Losada, J. Synthesis of the first redox-active organometallic polymers containing cyclosiloxanes as frameworks. Organometallics 1995, 14, 2618–2620. [Google Scholar] [CrossRef]
  24. Casado, C.M.; Cuadrado, I.; Morán, M.; Alonso, B.; Barranco, M.; Losada, J. Cyclic siloxanes and silsesquioxanes as cores and frameworks for the construction of ferrocenyl dendrimers and polymers. Appl. Organomet. Chem. 1999, 13, 245–259. [Google Scholar] [CrossRef]
  25. Losada, J.; García Armada, M.P.; Cuadrado, I.; Alonso, B.; González, B.; Casado, C.M.; Zhang, J. Ferrocenyl and permethylferrocenyl cyclic and polyhedral siloxane polymers as mediators in amperometric biosensors. J. Organomet. Chem. 2004, 689, 2799–2807. [Google Scholar] [CrossRef]
  26. Murray, R.W. Molecular Design of Electrode Surfaces; Wiley: New York, NY, USA, 1992; ISBN 978-0-471-55773-9. [Google Scholar]
  27. Abruña, H. Electrode Modification with Polymeric Reagents. In Electro-Responsive Molecular and Polymeric Systems; Skotheim, T.A., Ed.; Marcel Dekker: New York, NY, USA, 1988; Volume 1, Chapter 3. [Google Scholar]
  28. Laviron, E. A multilayer model for the study of space distributed Redox modified electrodes. Part II. Theory and application of linear potential sweep voltammetry for a simple reaction. J. Electroanal. Chem. 1980, 112, 11–23. [Google Scholar] [CrossRef]
  29. Laviron, E. General expression of the linear potential sweep voltammogram in the case of diffusionless electrochemical systems. J. Electroanal. Chem. 1979, 101, 19–28. [Google Scholar] [CrossRef]
  30. Levich, V.G. Physicochemical Hydrodynamics; Prentice Hall: Englewood Cliffs, NJ, USA, 1982. [Google Scholar]
  31. Koutecky, J.; Levich, V.G. The application of the rotating disc electrode to studies of kinetic and catalytic processes. Zh. Fiz. Khim. 1958, 32, 1565. [Google Scholar]
  32. Munteanu, F.D.; Kubota, L.T.; Gorton, L. Effect of pH on the catalytic electrooxidation of NADH using different two-electron mediators immobilised on zirconium phosphate. J. Electroanal. Chem. 2001, 509, 2–10. [Google Scholar] [CrossRef]
  33. Peña, R.C.; Gamboa, J.C.M.; Bertotti, M.; Paixao, T.R.L.C. Studies on the electrocatalytic reduction of hydrogen peroxide on a glassy carbon electrode modified with a ruthenium oxide hexacyanoferrate film. Int. J. Electrochem. Sci. 2011, 6, 394–403. [Google Scholar]
  34. Gomez-Marin, A.M.; Feliu, J.M.; Ticianelli, E.A. Oxygen reduction on platinum surfaces in acid media: Experimental evidence of a CECE/DISP initial reaction path. ACS Catal. 2019, 9, 2238–2251. [Google Scholar] [CrossRef]
  35. Ma, R.; Lin, G.; Zhou, Y.; Liu, Q.; Zhang, T.; Shan, G.; Yang, M.; Wang, J. A review of oxygen reduction mechanisms for metal-free carbon-based electrocatalysts. NPJ Comput. Mater. 2019, 5, 78. [Google Scholar] [CrossRef]
  36. Lide, R. (Ed.) “Diffusion of gases in water” and “Solubility of selected gases in water”. In CRC Handbook of Chemistry and Physics; Internet Version 2005; CRC Press: Boca Raton, FL, USA, 2005. [Google Scholar]
  37. Katz, E.; Willner, I. Probing Biomolecular Interactions at Conductive and Semiconductive Surfaces by Impedance Spectroscopy: Routes to Impedimetric Immunosensors, DNA-Sensors, and Enzyme Biosensors. Electroanalysis 2003, 15, 913–947. [Google Scholar] [CrossRef]
  38. Bard, A.J.; Faulkner, L.R. Electrochemical Methods. Fundamentals and Applications, 2nd ed.; John Wiley & Sons, Inc.: New York, NY, USA, 2001; p. 381. [Google Scholar]
  39. Dalkıran, B.; Erden, P.E.; Kılıç, E. Amperometric biosensors based on carboxylated multiwalled carbon nanotubes-metal oxide nanoparticles-7,7,8,8-tetracyanoquinodimethane composite for the determination of xanthine. Talanta 2017, 167, 286–295. [Google Scholar] [CrossRef]
  40. Chen, C.J.; Liu, C.C.; Savinell, R.F. Polymeric redox mediator enzyme electrodes for anaerobic glucose monitoring. J. Electroanal. Chem. 1993, 348, 317–338. [Google Scholar] [CrossRef]
  41. Khan, M.Z.H.; Ahommedb, M.S.; Daizy, M. Detection of xanthine in food samples with an electrochemical biosensor based on PEDOT:PSS and functionalized gold nanoparticles. RSC Adv. 2020, 10, 36147. [Google Scholar] [CrossRef]
  42. Dodevska1, T.; Horozova, E.; Dimcheva, N. Design of an amperometric xanthine biosensor based on a graphite transducer patterned with noble metal microparticles. Cent. Eur. J. Chem. 2010, 8, 19–27. [Google Scholar] [CrossRef]
  43. Bas, S.Z.; Gülce, H.; Yıldız, S.; Gülce, A. Amperometric biosensors based on deposition of gold and platinum nanoparticles on polyvinylferrocene modified electrode for xanthine detection. Talanta 2011, 87, 189–196. [Google Scholar] [CrossRef]
  44. Magro, M.; Baratella, D.; Venerando, A.; Nalotto, G.; Basso, C.R.; Molinari, S.; Salviulo, G.; Ugolotti, J.; Pedrosa, V.A.; Vianello, F. Enzyme immobilization on maghemite nanoparticles with improved catalytic activity: An electrochemical study for xanthine. Materials 2020, 13, 1776. [Google Scholar] [CrossRef] [PubMed]
  45. Hughes, L.B.; Labban, N.; Conway, G.E.; Pollock, J.A.; Leopold, M.C. Adaptable xerogel-layered amperometric biosensor platforms on wire electrodes for clinically relevant measurements. Sensors 2019, 19, 2584. [Google Scholar] [CrossRef]
Scheme 1. Hypoxanthine and xanthine oxidation mechanisms.
Chemosensors 09 00081 sch001
Scheme 2. Structure of the ferrocenyl (FPP) and permethylferrocenyl (MFPP) polymers.
Chemosensors 09 00081 sch002
Figure 1. Cyclic voltammograms of Pt electrodes modified with MFPP and FPP (Γ ≅ 3 × 10⁻¹⁰ mol Fc cm−2) in non-aqueous (TBAH 0.1 M/acetonitrile) and aqueous (phosphate buffer pH 7.0 0.01 M/NaClO4 0.1 M) (dashed lines) media at scan rate 100 mV s−1.
Chemosensors 09 00081 g001
Figure 2. Cyclic voltammograms of (a) ferrocenyl polycyclosiloxane polymers FPP (Γ = 3.4 × 10⁻¹⁰ mol Fc cm−2)) and (b) MFPP (Γ = 3.4 × 10⁻¹⁰ mol Fc cm−2), (c) Pt nanoparticles (PtNPS)/FPP (Γ = 4.2 × 10⁻¹⁰ mol Fc cm−2), and (d) PtNPs/MFPP (Γ = 3.6 × 10⁻¹⁰ mol Fc cm−2) modified electrodes in acetonitrile/tetra-n-butylammonium hexafluorophosphate (TBAH) (0.1 M); scan rates: 0.1, 0.2, 0.3, 0.4, 0.5, 1, 1.5 and 2 V/s. Insets: Dependence of the corresponding anodic peak currents on v0.6.
Chemosensors 09 00081 g002
Figure 3. UHRSEM micrograph of (a) a FPP modified platinum wire electrode and (b) PtNPs electrodeposited on the FPP film as template.
Chemosensors 09 00081 g003
Figure 4. Anodic cyclic voltammograms of MFPP and PtNPs/MFPP (a), FPP and PtNPs/FPP (b) modified electrodes (Γ ≅ 3 × 10⁻¹⁰ mol Fc/cm2 thickness film) in absence and presence of hydrogen peroxide 1 mM in deaerated 0.01 M phosphate buffer (pH 7.0)/NaClO4 0.1 M as supporting electrolyte. (c,d) Cathodic cyclic voltammograms of the same PtNPs/MFPP and PtNPs/FPP modified electrodes respectively, in the same dissolution. The black cyclic voltammograms correspond to a Pt bare electrode in presence of hydrogen peroxide 1 mM in the same supporting electrolyte. Scan rate 5 mV/s.
Chemosensors 09 00081 g004
Figure 5. Slopes and intercepts of anodic (a,b) and cathodic (c,d) Koutecky–Levich plots vs. [H2O2]−1 at the modified electrodes with average coverages of 4.22 × 10⁻¹⁰ mol Fc cm−2 (MFPP), 1.89 × 10⁻¹⁰ mol Fc cm−2 (PtNPs/MFPP), 4.72 × 10⁻¹⁰ (FPP) and 3.33 × 10⁻¹⁰ mol Fc cm−2 (PtNPs/FPP). All measurements were in 0.01 M phosphate buffer (pH 7.0) and NaClO4 0.1 M as supporting electrolyte. The data showed are the average values of at least five electrodes.
Chemosensors 09 00081 g005
Figure 6. (a) Cyclic voltammograms of a bare Pt electrode, PtNPs/MFPP and PtNPs/FPP modified electrodes (Γ ≅ 5 × 10⁻¹⁰ mol Fc cm–2 thickness film) in an oxygen saturated (24 °C) phosphate buffer (pH = 7.0)/NaClO4 (0.1 m) solution; scan rate: 5 mV s–1. (b) Koutecky–Levich plot for the PtNPs/FPP electrodes the same solution (average values of at least five electrodes).
Chemosensors 09 00081 g006
Figure 7. Nyquist plots of Pt bare, and FPP and PtNPs/FPP modified electrodes in a 10 mM K4[Fe(CN)6]/K3[Fe(CN)6] solution. Inset: Equivalent circuit obtained from fit and simulation of the EIS data (χ² = 0.0044754; 0.0141 and 0.0027942 respectively). The experiment was repeated with at least five electrodes without significant differences.
Chemosensors 09 00081 g007
Figure 8. Steady-state response of biosensor in presence of xanthine 0.2 mM in an oxygen saturated (24 °C) phosphate buffer (pH = 7.0)/NaClO4 (0.1 m) solution at several potential values. RDE at 500 rpm.
Chemosensors 09 00081 g008
Figure 9. (a) Calibration plots obtained at both measuring potentials in stirred oxygen saturated (24 °C) phosphate buffer (pH = 7.0)/NaClO4 (0.1 M) solution. RDE at 500 rpm. (b) Lineweaver–Burk plots at 400 and −100 mV in the same conditions. Each value is the mean result for at least five electrodes. Inset: Amperometric responses of the biosensor to the consecutive addition of 20 μM of xanthine at −100 mV (upper inset) and at 400 mV (bottom inset).
Chemosensors 09 00081 g009
Table 1. Characterization of the electrodeposited redox system at the modified electrodes. Electrochemical and kinetic parameters.
Electrode.E0′ (V)αk1 (s−1)
FPP0.0160.60 [20]2.5 × 10⁵ [20]
PtNPs/FPP0.0440.543.7 × 105
MFPP−0.2550.532.6 × 105
PtNPs/MFPP−0.2700.521.6 × 105
Table 2. Results of the kinetic studies of hydrogen peroxide and oxygen catalysis.
ElectrodeH2O2 OxidationH2O2 ReductionO2 Reduction
D (cm2 s−1)kobs (M−1 s−1)D (cm2 s−1)kobs (M−1 s−1)nkobs (M−1 s−1)
FPP1.1 × 10−51.8 × 1042.9 × 10−54.5 × 10³
PtNPs/FPP1.6 × 10−55.9 × 1043.1 × 10−57.1 × 1031.82.7 × 104
MFPP1.2 × 10−52.0 × 1041.1 × 10−52.2 × 10³
PtNPs/MFPP9.7 × 10−62.6 × 1041.3 × 10−59.0 × 10³
Table 3. EIS results for Pt bare, and FPP and PtNPs/FPP modified electrodes.
ElectrodeRCT (Ω)CPE (μF)ni0 (μA)k0 (cm s−1)
Pt Bare324.290.8297911.17 × 10−2
FPP3794.350.821681.01 × 10−3
PtNPs/FPP301246.50.4558591.27 × 10−2
Table 4. Comparison of analytical characteristics of some electrochemical xanthine biosensors.
ElectrodeE (V)MethodLOD (μM)LR (μM)Sensitivity (A M−1 cm−2)
XOD/nanoAg-ZnO/Ppy/PGE [18]+0.7Amp0.070.06–0.60.03 *
P(Vfc-GMA)/REGO-Pt [1]+0.35Amp0.0031–4021.98 *
MWCNT/Au/XO/HRP [2]−0.44Amp1.322–4000.156
XOD/c-MWCNTs/Fe3O4/TCNQ/CHIT/GCE [40]+0.30Amp0.21.9–2300.025
XO/MNP-PAMAM_PtNP/rGO-CMC/GCE [8]+0.60Amp0.0130.05–120.140
GCE/PEDOT:PSS-AuNPs [41]+0.78DPV0.030.05–100.583 *
XOD@Cu-MOF/SA/GCE [11]+0.65DPV0.0640.01–106.74
(70%Pd, 30% Pt)/Graphite [42]−0.05Amp1.51.5–700.23 *
XO/Pt/PVF/Pt [43]+0.40Amp0.62–6600.021
SAMN@XO [44]+0.10DPV0.11–100.0094 *
Pt/PtMS(XOx)/100%HPU [45]+0.35Amp1.71.7–500.0022 *
XO/PtNPs/FPP [this work]+0.40

−0.10
Amp

Amp
0.030

0.045
30–200
200–800
10–100
100–1400
0.33
0.13
1.10
0.18
* Electrode area no reported.
Table 5. Results of the determination of xanthine in fish samples.
Fish Typemg Xanthine/g Fish
Day 1Day 6Day 11
Hake0.090.861.10
Salmon0.520.810.95
Mean standard deviation ± 0.006 mg/g.
Publisher’s Note: MDPI stays neutral with regard to jurisdictional claims in published maps and institutional affiliations.

