Article

Dual Transduction of H2O2 Detection Using ZnO/Laser-Induced Graphene Composites

1
i3N, Department of Physics, University of Aveiro, 3810-193 Aveiro, Portugal
2
CICECO—Aveiro Institute of Materials, Department of Physics, University of Aveiro, 3810-193 Aveiro, Portugal
*
Author to whom correspondence should be addressed.
Submission received: 26 March 2021 / Revised: 30 April 2021 / Accepted: 1 May 2021 / Published: 5 May 2021
(This article belongs to the Collection Sustainable Metal Oxide Materials for Sensing Applications)

Abstract

:
Zinc oxide (ZnO)/laser-induced graphene (LIG) composites were prepared by mixing ZnO, grown by laser-assisted flow deposition, with LIG produced by laser irradiation of a polyimide, both in ambient conditions. Different ZnO:LIG ratios were used to infer the effect of this combination on the overall composite behavior. The optical properties, assessed by photoluminescence (PL), showed an intensity increase of the excitonic-related recombination with increasing LIG amounts, along with a reduction in the visible emission band. Charge-transfer processes between the two materials are proposed to justify these variations. Cyclic voltammetry (CV) and electrochemical impedance spectroscopy evidenced increased electron transfer kinetics and an electrochemically active area with the amount of LIG incorporated in the composites. As the composites were designed to be used as transducer platforms in biosensing devices, their ability to detect and quantify hydrogen peroxide (H2O2) was assessed by both PL and CV analysis. The results demonstrated that both methods can be employed for sensing, displaying slightly distinct operation ranges that allow extending the detection range by combining both transduction approaches. Moreover, limits of detection as low as 0.11 mM were calculated in a tested concentration range from 0.8 to 32.7 mM, in line with the values required for their potential application in biosensors.

1. Introduction

Zinc oxide (ZnO) is a well-known wide bandgap material (Eg~3.3 eV at 300 K [1]) that prevails as one of the most explored semiconductor metal oxides nowadays [2,3,4,5,6,7]. Indeed, ZnO properties remain extremely appealing for several technological applications, namely its piezoelectricity, high-energy radiation stability, non-toxicity, biocompatibility, improved electrical and optical responses as well as the ability to be grown by simple and low-cost techniques, enabling the production of numerous and tailored morphologies [1,2,5,8,9]. From the point of view of the optical emission properties, one major advantage is its large free-exciton binding energy (60 meV), which allows the observation of excitonic-related emissions even above room temperature (RT). On the other hand, carbon materials, especially graphene and its derivatives such as graphene oxide (GO) and reduced GO (rGO), have received considerable attention due to their unique physicochemical properties. Among these, one can highlight the large surface area, mechanical properties, acceptable biocompatibility, excellent thermal and electrical conductivity (except for GO), and increased safety and ease of production in comparison to other carbon-based nanomaterials [10,11,12].
Engineering new functional materials based on the above-mentioned ones by combining their properties has been an intensive topic of research by the scientific community due to potential synergies [13,14,15,16,17]. In fact, such a combination has already been explored by our research team [15,18] with effective results. For instance, flexible membranes composed of multi-walled carbon nanotubes (MWCNT) mixed with either tetrapods or nanoparticles of ZnO produced by laser-assisted flow deposition (LAFD) showed a strong RT photoluminescence (PL) signal from ZnO, together with electrical properties associated with the CNTs [15]. Likewise, a study on ZnO deposited by LAFD on vertically aligned arrays of CNTs demonstrated a 4-fold increase in the PL intensity [18]. This synergetic interaction can be beneficial for a wide range of applications, from supercapacitors to photocatalysts, photodetectors, or sensors, just to name a few [13,16,19,20,21,22,23,24].
Indeed, biosensing is a field where ZnO/carbon composites have been gaining remarkable attention in the last decade. Such composites have been applied in the detection of several biological and health-relevant analytes such as glucose [23,25,26,27], DNA [28], or cancer biomarkers [29,30], among others [31,32,33]. Many biosensors, namely the enzymatic ones, rely on the detection and quantification of sub-products that result from the catalytic reactions between the bioreceptor and the analyte, among which hydrogen peroxide (H2O2) is one of the most common. Therefore, by detecting and quantifying the presence of this compound, produced when the substrate (analyte) is exposed to its complementary enzyme and reacts within its active site, it is possible to indirectly quantify the target analyte [34,35,36]. The detection of the H2O2 produced by oxidoreductase enzymes (e.g., glucose oxidase (GOx), cholesterol oxidase) [34] is the basis of many of the widely spread glucose sensors for monitoring diseases such as diabetes mellitus [37,38] as well as some cholesterol biosensors [39,40]. Indeed, GOx is a model enzyme specific for glucose that acts as the bioreceptor in many biosensors for glucose detection (the most widely researched bioanalyte). Thus, taking as an example such biosensors, many papers reporting on ZnO/carbon composites as transducers have been published [23,25,26,27,41,42]. Although most of them rely on direct electron transfer (DET) between the enzyme and the electrode as the detection mechanism, some have reported on the monitoring of H2O2 for analyte quantification [41,42]. For instance, Muthuchamy et al. [41] described the use of ZnO nanoparticles embedded in nitrogen-doped carbon sheets (ZnO@NDCS) deposited on glassy carbon as electrodes for the development of an enzymatic glucose sensor. In their sensor, the ZnO@NDCS were prepared by the hydrothermal method and functionalized with GOx after deposition on the glassy carbon electrode (GCE). The GCE/ZnO@NDCS/GOx sensors were then probed in a three-electrode cell setup where the GCE/ZnO@NDCS/GOx biosensor operated as the working electrode. The glucose detection was conducted by cyclic voltammetry (CV), differential pulse voltammograms (DPV), and chronoamperometry, all in phosphate-buffered saline (PBS) solution containing different glucose concentrations. H2O2 production upon redox reaction between GOx and glucose was monitored via DPV, evidencing that such methodology can be used to assess the concentration of glucose. The authors reported a linear range between 0.2–12mM, with a sensitivity of 231.7 μAmM−1cm−2, and a limit of detection (LOD) of 6.3 μM [41].
Among the different carbon materials, laser-induced graphene (LIG) has been receiving outstanding attention since the announcement of its discovery in 2014 [43] and numerous works are published every day regarding this material and its applications [44,45,46,47,48,49,50,51,52]. LIG is a 3D porous material with a foam-like morphology obtained by the photothermal conversion of carbon-containing materials by direct laser scribing (DLS) at ambient conditions. The first material used as a precursor was commercial polyimide, [C22H10O5N2]n (Kapton®), using a CO2 laser to promote the LIG formation. Nevertheless, soon after, other precursor materials (e.g., cork, paper, textiles, wood, and even bread) and laser wavelengths were proven to also lead to good quality LIG [43,45,46,52,53,54,55]. In this way, a material with electrical characteristics comparable to those encountered in high-quality rGO, namely regarding electrical conductivity, can be produced in a simple, prompt, and low-cost procedure that can be complemented with patterning possibility due to the computer-controlled laser scribing system typically used [46,53,54]. Moreover, recent reports suggest that LIG does not display toxic effects, being considered biocompatible, which enables its usage in biological applications [56]. Even though several works have reported on the formation of LIG composites with some metal oxides such as Co3O4, MoO2, and Fe3O4 [53,57,58], the exploitation of ZnO/LIG composites has only been addressed in recent ones [21,24,54]. In 2019, our team published a work demonstrating the possibility of synthesizing ZnO/LIG composites in a unique laser-processing step, leading to flexible samples of porous LIG decorated with ZnO microparticles [54]. However, their emission properties were seen to be inferior to the ones of the previously prepared ZnO/carbon composites where LAFD produced ZnO was employed [15,18].
In this work, we report the preparation of new ZnO/LIG composites aiming to be applied as optical and electrochemical transducers for biosensors. These composites were thoroughly characterized by morphological, structural, optical, and electrochemical techniques, and their properties are discussed in detail to shed some light on their influence for future technological applications, in particular, the envisaged sensing ones.
Up to now, most state-of-the-art biosensors rely on probing the changes of only one physical property, in particular, an electrochemical-related one. However, the phenomena responsible for the variation of such a property are also likely to affect others (e.g., the PL outcome), giving additional and complementary data to improve detection, namely increasing sensitivity and selectivity, which are crucial figures of merit for sensing. Hence, here, the response of both optical (via PL) and electrochemical (via CV) signals were analyzed in the presence of different concentrations of H2O2, and calibration curves were established for this analyte. PL was selected as one of the transduction signals since, although not widely explored, this is a technique extremely sensitive to surface phenomena, which is indeed where the interaction between the sensing layer and the analyte takes place. Thus, it is possible to assess charge transfer processes, surface charge fluctuations, and other physical interactions that may occur during a sensing event [5,6,59,60,61]. In the particular case of H2O2, some reports in the literature [60,62,63,64] have indicated that H2O2 decomposes catalytically on the ZnO surface into H2O and O2. The oxygen resultant from this reaction is highly reactive and can induce changes in the ZnO surface-related defects that subsequently lead to variation in the PL output, which correlates with the H2O2 concentration, enabling its detection and quantification. Moreover, as seen in the present work, the PL signal of H2O2 itself can also be useful for transduction. Hence, as PL signals are highly sensitive to even slight variations in the semiconductor surface properties/conditions, using such transduction signals is expected to enable a sensing response that can perceive small analyte concentration changes, providing high sensitivity and selectivity to the sensors based onsuch signal [5,6,59]. Additionally, CV was chosen due to its good sensitivity and selectivity, as well as its good adequacy to detect this analyte via electrochemical analysis [65,66]. In fact, together with amperometry measurements, CV is one of the most common methods for H2O2 detection, which also enables us to compare the here obtained results with the ones currently reported for the state-of-the-art sensors. The conjugation of these two types of signals is expected to provide enhanced data acquisition and counter-proof measurements in a single sample/device, thus minimizing detection errors, which is quite advantageous in sensing devices.

2. Materials and Methods

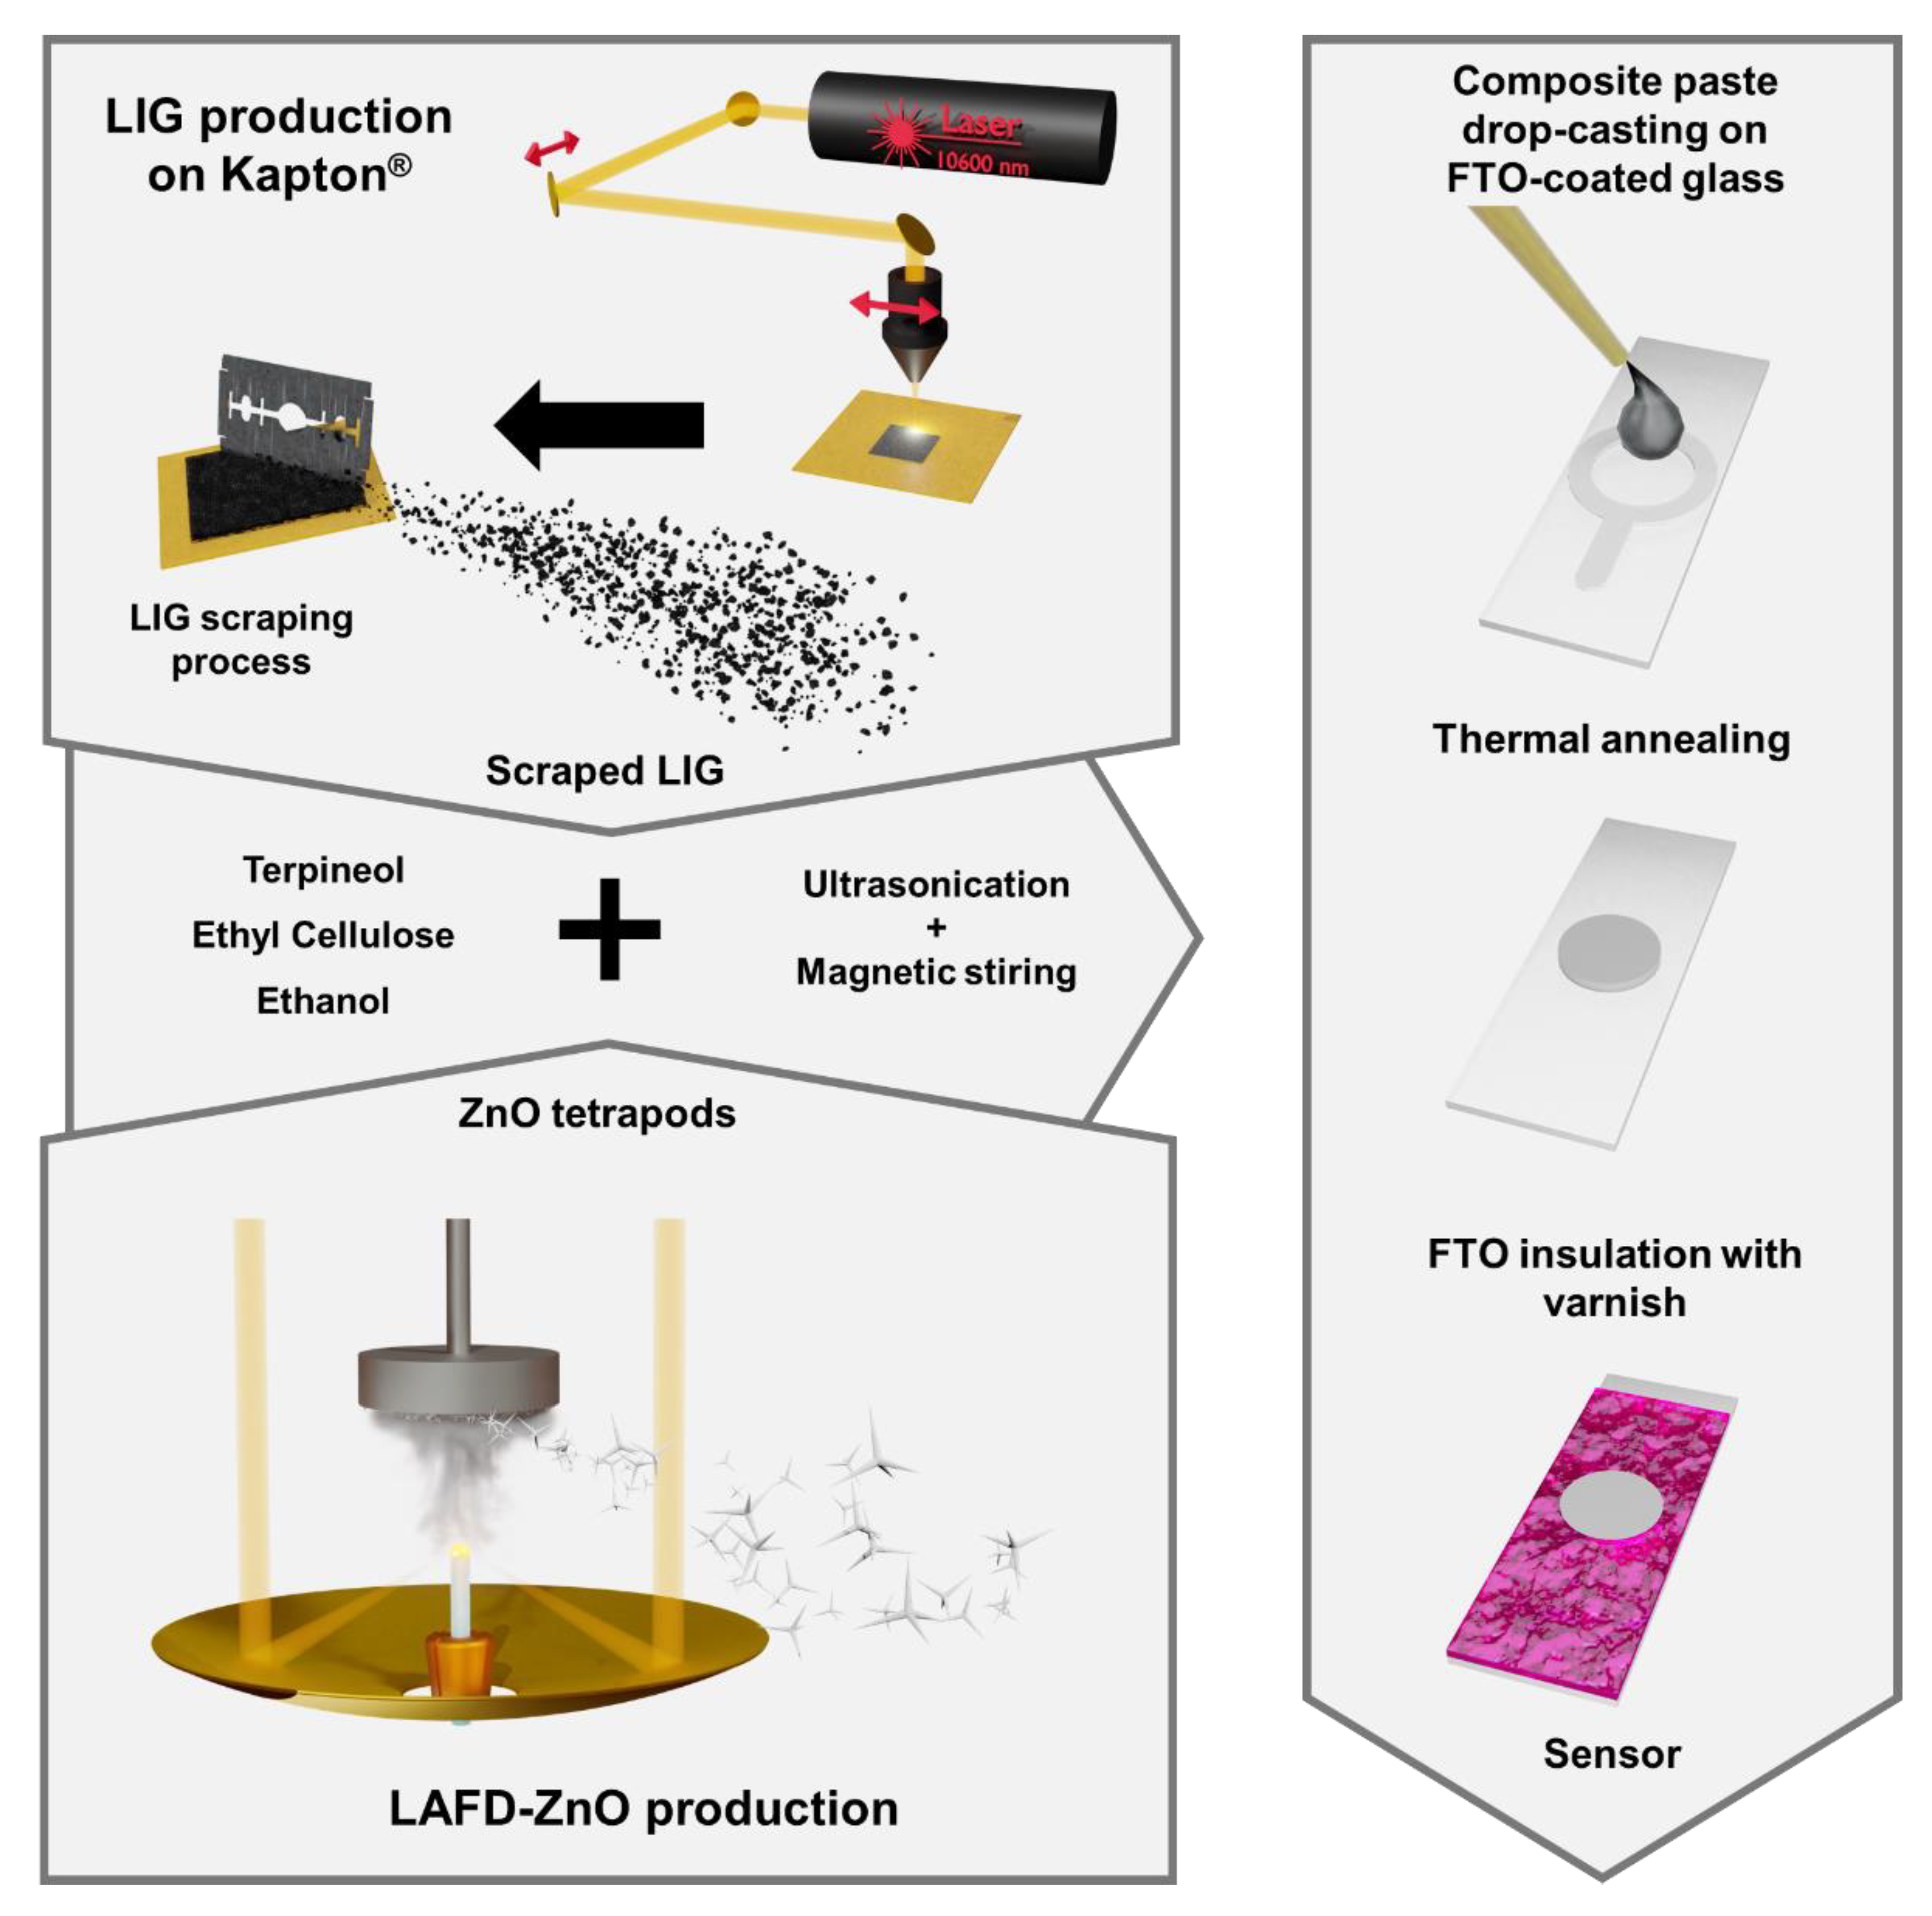
2.1. Materials’ Preparation

The ZnO/LIG composites were prepared by a multi-step approach, in which the two components were synthesized separately and then mixed in the desired ratios. To do so, LIG was produced by direct laser scribing on a polyimide sheet (Kapton®, HN500, DuPont, Wilmington, Delaware, DE, USA) using a continuous wave (cw) CO2 laser (Redsail M500, Jinan, Shandong Province, China) with a wavelength of 10.6 µm, a maximum power output of 50 W, and a beam diameter of ~100 µm. This process relies on a photothermal process that is induced by the highly localized temperatures (T > 2500 °C) attained by the focused laser beam [43]. As this process takes place, there is a breakage of the carbonyl groups, accompanied by a release in gases as CO, H2, N2, CO2, and even CH4 [67,68], followed by the rearrangement of the aromatic compounds to produce few-layer graphene nanostructures, whose oxidation is minimized by the presence of a plasma formed by the expelled gases [43,69]. The protruded and highly porous structure is mostly due to the release of these gases [70]. The laser processing conditions were chosen as follows: (i) power output of ~12 W; (ii) scan speed of 250 mm s−1; (iii) distance between scanning lines of 0.075 mm; and (iv) distance to focus of 1.8 mm (slightly defocused conditions). These parameters were selected according to previous work from our group [51,54]. The as-prepared LIG was then carefully scraped from the polyimide substrate with the aid of a razor blade, resulting in a fine powder (see a schematic representation in Figure 1).
ZnO was produced by laser-assisted flow deposition, whose detailed description can be found elsewhere [71,72,73]. In brief, LAFD is a technique based on a thermal evaporation process that uses a highly focused CO2 laser (200 W, Spectron Laser Corp, Azusa, CA, USA) as the heating source. This laser is coupled to a reflective optical setup that creates a circular crown-shaped laser incidence on top of the ZnO precursor rod, previously prepared by a cold extrusion procedure from a mixture of commercial ZnO powder (99.7%, AnalaR, VWR Chemicals, Radnor, PE, USA) and polyvinyl alcohol (0.1 g mL−1 in aqueous solution, Merck, Darmstadt, Germany), resulting in cylindrical-shaped precursor rods that are attached to motors that enable axial and rotational motion. Then, the laser beam hits the top of the precursor, promoting its thermal decomposition and leading to the formation of a vapor composed of the ZnO atomic components, which reacts with each other again (as well as with the oxygen present in the atmosphere), forming the new ZnO micro/nanocrystals [71,74,75]. In the here reported ZnO, the growth was carried out in air and a laser power of 60 W was chosen since it allows the formation of mostly tetrapodal morphologies at a high deposition rate [71]. The selection of such morphology was motivated by their high yield of production as well as their branching geometry, which provides a large surface area that is extremely beneficial for sensing purposes. Table S1 in the Supplementary Materials (SM) file summarizes the growth/synthesis condition for both materials.
For the preparation of the composites, 1 and 5 mg of scraped LIG were mixed with 50 mg of ZnO, respectively. This approach has the advantage of allowing for the control of the weight ratio of both components that comprise the composite, unlike previously reported ones [54]. The weighted powders were mixed with organic compounds, ethylcellulose (Sigma-Aldrich, Munich, Germany), terpineol (C10H18O, Sigma-Aldrich, Munich, Germany), and ethanol (absolute, analytical reagent grade, Fisher Chemical, Pittsburgh, PE, USA) to form a viscous paste for subsequent deposition into the desired substrates. The mixture was kept under magnetic stirring for 15 min, followed by an ultrasonic bath for 30 min, and another 15 min under magnetic stirring to obtain a homogeneous paste, which was then deposited on fluorine-doped tin oxide (FTO)-coated glass substrates. The paste was deposited in a 5 mm diameter circular area with the aid of a polymeric mask, assuring that the same area and thickness were kept constant for all samples. After deposition, the samples were subjected to a thermal treatment in air (10 min at 100 °C, followed by 30 min at 400 °C, with a heating rate of 5 °C min−1) to thermally release the organic compounds present in the deposition paste and to increase the adhesion of the ZnO to the substrate [6,74]. ZnO samples (without LIG), as well as scraped LIG, were also prepared under the same conditions to act as reference samples and to compare their properties with those of the composites. Figure 1 displays a schematic representation of all steps involved in the preparation of these composites, while Figure S1 (supplementary materials), in SM, shows images of the samples obtained after the thermal annealing treatment. Hereafter, the ZnO (without LIG), ZnO mixed with 1 mg and 5 mg of LIG samples deposited on the FTO-coated glass substrates, will be named ZnO, ZnO-LIG1, and ZnO-LIG5, respectively, for simplicity.

2.2. Material Characterization

The morphology of the samples was studied by scanning electron microscopy (SEM) using a TESCAN Vega3 SBH SEM microscope (TESCAN, Libušina, Czech Republic). The crystalline structure was assessed by micro-Raman at RT in backscattering configuration on a Horiba Jobin Yvon HR800 spectrometer (Horiba Scientific, Kyoto, Japan) equipped with a 600 grooves mm−1 grating, under the incidence of a 442 nm laser line of a He–Cd laser (Kimmon IK Series, Fukushima, Japan), and focused with an objective of ×50 magnification.
The optical properties of the samples were evaluated at RT by steady-state PL and PL excitation (PLE) spectroscopy in a Fluorolog-3 Horiba Scientific setup with a double additive grating Gemini 180 monochromator (1200 grooves mm−1 and 2 × 180 mm) in the excitation and a triple grating iHR550 spectrometer in the emission (1200 grooves mm−1 and 550 mm). A 450 W Xe lamp was used as the excitation source. The PLE was measured by setting the detection monochromator at the maxima of the emission that one wanted to probe and emission intensity was registered as the excitation was scanned to higher energies. Moreover, the samples were also placed on a cold finger He cryostat, allowing them to cool down to 14 K. The samples were then probed under the excitation of the 325 nm (~3.81 eV, which corresponds to the ZnO above bandgap excitation) line of a cw He–Cd laser (power density I0 < 0.6 W cm−2, Kimmon IK Series, Fukushima, Japan), and the luminescence radiation was dispersed by a SPEX 1704 monochromator (1 m, 1200 grooves mm−1) and detected with a cooled Hamamatsu R928 photomultiplier. Their PL signal was assessed from 14 K to RT. In this case, the experiments were carried out under a 90° geometry and both the optical alignment and the probed region were kept fixed during the whole temperature-dependence study to enable proper comparison between the absolute intensity and spectral shape throughout the entire temperature range.
The electrochemical analysis was conducted by CV and electrochemical impedance spectroscopy (EIS) using a Versastat 3 electrochemical station (Princeton Applied Research, Princeton, NJ, USA) equipped with a homemade three-electrode configuration setup, where the prepared samples acted as the working electrode, a platinum wire was used as counter electrode and Ag/AgCl (1 M KCl) as the reference one. CV was performed either using a physiological solution (PS) as the electrolyte or using 10 mM of ferrocyanide (potassium hexacyanoferrate (II) trihydrate, K4[Fe(CN)6]·3H2O, from Merck, Darmstadt, Germany) prepared in PS. The PS was prepared by dissolving 8.006 g of NaCl (Sigma-Aldrich, Munich, Germany) and 2.012 g of KCl (Sigma-Aldrich, Munich, Germany) in 1 L of deionized (DI) water. DI water was obtained from a MilliQ water purification system (resistivity of 18.2 MΩ cm). The electrolyte solution was stirred and bubbled with N2 for 30 min. The heterogeneous electron transfer rate constants (k0) were derived from cyclic voltammograms using the Nicholson method [76,77]. A dimensionless kinetic parameter Ψ is obtainable by [78]
Ψ = 0.6288 + 0.0021 Δ E p ( v )   1 0.017 Δ E p ( v )   ,
where v is the potential scan rate and Δ E p is the potential difference between the voltammograms anodic and cathodic peaks. The k0 value is calculated through the slope of the following relation (for a single electron, n = 1, transfer reaction) [76,77]:
Ψ = k e f f 0 ( π F D v R T ) 1 2 ,
where F is the Faraday constant (96,485.33 C mol−1); R is the universal gas constant (8.314 J mol−1 K−1); T is the absolute temperature (298.15 K); and D is the diffusion coefficient for ferri/ferrocyanide in aqueous solutions (6.66 × 10⁻⁶ cm2 s−1 [79]).
The faradaic electrochemically active area (Aeff, cm2) was obtained from the [Fe(CN)6]4− anodic branches in CV via the Randles–Ševčík relation (at 25 °C and for n = 1) [76],
i p = 0.269 A e f f C ( D v ) 1 2   ,
where i p is the peak current (A) and C is the [Fe(CN)6]4−concentration in mM (10 mM).
In the case of the EIS measurements, the electrolyte consisted of a mixture of 5 mM of ferrocyanide and 5 mM of ferricyanide (potassium hexacyanoferrate(III), K3[Fe(CN)6], from Merck) in PS. Measurements were performed within the 10 kHz to 1 Hz range, with a logarithmic distribution of 20 points per decade and applying a 10 mV AC perturbation upon the open circuit potential (0.21 V vs. Ag/AgCl). Equivalent circuit models were assembled via Gamry’s E-Chem Analyst software (Gamry Instruments, Warminster, PE, USA) and fittings were performed using the built-in Levenberg–Marquart algorithm.

2.3. H2O2 Sensing

Both the PL and electrochemical signals were studied in the presence of H2O2 to evaluate the adequacy of the here produced composites to detect this compound and be used as transducer platforms in biosensing devices. The experimental setups used are depicted in Figure S2 in SM. In the case of the PL experiments, the samples deposited on FTO-coated glass substrates were fixed on the cold finger of the He cryostat and immersed in a quartz cuvette filled with H2O2 solutions (diluted using PS) with different concentrations of 0.9, 1.8, 4.4, 8.7, 17.0, and 32.7 mM. It is worth mentioning that these concentrations were selected since it is the range of interest for glucose detection, which is typically found to be 40–500 mg dL−1 (2.2–27.8 mM). During the tests, the cuvette support was fixed to an elevator table that only allowed vertical motion (Figure S2a), thus enabling the removal of the cuvette after recording the signal for each solution without changing the sample position and the optical alignment. All experiments were carried out under the same conditions described above for the characterization measurements. The signal was first assessed when the samples were immersed in PS. As the intensity of the PL spectra was seen to be influenced by immersion time, several spectra were acquired until signal stabilization was attained (measurements conducted up to 3 h). After that, the last recorded spectrum was considered as the reference/blank (0 mM of H2O2). Then, the samples were placed in the solution with the lowest H2O2 concentration and the signal was collected after ~5 min of immersion under UV radiation as the signal monitored at the maximum of the UV emission was rather stable after that time. After the acquisition, the sample was placed again in PS for ~5 min (without irradiation) to stop the reaction with the H2O2. This procedure was adopted for each solution with increasing concentration.
In the case of the electrochemical assessment (Figure S2b), the H2O2 detection tests were carried out by acquiring the voltammogram of ZnO and ZnO/LIG composites samples using PS as the electrolyte (35 mL) at a potential range from −1 to 1 V and a scan rate of 100 mV s−1. In this case, a saturated calomel electrode (SCE, 3.9 M KCl) was used as the reference electrode. Before the H2O2 detection tests, cyclic voltammograms were run in the presence and absence of O2 (bubbled with N2 during 30 min and kept under N2 blanket). The latter was used as the reference/blank (0 mM of H2O2) for each sample. Then, different volumes of H2O2 (3% v/v) were added to the electrolyte under magnetic stirring and with a N2 flow to rapidly homogenize the electrolyte solution and to guarantee no entrance of O2 in the cell. The magnetic stirring and N2 flow were turned off and the voltammogram was run. This procedure was repeated in increasing order of concentration by adding 30, 60, 150, 300, 600, and 1200 μL, which corresponded to final H2O2 concentrations of 0.8, 1.5, 3.8, 7.4, 14.6, and 28.3 mM, respectively.

3. Results and Discussion

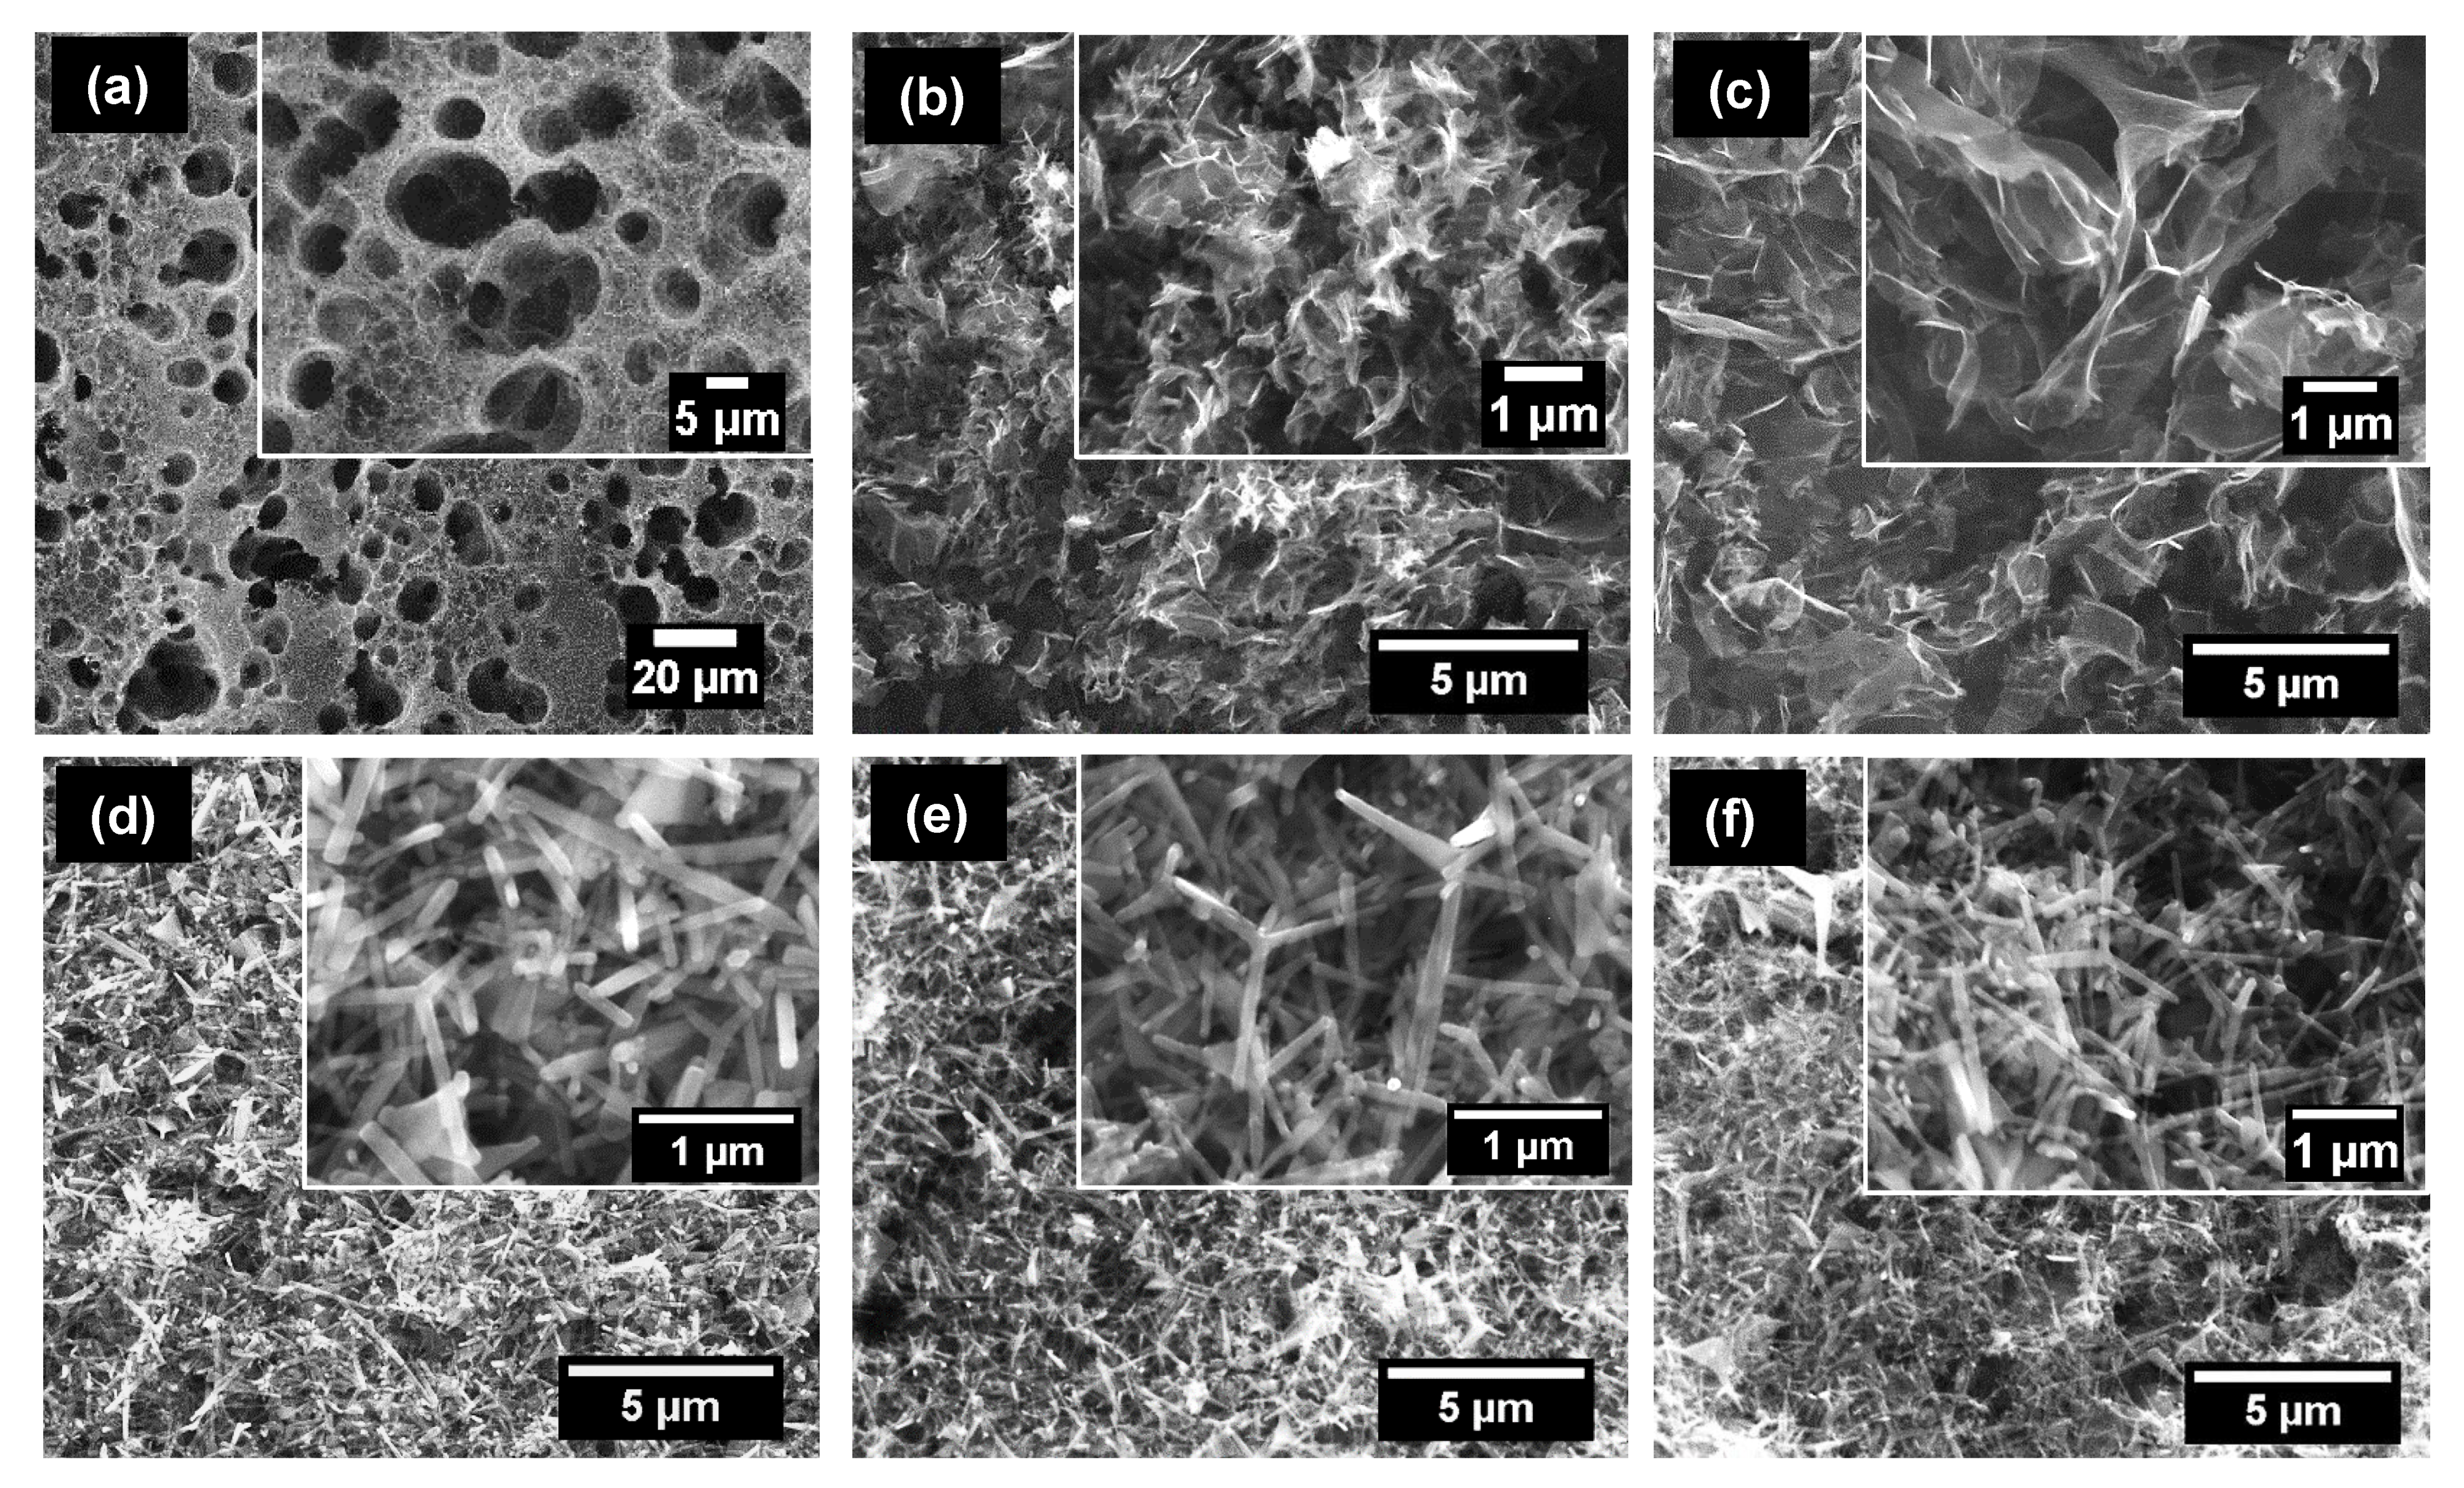
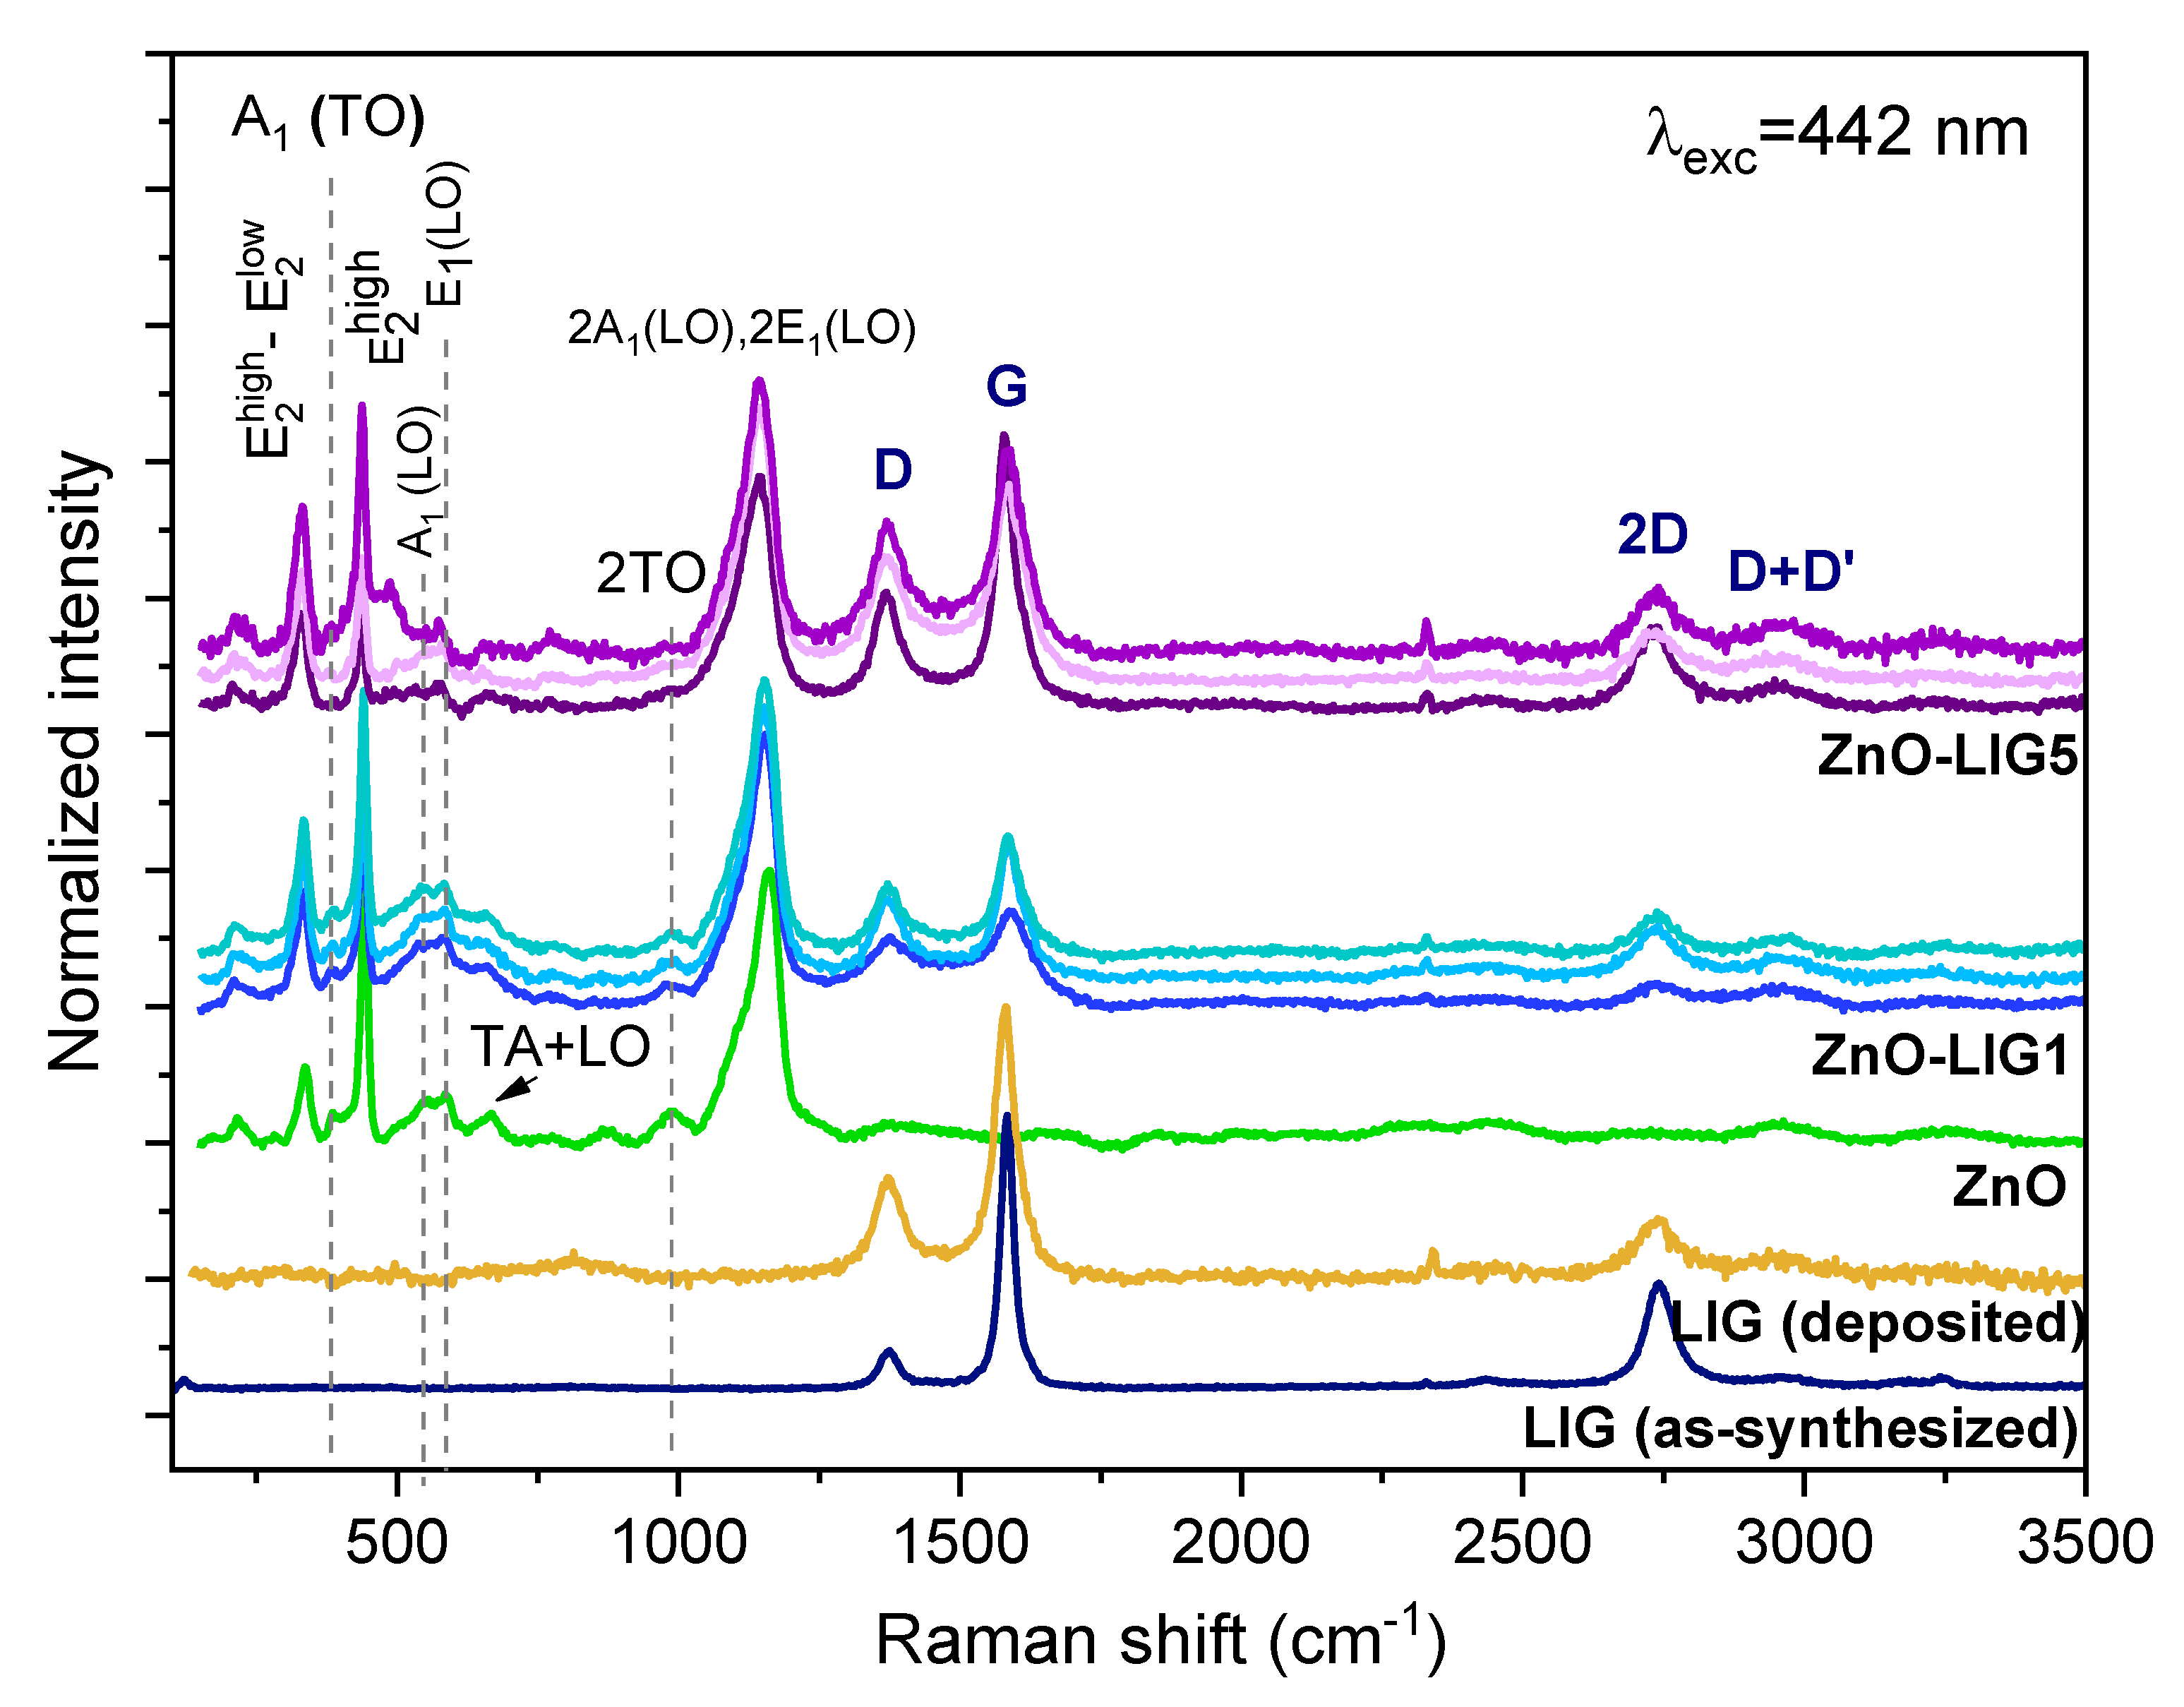
3.1. Morphological and Structural Analysis

The prepared samples of the ZnO and ZnO/LIG composites, as well as the as-synthesized and scrapped LIG, were analyzed by SEM and the results are depicted in Figure 2. As reported in previous works [49,51,54], the as-synthesized LIG exhibited a 3D foam-like morphology (Figure 2a), with a great number of pores with a large size distribution from hundreds of nanometers to tens of micrometers, resulting from the liberation of the gases produced during the photothermal process that leads to the LIG formation [43,53,70]. The pores were distributed through all the LIG volume. In fact, smaller pores were found inside the larger ones (see inset in Figure 2a), promoting a high surface area of the carbon material. However, upon scraping from the polyimide substrate to be mixed with ZnO, this foam-like appearance was completely lost, as can be observed in Figure 2b and c, where SEM images of the scrapped LIG in powder form and after deposition on the substrate are displayed, respectively. In these cases, a crumpled morphology was observed rather than the previous foam-like one.
Regarding the ZnO and its composites with LIG, the SEM images are presented in Figure 2d–f. In all cases, the ZnO tetrapod morphology dominated the samples, as can be better seen in the inset images. Indeed, this occurred even in the case of the composite with the highest amount of LIG (5 mg, Figure 2f), although the sample exhibited a dark grey color (see photograph in Figure S1). These tetrapods were composed of four needle-like branches connected at the center. Each of these branches corresponded to a single crystal, whose length varied from hundreds of nm to a few µm, while the diameters were on the nm scale, as previously reported for this type of ZnO morphology produced by LAFD [6,71]. LIG was not clearly distinguished in the SEM images of the composites because at the employed accelerating voltages, 30 kV, the beam penetration depth was much larger than the graphene sheet thicknesses, hindering its visualization against the denser and thicker ZnO. Nevertheless, as corroborated by the Raman spectra presented in Figure 3, LIG was indeed present in these samples and homogeneously distributed throughout the entire composite.
Figure 3 shows the Raman spectra of the prepared ZnO/LIG composites. The ZnO and LIG samples deposited under the same conditions of the composites and an as-synthesized LIG sample were also analyzed for comparison purposes. Both LIG samples exhibited typical D and G bands associated with sp2 coordinated carbon, as well as a symmetrical 2D band characteristic of graphene materials [46,50,54,80]. While the D band (~1372 cm−1) was attributed to the presence of defects and/or disordered carbon, the G band (~1583 cm−1), which dominated the present LIG spectra, was a common feature of graphitic-like materials and was associated with the bond stretching of all C–C pairs of sp2 atoms [80]. On the other hand, the 2D band originated from second-order zone-boundary phonons, in particular, overtones of the D band [50,80,81], and the fact that a single and symmetric peak appeared reflects the formation of a decoupled multilayer graphene structure [46,54]. Inspection of the two spectra presented for the LIG samples revealed that the scraping process led to changes in the ratio between the peak intensity of both D and G bands and 2D vs. G (i.e., ID/IG and I2D/IG, respectively), as well as in the width of those vibrational modes. For the as-synthesized LIG, ID/IG ~0.14 and I2D/IG~ 0.38, while for the scrapped samples, the ratio ID/IG increased to ~0.37 and the I2D/IG slightly decreased to ~0.22. This change in phonon intensity ratio was also accompanied by a broadening of the peaks for the scrapped LIG, mostly associated with an increase in the disorder of the structure. Indeed, such results were expected since the as-synthesized LIG foam-like structure collapsed during the scraping process, thus producing a higher defect concentration, for instance, due to an increase in the density of edges (as seen in the SEM images in Figure 2b,c) and/or from a higher oxidation state [14,50]. Besides the damage induced during the removal of LIG from the original polyimide substrate, such defects can also be promoted during mixing, deposition, and thermal treatment steps. Moreover, as this treatment was performed in air, some oxidation may have been promoted in this way. Hence, all of these processes are likely to play a significant role in the enhancement of the defect density.
In the case of the ZnO sample, the spectrum resembled those often observed for highly crystalline ZnO, displaying well defined and sharp peaks that corresponded to the typical vibrational modes of the hexagonal wurtzite structure that are active in Raman, in line with the ones typically displayed by the LAFD produced ZnO [6,72]. The modes A1, E1, and E2 were clearly identified, as well as some overtones and combined modes related to multi-phonon processes [82]. Specifically, the observed first-order Raman phonon modes (at k = 0) were the A1 (TO), which peaked at ~386 cm−1, the E2high placed at ~442 cm−1, A1(LO) at ~556 cm−1, and E1(LO) at ~585 cm−1. Finally, the peaks related to the second-order processes corresponded to the combined modes E2high–E2low placed at ~336 cm−1 and the intense peak at ~1143 cm−1 due to the 2A1(LO) and 2E1(LO), which was enhanced under the present excitation conditions [83]. A combination of both LIG and ZnO vibrational modes was seen in the case of the composite samples, according to what was observed for the components individually. Three spectra are presented in Figure 3 for each composite, corresponding to different probed spots, to infer the homogeneity of the deposited material. The fact that modes for ZnO/LIG could be observed throughout the probed regions of the samples demonstrated that the two components were uniformly mixed and that the samples were fairly homogenous. The main difference observed between the two ZnO/LIG composites was the relative intensity of the LIG-related modes when compared to the ZnO ones. This intensity was higher in the case of the composites with 5 mg, as a higher amount of LIG was present, thus having a more significant contribution to the overall spectra. Another relevant point to highlight is that the ratio ID/IG increased again when the LIG was mixed with ZnO, presenting values in the ranges of ~0.56–0.73 and ~0.42–0.63 for the samples with 1 mg and 5 mg, respectively. Such enhancement suggests that a higher surface disorder is promoted and that the presence of ZnO may induce additional effects.

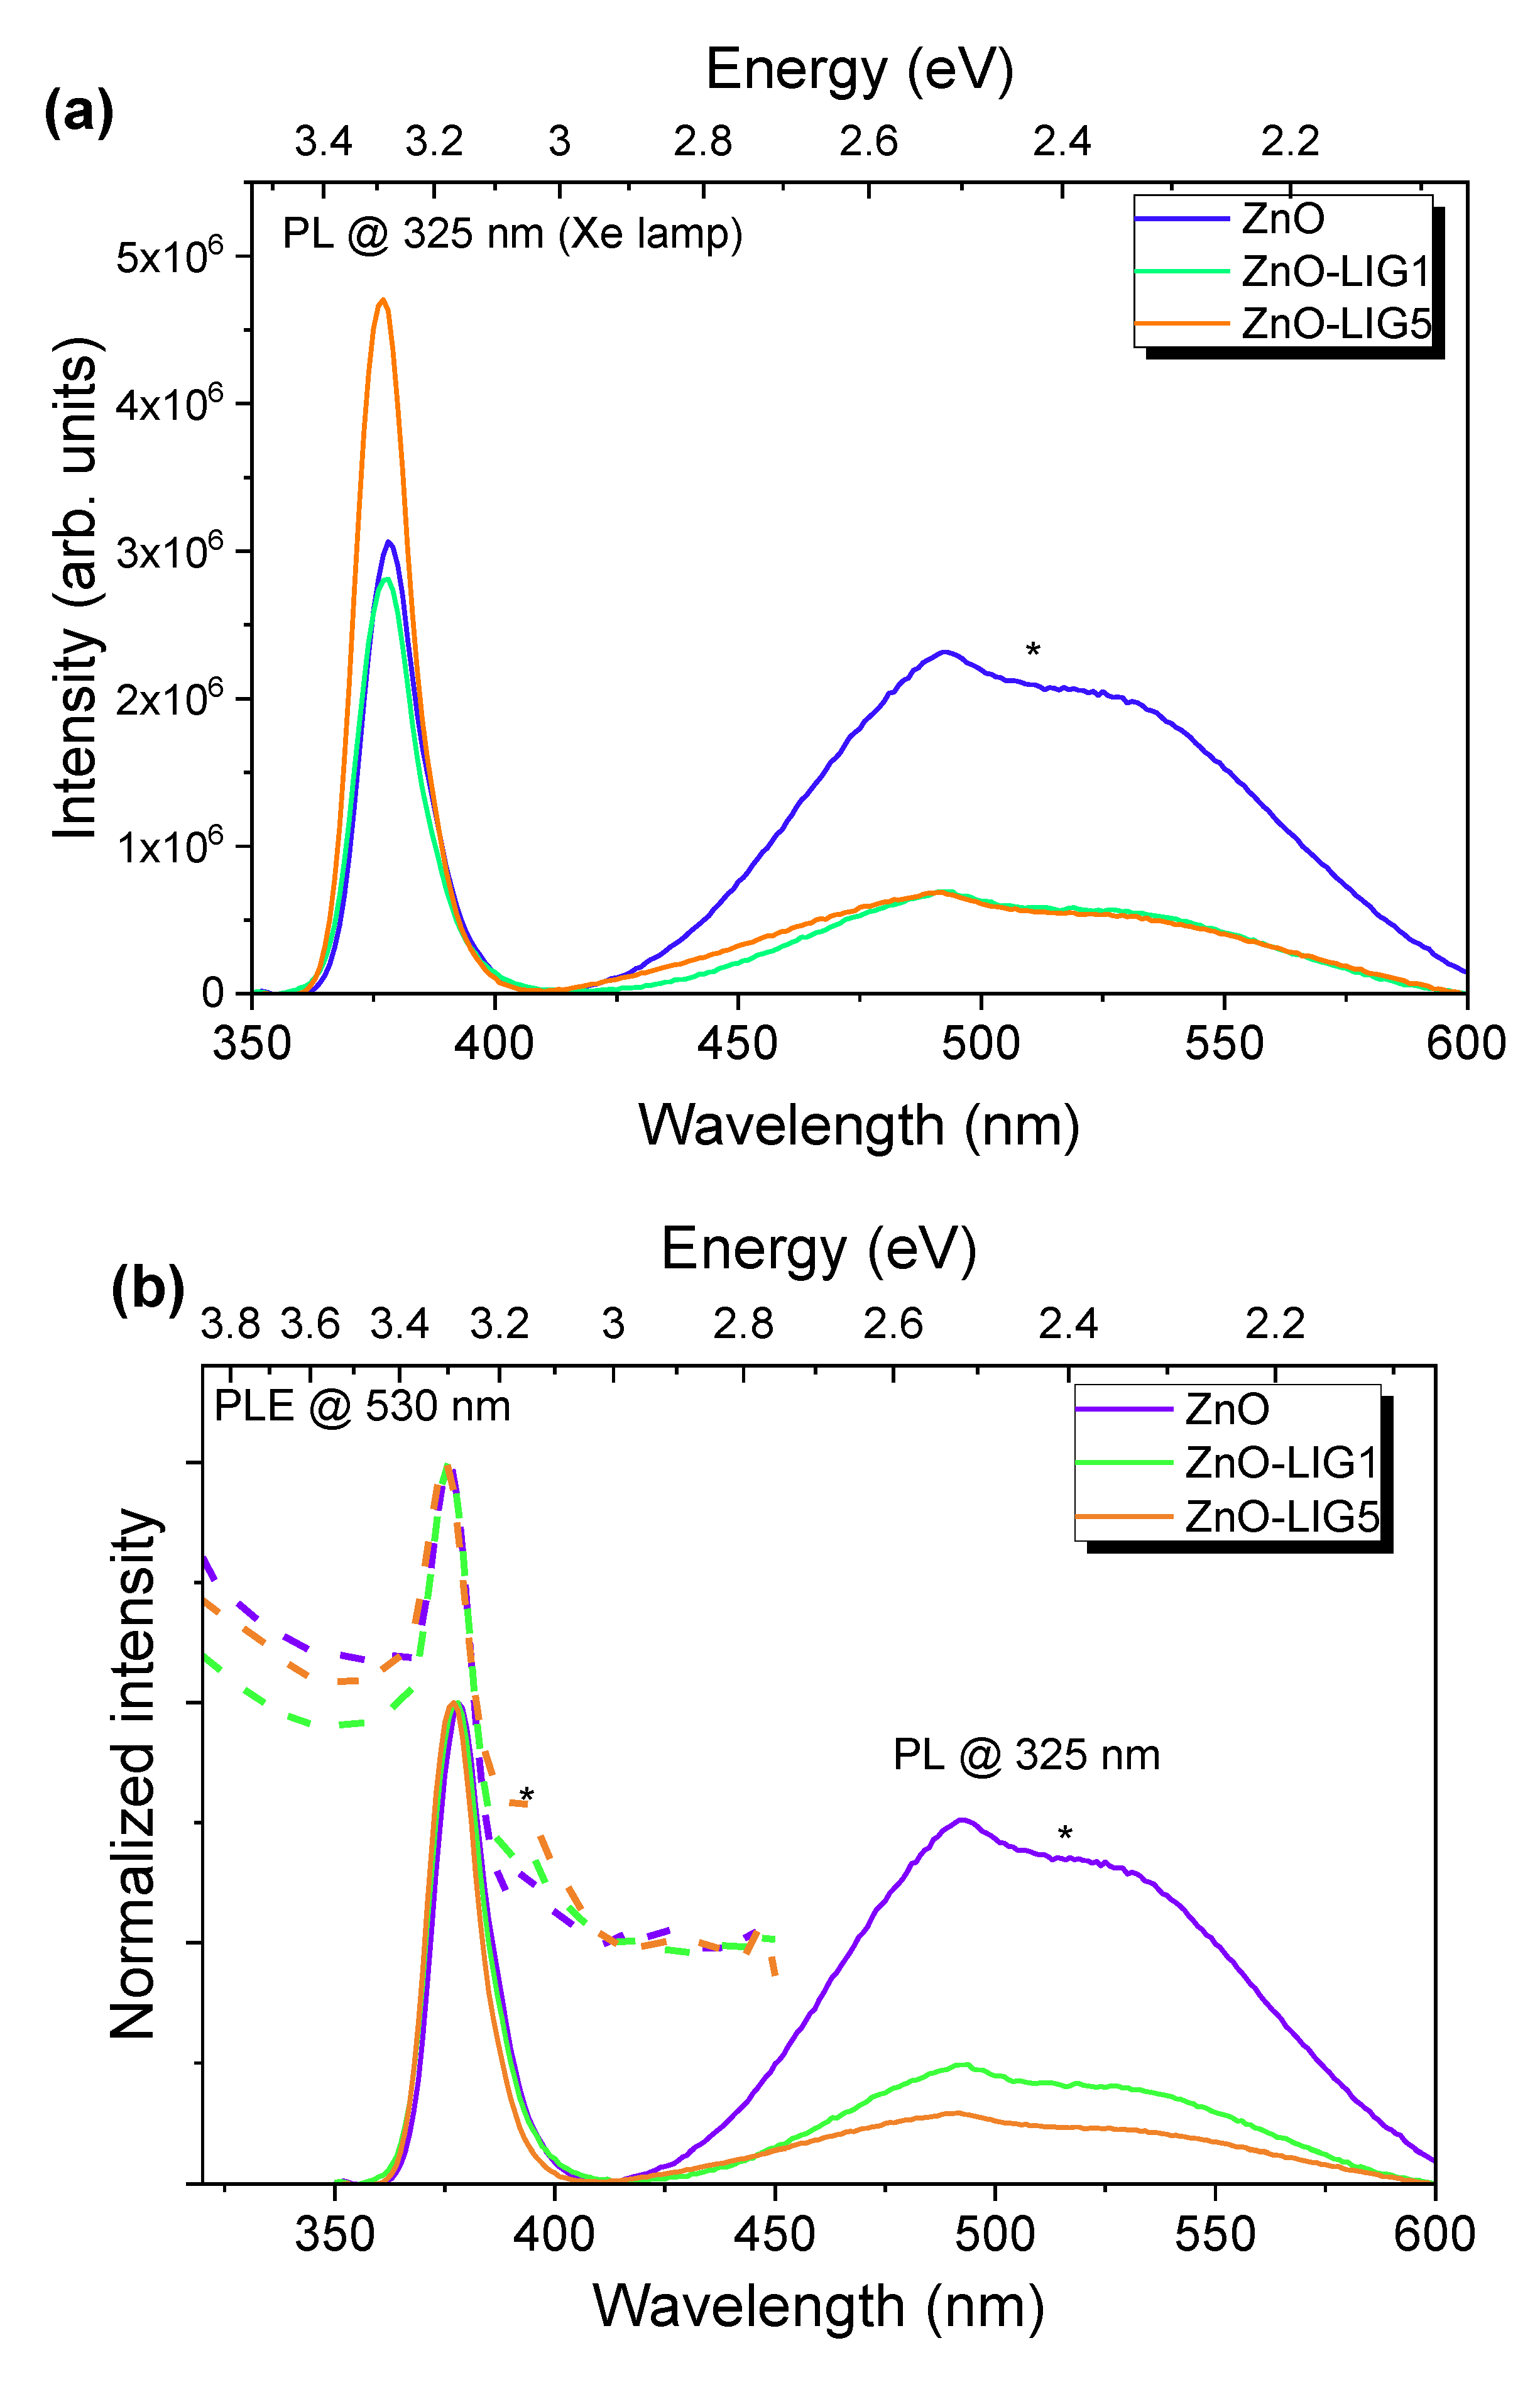
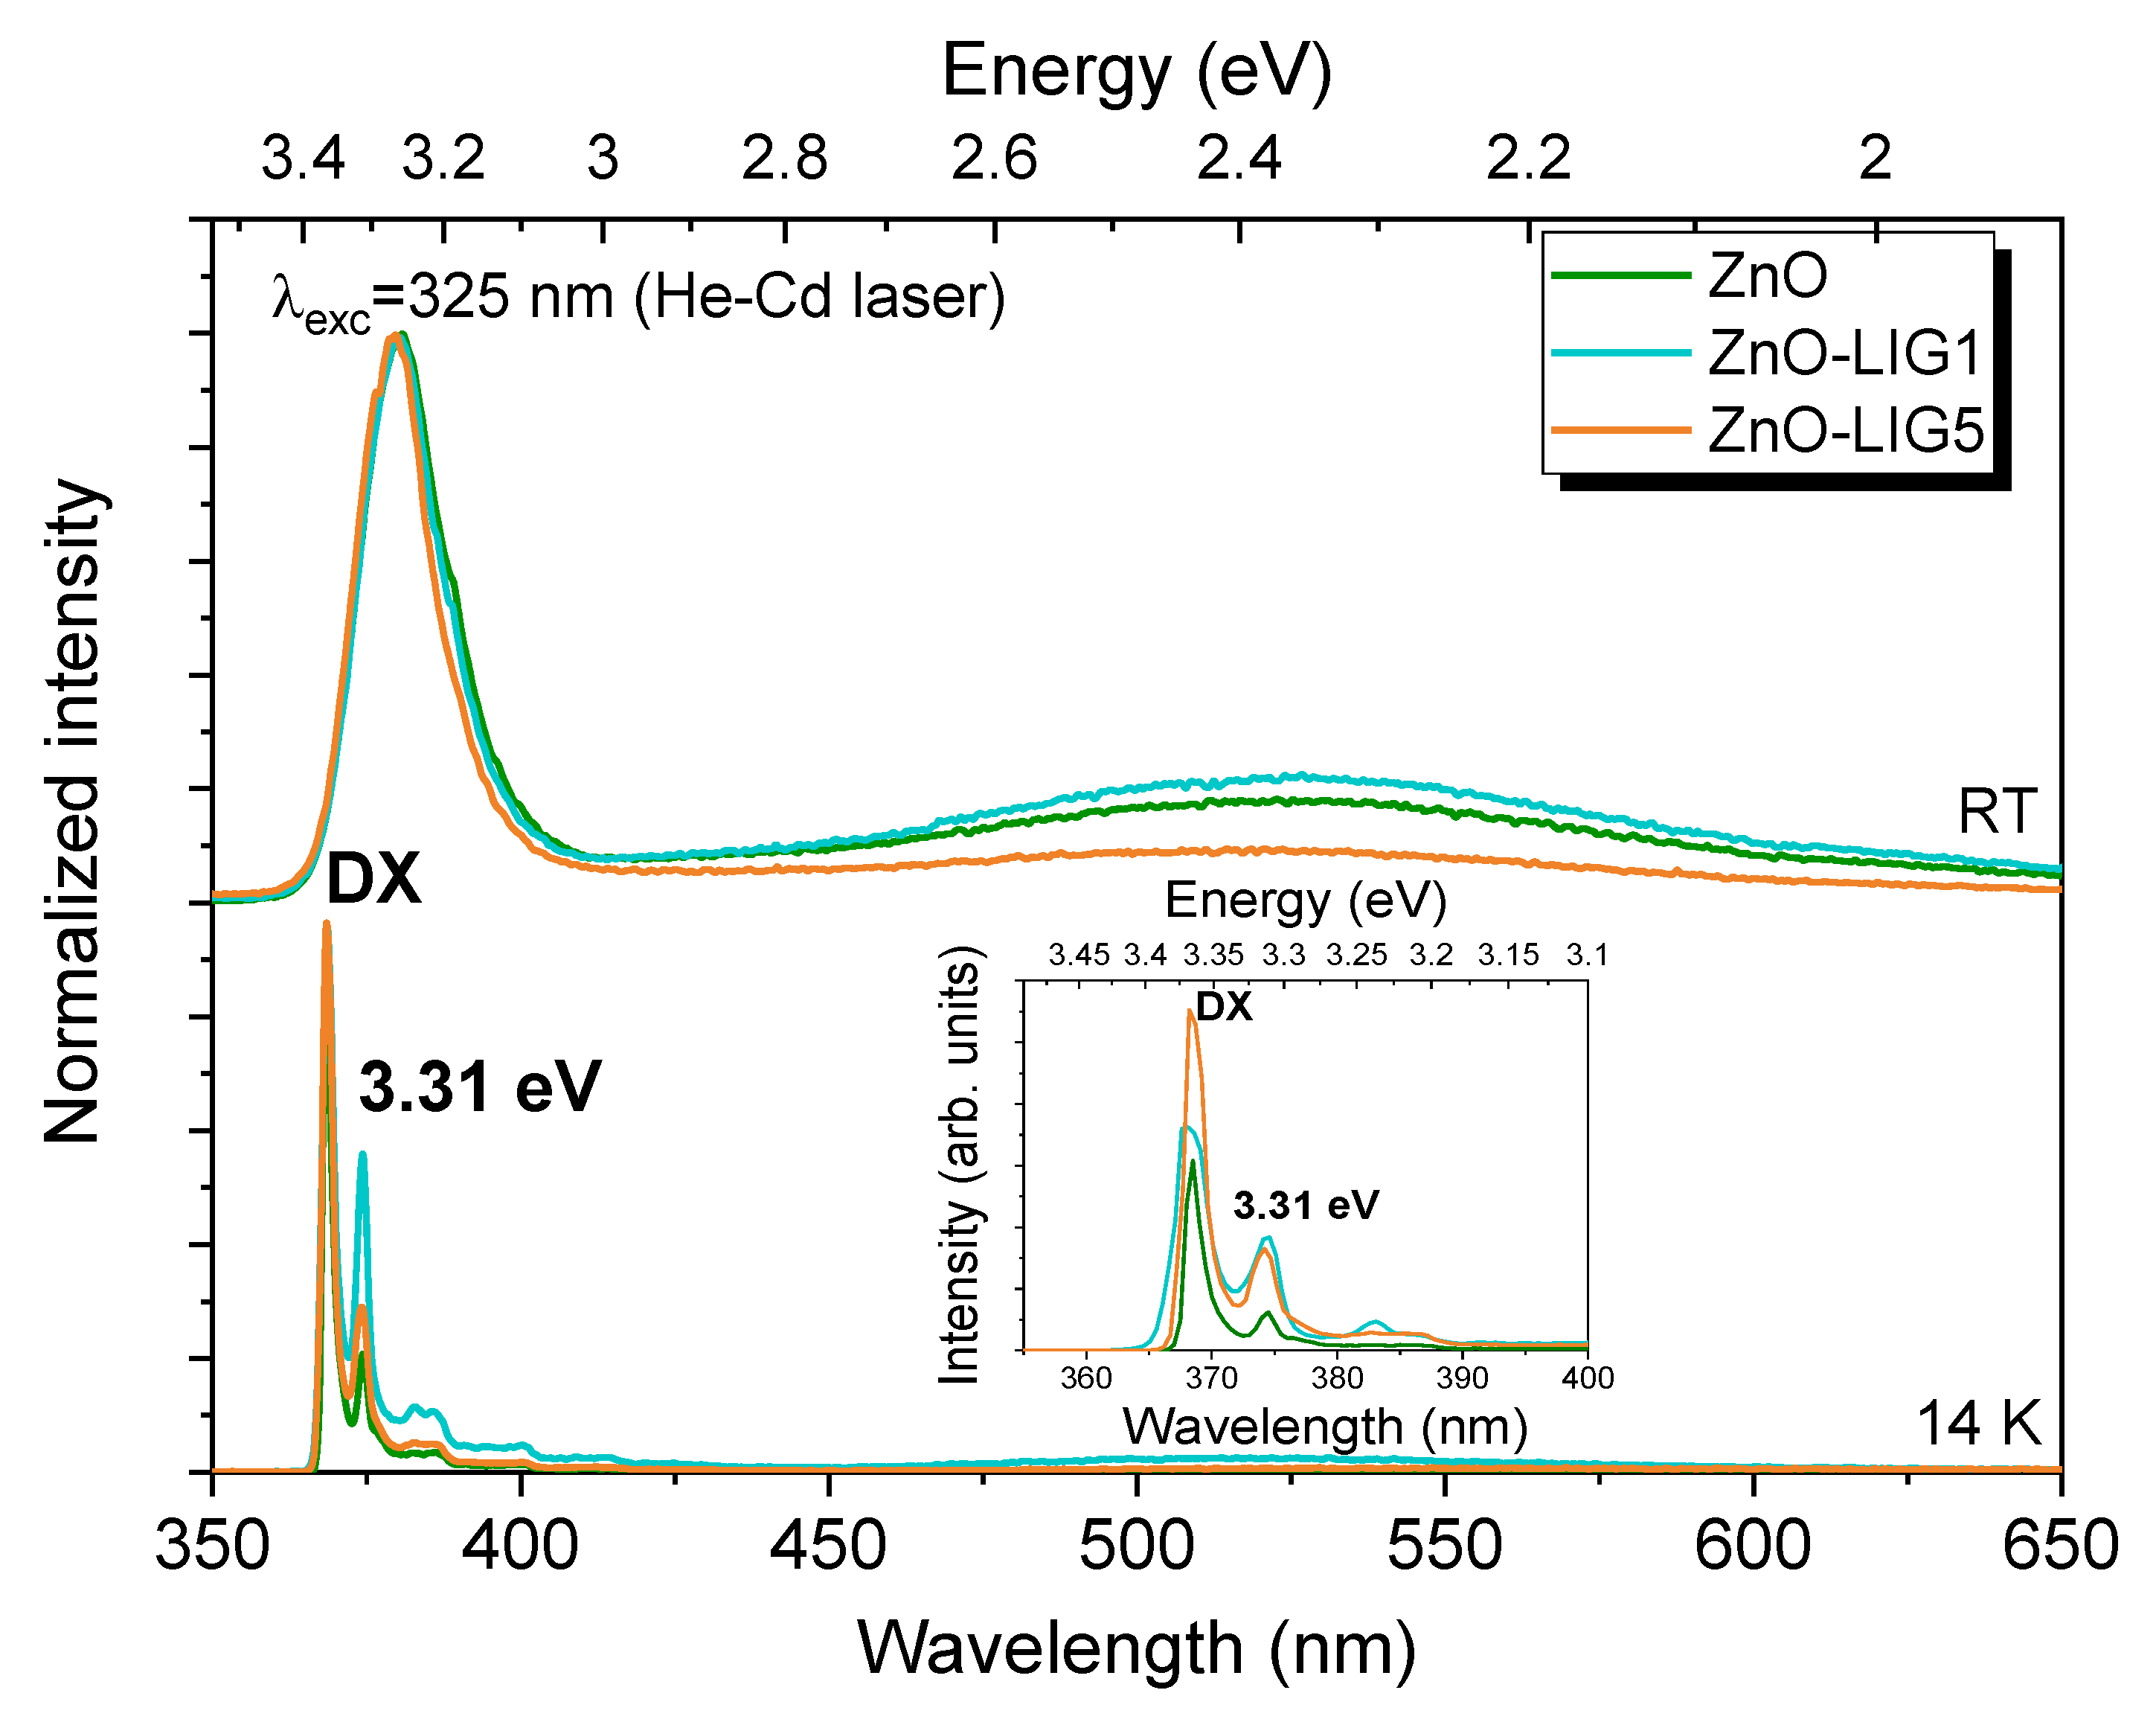
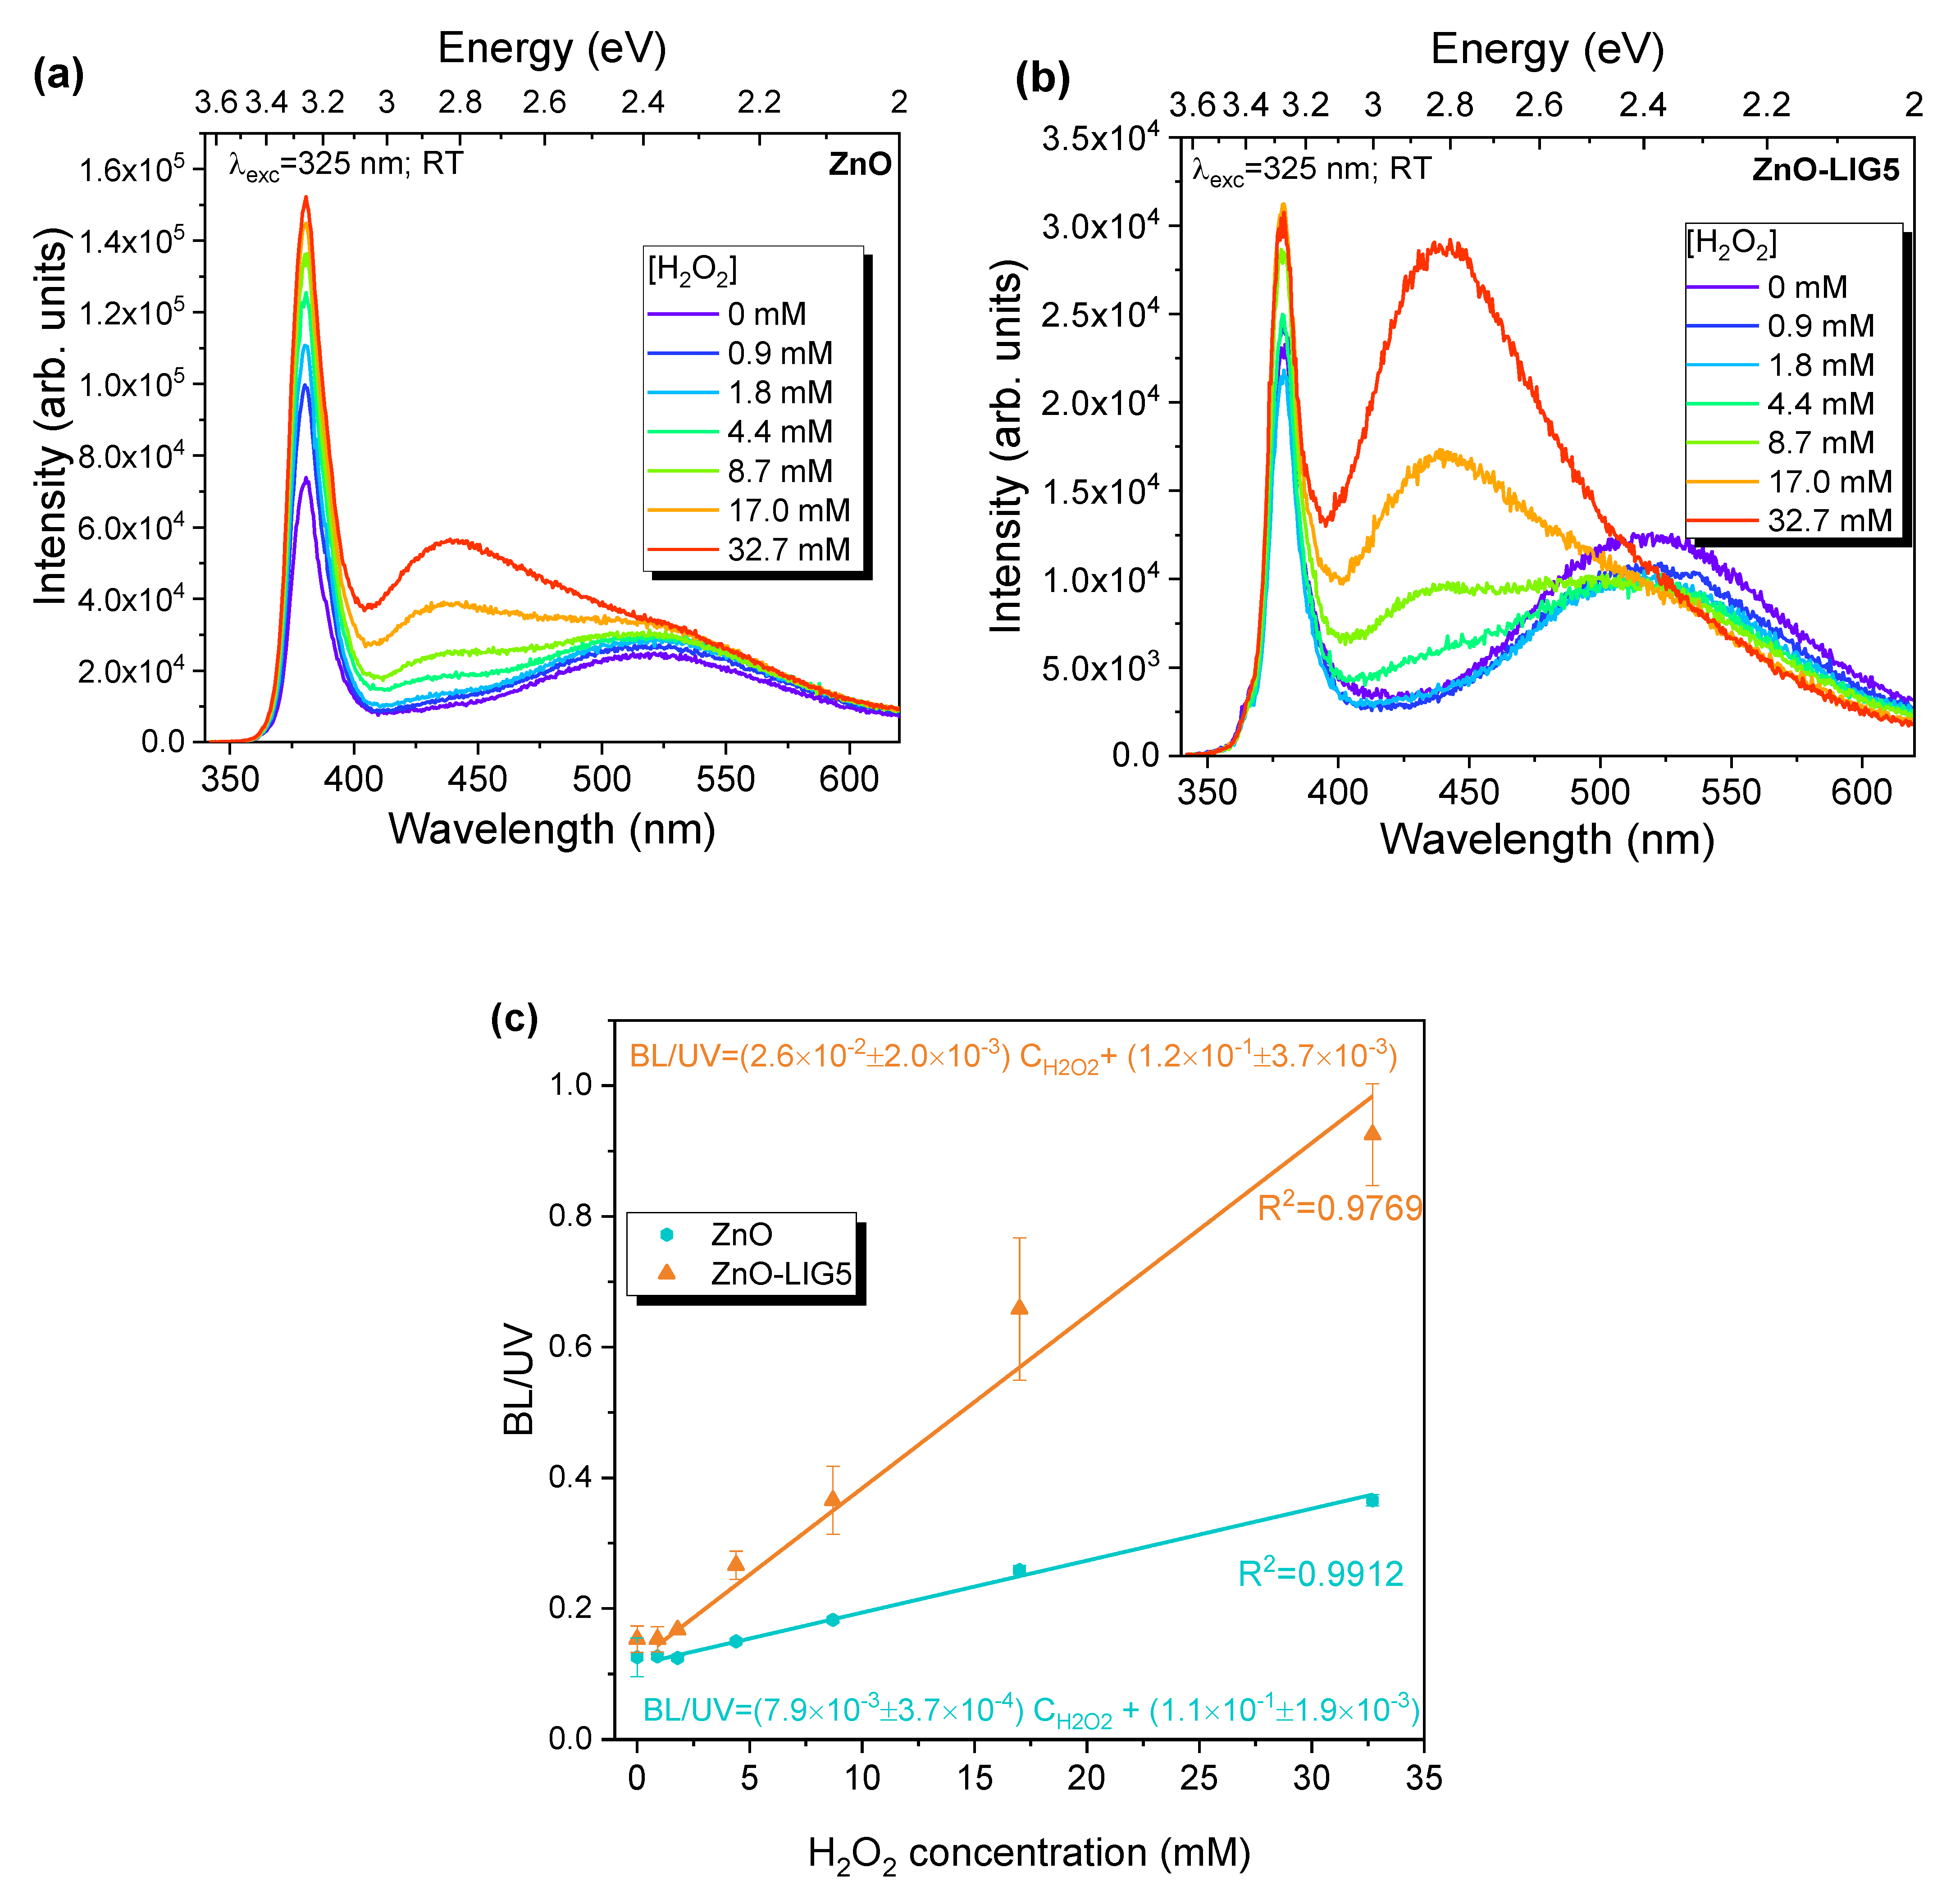
3.2. Photoluminescence Assessment

The ZnO and ZnO/LIG samples were assessed by RT PL and PLE and the results are displayed in Figure 4. Figure 4a shows a comparison of the absolute PL intensity for the analyzed samples (probed with the same illumination area and alignment). As can be seen, all spectra were dominated by the near band edge (NBE) emission, peaked at ~378 nm (~3.28 eV), and by a broad visible band with its maximum in the green spectral region (GL), as typically observed for the tetrapodal ZnO produced by LAFD [15,71,74]. At RT, the NBE emission resulted from the overlap of the free exciton (FX) emission with some defect states that are often present in this spectral region, as is the case of previously reported surface-related defects [15,75,84]. This evidence is corroborated by the low and temperature-dependent PL data depicted in Figure 5 and Figure S3, respectively. Nevertheless, the observed peak position coincided with the one typically reported for the FX recombination at RT [1,73], pointing toward its dominant contribution in the present case. The GL is one of the most reported emission for ZnO and it has been widely discussed in the literature, particularly because countless defects have been associated with the recombination channels in this spectral region, namely impurities such as Cu [85], or intrinsic defects, like oxygen vacancies, and many others [1,86,87]. Additionally, in the case of the samples at the nanoscale, which present a high aspect ratio, there has been convincing evidence that the defects (or at least part of them) that contribute to the green emission are located at the surface of the semiconductor [5,88,89,90]. Indeed, this hypothesis is in agreement with the data obtained in previous studies for the ZnO tetrapods produced by LAFD [75].
It was verified that the presence of LIG mixed with the ZnO led to changes in the relative intensity of the previously observed emissions. When compared to the bare ZnO sample, both composites exhibited a reduction in the overall intensity of the GL, displaying similar intensity in both cases. Moreover, the sample with 5 mg of LIG also showed an increase in the intensity of the NBE emission, while for the sample with 1 mg, the intensity remained barely the same as for ZnO. The ratio of the peak intensity between the visible band and the NBE emission was ~0.75, ~0.25, and ~0.14 for ZnO, ZnO-LIG1, and ZnO-LIG5, respectively, highlighting the strong reduction in the GL/NBE ratio with increasing LIG content. However, one should bear in mind that for the ZnO-LIG5, this reduction in the ratio was due not only to the decrease in the GL intensity, but also to the increase in the UV intensity. This suggests that distinct/additional interactions between the ZnO surface and LIG occurred for the different amounts of carbon material in the composites. The increase in the NBE emission has also been observed in other ZnO/carbon composites previously studied [13,14,15,18] and was attributed to a higher concentration of electron-hole pairs at the surface of ZnO due to the direct contact with the carbon species (good electrical conductors). Indeed, graphene is known to have a remarkably high photon absorption capability, resulting in a larger photocarrier density when compared to traditional semiconductor materials [91], thus providing a significant number of photogenerated pairs at the surface of ZnO. This results in charge transfer to the ZnO energy bands and defect states (e.g., surface defects), improving excitonic and/or surface recombination, which occurs in the UV spectral region. Therefore, the presence of LIG in close contact with ZnO enhances the population of the excitonic levels of the semiconductor and/or the surface defects located in the UV energy range, at the same time that LIG contributes to the passivation of part of the defects that originate the green emission, leading to the reduction in its intensity. The reduction or even suppression of the green spectral component has been observed in other ZnO structures when in contact with C60 molecules [13,14,92] or Ag micro/nanoparticles [75]. In these cases, charge transfer from surface defects of the ZnO to such materials was found to be the cause for the decrease in the radiative processes [13,14,75]. Hence, one can infer that a similar effect is taking place in the present composites. Moreover, as also reported for the C60 case [13,14], the charge transfer is likely to occur in both ways (i.e., from LIG to ZnO) as an increase in the intensity of the NBE was observed (in the case of ZnO-LIG5), and from ZnO to LIG, since the intensity of the GL was reduced in both composites. Likewise, the passivation of the surface defects by LIG can also occur, which promotes changes in the band bending at the ZnO surface. After their growth and deposition on the substrates, the ZnO crystals presented several surface-related defects (e.g., adsorbed O2, OH groups, etc.) that will affect their surface charge [5,6]. Thus, there is a potential barrier at its surface, which the carriers have to overcome to radiatively recombine [5], thus inhibiting part of the bulk-related recombination, as is the case of the FX. The passivation of part of those defects by the presence of LIG would induce a reduction in the height of the barrier, promoting the decrease in the band bending. Hence, not only did the recombination of some of the surface-related centers (related to the GL) decrease, but the FX recombination was also enhanced. Therefore, it is fair to assume that both defect passivation and charge transfer can occur in the ZnO/LIG samples, explaining the observed PL behavior. It is interesting to note that these processes are influenced by the amount of LIG in the composites, as the enhancement in the NBE emission only occurred for the sample with 5 mg, even though the reduction in the GL intensity was analogous in both cases.
Additionally, previous X-ray photoelectron spectroscopy (XPS) analysis of LIG prepared under analogous conditions of the here reported ones revealed the presence of pyridine groups at its surface [51]. Pyridine possesses nitrogen lone pairs that can act as electron donors when adsorbed at the surface of ZnO, particularly at Zn-terminated ZnO surfaces [93]. Therefore, at these surfaces, a substantial interaction between the nitrogen lone pairs of the pyridine molecule with the surface zinc atoms can occur [94], forming a strong link between the two materials. Indeed, a study by Hofmann et al. [95] on the adsorption of pyridine molecules on ZnO (10 1 ¯ 0) surfaces demonstrated a reduction in the work function of the semiconductor from 4.5 eV to 1.6 eV when one monolayer of pyridine was adsorbed on its surface, lowering the ZnO potential barrier. The work function was assessed by photoelectron spectroscopy while pyridine desorption was controlled by thermal desorption. Density functional theory (DFT) calculations were also employed to better understand the obtained results. The authors found that for a closed monolayer, the pyridine molecules bind covalently to Zn atoms and that the interface potential is influenced by both the adsorption-induced dipole and the monolayer dipole, with similar contributions from both. This combination leads to a strong polar bond between the organic molecule and the surface Zn atoms. The band alignment between ZnO and pyridine (with negative electron affinity) occurs in a way that prevents the pinning of the Fermi level, which is beneficial for electron injection, as the semiconductor potential barrier is lowered [95]. The theoretical calculation performed by Turkina et al. [96] on pyridine molecules chemisorbed on the nonpolar ZnO (10 1 ¯ 0) surface also corroborated the conclusions of the previous paper. They suggested that a significant hybridization between the uppermost ZnO layer and the pyridine molecule takes place along the Zn–N bond, with the highest occupied molecular orbital (HOMO) of the organic molecule completely hybridized with the ZnO bands. Simulations on the optical properties of such hybrid material pointed to the existence of three distinct types of excitation that they classified as ZnO-related, hybrid, and charge-transfer excitons. The attributions were made taking into account the dominant character of the bands involved in their formation [96]. The last one is particularly interesting since it can induce additional charge at the surface of the semiconductor, involving transitions from pure pyridine bands to ZnO bands. This study revealed that despite the presence of the pyridine molecules at the ZnO surface, optical absorption features of the semiconductor remained the same [96]. All these results allowed us to infer their similarities with the present work, pointing once more to the occurrence of both phenomena: (i) the reduction of the band bending and (ii) charge transfer between the two materials.
Figure 4b shows the normalized PL and PLE spectra for ZnO and the ZnO/LIG composites. It is interesting to note that no significant changes in the PLE spectral shape were identified with the addition of LIG, corroborating our assumption that LIG does not promote the formation of other radiative recombination channels and that the composites keep the same optical absorption features of the semiconductor, as above-mentioned for the case of the pyridine molecules at the ZnO surface [96]. In all cases, the PLE was monitored at the visible band and showed a steep absorption for wavelengths shorter than ~414 nm (~3.0 eV) due to absorption into near bandgap electronic states, also presenting a well-defined excitation peak at ~376 nm (~3.298 eV), related with the thermally broadened FX excitation [97,98,99]. This peak was coincident in all samples, in agreement with the observed FX emission. As the ZnO FX binding energy is known to be 60 meV, taking into account its emission at ~3.28 eV, a value of ~3.34 eV can be estimated for the bandgap energy at RT. This value is in line with others previously reported in the literature [97,100]. Hence, the observed spectral shape of the PLE spectra indicates that the probed emission is mainly populated via band-edge absorption and toward higher energies (shorter wavelengths), although subgap electronic states are also present as a tail of states toward longer wavelengths.
To gain further insight regarding the PL features of the composites, low-temperature spectra were recorded (Figure 5) as well as temperature dependence studies, as depicted in Figure S3 in the SM file. Figure 5 shows a comparison of the RT and 14 K normalized spectra obtained for the ZnO sample and the two ZnO/LIG composites under study. In this case, the spectra were obtained with a higher excitation density than the previous ones (He–Cd laser vs. Xe lamp), even though the same excitation energy was used (325 nm/~3.81 eV). The RT spectra normalized to the peak intensity of the NBE emission showed only minor changes in the GL/NBE ratio between the three samples, which was slightly different from what was observed under Xe lamp excitation. This variation in the intensity ratio is likely to be related to the presence of a higher number of photogenerated carriers when the laser is used as an excitation source, which may overcome the reduction in the green recombination paths induced by the presence of LIG at the ZnO surface. Notwithstanding, a significant decrease in the GL emission for the sample ZnO-LIG5 was still observed. Inspection of the low-temperature spectra indicated that a well-defined NBE was present at 14 K and barely any visible bands could be detected in any case. The low-temperature PL of ZnO is often used as a reference of the samples’ optical quality, where the presence of a highly resolved NBE, as in the present case, denotes high optical quality. Another indication for this is the high NBE recombination vs. the deep level emission intensity ratio. In the here reported samples, the most intense line observed at higher energies was due to the donor-bound excitons (DX) recombination, likely overlapped with the FX, while the line at ~3.31 eV also identified was proven to be related to the presence of surface states in the case of the LAFD-produced ZnO samples [84]. The relative intensity of this line, when compared to the FX + DX region (labelled as DX in Figure 5 for simplicity and as these should be the dominant transitions at such low temperatures), was seen to be higher in the case of the ZnO-LIG1 sample. On the other hand, for the ZnO-LIG5, the relative intensity remained the same as in the case of the ZnO sample. However, when one considered the absolute intensity of the emissions (inset in Figure 5), it is clear that this is due to an increase in the FX + DX transitions in ZnO-LIG5, in line with what was observed at RT and displayed in Figure 4a. A slight increase in the intensity of this emission line was also observed for ZnO-LIG1, but was much less pronounced. Moreover, in both composites, the intensity of the 3.31 eV line increased when compared with the bare ZnO and remained closely the same for the two LIG compositions. As above-mentioned, such phenomena indicate that the carbon material at the surface of the ZnO semiconductor promotes a preferential population of the surface states that are responsible for the 3.31 eV emission, thus leading to an enhancement in the radiative recombination involving those states. As the LIG amount increases, besides the surface defect levels, the carriers will be further transferred to the conduction band, thus increasing the excitonic emissions. Therefore, these results suggest the possibility of controlling the emission outcome to some extent by increasing the LIG amount on the ZnO surface in a way that the excitonic-related emission can be maximized over the visible one, which can be beneficial for applications where deep level emission needs to be avoided/reduced.
The temperature-dependent PL spectra were also assessed for the three samples, evidencing a similar behavior in all cases, as can be seen in Figure S3. With increasing temperature, the DX dissociated, leading to a strong reduction in the intensity of their radiative transitions for temperatures higher than ~70 K. Above these temperatures, the contributions from the FX and the 3.31 eV line (as well as its phonon replicas) remained and their peak positions shifted to lower energies with increasing temperature due to the bandgap shrinkage. At RT, the UV emission was comprised of a single band that resulted from the overlap of those contributions, as above-mentioned in the discussion of Figure 4a.

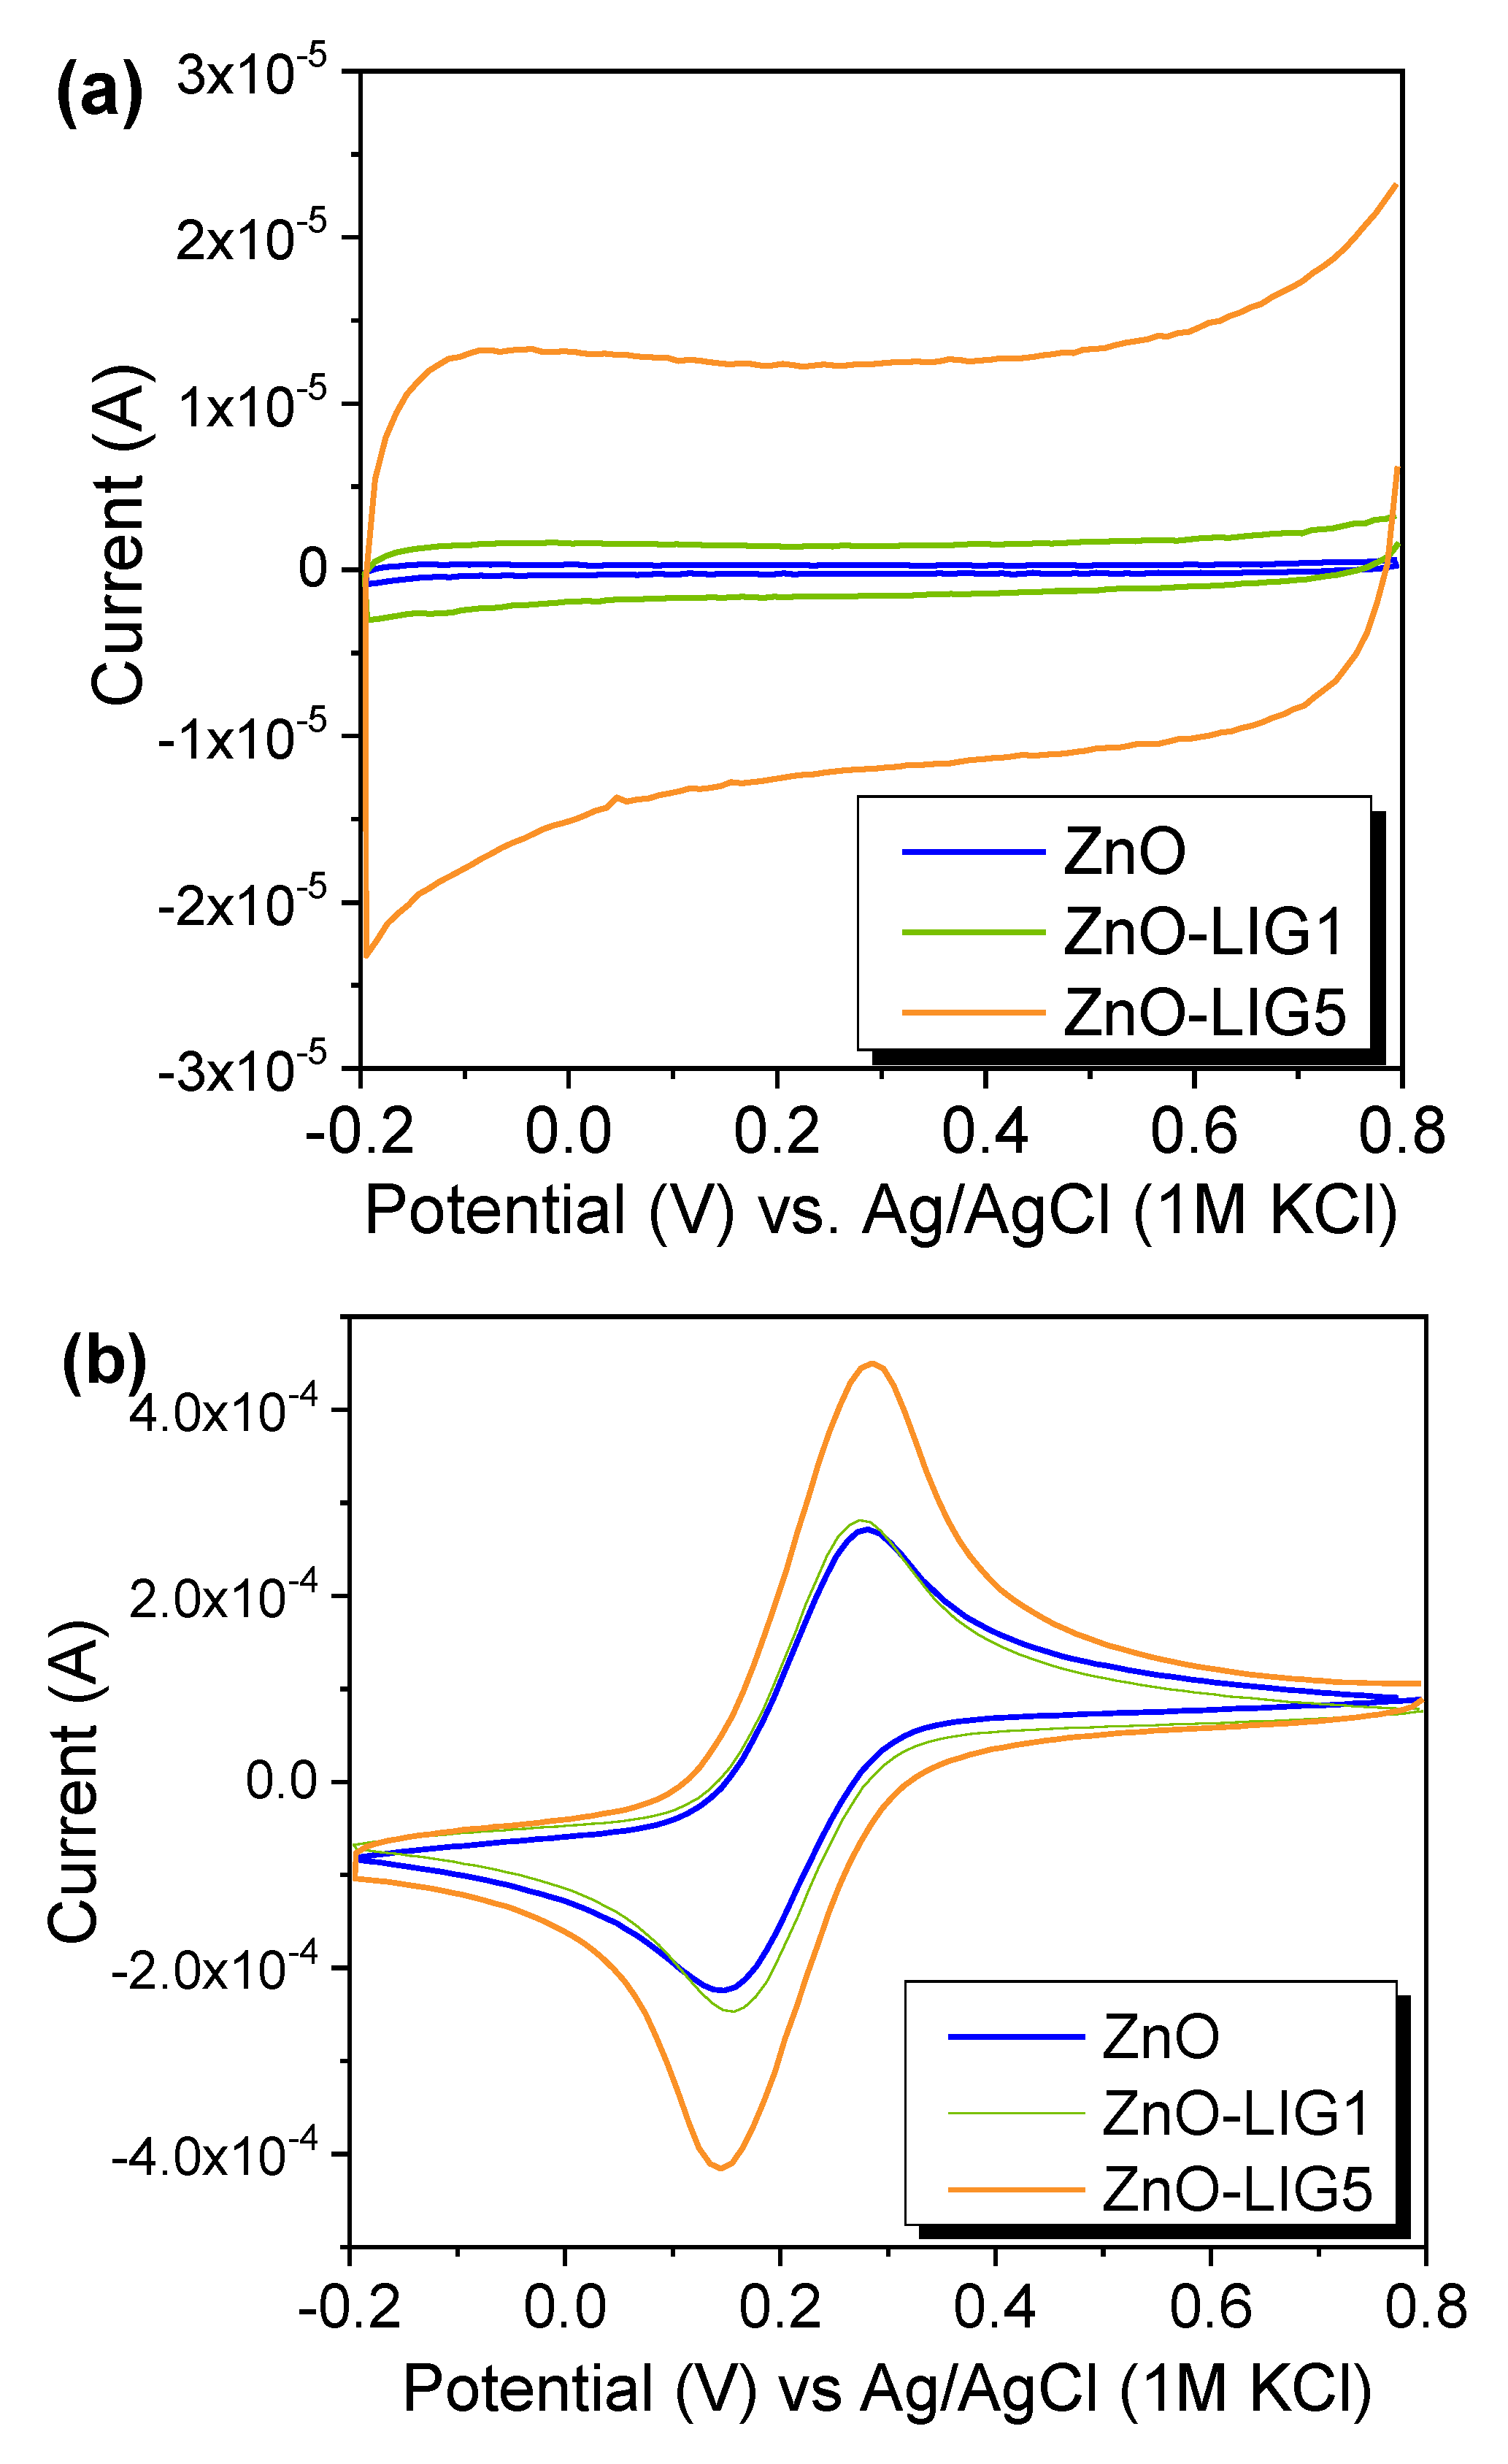
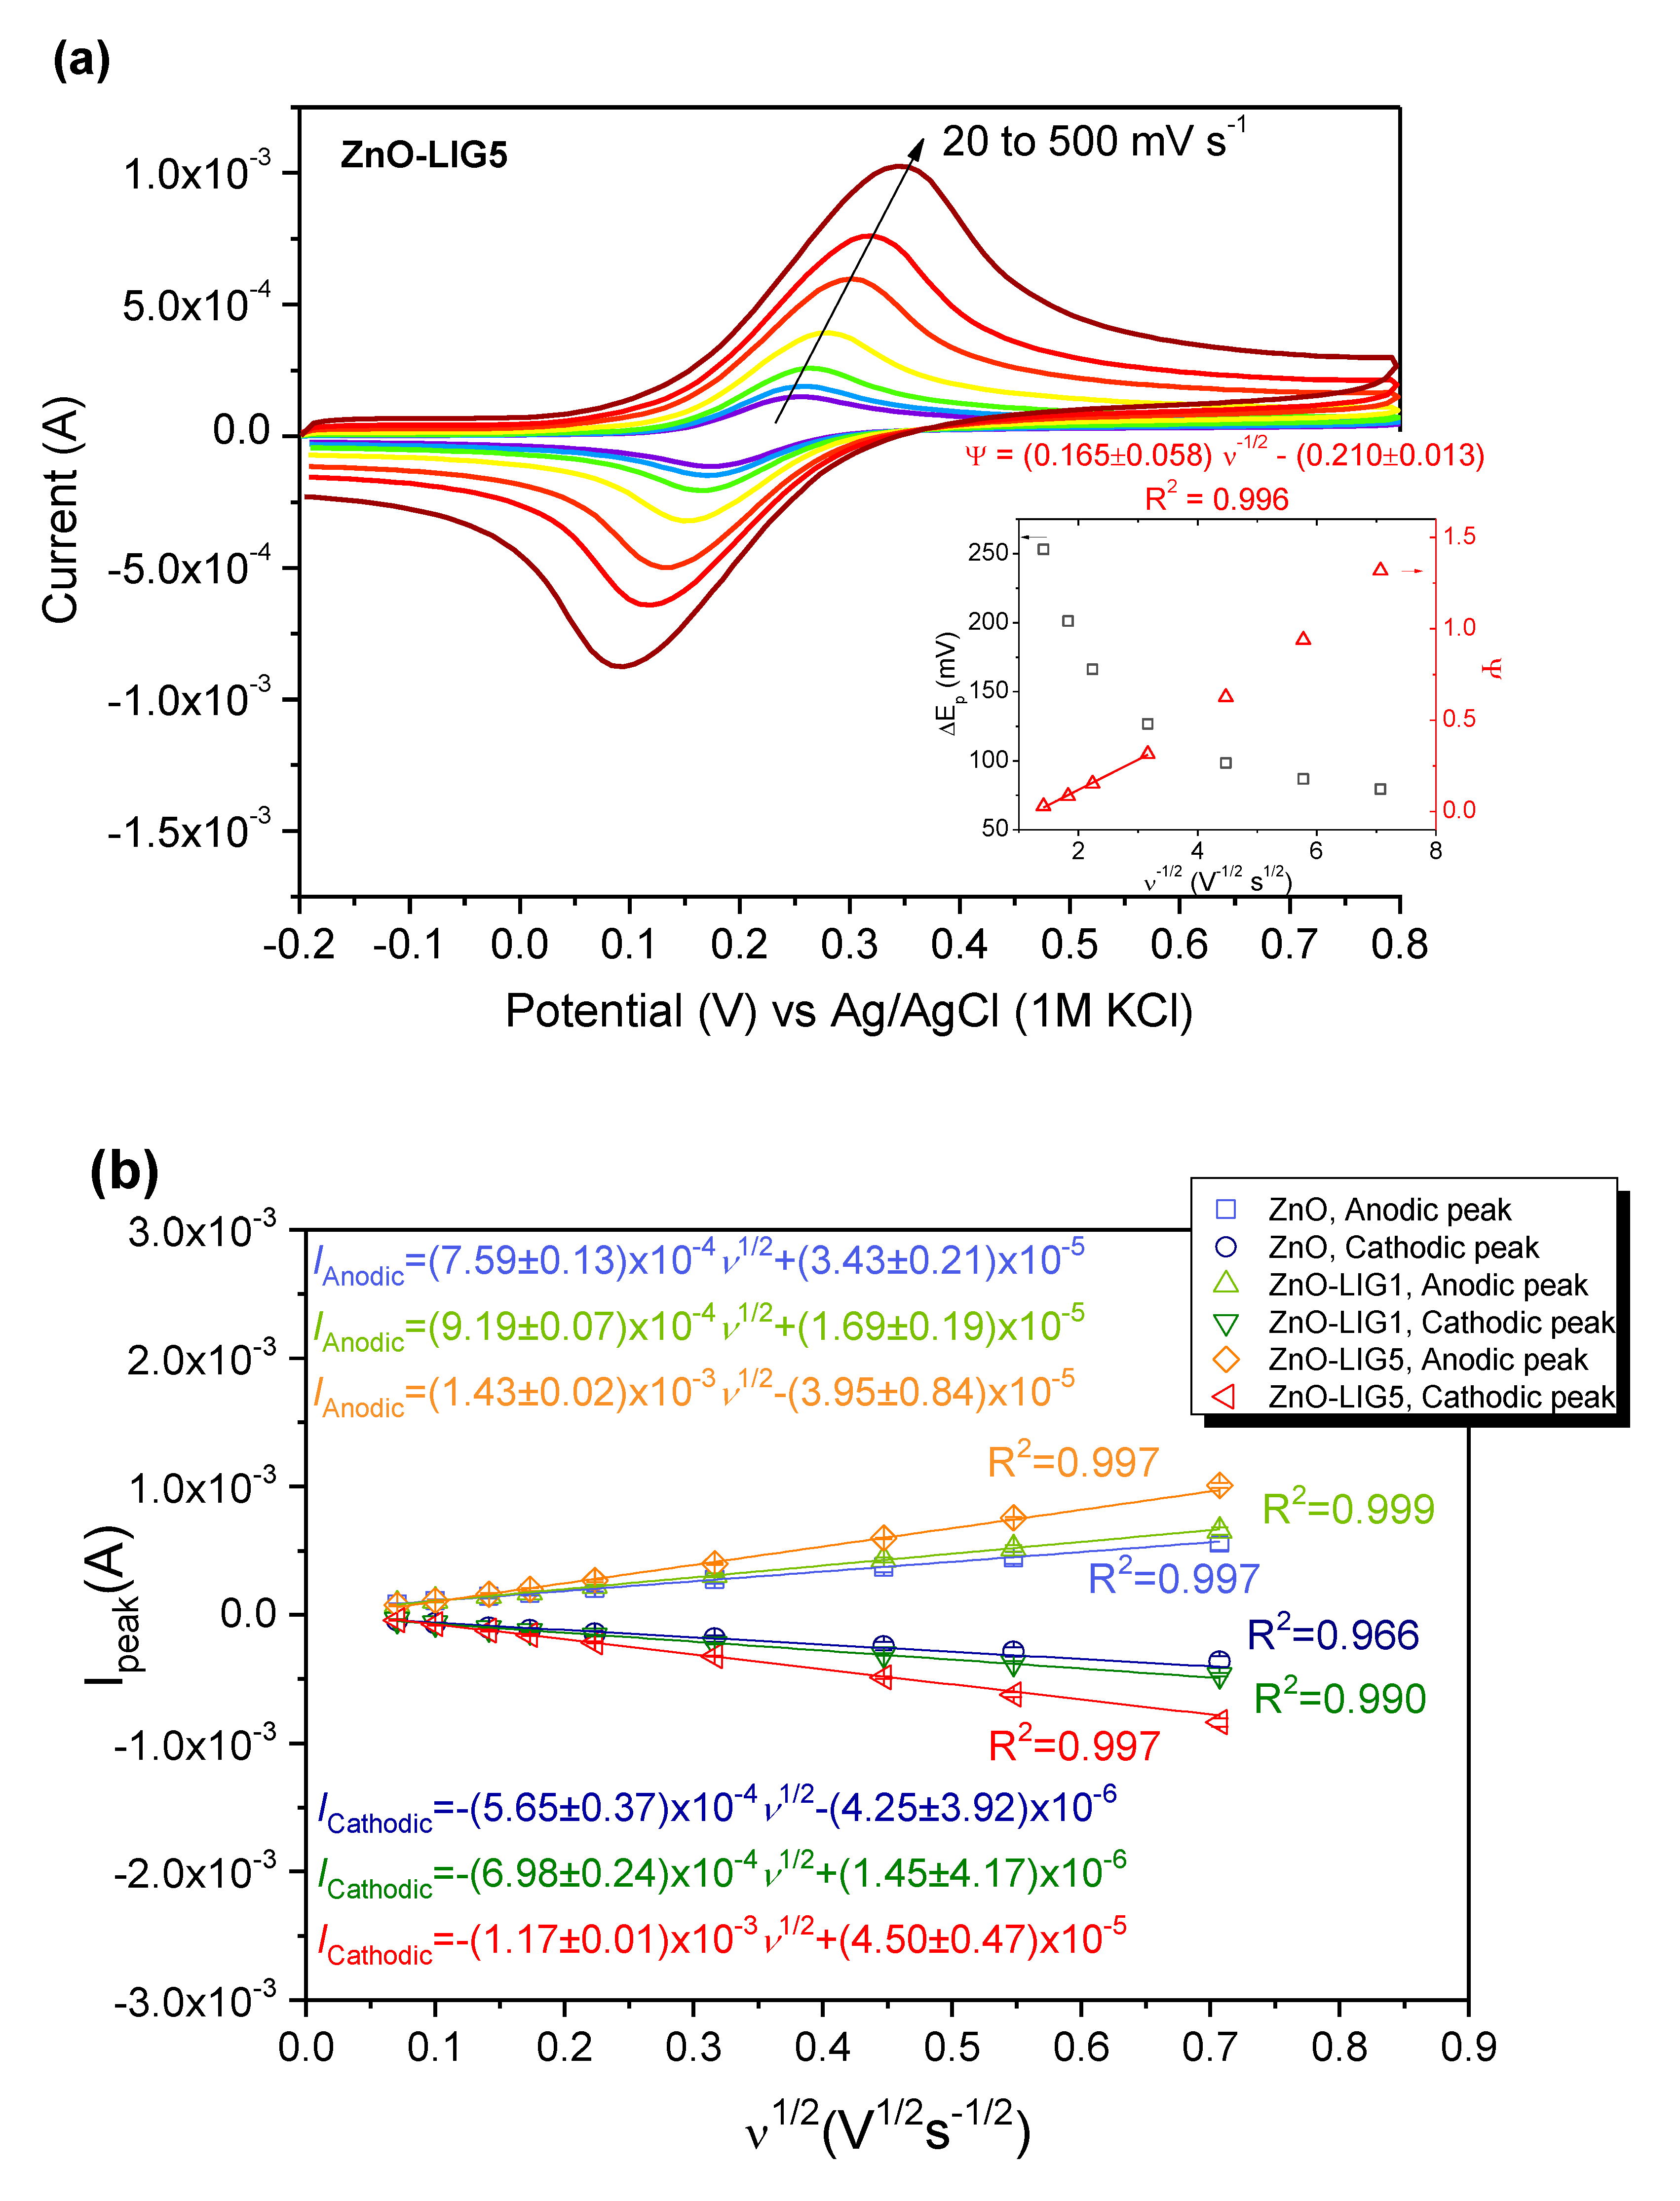
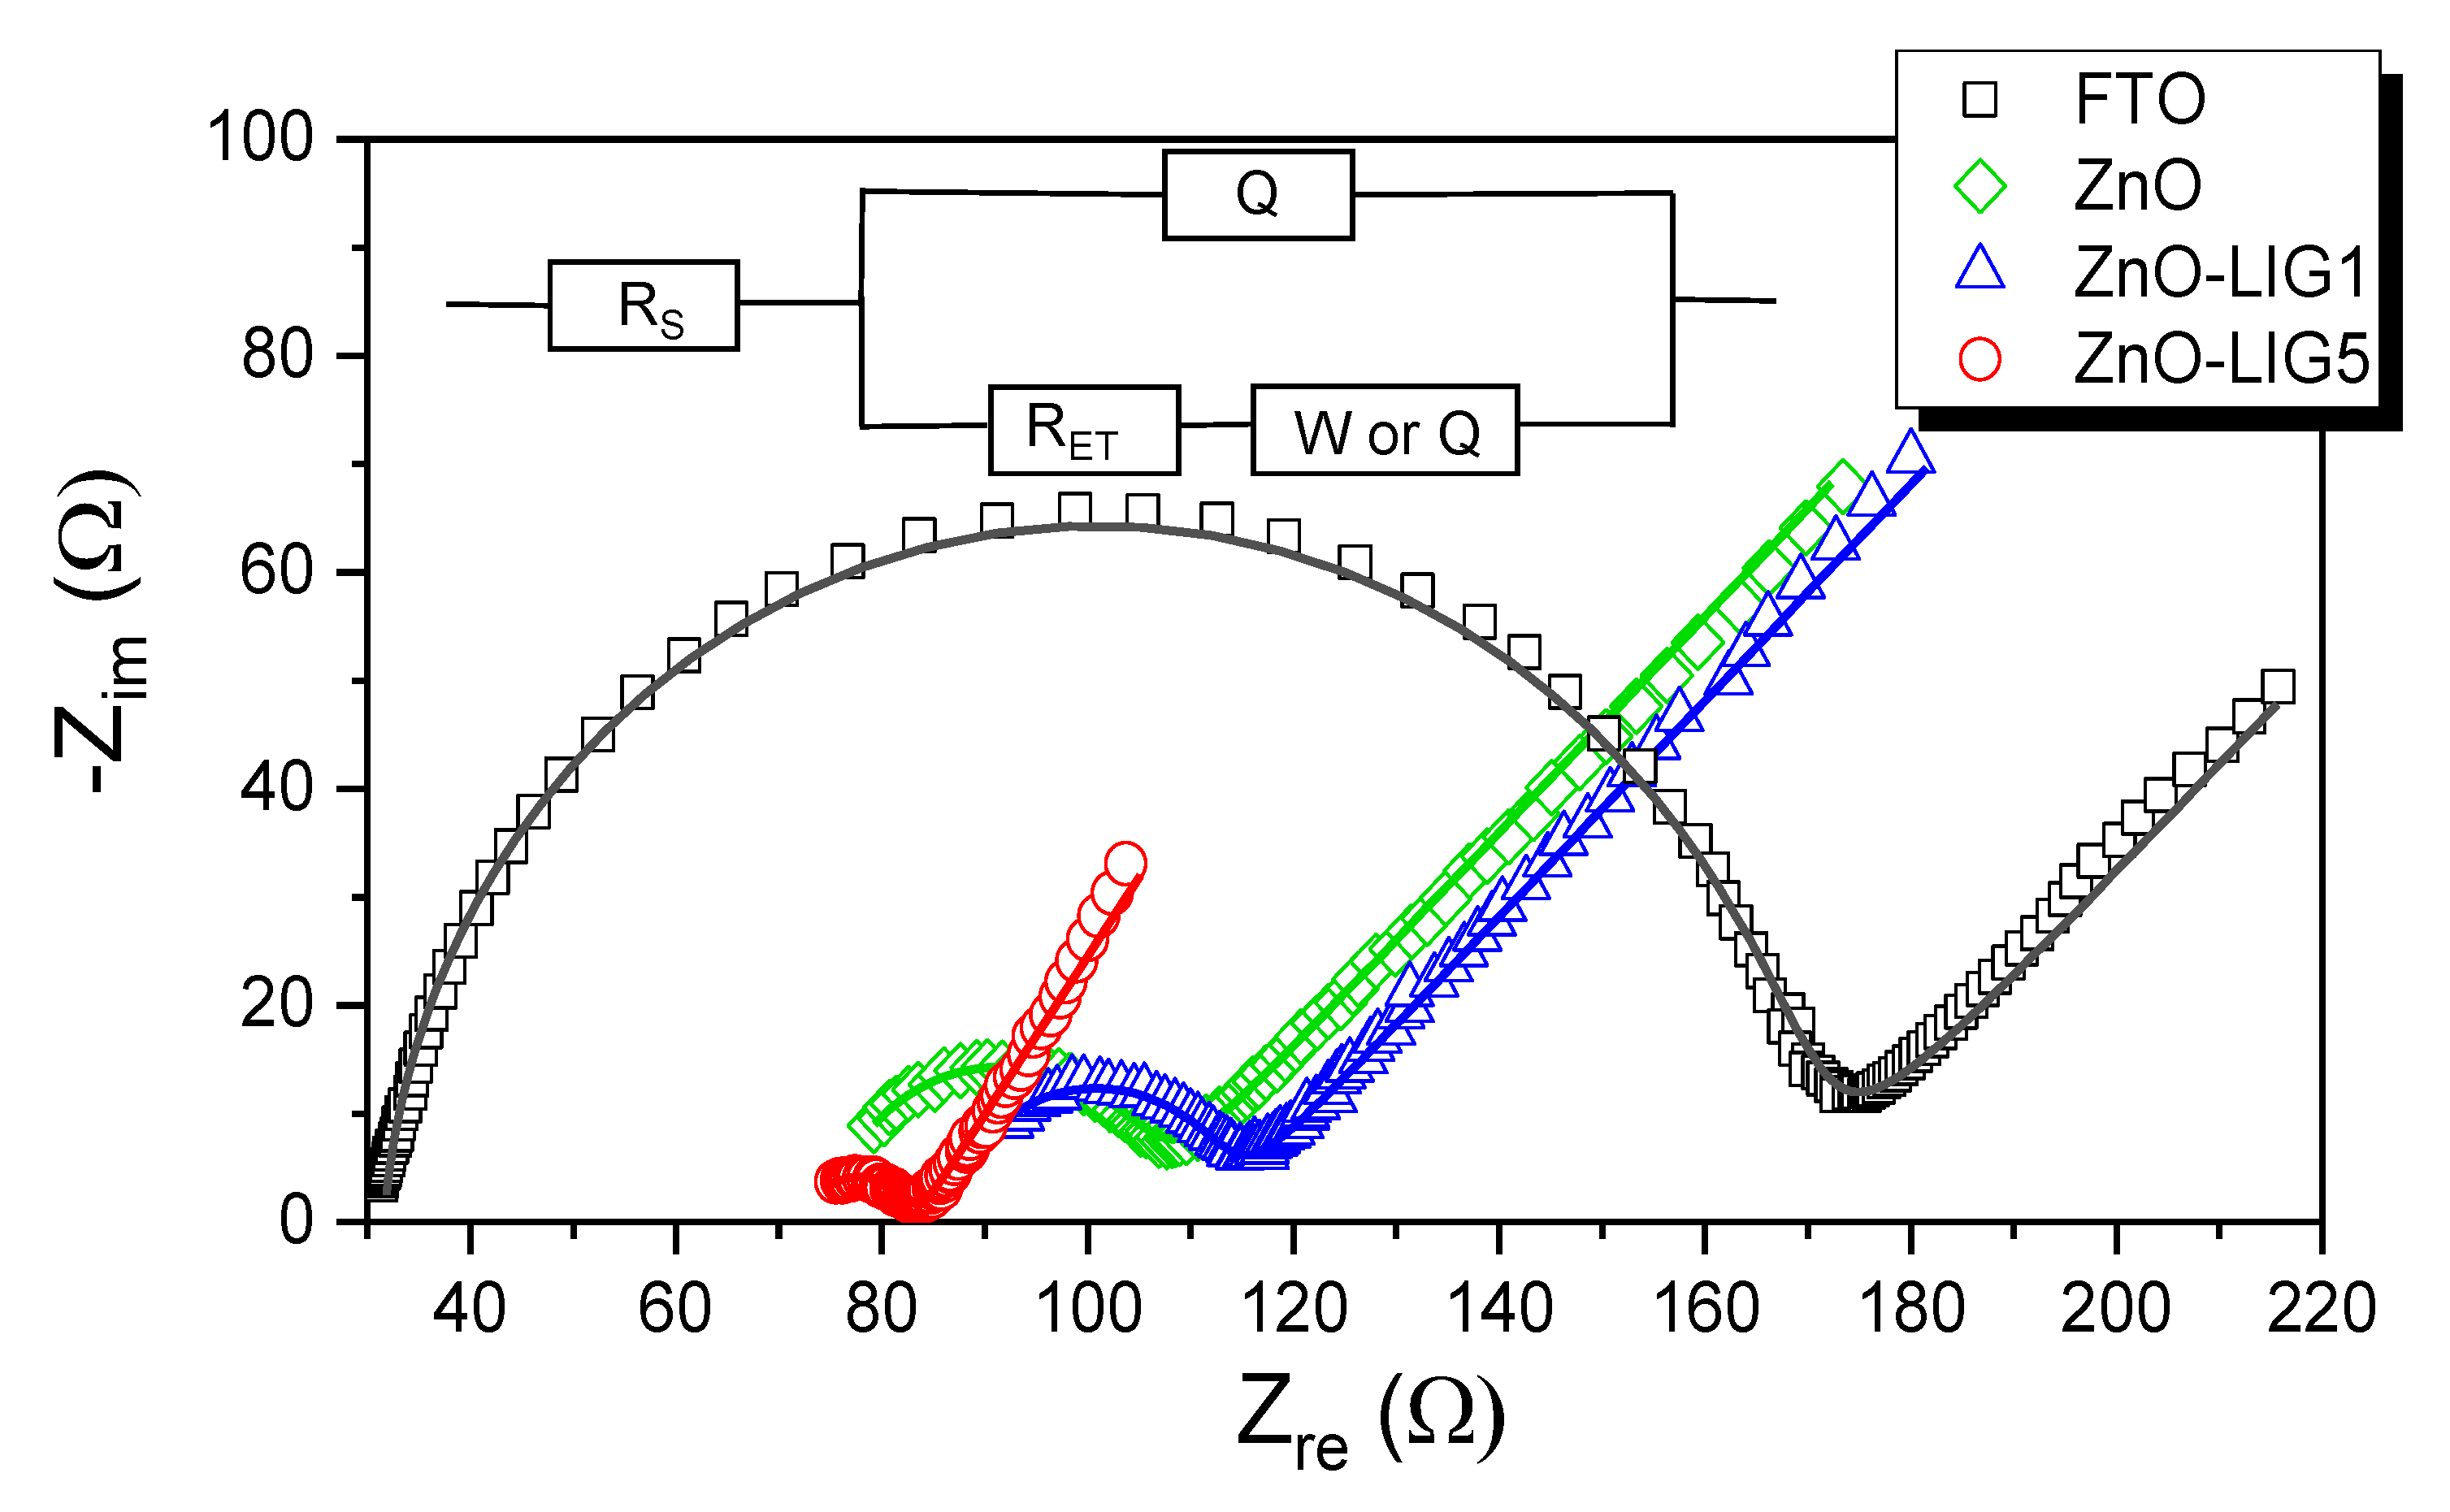
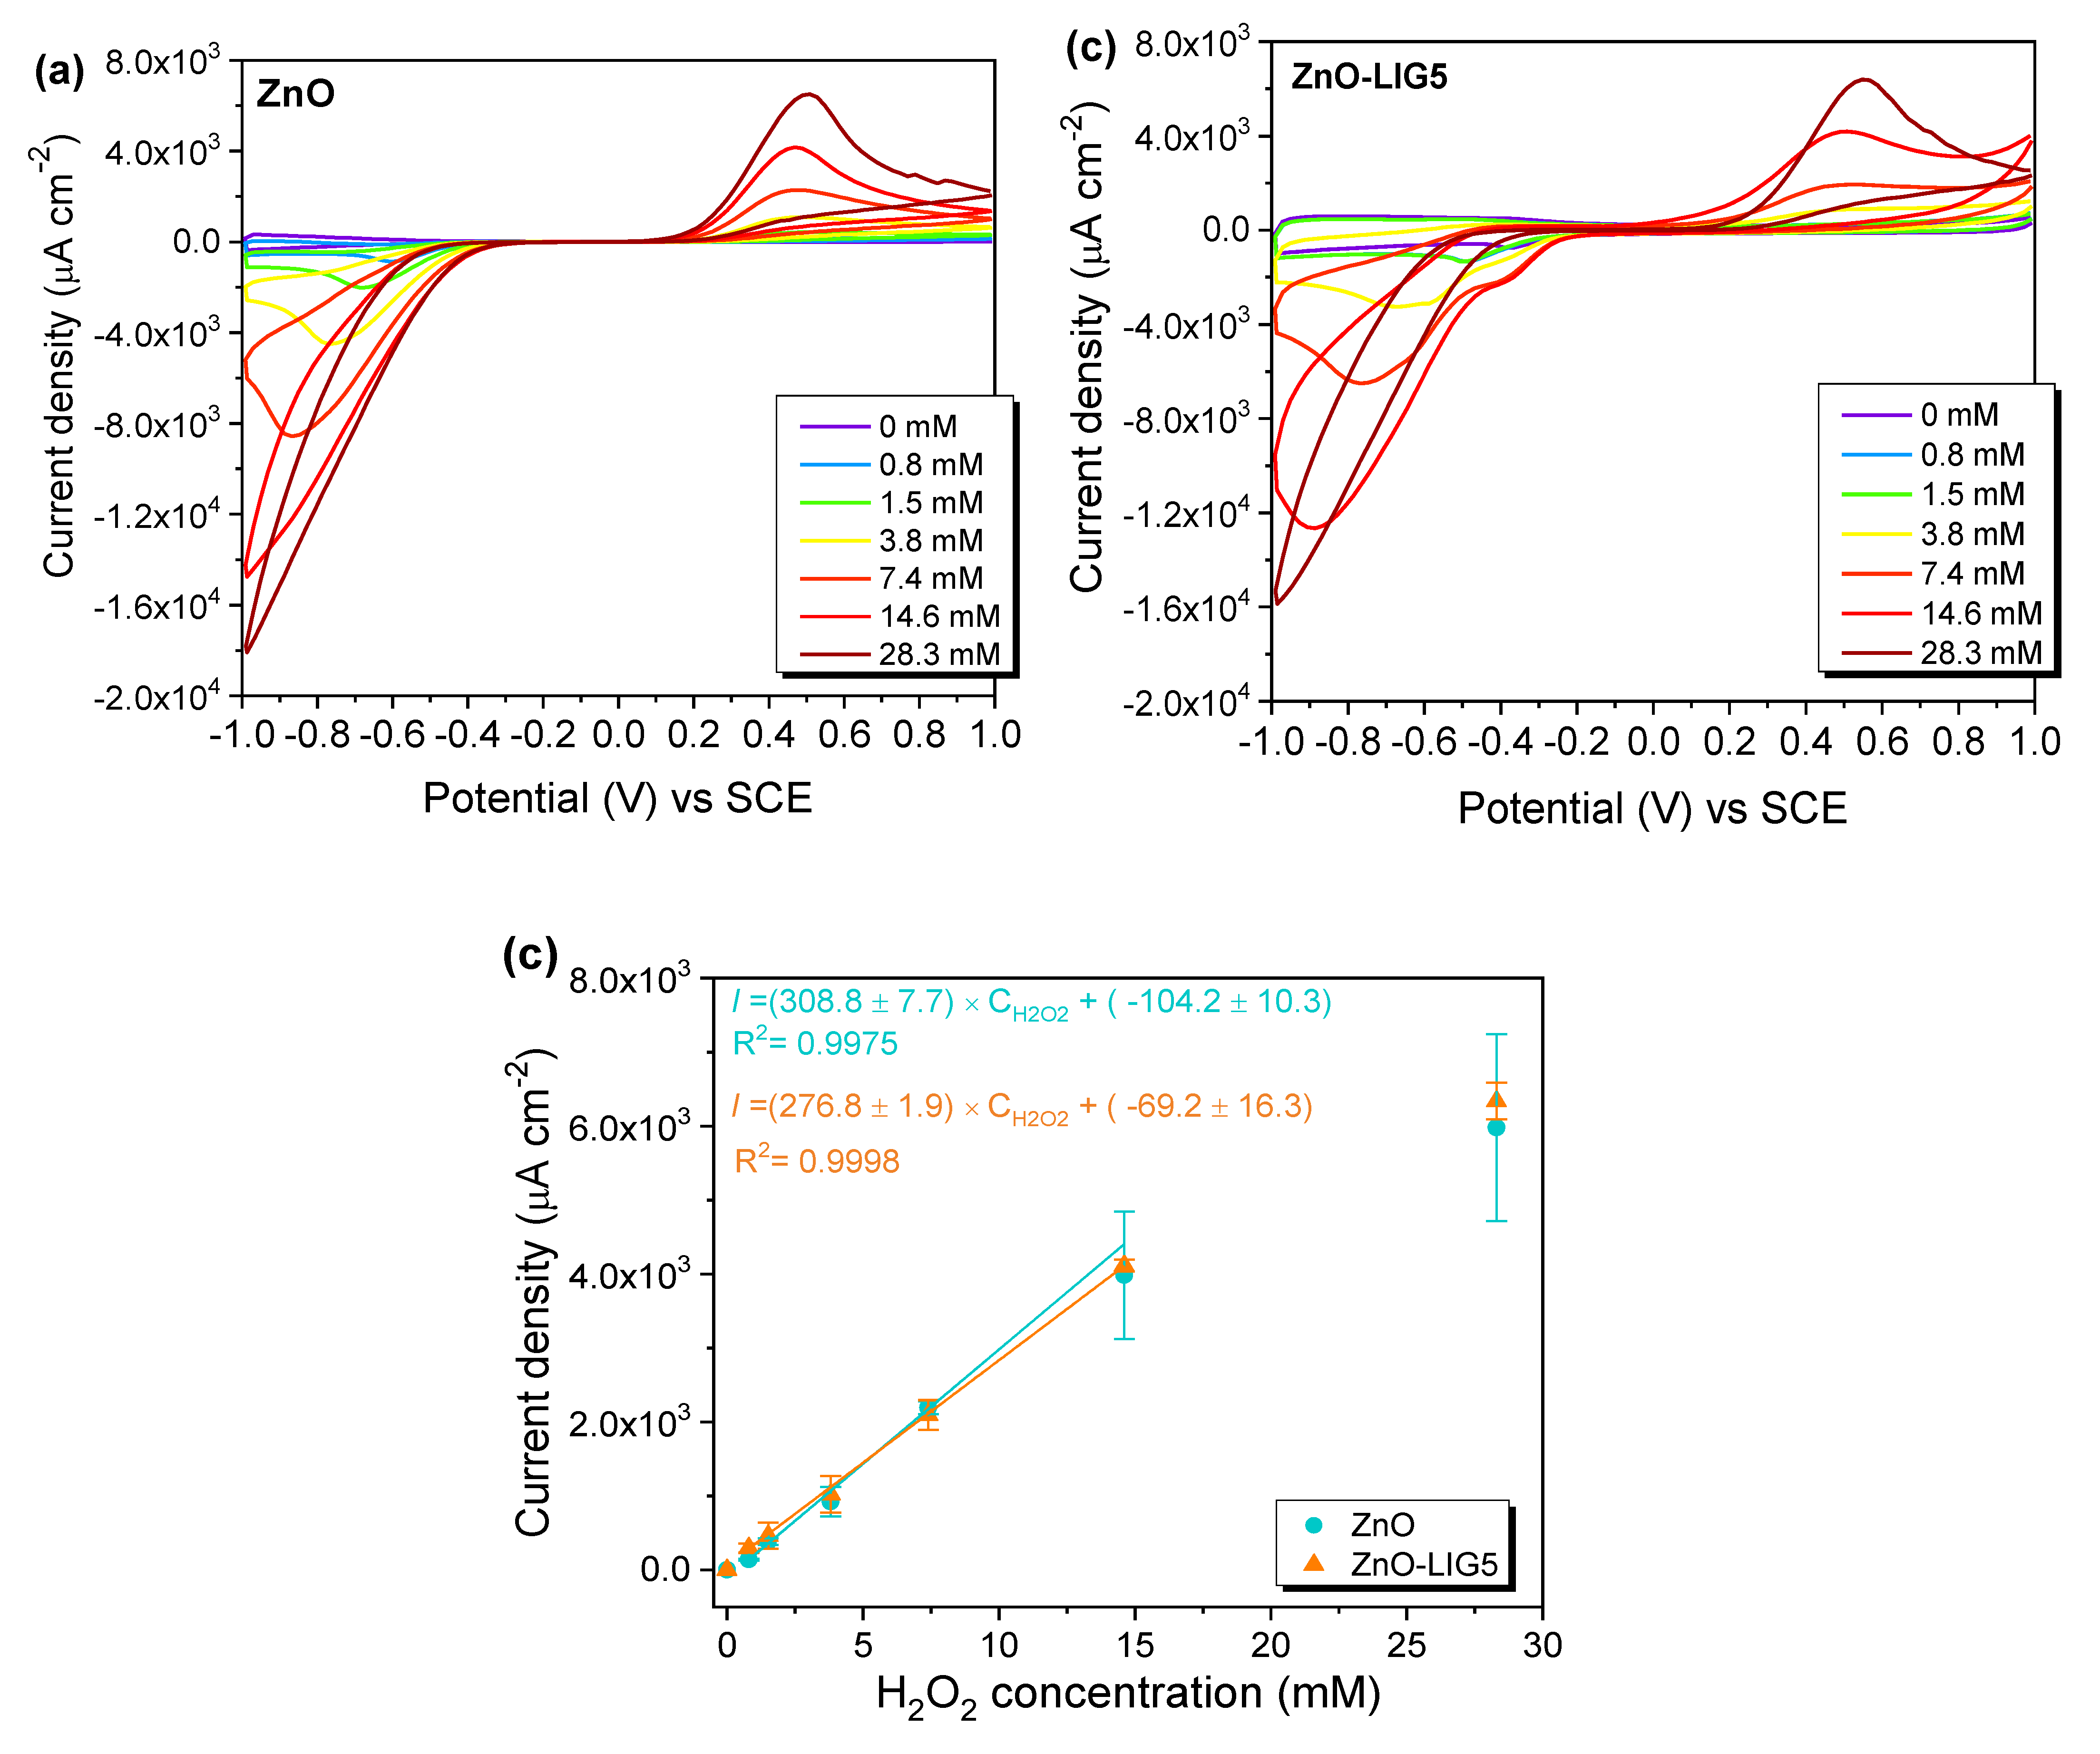
3.3. Electrochemical Evaluation

The general electrochemical characteristics of the ZnO and ZnO/LIG samples were assessed prior to H2O2 detection. In particular, CV and EIS measurements were performed employing ferro/ferricyanide ([Fe(CN)6]4−/3−), which constitutes a standard, well-behaved redox probe widely used to characterize and compare electrode electrochemical responses. First, CV in PS, followed by CV in 10 mM of [Fe(CN)6]4− in PS, were recorded and are displayed in Figure 6.
All samples denoted a quasi-rectangular shape even at a high scan rate of 100 mV s−1, indicating well-behaved capacitance with no relevant resistive losses. Anodic (cathodic) current increase at more positive (negative) potentials indicates the beginning of faradaic reactions involving O2, as explained in the next section. By increasing the LIG amount in the composite, an increase of the overall current background is observed (Figure 6a), indicating an enhancement in the transducer capacitance. Moreover, a well-defined pair of peaks was observed when the CV was run in the presence of [Fe(CN)6]4− (see Figure 6b). This was the result of the electrochemical oxidation of the Fe(II) on the ferrocyanide complex to Fe(III), anodic peak, and then the reduction of Fe(III), the cathodic peak. For all samples, the half-wave potential (E1/2) of this pair of peaks was at ~0.215 V vs. Ag/AgCl (1 M KCl). The current was higher with increasing LIG content, in accordance with the trends of Figure 6a. This is a clear indication that the electrochemically active area increased after the addition of LIG, both regarding capacitive and faradaic phenomena.
A scan rate dependence study was carried out to better understand how the ferri/ferrocyanide species interacted with the surface of the samples (i.e., surface control or mass transport) and to determine the standard heterogeneous electron transfer rate constant (k0) of each one. Figure 7a shows the CVs obtained at varying scan rates (from 20 to 500 mV s−1) of the ZnO-LIG5 sample. Similar studies for the remaining samples are depicted in Figure S4 in the SM. Note that these measurements were performed in triplicate for all samples.
Figure 7b shows that the correspondent peak current density scaled linearly with the square root of the scan rate, indicating a ferri/ferrocyanide diffusion-limited process with limited contribution from strongly adsorbed species, if any. The faradaic electrochemically active areas (Aeff) were calculated from the slope of the linear regressions of the anodic branches using the Randles–Ševčík relation (Equation (3)), and the results are shown in Table 1. The calculated Aeff for the ZnO sample was somewhat lower than the geometrical area of the electrode (0.125 cm2), however, the increasing amount of LIG incorporated in the samples led to a noticeable increase in Aeff, especially for the ZnO-LIG5 sample. This is in accordance with the enhanced electrochemical activity provided by graphene-based materials [101,102].
As seen in Figure 7a, anodic to cathodic peak separation (ΔEp) increased with increasing scan rate, meaning that the ferro/ferricyanide redox reaction was not completely reversible and entered a quasi-reversible regime. In such conditions, one can apply the Nicholson method (as described in the Materials’ Characterization section) to assess the k0 of the different samples by constructing a dimensionless Ψ function and correspondent slope analysis within its linear range. The k0 gives important information on the ability of the electrodes to undergo faradaic charge transfer, a crucial aspect in many types of biosensors. As seen in Table 1, the k0 values tended to increase with increasing concentration of LIG, from (3.0 ± 0.4) × 10−3 (ZnO) to (4.3 ± 0.4) × 10−3 cm s−1 (ZnO-LIG5). This was due to the swift electron transfer capabilities provided by the edgy/platelet-like graphene morphologies [51,103,104], the values of k0 for the as-synthesized LIG in the literature reaching ca. 10−2 cm s−1 [51].
The swifter faradaic electron transfer occurring with the addition of LIG to ZnO was also visible in the EIS measurements presented in Figure 8.Indeed, the impedimetric response of the electrode to an AC perturbation in a particular frequency range depends on k0. The swifter the electron transfer, the smaller the overpotentials will be to drive the redox reaction and thus the associated electron transfer resistance (RET) decreases. The RET is identifiable by the partial semicircle at higher frequencies and, in simple terms, the larger its diameter, the higher the resistance [76]. One can see that RET was larger for the bare FTO and decreased following the ZnO, ZnO-LIG1, and ZnO-LIG5 order (see also Table 1), in qualitative accordance with the derived k0 values. For all samples, the impedimetric response was composed of regions dominated by RET and mass transfer (diffusion); the latter was identifiable by the straight line with a positive slope toward lower frequencies. Hence, a Rs[Q[RETW]] equivalent circuit (EC) was employed to model the impedimetric response of all electrodes (inset of Figure 8), except for the ZnO-LIG5 electrode, which was modeled via a Rs[Q[RETQ]] EC. These types of ECs, often referred to as modified Randles circuits, contemplate an equivalent series ohmic resistance Rs, a constant phase element Q, which models non-ideal capacitive phenomena arising from surface roughness, and a diffusional element W or Q, accounting for the diffusion-limited mass transfer toward the electrode surface at lower frequencies. The Warburg (W) element was identifiable by a straight line with a unitary slope and resulted from a semi-infinite planar diffusion mechanism [76], which is adequate for the case of the FTO, ZnO, and ZnO-LIG1 electrodes. However, this was not the case for the ZnO-LIG5 electrode, for which the lower frequency diffusion-governed portion of the Nyquist plot presented a slope higher than unity. The Q element is a general mathematical construction from which the W element can be derived as a special case and herein another Q is needed to properly model the cell impedimetric response. This suggests limitations of the semi-infinite diffusional regime posed by the ZnO-LIG5 composite electrodes. This behavior needs clarification in future works (e.g., by extending the frequency range down to 10 mHz or lower).
Finally, it is noteworthy that the total ohmic series resistance Rs was seen to increase by ca. 50 Ω after ZnO or ZnO/LIG composite deposition, as expected due to the additional ohmic barrier posed by the deposited material. Nevertheless, in general, the parameters determined in all these measurements are encouraging for the application of these transducers in electrochemical detection of important analytes such as H2O2, as performed in the next section.

3.4. H2O2 Sensing via PL and CV

As the main goal was to use these materials to construct transducer platforms for sensing devices such as enzymatic biosensors, the first approach to infer their suitability to the envisaged application was to test them in the presence of several H2O2 concentrations and assess their response. Hence, both PL and CV studies were conducted on the prepared samples when in contact with H2O2. Acquiring these two distinct types of physical signals enabled a more accurate and reliable detection, as the interactions that led to them may originate from different phenomena, providing complementary information that is highly beneficial for improving the response of sensing devices.
Figure 9 shows the results for the PL signal measured for different H2O2 concentrations (in PS). In this case, ZnO and ZnO-LIG5 samples were selected, as they were the ones that exhibited more distinct PL outcomes. Figure 9a,b display the representative spectra for each type of sample. However, before discussing the H2O2 effect, it is worth mentioning that the immersion of the ZnO and ZnO/LIG samples into the PS already induced significant and reproducible variations in the PL signal, as shown in Figure S5. This behavior indicates that changes in the surface charge density, and therefore in the band bending dynamics, happen upon the immersion (see the schemes in Figure S6). In brief, a strong reduction of the PL intensity and a change in the GL/UV ratio were identified in both samples after their immersion in PS and under UV radiation. However, under continuous UV irradiation, the PL signal of the ZnO sample fairly recovered its initial intensity and spectral shape, remaining constant for further illumination after nearly ~2.5 h (Figure S5a). On the other hand, the changes in the PL spectra of the ZnO/LIG composite after immersion and under irradiation seemed to be rather stable (Figure S6b), and the signal was seen to be constant after only ~30 min. A discussion of the possible phenomena occurring for both cases is detailed in the SM.
After this initial stabilization in PS, the samples were probed when immersed in different concentrations of H2O2. Therefore, further analysis was made by comparing the spectra obtained in the PS (0 mM of H2O2, after signal stabilization) with the ones recorded after adding H2O2. As such, it was verified that in both cases, a blue luminescence (BL) band peaked at ~438 nm/~2.83 eV developed with increasing H2O2 concentration, being more evident for the concentration of 4.4 mM and above. With the enhancement of the BL, both blue and green bands became overlapped, hampering a proper evaluation of the evolution of the latter. Nonetheless, the BL was seen to dominate over the GL above the concentration of ~8.7 mM. This blue band was due to H2O2 emission, as corroborated by the spectrum in Figure S7a, where a comparison between the PL of the 100 mM H2O2 solution and the ZnO sample immersed in a similar solution was made. Furthermore, the peak intensity of the UV recombination also increased with the H2O2 concentration, and this change in the intensity was maintained even after being removed from the solution, indicating that the H2O2 reacted with the ZnO surface (see Figure S7b). This behavior plays a more noteworthy role in the case of the bare ZnO sample than in the case of the composite. These results contradict the ones obtained by Sodzel et al. [60], who reported the evolution of the PL signal of ZnO nanoparticles (commercially acquired from Sigma-Aldrich) in the presence of H2O2 and recorded the decrease in both UV and GL intensity with H2O2 increasing concentration (similar range as the present work). According to them, this effect was mediated by the defects located at the surface of the semiconductor, which were influenced by the presence of H2O2. They claimed that this compound decomposed catalytically on the ZnO surface into H2O and O2, accepting electrons from the conduction band of ZnO during the reaction, and thus inhibiting the radiative recombination of the carriers, which led to the PL quenching [60]. However, one can infer that the presence of H2O2 may have a direct impact on the surface defects in ZnO. The hydrogen peroxide solution is known to be unstable and can be easily decomposed, providing active oxygen atoms that can fill oxygen vacancies [64,105]. Assuming that these defects are surface-related ones that contribute to the band bending, their reduction expectably leads to a higher probability of radiative recombination by the electron-hole pairs, hence enhancing the FX-related transitions in the UV spectral region.
Figure 9c depicts the average evolution of the BL/UV intensity ratio for the ZnO and ZnO-LIG5 samples, which exhibited a very distinct behavior from each other (see the behavior for each sample in Figure S8). The data were fairly linear in the concentration range between 1.8 mM and 32.7 mM. Therefore, assuming the BL/UV ratio as the response of the present sensors to the concentration of H2O2 in the solution, a linear calibration curve could be defined, as plotted in Figure 9c. Linearity is an important characteristic in a sensing device as it is related to the accuracy of the response assessed and can be linked to the resolution of the biosensor in the analyzed range of analyte concentrations [106,107,108]. This property is directly associated with the sensitivity (S) of the sensor, which is defined as the minimum concentration variation that the device is capable of distinguishing and it is given by the slope of the calibration curve [106,107]. From the present results, it was verified that the slope of the data points for the case of the composite was higher than the one for the bare ZnO (0.026 vs. 0.0079 mM−1), suggesting that greater sensitivity was achieved for the ZnO-LIG5 sample. The LOD parameter is also critical in biosensors and can be expressed as LOD = 3σ/S, where σ corresponds to the standard deviation from the calibration curve [109,110]. In this case, LODs of 0.8 mM and 0.45 mM were estimated for the ZnO and ZnO-LIG5 samples, respectively. Hence, the obtained results indicate that the changes observed in the PL signal of the present samples with H2O2 can be exploited as a possible transduction mechanism to assess the concentration of this chemical compound.
Even though the use of PL for direct sensing of this compound is not widely employed, some reports can be found in the literature using different materials as transducers [60,63,111,112]. For instance, Sarangi et al. [63] used ZnO nanorods to probe H2O2 and glucose (via H2O2 detection). In line with the work by Sodzel et al. [60], they observed the quenching of the UV intensity with increasing glucose concentration. Despite observing different effects on the PL response of their samples than those reported here, they obtained a linear detection range between 0.5 and 30 mM, which is in agreement with the present one. Moreover, these authors reported a sensitivity of 0.014 mM−1, which was slightly lower than that identified here for the ZnO-LIG5 sample.
The electrochemical assessment of H2O2 detection was performed by CV analysis. First, the electrodes were swept from −1 to 1 V in the presence and absence of O2, as depicted in Figure 10. It is worth noting that the measurements were carried out in a homemade electrochemical cell with an inlet of N2 and an outlet for the O2 (see Figure S2b). The electrolyte was bubbled for 30 min with N2 to remove the O2 from the solution and kept under a N2 gas blanket. The ZnO electrode presented one reduction peak at −0.627 V (see Figure 10a), which was ascribed to the electrochemical reduction of O2 (Equation (4)) as it disappeared after being purged from the electrolyte (Figure 10b).
O 2 + 4 H + + 4 e Δ 2 H 2 O
Moreover, the electrodes containing LIG presented an additional reduction peak at −0.467 V and −0.481 V for the composites with 1 mg and 5 mg of LIG, respectively, in the presence of O2 (Figure 10a). In the absence of O2, these peaks were still observed, but shifted to lower negative potentials, as can be observed in Figure 10b. The nature of these peaks is not clear, since it was not noticeable neither in the ZnO sample nor in other works using as-synthesized LIG. Nevertheless, as it increased with the LIG content, one possible explanation is the involvement of new electroactive groups present in LIG and promoted by its mixture with the organic compounds and the subsequent thermal treatment performed in air at 400 °C. As discussed for the Raman data concerning the change in the ID/IG between the as-synthesized and deposited LIG (see Figure 3), the employed processing steps may introduce new functional groups and/or defects in LIG, particularly an increase in the oxidation due to the thermal treatment in air. Therefore, it is fair to assume that these groups/defects can be responsible for the observed peak. The contributions from additional effects due to ZnO-LIG interaction can also play a role, as it was also seen to induce changes in the Raman spectra and, thus, in the density/type of defects.
Concerning the electrochemical detection of H2O2, it is important to mention that the homemade electrochemical cell has a small aperture that allows for the addition of small volumes of the analyte, in absence of O2 and under stirring (see Figure S2 in SM). Therefore, the experiments on the detection of H2O2 were performed without O2 and a well-defined volume of PS was used as the electrolyte. Small volumes of H2O2 stock solution were added and the cyclic voltammograms recorded as displayed in Figure 11. The ZnO and ZnO-LIG5 electrodes were evaluated and displayed similar electrochemical behavior, with an anodic peak between 0.5 and 0.6 V observed with the increase in H2O2 concentration. This peak arises from the electrochemical oxidation of H2O2 following Equation (5).
H 2 O 2 Δ 2 H + + 2 e + O 2
An increase of cathodic current intensity was also observed in the more negative potentials due to the generation of O2, as a result of H2O2 electrooxidation (Equation (5)), which was then reduced according to Equation (4).
Similarly, and as explained before in the PL studies, a calibration curve was calculated (Figure 11c) to assess the sensor response for ZnO and ZnO-LIG5 electrodes. The maximum intensity of the anodic peak related to H2O2 oxidation (between 0.5 and 0.6 V) was plotted as a function of the H2O2 concentration for all electrode samples, as depicted in Figure S9, and the average is displayed in Figure 11c. Here, the response was found to be linear in the concentration range from 0 to 14.6 mM, evidencing sensitivities of ~308.8 and ~276.8 μA mM−1 cm−2 for ZnO and ZnO-LIG5, respectively. LOD values of 0.11 and 0.19 mM were obtained for ZnO and ZnO-LIG5, respectively. Even though the ZnO-LIG5 composite showed an enhanced electron transfer compared with ZnO (see Section 3.3), these results indicate that the H2O2 detection occurred due to the electrocatalytic activity of ZnO, and in this case, LIG had no significant effect on H2O2 detection via CV using the potential at ~+0.6V vs. SCE.
An overall overview of the performance of the electrode points to a better response of the electrochemical sensors in the low concentration range, while the PL-based sensing maintained linearity for higher concentrations. In this way, the sensor detection range can be extended using the same transducer platform and by analyzing the analyte-containing sample using a combination of both methods. Moreover, the possibility of a cross-checking of the results by the inspection of the two types of calibration curves makes a device constructed in this way more interesting, offering in situ counter-proof analyses without the need of collecting another sample, with the potential to be a major improvement in the biosensing field. Table 2 displays a summary of the sensing figures of merit for the here studied sensors, as well as a comparison with those reported in the literature for ZnO-based H2O2 sensors. As above-mentioned, PL sensing is scarcely used in this type of sensor, whereas transduction via electrochemical assessment using ZnO and ZnO-based composites is far more common [113,114,115,116,117,118,119]. A brief literature comparison from recently published papers revealed that the values obtained for the sensitivity in the present samples were superior to most of those reported for ZnO-based electrodes [117,118,119,120]. Regarding the LOD, values in the µM range can already be attained for ZnO composites with noble metals or mesoporous carbon [117,118,119]. Nevertheless, the here estimated LODs are well in line with the ones required for glucose sensing, for instance, indicating the suitability of these materials to be used as transducers in further biosensing applications. Besides, a great number of works devoted to H2O2 detection via CV analysis operates at negative potentials, where the O2 interference can play a non-negligible role. Conversely, in the present work, this probing was performed at ~+0.6 V vs. SCE, which is advantageous to reduce the O2 contribution. Furthermore, to the best of our knowledge, it is the first time that PL and CV signals were combined to provide the final sensing response, which can be useful when counter-proof measurements are needed, as well as to assess different concentration ranges.

4. Conclusions

In summary, ZnO/LIG composites were prepared using LAFD produced ZnO and LIG scraped from the original polyimide substrate, mixed at controlled ZnO:LIG weight ratios (50:1 and 50:5). The photoluminescence assessment showed that by mixing LIG with the ZnO tetrapods, changes occurred to the spectra when compared with bare ZnO. The intensity of the UV emission at RT, mostly related to the FX recombination, was seen to significantly increase for the ZnO-LIG5 sample, while a similar reduction in the GL intensity was observed for both composites. Such phenomena were attributed to charge transfer processes both from ZnO to LIG (decrease in the GL associated with surface states), as well as from LIG to the semiconductor (increase in the excitonic-related transitions). By cooling down the samples to 14 K, a strong enhancement in the intensity of the emission line resultant from the overlapping of FX and DX recombination was clearly identified for the ZnO-LIG5 sample, in line with the results recorded at RT. Furthermore, the intensity of the 3.31 eV line (related to surface defects) also experienced a similar increase in both composites, suggesting a higher population of those states promoted by the presence of LIG.
The CV and EIS measurements using the [Fe(CN)6]4−/3− redox pair indicated swifter electron transfer kinetics and increased electrochemically active area with the amount of LIG incorporated in the samples. The heterogeneous electron transfer rate constants were within ~3.0 to 4.3 × 10⁻³ cm s−1, which supports the adequateness of these electrodes for faradaic biosensing.
H2O2 monitoring using ZnO and ZnO-LIG5 materials as transducers was proven to be feasible and evidenced promising results. Both PL and CV analysis enabled tracing the calibration curves for each type of sample. In the case of the detection via PL, the ZnO and ZnO-LIG5 samples were revealed to be sensitive in the range of 1.8 to 32.7 mM (maximum concentration tested), with the composite sample exhibiting a higher sensitivity and a lower limit of detection, 0.45 mM of H2O2 vs. the 0.68 mM obtained for ZnO. Contrasting with the PL results where a marked difference was observed for the calibration curve of two types of samples, CV measurements evidenced similar behavior for both samples. In this case, the linear range was found between 0.8–14.6 mM, and LOD values of 0.11 and 0.19 mM were estimated for ZnO and ZnO-LIG5, respectively, indicating that the CV detection yielded lower LODs compared to PL. Therefore, it was verified that both signals can effectively be used for transduction anddisplay different detection ranges that can be used to complement the sensing response in a single device.
Overall, the present results indicate that the prepared materials exhibit promising properties for several technological applications, namely in the biosensing field.

Supplementary Materials

The following are available online at https://0-www-mdpi-com.brum.beds.ac.uk/article/10.3390/chemosensors9050102/s1; Figure S1: Pictures of the produced samples that were obtained after the thermal treatment; Figure S2: (a) PL and (b) electrochemical experimental setups used for the assessment of H2O2 detection; Figure S3: Temperature dependence PL recorded in the UV-visible range for the samples: (a) ZnO, (b) ZnO-LIG1 and (c) ZnO-LIG5. The samples were excited with the 325 nm line of a He-Cd laser. The insets correspond to a magnification of the UV spectral region, showing a higher range of temperatures; Figure S4: Cyclic voltammograms at different scan rates, from 20 to 500 mV s1, of representative samples of (a) ZnO and (b) ZnO-LIG1 using 10 mM of [Fe(CN)6]4− in PS as the electrolyte. Inset: Corresponding plot of ∆Ep and Ψ parameter against υ−1/2; Figure S5: Representative PL spectra obtained for the (a) ZnO and (b) ZnO-LIG5 before and after their immersion into the physiological solution (from 5 min to 3 h) under UV illumination (He-Cd laser); Figure S6: Schematic diagram illustrating the effect of the immersion of the samples in the PS solution and subsequent continuous UV irradiation: (a) ZnO and (b) ZnO-LIG5 (representative for ZnO/LIG composites; for clarity, functional groups of LIG are not displayed in the simplified representation of LIG). The straight arrows denote radiative recombination processes. h1 and h2 correspond to the heights of the potential barrier for ZnO and ZnO-LIG5, respectively. The full circles represent electrons, while the open ones correspond to holes; Figure S7: (a) Comparison between the PL signal of 100 mM of H2O2 (in DI water) and the one of the ZnO sample immersed in a similar solution. (b) PL spectra of a ZnO sample before, during and after its immersion in a 25 mM of H2O2 solution (in DI water); Figure S8: Peak intensity ratio BL/UV (measured at 438 nm and 380 nm, respectively) as a function of the H2O2 concentration for the tested (a) ZnO and (b) ZnO-LIG5 samples; Figure S9: Current density at the peak maxima (located at ~0.5 - 0.6 V) as a function of the H2O2 concentration obtained for the three replicas of (a) ZnO and (b) ZnO-LIG5 samples; Table S1: Summary of the growth/synthesis condition employed for both materials comprising the ZnO/LIG composites.

Author Contributions

J.Z. and J.P.M. prepared the samples; J.Z. and A.J.S.F. conducted the Raman measurements; J.Z. and S.O.P. carried out the electrochemical characterization and H2O2 monitoring via CV analysis; N.F.S. and A.F.C. recorded the SEM images; S.O.P., N.F.S. and F.M.C. conducted the electrochemical analysis; J.R. was responsible for the PL and PLE measurements, the monitoring of H2O2 via PL and writing of the original draft of the manuscript; J.R. and T.M. performed the optical data interpretation; J.R. and S.O.P. supervised the work. All authors participated in the discussion of the results, as well as in the reviewing and editing process of the final paper. All authors have read and agreed to the published version of the manuscript.

Funding

This research was funded by national funds through the FCT–Portuguese Foundation for Science and Technology under the i3N project UIDB/50025/2020 & UIDP/50025/2020. Funds were also received from FCT/MEC and FEDER, through the COMPETE 2020 Program, under project PTDC/NAN-MAT/28755/2017 (POCI-01-0145-FEDER-028755). The APC was funded by the project PTDC/NAN-MAT/28755/2017.

Institutional Review Board Statement

Not applicable

Data Availability Statement

The raw/processed data required to reproduce these findings can be shared upon request.

Acknowledgments

S.O.P. and N.F.S. thank i3N for the BPD grants (BPD/UI96/5808/2017 and BPD/UI96/5177/2020, respectively).

Conflicts of Interest

There are no conflict of interest to declare.

References

  1. Özgür, Ü.; Alivov, Y.I.; Liu, C.; Teke, A.; Reshchikov, M.A.; Doğan, S.; Avrutin, V.; Cho, S.-J.; Morkoç, H. A comprehensive review of ZnO materials and devices. J. Appl. Phys. 2005, 98, 041301. [Google Scholar] [CrossRef] [Green Version]
  2. Mishra, Y.K.; Adelung, R. ZnO tetrapod materials for functional applications. Mater. Today 2018, 21, 631–651. [Google Scholar] [CrossRef]
  3. Zhu, L.; Zeng, W. Room-temperature gas sensing of ZnO-based gas sensor: A review. Sens. Actuators A Phys. 2017, 267, 242–261. [Google Scholar] [CrossRef]
  4. Abebe, B.; Zereffa, E.A.; Tadesse, A.; Murthy, H.C.A. A Review on Enhancing the Antibacterial Activity of ZnO: Mechanisms and Microscopic Investigation. Nanoscale Res. Lett. 2020, 15, 190. [Google Scholar] [CrossRef]
  5. Rodrigues, J.; Ben Sedrine, N.; Correia, M.R.; Monteiro, T. Photoluminescence investigations of ZnO micro/nanostructures. Mater. Today Chem. 2020, 16, 100243. [Google Scholar] [CrossRef]
  6. Rodrigues, J.; Pereira, S.O.; Santos, N.F.; Rodrigues, C.; Costa, F.M.; Monteiro, T. Insights on luminescence quenching of ZnO tetrapods in the detection of hCG. Appl. Surf. Sci. 2020, 527, 146813. [Google Scholar] [CrossRef]
  7. Wang, Z.L. Nanostructures of zinc oxide. Mater. Today 2004, 7, 26–33. [Google Scholar] [CrossRef]
  8. Ozgür, U.; Hofstetter, D.; Morkoç, H. ZnO Devices and Applications: A Review of Current Status and Future Prospects. Proc. IEEE 2010, 98, 1255–1268. [Google Scholar] [CrossRef]
  9. Janotti, A.; Van De Walle, C.G. Fundamentals of zinc oxide as a semiconductor. Rep. Prog. Phys. 2009, 72, 126501. [Google Scholar] [CrossRef] [Green Version]
  10. Kumar, S.; Ahlawat, W.; Kumar, R.; Dilbaghi, N. Graphene, carbon nanotubes, zinc oxide and gold as elite nanomaterials for fabrication of biosensors for healthcare. Biosens. Bioelectron. 2015, 70, 498–503. [Google Scholar] [CrossRef] [PubMed]
  11. Shao, Y.; Wang, J.; Wu, H.; Liu, J.; Aksay, I.; Lin, Y. Graphene based electrochemical sensors and biosensors: A review. Electroanalysis 2010, 22, 1027–1036. [Google Scholar] [CrossRef]
  12. Zhou, M.; Zhai, Y.; Dong, S. Electrochemical Sensing and Biosensing Platform Based on Chemically Reduced Graphene Oxide. Anal. Chem. 2009, 81, 5603–5613. [Google Scholar] [CrossRef] [PubMed]
  13. Smazna, D.; Rodrigues, J.; Shree, S.; Postica, V.; Neubüser, G.; Martins, A.F.; Ben Sedrine, N.; Jena, N.K.; Siebert, L.; Schütt, F.; et al. Buckminsterfullerene hybridized zinc oxide tetrapods: Defects and charge transfer induced optical and electrical response. Nanoscale 2018, 10, 10050–10062. [Google Scholar] [CrossRef] [PubMed]
  14. Rodrigues, J.; Smazna, D.; Ben Sedrine, N.; Nogales, E.; Adelung, R.; Mishra, Y.K.; Mendez, B.; Correia, M.R.; Monteiro, T. Probing surface states in C60 decorated ZnO microwires: Detailed photoluminescence and cathodoluminescence investigations. Nanoscale Adv. 2019, 1, 1516–1526. [Google Scholar] [CrossRef] [Green Version]
  15. Rodrigues, J.; Mata, D.; Pimentel, A.; Nunes, D.; Martins, R.; Fortunato, E.; Neves, A.J.; Monteiro, T.; Costa, F.M. One-step synthesis of ZnO decorated CNT buckypaper composites and their optical and electrical properties. Mater. Sci. Eng. B 2015, 195, 38–44. [Google Scholar] [CrossRef] [Green Version]
  16. Messina, M.M.; Coustet, M.E.; Ubogui, J.; Ruiz, R.; Saccone, F.D.; dos Santos Claro, P.C.; Ibañez, F.J. Simultaneous Detection and Photocatalysis Performed on a 3D Graphene/ZnO Hybrid Platform. Langmuir 2020, 36, 2231–2239. [Google Scholar] [CrossRef] [PubMed]
  17. Rosas-Laverde, N.M.; Pruna, A.; Busquets-Mataix, D.; Pullini, D. Graphene Oxide-Assisted Morphology and Structure of Electrodeposited ZnO Nanostructures. Materials 2020, 13, 365. [Google Scholar] [CrossRef] [Green Version]
  18. Rodrigues, J.; Mata, D.; Fernandes, A.J.S.; Neto, M.A.; Silva, R.F.; Monteiro, T.; Costa, F.M. ZnO nanostructures grown on vertically aligned carbon nanotubes by laser-assisted flow deposition. Acta Mater. 2012, 60, 5143–5150. [Google Scholar] [CrossRef]
  19. Pargoletti, E.; Hossain, U.H.; Di Bernardo, I.; Chen, H.; Tran-Phu, T.; Lipton-Duffin, J.; Cappelletti, G.; Tricoli, A. Room-temperature photodetectors and VOC sensors based on graphene oxide–ZnO nano-heterojunctions. Nanoscale 2019, 11, 22932–22945. [Google Scholar] [CrossRef]
  20. Neelgund, G.M.; Oki, A. ZnO conjugated graphene: An efficient sunlight driven photocatalyst for degradation of organic dyes. Mater. Res. Bull. 2020, 129, 110911. [Google Scholar] [CrossRef]
  21. Jung, J.; Jeong, J.R.; Lee, J.; Lee, S.H.; Kim, S.Y.; Kim, M.J.; Nah, J.; Lee, M.H. In situ formation of graphene/metal oxide composites for high-energy microsupercapacitors. Npg Asia Mater. 2020, 12, 50. [Google Scholar] [CrossRef]
  22. Víctor-Román, S.; García-Bordejé, E.; Hernández-Ferrer, J.; González-Domínguez, J.M.; Ansón-Casaos, A.; Silva, A.M.T.; Maser, W.K.; Benito, A.M. Controlling the surface chemistry of graphene oxide: Key towards efficient ZnO-GO photocatalysts. Catal. Today 2020, 357, 350–360. [Google Scholar] [CrossRef]
  23. Rafiee, Z.; Mosahebfard, A.; Sheikhi, M.H. High-performance ZnO nanowires-based glucose biosensor modified by graphene nanoplates. Mater. Sci. Semicond. Process. 2020, 115, 105116. [Google Scholar] [CrossRef]
  24. Samouco, A.; Marques, A.C.; Pimentel, A.; Martins, R.; Fortunato, E. Laser-induced electrodes towards low-cost flexible UV ZnO sensors. Flex. Print. Electron. 2018, 3, 044002. [Google Scholar] [CrossRef]
  25. Palanisamy, S.; Cheemalapati, S. Enzymatic glucose biosensor based on multiwalled carbon nanotubes-zinc oxide composite. Int. J. Electrochem. Sci. 2012, 7, 8394–8407. [Google Scholar]
  26. Zhao, Y.; Li, W.; Pan, L.; Zhai, D.; Wang, Y.; Li, L. ZnO-nanorods/graphene heterostructure: A direct electron transfer glucose biosensor. Sci. Rep. 2016, 6, 32327. [Google Scholar] [CrossRef] [PubMed] [Green Version]
  27. Zhou, F.; Jing, W.; Xu, Y.; Chen, Z.; Jiang, Z.; Wei, Z. Performance enhancement of ZnO nanorod-based enzymatic glucose sensor via reduced graphene oxide deposition and UV irradiation. Sens. Actuators B Chem. 2019, 284, 377–385. [Google Scholar] [CrossRef]
  28. Low, S.S.; Tan, M.T.T.; Loh, H.-S.; Khiew, P.S.; Chiu, W.S. Facile hydrothermal growth graphene/ZnO nanocomposite for development of enhanced biosensor. Anal. Chim. Acta 2016, 903, 131–141. [Google Scholar] [CrossRef]
  29. Liu, F.; Zhang, Y.; Yu, J.; Wang, S.; Ge, S.; Song, X. Application of ZnO/graphene and S6 aptamers for sensitive photoelectrochemical detection of SK-BR-3 breast cancer cells based on a disposable indium tin oxide device. Biosens. Bioelectron. 2014, 51, 413–420. [Google Scholar] [CrossRef]
  30. Liu, F.; Deng, W.; Zhang, Y.; Ge, S.; Yu, J.; Song, X. Application of ZnO quantum dots dotted carbon nanotube for sensitive electrochemiluminescence immunoassay based on simply electrochemical reduced Pt/Au alloy and a disposable device. Anal. Chim. Acta 2014, 818, 46–53. [Google Scholar] [CrossRef]
  31. Shaikshavali, P.; Madhusudana Reddy, T.; Venu Gopal, T.; Venkataprasad, G.; Kotakadi, V.S.; Palakollu, V.N.; Karpoormath, R. A simple sonochemical assisted synthesis of nanocomposite (ZnO/MWCNTs) for electrochemical sensing of Epinephrine in human serum and pharmaceutical formulation. Colloids Surf. A Phys. Eng. Asp. 2020, 584, 124038. [Google Scholar] [CrossRef]
  32. Yue, H.Y.; Zhang, H.J.; Huang, S.; Lu, X.X.; Gao, X.; Song, S.S.; Wang, Z.; Wang, W.Q.; Guan, E.H. Highly sensitive and selective dopamine biosensor using Au nanoparticles-ZnO nanocone arrays/graphene foam electrode. Mater. Sci. Eng. C 2020, 108, 110490. [Google Scholar] [CrossRef] [PubMed]
  33. RoyChaudhuri, C.; Chakraborty, B. Development of low noise FET biosensor using graphene and ZnO nanostructures on cost effective substrates for biomolecule detection with enhanced performance. CSI Trans. ICT 2020, 8, 129–136. [Google Scholar] [CrossRef]
  34. Nikolelis, D.P.; Varzakas, T.; Erdem, A.; Nikoleli, G.-P. Portable Biosensing of Food Toxicants and Environmental Pollutants; CRC Press: Boca Raton, FL, USA, 2013. [Google Scholar]
  35. Zhu, Y.-C.; Mei, L.-P.; Ruan, Y.-F.; Zhang, N.; Zhao, W.-W.; Xu, J.-J.; Chen, H.-Y. Enzyme-Based Biosensors and Their Applications. In Advances in Enzyme Technology; Elsevier: Amsterdam, The Netherlands, 2019; pp. 201–223. [Google Scholar]
  36. Kirsch, J.; Siltanen, C.; Zhou, Q.; Revzin, A.; Simonian, A.; Katz, E.; Katz, E.; Wang, J.; Bocharova, V.; Wang, J.; et al. Biosensor technology: Recent advances in threat agent detection and medicine. Chem. Soc. Rev. 2013, 42, 8733. [Google Scholar] [CrossRef]
  37. Sabu, C.; Henna, T.K.; Raphey, V.R.; Nivitha, K.P.; Pramod, K. Advanced biosensors for glucose and insulin. Biosens. Bioelectron. 2019, 141, 111201. [Google Scholar] [CrossRef]
  38. Rahman, M.M.; Ahammad, A.J.S.; Jin, J.-H.; Ahn, S.J.; Lee, J.-J. A Comprehensive Review of Glucose Biosensors Based on Nanostructured Metal-Oxides. Sensors 2010, 10, 4855–4886. [Google Scholar] [CrossRef]
  39. Narwal, V.; Deswal, R.; Batra, B.; Kalra, V.; Hooda, R.; Sharma, M.; Rana, J.S. Cholesterol biosensors: A review. Steroids 2019, 143, 6–17. [Google Scholar] [CrossRef]
  40. Saxena, U.; Das, A.B. Nanomaterials towards fabrication of cholesterol biosensors: Key roles and design approaches. Biosens. Bioelectron. 2016, 75, 196–205. [Google Scholar] [CrossRef]
  41. Muthuchamy, N.; Atchudan, R.; Edison, T.N.J.I.; Perumal, S.; Lee, Y.R. High-performance glucose biosensor based on green synthesized zinc oxide nanoparticle embedded nitrogen-doped carbon sheet. J. Electroanal. Chem. 2018, 816, 195–204. [Google Scholar] [CrossRef]
  42. Wang, M.; Ma, J.; Chang, Q.; Fan, X.; Zhang, G.; Zhang, F.; Peng, W.; Li, Y. Fabrication of a novel ZnO–CoO/rGO nanocomposite for nonenzymatic detection of glucose and hydrogen peroxide. Ceram. Int. 2018, 44, 5250–5256. [Google Scholar] [CrossRef]
  43. Lin, J.; Peng, Z.; Liu, Y.; Ruiz-Zepeda, F.; Ye, R.; Samuel, E.L.G.; Yacaman, M.J.; Yakobson, B.I.; Tour, J.M. Laser-induced porous graphene films from commercial polymers. Nat. Commun. 2014, 5, 5714. [Google Scholar] [CrossRef] [PubMed]
  44. Singh, S.P.; Li, Y.; Be’er, A.; Oren, Y.; Tour, J.M.; Arnusch, C.J. Laser-Induced Graphene Layers and Electrodes Prevents Microbial Fouling and Exerts Antimicrobial Action. Acs Appl. Mater. Interfaces 2017, 9, 18238–18247. [Google Scholar] [CrossRef]
  45. Ye, R.; James, D.K.; Tour, J.M. Laser-Induced Graphene. Acc. Chem. Res. 2018, 51, 1609–1620. [Google Scholar] [CrossRef] [PubMed]
  46. Carvalho, A.F.; Fernandes, A.J.S.; Martins, R.; Fortunato, E.; Costa, F.M. Laser-Induced Graphene Piezoresistive Sensors Synthesized Directly on Cork Insoles for Gait Analysis. Adv. Mater. Technol. 2020, 5, 2000630. [Google Scholar] [CrossRef]
  47. Zhu, C.; Tao, L.-Q.; Wang, Y.; Zheng, K.; Yu, J.; Li, X.; Chen, X.; Huang, Y. Graphene oxide humidity sensor with laser-induced graphene porous electrodes. Sens. Actuators B Chem. 2020, 325, 128790. [Google Scholar] [CrossRef]
  48. Yagati, A.K.; Behrent, A.; Beck, S.; Rink, S.; Goepferich, A.M.; Min, J.; Lee, M.-H.; Baeumner, A.J. Laser-induced graphene interdigitated electrodes for label-free or nanolabel-enhanced highly sensitive capacitive aptamer-based biosensors. Biosens. Bioelectron. 2020, 164, 112272. [Google Scholar] [CrossRef]
  49. Cardoso, A.R.; Marques, A.C.; Santos, L.; Carvalho, A.F.; Costa, F.M.; Martins, R.; Sales, M.G.F.; Fortunato, E. Molecularly-imprinted chloramphenicol sensor with laser-induced graphene electrodes. Biosens. Bioelectron. 2019, 124–125, 167–175. [Google Scholar] [CrossRef] [PubMed]
  50. Carvalho, A.F.; Fernandes, A.J.S.; Leitão, C.; Deuermeier, J.; Marques, A.C.; Martins, R.; Fortunato, E.; Costa, F.M. Laser-Induced Graphene Strain Sensors Produced by Ultraviolet Irradiation of Polyimide. Adv. Funct. Mater. 2018, 28, 1805271. [Google Scholar] [CrossRef]
  51. Santos, N.F.; Pereira, S.O.; Moreira, A.B.; Girão, A.V.; Carvalho, A.F.; Fernandes, A.J.S.; Costa, F.M. IR and UV Laser-induced Graphene: Application as dopamine electrochemical sensors. Adv. Mater. Technol. 2021. [Google Scholar] [CrossRef]
  52. Kulyk, B.; Silva, B.F.R.; Carvalho, A.F.; Silvestre, S.; Fernandes, A.J.S.; Martins, R.; Fortunato, E.; Costa, F.M. Laser-Induced Graphene from Paper for Mechanical Sensing. Acs Appl. Mater. Interfaces 2021, 13, 10210–10221. [Google Scholar] [CrossRef]
  53. Ye, R.; James, D.K.; Tour, J.M. Laser-Induced Graphene: From Discovery to Translation. Adv. Mater. 2018, 1803621. [Google Scholar] [CrossRef] [PubMed]
  54. Rodrigues, J.; Zanoni, J.; Gaspar, G.; Fernandes, A.J.S.; Carvalho, A.F.; Santos, N.F.; Monteiro, T.; Costa, F.M. ZnO decorated laser-induced graphene produced by direct laser scribing. Nanoscale Adv. 2019, 1, 3252–3268. [Google Scholar] [CrossRef] [Green Version]
  55. Ye, R.; Chyan, Y.; Zhang, J.; Li, Y.; Han, X.; Kittrell, C.; Tour, J.M. Laser-Induced Graphene Formation on Wood. Adv. Mater. 2017, 29, 1702211. [Google Scholar] [CrossRef] [PubMed]
  56. D’Amora, M.; Lamberti, A.; Fontana, M.; Giordani, S. Toxicity assessment of laser-induced graphene by zebrafish during development. J. Phys. Mater. 2020, 3, 034008. [Google Scholar] [CrossRef]
  57. Ye, R.; Peng, Z.; Wang, T.; Xu, Y.; Zhang, J.; Li, Y.; Nilewski, L.G.; Lin, J.; Tour, J.M. In Situ Formation of Metal Oxide Nanocrystals Embedded in Laser-Induced Graphene. Acs Nano 2015, 9, 9244–9251. [Google Scholar] [CrossRef] [PubMed]
  58. Xu, R.; Liu, P.; Ji, G.; Gao, L.; Zhao, J. Versatile Strategy to Design Flexible Planar-Integrated Microsupercapacitors Based on Co3O4 -Decorated Laser-Induced Graphene. Acs Appl. Energy Mater. 2020, 3, 10676–10684. [Google Scholar] [CrossRef]
  59. Tereshchenko, A.; Bechelany, M.; Viter, R.; Khranovskyy, V.; Smyntyna, V.; Starodub, N.; Yakimova, R. Optical biosensors based on ZnO nanostructures: Advantages and perspectives. A review. Sens. Actuators B Chem. 2016, 229, 664–677. [Google Scholar] [CrossRef] [Green Version]
  60. Sodzel, D.; Khranovskyy, V.; Beni, V.; Turner, A.P.F.; Viter, R.; Eriksson, M.O.; Holtz, P.-O.; Janot, J.-M.; Bechelany, M.; Balme, S.; et al. Continuous sensing of hydrogen peroxide and glucose via quenching of the UV and visible luminescence of ZnO nanoparticles. Microchim. Acta 2015, 182, 1819–1826. [Google Scholar] [CrossRef]
  61. Viter, R.; Tereshchenko, A.; Smyntyna, V.; Ogorodniichuk, J.; Starodub, N.; Yakimova, R.; Khranovskyy, V.; Ramanavicius, A. Toward development of optical biosensors based on photoluminescence of TiO2 nanoparticles for the detection of Salmonella. Sens. Actuators B Chem. 2017, 252, 95–102. [Google Scholar] [CrossRef] [Green Version]
  62. Mai, H.H.; Tran, D.H.; Janssens, E. Non-enzymatic fluorescent glucose sensor using vertically aligned ZnO nanotubes grown by a one-step, seedless hydrothermal method. Microchim. Acta 2019, 186, 245. [Google Scholar] [CrossRef]
  63. Sarangi, S.N.; Nozaki, S.; Sahu, S.N. ZnO Nanorod-Based Non-Enzymatic Optical Glucose Biosensor. J. Biomed. Nanotechnol. 2015, 11, 988–996. [Google Scholar] [CrossRef] [PubMed]
  64. Su, W.-Y.; Huang, J.-S.; Lin, C.-F. Improving the property of ZnO nanorods using hydrogen peroxide solution. J. Cryst. Growth 2008, 310, 2806–2809. [Google Scholar] [CrossRef]
  65. Roberts, J.G.; Hamilton, K.L.; Sombers, L.A. Comparison of electrode materials for the detection of rapid hydrogen peroxide fluctuations using background-subtracted fast scan cyclic voltammetry. Analyst 2011, 136, 3550. [Google Scholar] [CrossRef] [PubMed]
  66. Sanford, A.L.; Morton, S.W.; Whitehouse, K.L.; Oara, H.M.; Lugo-Morales, L.Z.; Roberts, J.G.; Sombers, L.A. Voltammetric Detection of Hydrogen Peroxide at Carbon Fiber Microelectrodes. Anal. Chem. 2010, 82, 5205–5210. [Google Scholar] [CrossRef] [PubMed] [Green Version]
  67. Inagaki, M.; Harada, S.; Sato, T.; Nakajima, T.; Horino, Y.; Morita, K. Carbonization of polyimide film “Kapton”. Carbon N. Y. 1989, 27, 253–257. [Google Scholar] [CrossRef]
  68. Inagaki, M.; Ohta, N.; Hishiyama, Y. Aromatic polyimides as carbon precursors. Carbon N. Y. 2013, 61, 1–21. [Google Scholar] [CrossRef]
  69. Lamberti, A.; Perrucci, F.; Caprioli, M.; Serrapede, M.; Fontana, M.; Bianco, S.; Ferrero, S.; Tresso, E. New insights on laser-induced graphene electrodes for flexible supercapacitors: Tunable morphology and physical properties. Nanotechnology 2017, 28, 174002. [Google Scholar] [CrossRef]
  70. Luo, S.; Hoang, P.T.; Liu, T. Direct laser writing for creating porous graphitic structures and their use for flexible and highly sensitive sensor and sensor arrays. Carbon N. Y. 2016, 96, 522–531. [Google Scholar] [CrossRef]
  71. Rodrigues, J.; Fernandes, A.J.S.; Monteiro, T.; Costa, F.M. A review on the laser-assisted flow deposition method: Growth of ZnO micro and nanostructures. CrystEngComm 2019, 21, 1071–1090. [Google Scholar] [CrossRef]
  72. Rodrigues, J.; Fernandes, A.J.S.; Mata, D.; Holz, T.; Carvalho, R.G.; Fath Allah, R.; Ben, T.; Gonzalez, D.; Silva, R.F.; da Cunha, A.F.; et al. ZnO micro/nanocrystals grown by laser assisted flow deposition. In SPIE OPTO; Teherani, F.H., Look, D.C., Rogers, D.J., Eds.; International Society for Optics and Photonics: Bellingham, DC, USA, 2014; p. 89871F. [Google Scholar]
  73. Rodrigues, J.; Peres, M.; Soares, M.R.N.; Fernandes, A.J.S.; Ferreira, N.; Ferro, M.; Neves, A.J.; Monteiro, T.; Costa, F.M. ZnO Nano/Microstructures Grown by Laser Assisted Flow Deposition. J. Nano Res. 2012, 18–19, 129–137. [Google Scholar] [CrossRef]
  74. Rodrigues, J.; Cerqueira, A.F.R.; Sousa, M.G.; Santos, N.F.; Pimentel, A.; Fortunato, E.; da Cunha, A.F.; Monteiro, T.; Costa, F.M. Exploring the potential of laser assisted flow deposition grown ZnO for photovoltaic applications. Mater. Chem. Phys. 2016, 177, 322–329. [Google Scholar] [CrossRef]
  75. Rodrigues, J.; Pimentel, A.; Fortunato, E.; Monteiro, T.; Costa, F.M. Photocatalytic Activity of Laser-Processed ZnO Micro/Nanocrystals. Phys. Status Solidi 2018, 215, 1800155. [Google Scholar] [CrossRef]
  76. Bard, A.J.; Faulkner, L.R. Electrochemical Methods: Fundamentals and Applications; John Wiley & Sons: New York, NY, USA, 1980. [Google Scholar]
  77. Nicholson, R.S. Theory and Application of Cyclic Voltammetry for Measurement of Electrode Reaction Kinetics. Anal. Chem. 1965, 37, 1351–1355. [Google Scholar] [CrossRef]
  78. Hallam, P.M.; Banks, C.E. Quantifying the electron transfer sites of graphene. Electrochem. Commun. 2011, 13, 8–11. [Google Scholar] [CrossRef]
  79. Konopka, S.J.; McDuffie, B. Diffusion coefficients of ferri- and ferrocyanide ions in aqueous media, using twin-electrode thin-layer electrochemistry. Anal. Chem. 1970, 42, 1741–1746. [Google Scholar] [CrossRef]
  80. Ferrari, A.C. Raman spectroscopy of graphene and graphite: Disorder, electron–phonon coupling, doping and nonadiabatic effects. Solid State Commun. 2007, 143, 47–57. [Google Scholar] [CrossRef]
  81. Cançado, L.G.; Jorio, A.; Ferreira, E.H.M.; Stavale, F.; Achete, C.A.; Capaz, R.B.; Moutinho, M.V.O.; Lombardo, A.; Kulmala, T.S.; Ferrari, A.C. Quantifying Defects in Graphene via Raman Spectroscopy at Different Excitation Energies. Nano Lett. 2011, 11, 3190–3196. [Google Scholar] [CrossRef] [Green Version]
  82. Cuscó, R.; Alarcón-Lladó, E.; Ibáñez, J.; Artús, L.; Jiménez, J.; Wang, B.; Callahan, M. Temperature dependence of Raman scattering in ZnO. Phys. Rev. B 2007, 75, 165202. [Google Scholar] [CrossRef]
  83. Calleja, J.M.; Cardona, M. Resonant Raman scattering in ZnO. Phys. Rev. B 1977, 16, 3753–3761. [Google Scholar] [CrossRef]
  84. Rodrigues, J.; Holz, T.; Fath Allah, R.; Gonzalez, D.; Ben, T.; Correira, M.R.; Monteiro, T.; Costa, F.M. Effect of the N2 and H2 plasma treatments on band edge emission of ZnO microrods. Sci. Rep. 2015, 5, 10783. [Google Scholar] [CrossRef] [Green Version]
  85. Dingle, R. Luminescent Transitions Associated With Divalent Copper Impurities and the Green Emission from Semiconducting Zinc Oxide. Phys. Rev. Lett. 1969, 23, 579–581. [Google Scholar] [CrossRef]
  86. Morkoç, H.; Özgür, Ü. Zinc Oxide: Fundamentals, Materials and Device Technology; John Wiley & Sons: Hoboken, NJ, USA, 2008; ISBN 3527623957. [Google Scholar]
  87. Jagadish, C.; Pearton, S. Zinc Oxide Bulk, Thin Films and Nanostructures; Elsevier: Amsterdam, The Netherlands, 2006; ISBN 9780080447223. [Google Scholar]
  88. Djurišić, A.B.; Leung, Y.H.; Tam, K.H.; Hsu, Y.F.; Ding, L.; Ge, W.K.; Zhong, Y.C.; Wong, K.S.; Chan, W.K.; Tam, H.L.; et al. Defect emissions in ZnO nanostructures. Nanotechnology 2007, 18, 095702. [Google Scholar] [CrossRef]
  89. Djurišić, A.B.; Liu, X.; Leung, Y.H. Zinc oxide films and nanomaterials for photovoltaic applications. Phys. Status Solidi Rapid Res. Lett. 2014, 8, 123–132. [Google Scholar] [CrossRef]
  90. Djurisić, A.B.; Leung, Y.H. Optical properties of ZnO nanostructures. Small 2006, 2, 944–961. [Google Scholar] [CrossRef] [PubMed]
  91. Bao, Q.; Zhang, H.; Wang, Y.; Ni, Z.; Yan, Y.; Shen, Z.X.; Loh, K.P.; Tang, D.Y. Atomic-Layer Graphene as a Saturable Absorber for Ultrafast Pulsed Lasers. Adv. Funct. Mater. 2009, 19, 3077–3083. [Google Scholar] [CrossRef]
  92. Baibarac, M.; Baltog, I.; Matea, A.; Lefrant, S. Raman scattering and photoluminescence studies of ZnO nanowhiskers assembled as flowers in the presence of fullerene. J. Cryst. Growth 2015, 419, 158–164. [Google Scholar] [CrossRef]
  93. Wöll, C. The chemistry and physics of zinc oxide surfaces. Prog. Surf. Sci. 2007, 82, 55–120. [Google Scholar] [CrossRef]
  94. Hövel, S.; Kolczewski, C.; Wühn, M.; Albers, J.; Weiss, K.; Staemmler, V.; Wöll, C. Pyridine adsorption on the polar ZnO(0001) surface: Zn termination versus O termination. J. Chem. Phys. 2000, 112, 3909–3916. [Google Scholar] [CrossRef]
  95. Hofmann, O.T.; Deinert, J.-C.; Xu, Y.; Rinke, P.; Stähler, J.; Wolf, M.; Scheffler, M. Large work function reduction by adsorption of a molecule with a negative electron affinity: Pyridine on ZnO(101¯0). J. Chem. Phys. 2013, 139, 174701. [Google Scholar] [CrossRef]
  96. Turkina, O.; Nabok, D.; Gulans, A.; Cocchi, C.; Draxl, C. Electronic and Optical Excitations at the Pyridine/ZnO(101¯0) Hybrid Interface. Adv. Theory Simul. 2019, 2, 1800108. [Google Scholar] [CrossRef]
  97. Wang, L.; Giles, N.C. Temperature dependence of the free-exciton transition energy in zinc oxide by photoluminescence excitation spectroscopy. J. Appl. Phys. 2003, 94, 973. [Google Scholar] [CrossRef]
  98. Rai, R.C. Analysis of the Urbach tails in absorption spectra of undoped ZnO thin films. J. Appl. Phys. 2013, 113, 153508. [Google Scholar] [CrossRef]
  99. Postica, V.; Gröttrup, J.; Adelung, R.; Lupan, O.; Mishra, A.K.; de Leeuw, N.H.; Ababii, N.; Carreira, J.F.C.; Rodrigues, J.; Sedrine, N.B.; et al. Multifunctional Materials: A Case Study of the Effects of Metal Doping on ZnO Tetrapods with Bismuth and Tin Oxides. Adv. Funct. Mater. 2017, 27, 1604676. [Google Scholar] [CrossRef]
  100. Boemare, C.; Monteiro, T.; Soares, M.J.; Guilherme, J.G.; Alves, E. Photoluminescence studies in ZnO samples. Phys. B Condens. Matter 2001, 308–310, 985–988. [Google Scholar] [CrossRef]
  101. Krishnan, S.K.; Singh, E.; Singh, P.; Meyyappan, M.; Nalwa, H.S. A review on graphene-based nanocomposites for electrochemical and fluorescent biosensors. Rsc Adv. 2019, 9, 8778–8881. [Google Scholar] [CrossRef]
  102. Ambrosi, A.; Chua, C.K.; Latiff, N.M.; Loo, A.H.; Wong, C.H.A.; Eng, A.Y.S.; Bonanni, A.; Pumera, M. Graphene and its electrochemistry—An update. Chem. Soc. Rev. 2016, 45, 2458–2493. [Google Scholar] [CrossRef] [PubMed] [Green Version]
  103. Velický, M.; Bissett, M.A.; Toth, P.S.; Patten, H.V.; Worrall, S.D.; Rodgers, A.N.J.; Hill, E.W.; Kinloch, I.A.; Novoselov, K.S.; Georgiou, T.; et al. Electron transfer kinetics on natural crystals of MoS2 and graphite. Phys. Chem. Chem. Phys. 2015, 17, 17844–17853. [Google Scholar] [CrossRef] [Green Version]
  104. Yuan, W.; Zhou, Y.; Li, Y.; Li, C.; Peng, H.; Zhang, J.; Liu, Z.; Dai, L.; Shi, G. The edge- and basal-plane-specific electrochemistry of a single-layer graphene sheet. Sci. Rep. 2013, 3, 2248. [Google Scholar] [CrossRef] [Green Version]
  105. Chen, Y.; Jiang, F.; Wang, L.; Mo, C.; Pu, Y.; Fang, W. Influence of hydrogen peroxide solution on the properties of ZnO thin films. J. Cryst. Growth 2004, 268, 71–75. [Google Scholar] [CrossRef]
  106. Metkar, S.K.; Girigoswami, K. Diagnostic biosensors in medicine—A review. Biocatal. Agric. Biotechnol. 2019, 17, 271–283. [Google Scholar] [CrossRef]
  107. Bhalla, N.; Jolly, P.; Formisano, N.; Estrela, P. Introduction to biosensors. Essays Biochem. 2016, 60, 1–8. [Google Scholar] [CrossRef] [Green Version]
  108. Thévenot, D.R.; Toth, K.; Durst, R.A.; Wilson, G.S. Electrochemical biosensors: Recommended definitions and classification. Biosens. Bioelectron. 2001, 16, 121–131. [Google Scholar] [CrossRef]
  109. Viter, R.; Iatsunskyi, I. Metal Oxide Nanostructures in Sensing. In Nanomaterials Design for Sensing Applications; Elsevier: Amsterdam, The Netherlands, 2019; pp. 41–91. [Google Scholar]
  110. Justino, C.I.L.; Rocha-Santos, T.A.; Duarte, A.C.; Rocha-Santos, T.A. Review of analytical figures of merit of sensors and biosensors in clinical applications. Trac Trends Anal. Chem. 2010, 29, 1172–1183. [Google Scholar] [CrossRef]
  111. Shiang, Y.-C.; Huang, C.-C.; Chang, H.-T. Gold nanodot-based luminescent sensor for the detection of hydrogen peroxide and glucose. Chem. Commun. 2009, 3437. [Google Scholar] [CrossRef] [PubMed]
  112. Yi, Y.; Deng, J.; Zhang, Y.; Li, H.; Yao, S. Label-free Si quantum dots as photoluminescence probes for glucose detection. Chem. Commun. 2013, 49, 612–614. [Google Scholar] [CrossRef] [PubMed] [Green Version]
  113. Ke, X.; Zhu, G.; Dai, Y.; Shen, Y.; Yang, J.; Liu, J. Fabrication of Pt-ZnO composite nanotube modified electrodes for the detection of H2O2. J. Electroanal. Chem. 2018, 817, 176–183. [Google Scholar] [CrossRef]
  114. Lin, C.-Y.; Lai, Y.-H.; Balamurugan, A.; Vittal, R.; Lin, C.-W.; Ho, K.-C. Electrode modified with a composite film of ZnO nanorods and Ag nanoparticles as a sensor for hydrogen peroxide. Talanta 2010, 82, 340–347. [Google Scholar] [CrossRef] [PubMed]
  115. Palanisamy, S.; Chen, S.-M.; Sarawathi, R. A novel nonenzymatic hydrogen peroxide sensor based on reduced graphene oxide/ZnO composite modified electrode. Sens. Actuators B Chem. 2012, 166–167, 372–377. [Google Scholar] [CrossRef]
  116. Hussain, M.; Sun, H.; Karim, S.; Nisar, A.; Khan, M.; ul Haq, A.; Iqbal, M.; Ahmad, M. Noble metal nanoparticle-functionalized ZnO nanoflowers for photocatalytic degradation of RhB dye and electrochemical sensing of hydrogen peroxide. J. Nanoparticle Res. 2016, 18, 95. [Google Scholar] [CrossRef]
  117. Ahmed, M.M.; Zhang, K.; Shang, Y.; Zhao, R.; Liu, L.; Du, Q.; Guo, T.; Du, J.; Li, J. Size-Controllable Strategy of ZnO Micro/Nanorods for Electrochemical Detection of H2O2. J. Electrochem. Soc. 2021, 168, 027507. [Google Scholar] [CrossRef]
  118. Xu, H.; Wei, Z.; Verpoort, F.; Hu, J.; Zhuiykov, S. Nanoscale Au-ZnO Heterostructure Developed by Atomic Layer Deposition Towards Amperometric H2O2 Detection. Nanoscale Res. Lett. 2020, 15, 41. [Google Scholar] [CrossRef] [PubMed]
  119. Rashed, M.A.; Faisal, M.; Harraz, F.A.; Jalalah, M.; Alsaiari, M.; Alsareii, S.A. A Highly Efficient Nonenzymatic Hydrogen Peroxide Electrochemical Sensor Using Mesoporous Carbon Doped ZnO Nanocomposite. J. Electrochem. Soc. 2021, 168, 027512. [Google Scholar] [CrossRef]
  120. Salih, E.; Mekawy, M.; Hassan, R.Y.A.; El-Sherbiny, I.M. Synthesis, characterization and electrochemical-sensor applications of zinc oxide/graphene oxide nanocomposite. J. Nanostructure Chem. 2016, 6, 137–144. [Google Scholar] [CrossRef] [Green Version]
  121. Evans, S.A.G.; Elliott, J.M.; Andrews, L.M.; Bartlett, P.N.; Doyle, P.J.; Denuault, G. Detection of Hydrogen Peroxide at Mesoporous Platinum Microelectrodes. Anal. Chem. 2002, 74, 1322–1326. [Google Scholar] [CrossRef] [PubMed]
Figure 1. Schematic illustration of the several steps involved in the preparation of the composites, from the synthesis of each component to the final composites deposited on the FTO-coated glass substrates and covered with an electrical insulating varnish.
Chemosensors 09 00102 g001
Figure 2. Representative SEM images of the (a) as-synthesized, (b) scraped, and (c) deposited LIG; (d) deposited ZnO and ZnO/LIG composites, with (e) 1 mg and (f) 5 mg of LIG, respectively.
Chemosensors 09 00102 g002
Figure 3. Micro-Raman spectra of representative samples of the ZnO, ZnO/LIG composites, and LIG samples, both as-synthesized and deposited. The spectra were acquired in a backscattering configuration using the 442 nm line of a He–Cd laser. Spectra recorded in three different spots of the same sample are displayed to demonstrate the homogeneity of the composite samples. The spectra are normalized and vertically shifted for clarity.
Chemosensors 09 00102 g003
Figure 4. (a) RT PL spectra obtained for the ZnO and ZnO/LIG composites. The data were obtained using a Xe lamp as the excitation source, coupled to a monochromator to select only the 325 nm wavelength. (b) RT normalized PL (solid lines) and PLE (dashed lines) spectra for the same samples. The asterisks denote artifacts from the measuring system. The PLE spectra were vertically shifted for clarity in the data display.
Chemosensors 09 00102 g004
Figure 5. The 14 K and RT normalized PL spectra of the ZnO and ZnO/LIG composites. The samples were excited with the 325 nm line of a He–Cd laser. The inset corresponds to a magnification of the UV spectral region for the spectra obtained at 14 K and shows a comparison of the absolute intensities.
Chemosensors 09 00102 g005
Figure 6. Representative cyclic voltammograms of ZnO and the ZnO/LIG composites at a scan rate of 100 mV s−1, using (a) PS and (b) 10 mM of [Fe(CN)6]4− in PS as electrolytes.
Chemosensors 09 00102 g006
Figure 7. (a) Scan rate dependence of cyclic voltammograms for the ZnO-LIG5 sample. Inset: Corresponding plots of ∆Ep and Ψ parameter against υ−1/2. (b) Anodic and cathodic peak currents as a function of υ1/2 for all samples. Measurements were performed using 10 mM of [Fe(CN)6]4− in PS as the electrolyte.
Chemosensors 09 00102 g007
Figure 8. Nyquist plot of the FTO, ZnO, ZnO-LIG1, and ZnO-LIG5 electrodes. All spectra were recorded within the 10 kHz to 1 Hz range, except for the bare FTO substrate (10 kHz to 0.1 Hz), to better resolve the diffusional part of the spectra at lower frequencies. Solid lines represent fittings using the equivalent circuit shown in the inset. All spectra were acquired in a mixture of 5 mM of [Fe(CN)6]4− and 5 mM of [Fe(CN)6]3− in PS.
Chemosensors 09 00102 g008
Figure 9. PL spectra obtained for representative (a) ZnO and (b) ZnO-LIG5 samples immersed in solutions containing different H2O2 concentrations. (c) Average BL/UV peak intensity ratio as a function of the H2O2 concentration (measured at 438 nm and 380 nm, respectively).
Chemosensors 09 00102 g009
Figure 10. Cyclic voltammograms of ZnO, ZnO-LIG1, and ZnO-LIG5 (a) in the presence and (b) in the absence of O2 using PS as the electrolyte.
Chemosensors 09 00102 g010
Figure 11. Representative cyclic voltammograms obtained in the presence of different H2O2 concentrations for (a) ZnO and (b) ZnO-LIG5. (c) Average current density measured at the peak maxima (located at ~0.5–0.6 V) as a function of the H2O2 concentration for the two types of samples.
Chemosensors 09 00102 g011
Table 1. Summary of relevant electrochemical parameters for the ZnO and ZnO/LIG composites. For k0 and Aeff, the results are mean ± standard deviations from independent triplicate measurements. For Rs and RET, the results show standard deviations from EIS fitting procedures.
SampleFTOZnOZnO-LIG1ZnO-LIG5
k0 (cm s−1)-(3.0 ± 0.4) × 10−3(3.9 ± 0.5) × 10−3(4.3 ± 0.4) × 10−3
Aeff (cm2)-0.109 ± 0.0020.132 ± 0.0010.206 ± 0.003
Rs (Ω)31.6 ± 0.374.6 ± 1.886.2 ± 2.773.6 ± 1.8
RET (Ω)136 ± 129.5 ± 2.125.7 ± 2.99.64 ± 2.10
Table 2. Summary of relevant sensing figures of merit for the ZnO and ZnO-LIG5 samples. TPs, NPs and NRs stand for tetrapods, nanoparticles and nanorods, respectively.
SignalPL
SampleLinear range
(mM)
Sensitivity
[(IBL/IUV) mM−1]
LOD
(mM)
Reference
ZnO TPs1.8–32.70.00790.8This work
ZnO-LIG51.8–32.70.0260.45This work
ZnO NPs0.05–100---0.05 (a)[60]
ZnO NRs1–30------[63]
SignalCV
SampleLinear range
(mM)
Sensitivity
(µA mM−1 cm−2)
LOD
(mM)
Reference
ZnO TPs0.8–14.6308.80.11This work
ZnO-LIG50.8–14.6276.80.19This work
ZnO/GO composite1–15---0.8[120]
ZnO nano/microrods based GCE0.1–110.8 (b)0.00028[117]
Mesoporous carbon doped ZnO modified GCE0.2–3.1
0.05–0.981 (b)
5.52
46.48 (b)
0.0526
0.00625 (c)
[119]
Pt-ZnO/GCE0.02–50---1.5[113]
Mesoporous platinum microelectrodes (d)0.02–4028000.0045[121]
(a) lower concentration tested. (b) µA mM−1 (c) using square wave voltammetry (d) H2O2 detection following the potential at +0.6 V vs. SCE.
Publisher’s Note: MDPI stays neutral with regard to jurisdictional claims in published maps and institutional affiliations.

