Article

A MEMS µ-Preconcentrator Employing a Carbon Molecular Sieve Membrane for Highly Volatile Organic Compound Sampling

1
Department of Chemistry, National Taiwan Normal University, Taipei 11677, Taiwan
2
Institute of Applied Mechanics, National Taiwan University, Taipei 10617, Taiwan
3
Department of Chemical and Materials Engineering, Chung Cheng Institute of Technology, National Defense University, Taoyuan 33509,Taiwan
4
Undergraduate Degree Program of System Engineering and Technology, National Yang Ming Chiao Tung University, Hsinchu 30010, Taiwan
*
Author to whom correspondence should be addressed.
Submission received: 15 March 2021 / Revised: 30 April 2021 / Accepted: 3 May 2021 / Published: 7 May 2021
(This article belongs to the Special Issue Advances in Analytical Systems for Gaseous Mixture)

Abstract

:
This paper presents the synthesis and evaluation of a carbon molecular sieve membrane (CMSM) grown inside a MEMS-fabricated μ-preconcentrator for sampling highly volatile organic compounds. An array of µ-pillars measuring 100 µm in diameter and 250 µm in height were fabricated inside a microfluidic channel to increase the attaching surface for the CMSM. The surface area of the CMSM was measured as high as 899 m2/g. A GC peak amplification factor >2 × 10⁴ was demonstrated with gaseous ethyl acetate. Up to 1.4 L of gaseous ethanol at the 100 ppb level could be concentrated without exceeding the capacity of this microchip device. Sharp desorption chromatographic peaks (<3.5 s) were obtained while using this device directly as a GC injector. Less volatile compounds such as gaseous toluene, m-xylene, and mesitylene appeared to be adsorbed strongly on CMSM, showing a memory effect. Sampling parameters such as sample volatilities, sampling capacities, and compound residual issues were empirically determined and discussed.

1. Introduction

Carbon-based adsorbents have been broadly used in various chemical analysis processes such as filtration, extraction, or separation due to their porosity and high surface area [1,2]. In terms of gas and vapor sampling, carbon adsorbents play an important role in thermal desorption methods that are followed by GC-MS analysis for complex volatile organic compounds (VOCs) [3,4,5,6]. This preconcentration process is critical when dealing with low-ppb to sub-ppb VOC concentrations such as a microbiological VOC investigation for sick building syndrome [7].
Although some of the early thermal desorption methods were developed using polymer adsorbents such as Tenax, the wider selections of surface area and better thermal stability of carbon adsorbents make them more favorable in these applications. Traditional thermal desorption samplers were packed with hundreds of milligrams of adsorbents to ensure an almost 100% capture of gas samples. Previous studies in the literature have reported multistage absorbent tubes to cover a wide range of sample volatilities [3,4,5,6]. Due to the large internal volume of these commercial sampling tubes, the thermal desorption process is often slow and requires a cryogenic focusing step using liquid nitrogen or a second-stage miniaturized adsorbent-based focuser [8] prior to the sample injection into a gas chromatograph. Previously, a mini preconcentrator was developed with a diameter of as small as 1/16 inches that permits rapid thermal desorption and direct injection into a gas chromatographic column without an intermediary step of cryogenic focusing [9,10].
Tian et al. combined the ideas of applying microelectromechanical system (MEMS) technology to analytical chemistry instrumentations [11] and earlier designs of capillary-type mini preconcentrators [9,10] to develop the first 3D-structured microfabricated preconcentrator/focuser (µ-PCF) with both a single-stage [12] and three-stage [13] design packed with commercial carbon adsorbents. These devices can be used as both a sampler and an injector for micro gas chromatography (µ-GC) [14,15,16]. In recent years, the development of µ-preconcentrator research has included novel device design, modeling, and fabrication processes [17,18]. There are many µ-preconcentrator designs that still require the packing of commercial adsorbents into microfluidic channels [18,19,20,21,22,23,24,25,26]. Livache and coworkers recently demonstrated the coupling of a MEMS-based preconcentrator with optoelectronic noise to improve the sensing of flavored water [27].
In our previous work, we designed a µ-fluidic chip and evaluated its µ-heater performance as our first attempt to develop a MEMS-based preconcentrator. The absorbent in our previous work could sufficiently trap benzene, but it failed to capture smaller molecules such as acetone or ethanol [28]. However, there are several important light VOC analysis applications such as the analysis of ethanol in various industrial applications [29] or low-concentration isopropanol and acetone in the air of semiconductor cleanrooms [30]. These chemicals are highly volatile and cannot be easily trapped by a µ-preconcentrator due to their limited size and capacity. Therefore, in this work, we attempted to achieve a high capacity for highly volatile or small-molecule organic compounds by using a directly grown carbon molecular sieve membrane (CMSM) [31] inside a µ-fluidic chip. By using the same chip design as in previous work as a test platform, we were able to compare the improvement in sampling capacity for highly volatile organic compounds. The adsorption capacity and breakthrough behaviors of CMSM adsorbent for several small-molecule organic compounds were investigated and discussed.

2. Materials and Methods

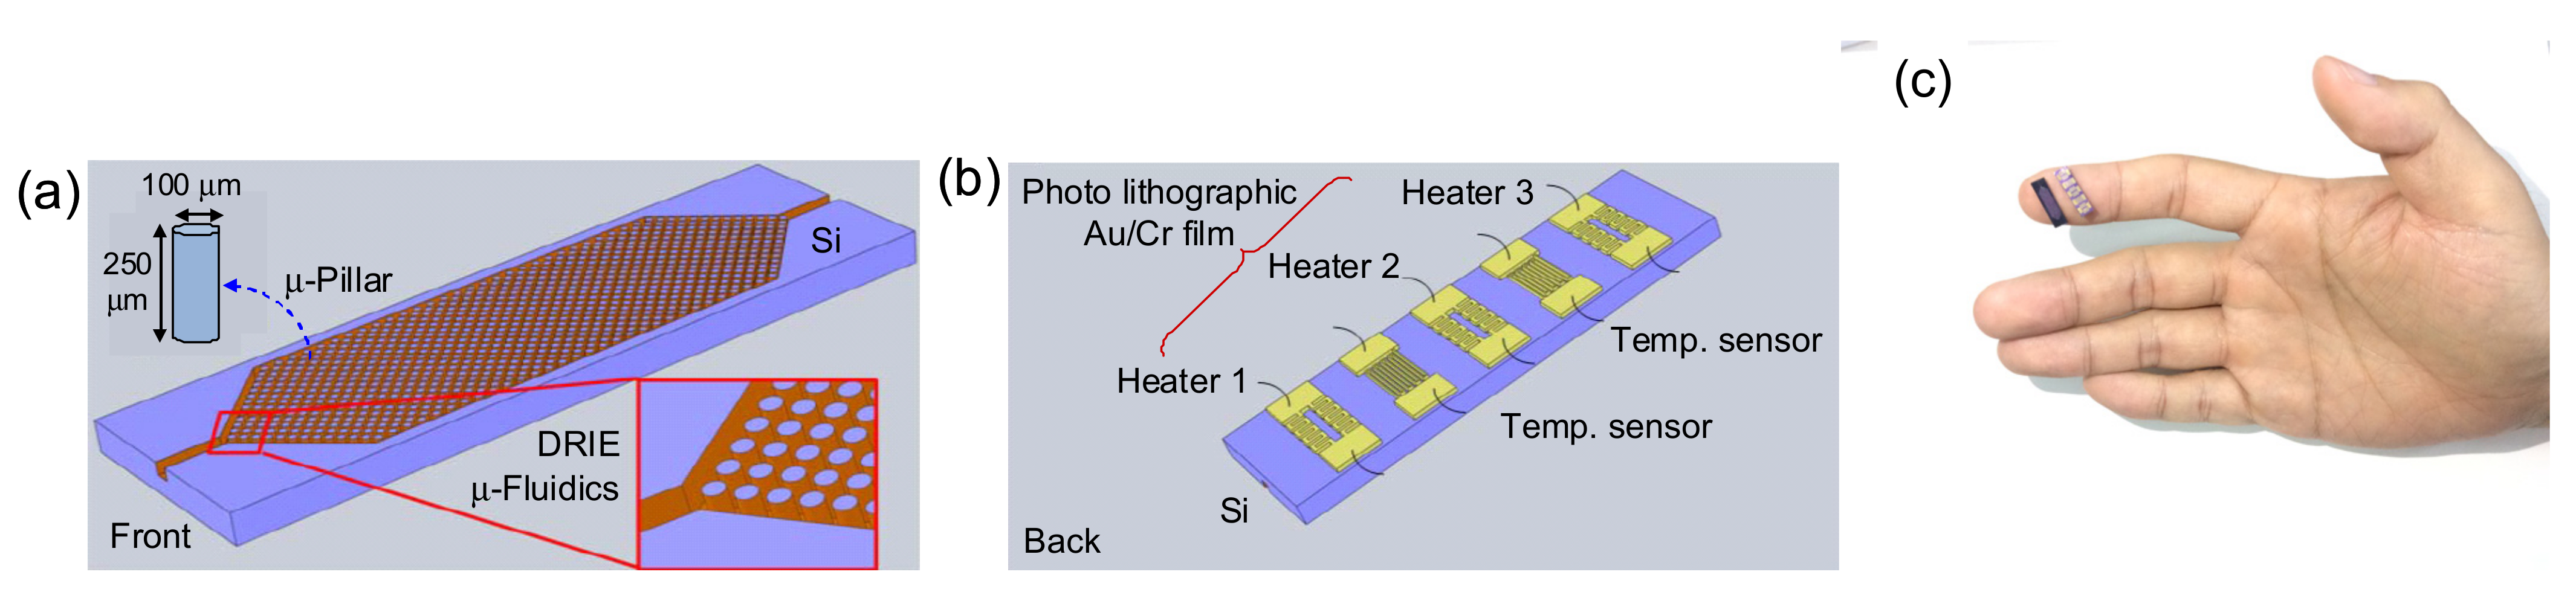
2.1. µ-Preconcentrator Design and Fabrication

The detailed processes for fabrication, packaging, and heater characterizations have been reported previously [28], and we hereby provide only a brief description of the chip design in one figure. Figure 1 shows a diagram of the design and photos of the µ-preconcentrator that measure 4 × 14 mm for each device. The fluidic pattern (Figure 1a) was etched to a depth of 250 μm using a deep reactive-ion etching (DRIE) process. The widths of the inlet/outlet ports were both 250 μm. The microsampling chamber was filled with µ-pillars 100 μm in diameter and at a height of 250 μm. A glass wafer was anodically bonded to the fluidic channel wafer to seal the top of the µ-fluidic channel.
The designing pattern of heaters and temperature sensors on the back of the µ-preconcentrator is as shown in Figure 1b. A SiO2 layer was grown on the back of the silicon wafer to provide electrical insulation underneath the metal heaters and temperature sensors. For metal layers of the heater and temperature sensors, Au (5000 Å thick) film was placed on top of an adhesive layer of Cr (50 Å thick). Three heaters and two temperature sensors were placed in an interchange order. Each thin-film heater consisted of two parallel (50 μm in width, 2.8 cm in length) gold wires, each with an overall resistance of 80 Ω. The temperature sensors were made up of a serpentine-shaped Au thin line with a resistance of 1.6 kΩ. Figure 1c shows a photo of both the front side and back side of the µ-preconcentrator on a fingertip as a comparison of actual size. We calculated the internal volume of the flow channel by subtracting the volume occupied by µ-pillars, and the available internal volume was only 5.7 µL. The same chip design has been repeatedly tested (i.e., consecutive 50 cycles), and the robustness tests of this MEMS device can be found elsewhere [28].

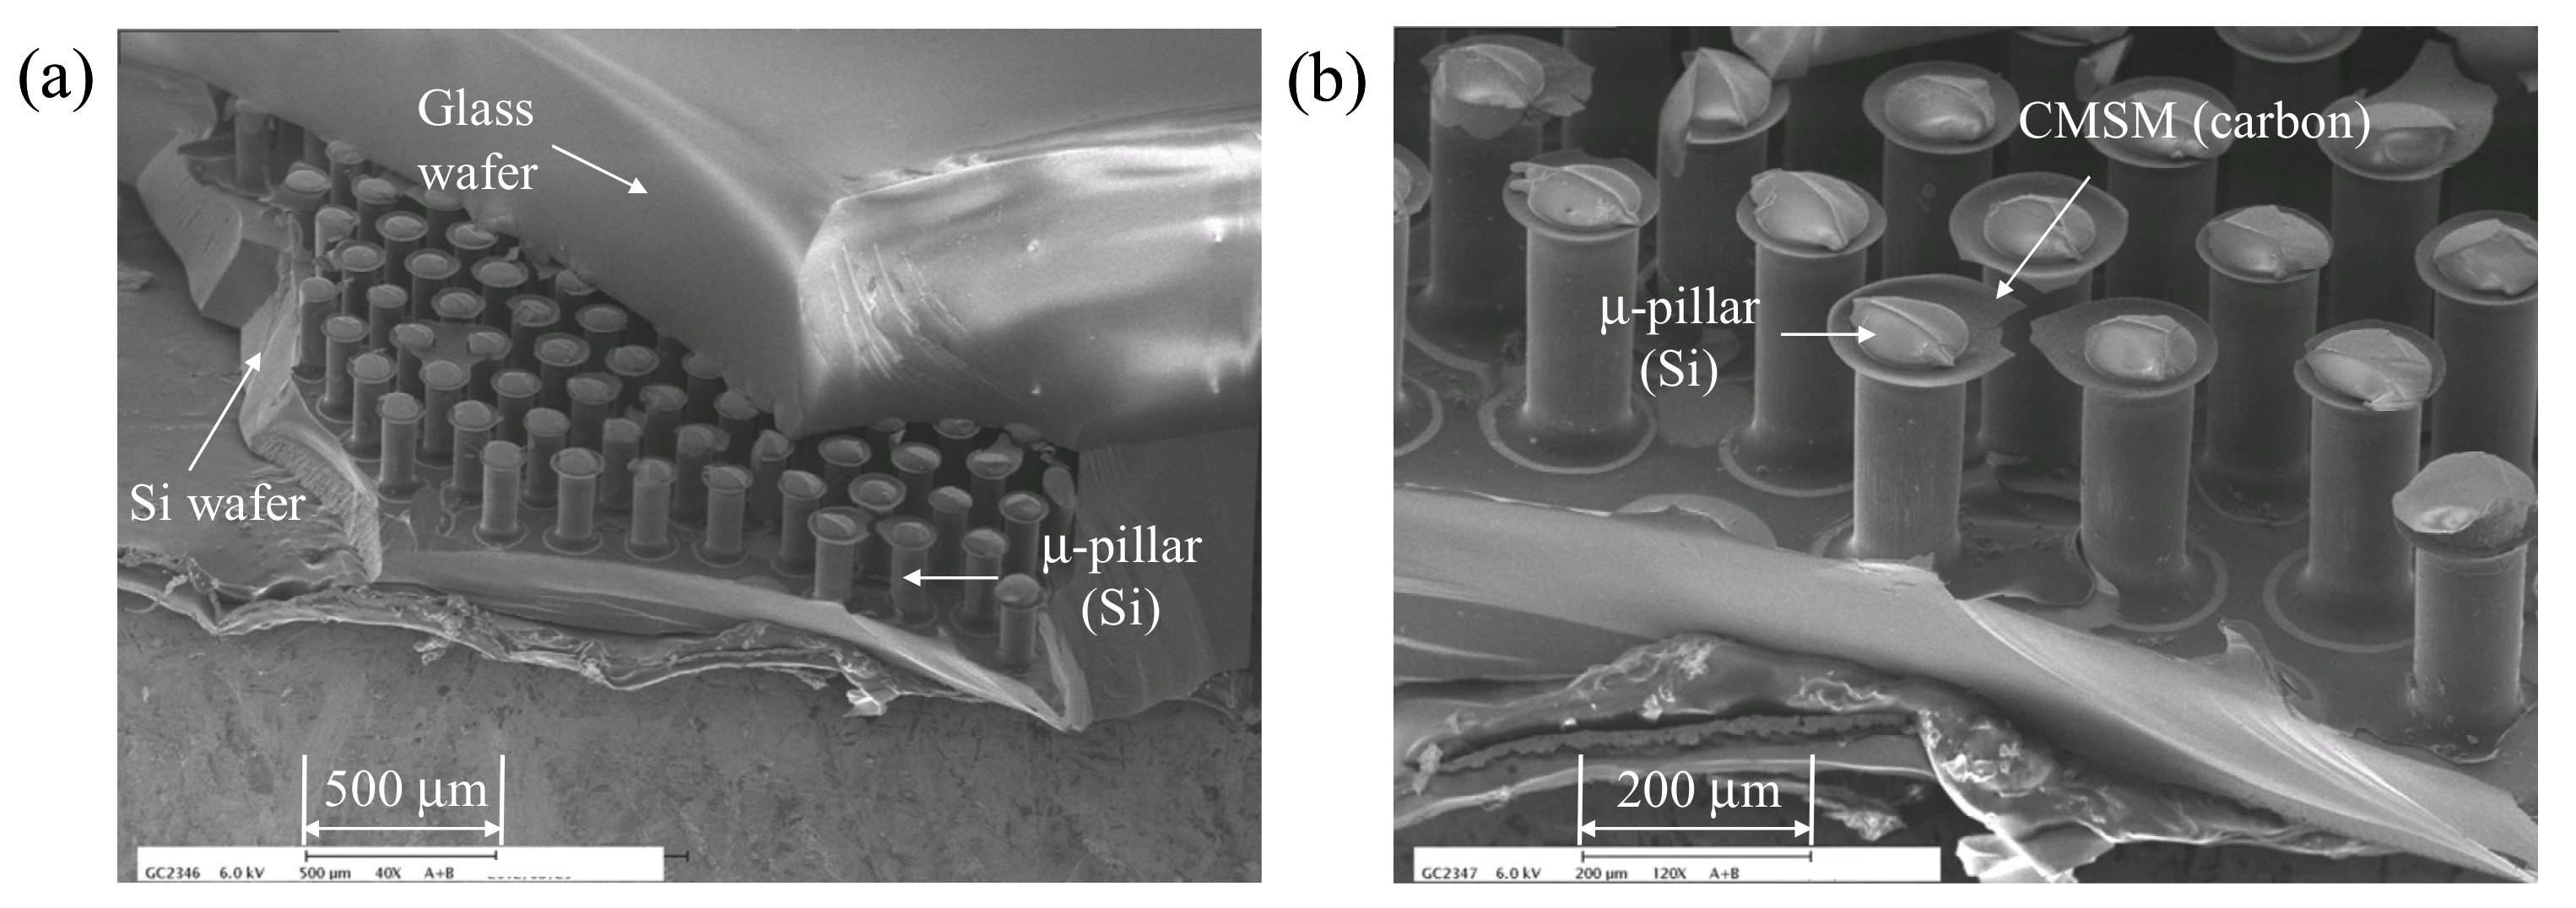
2.2. In-Situ Grown of Carbon Molecular Sieve Membrane

Polyvinylidene chloride (PVdC, also known as “Saran”) was obtained from Aldrich (Milwaukee, WI, USA) and dissolved in tetrahydrofuran (THF) to form a 10% (w/v) solution. Temporary connections using two deactivated capillary columns facilitated the filling of the Saran/THF solution. The Saran/THF solution was pushed through the fluidic channel using a syringe. After the channel was filled with the Saran/THF solution, dry air was drawn through the channel to leave a thin viscous coating on the wall of the μ-channel and µ-pillars. The connection capillaries were then removed before entering the tube oven for the carbonization reaction. The µ-preconcentrator chip was placed in a quartz tube oven with a continuous flow of high-purity N2. The oven temperature was ramped up at a rate of 20 °C/min to 700 °C and held for 2 h. The oven was then powered off to allow cooling to room temperature, and the oven atmosphere was maintained under high-purity N2. The chip was removed from the oven after cooling to room temperature. The Saran film was converted into a carbon molecular sieve membrane (CMSM), and a distinctive black carbon film color could be seen inside the µ-fluidic channel. SEM images inside the µ-fluidic channel after the CMSM was formed are shown in Figure 2. The mass of adsorbent film was determined to be 1.4 mg by weighing the chip before and after the formation of the CMSM. We additionally synthesized a large quantity (~1.0 g) of CMSM in an alumina crucible for the BET surface area measurement. The BET surface area of CMSM was determined to be 899 m2/g using a physisorption analyzer (ASAP2010, Micromeritics, USA). This surface area fell between that of two commercial adsorbents: Carboxen 569 (485 m2/g) and Carboxen 1000 (1200 m2/g).

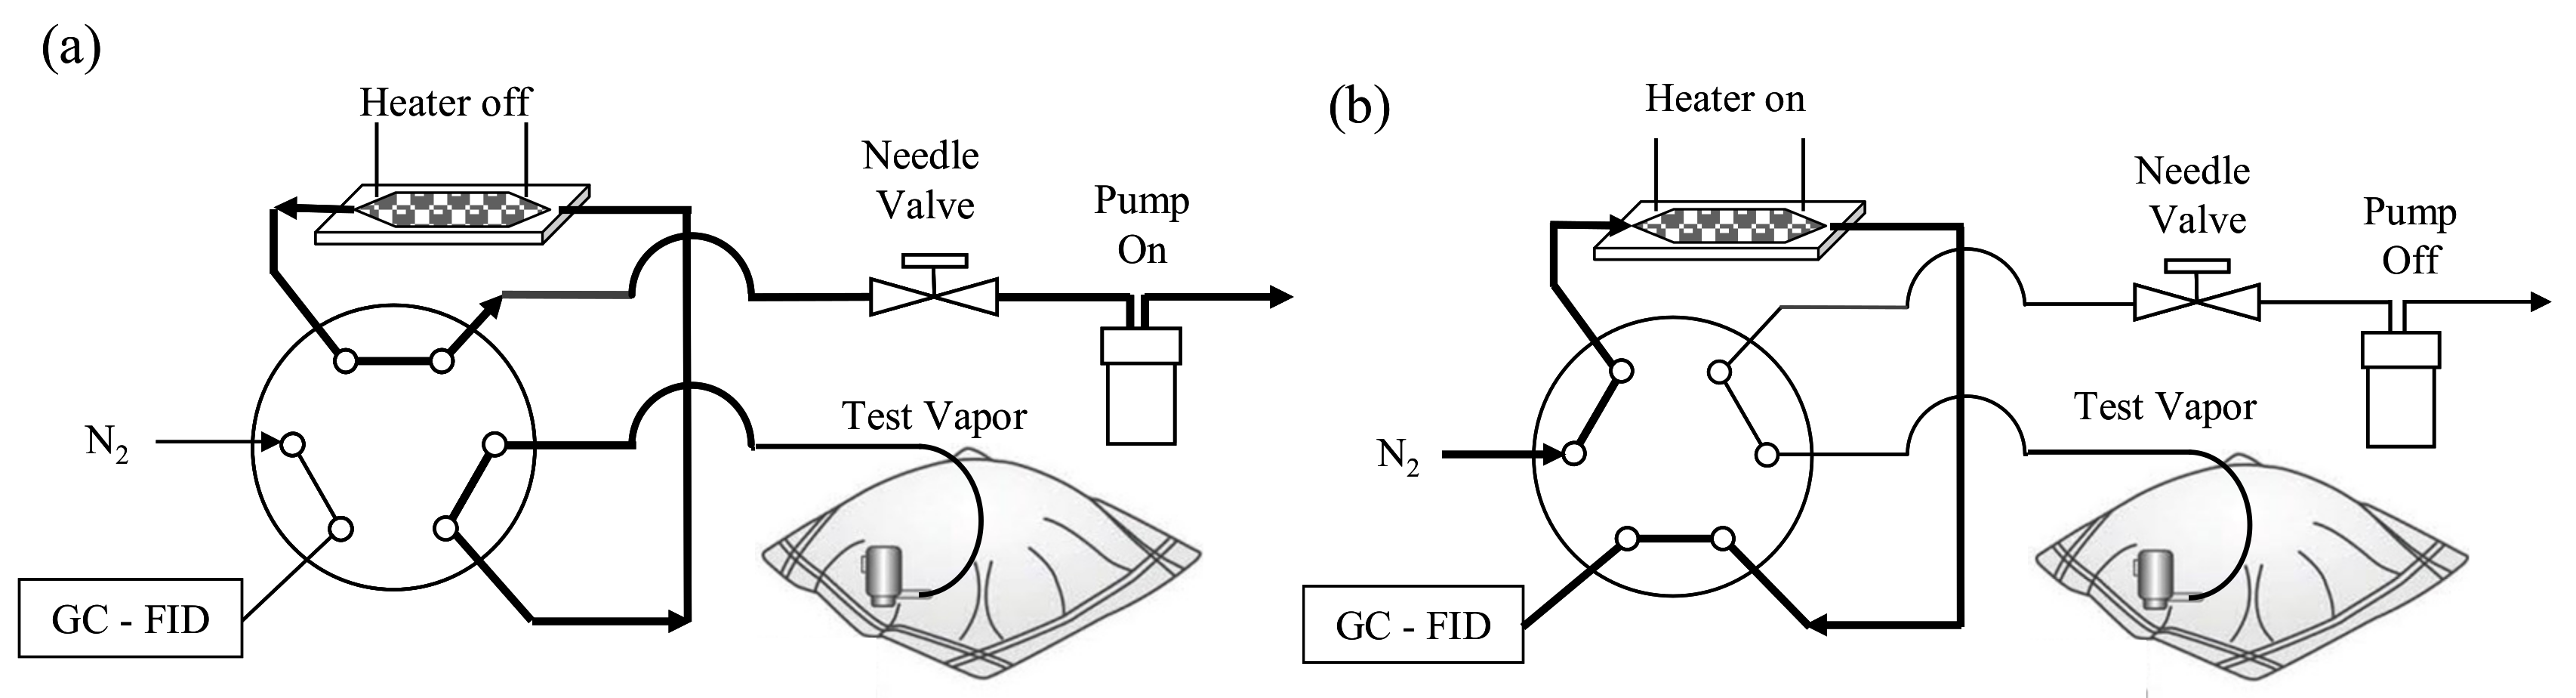
2.3. Preconcentration Test Setup

VOC sample concentrations in the ppb range were prepared in Tedlar bags via two-stage dilutions. A ppm-level concentration was first prepared by injecting a small aliquot of pure organic liquid into a Tedlar bag with gentle heating for complete evaporation. A small volume (<10 mL, using a gas-tight syringe) of the ppm-level VOC sample was transferred to a second Tedlar bag filled with 3 L of clean air. The final concentration was in the ppb range due to volumetric dilution.
The heart of this test system is a 6-port valve (E2C6UWT-110, VICI. Valco Instruments, Huston, TX, USA) that is commonly used as a sample injection valve in chromatographic instruments (Figure 3). When the valve was in the “load” position, ppb-level vapors in a Tedlar bag were drawn through the µ-preconcentrator or sample loop via a diaphragm pump (N86KNDC, KNF Neuberger, Germany). The sampling flow rate was adjustable via a downstream needle valve. The sampling flow rate range is 0–60.0 mL/min due to the flow restriction of this device. The maximum flow rate is 60.0 mL/min when the needle valve is fully opened. The sampling flow rate was controlled at 40.0 mL/min for all tests. Flow rates were calibrated using a dry cell calibrator (Gilibrator 3, Sensidyne Inc., St. Petersburg, FL. USA). Different sampling time durations were tested, and sampling volumes were calculated accordingly. After the designated sample volume was reached, the sampling pump was then turned off, and the electrical power to the heaters was turned on via computer-controlled solid-state relays. All 3 heaters on the back of the µ-preconcentrator were connected in parallel to the same power supply. Resistance changes in the temperature sensors were converted to voltage changes via a Wheatstone bridge circuit and were measured using a personal computer equipped with an analog-to-digital interface (USB-6211, National Instruments, Austin, TX, USA). A LabVIEW program written in our lab was used to control the test system. The heater power was automatically switched on and off by using the temperature reading feedback to control the desorption temperature at a preset value (i.e., 320 °C). The choice of desorption temperature was based on a previous reference using a commercial carbon adsorbent (i.e., Carboxen 1000) [9]. After the desorption temperature was reached, the 6-port valve was switched to the “inject” position, and carrier gas was flushed through the µ-preconcentrator. The thermally desorbed sample was carried through the separation column (DB-5, 0.32 mm i.d., 15 m long, Supelco) to be detected by a flame ionization detector (Agilent 5890 GC-FID, USA). A prolonged heating time of 90 s was used to minimize the residual vapor in the µ-preconcentrator after each thermal desorption. This desorption parameter setting was based on a previous study using a commercial carbon adsorbent inside a capillary preconcentrator [10]. The GC column temperature program began at 35 °C for 2 min and was ramped up at a rate of 60 °C/min to 150 °C and was maintained at this temperature until all compounds were eluted.

3. Results

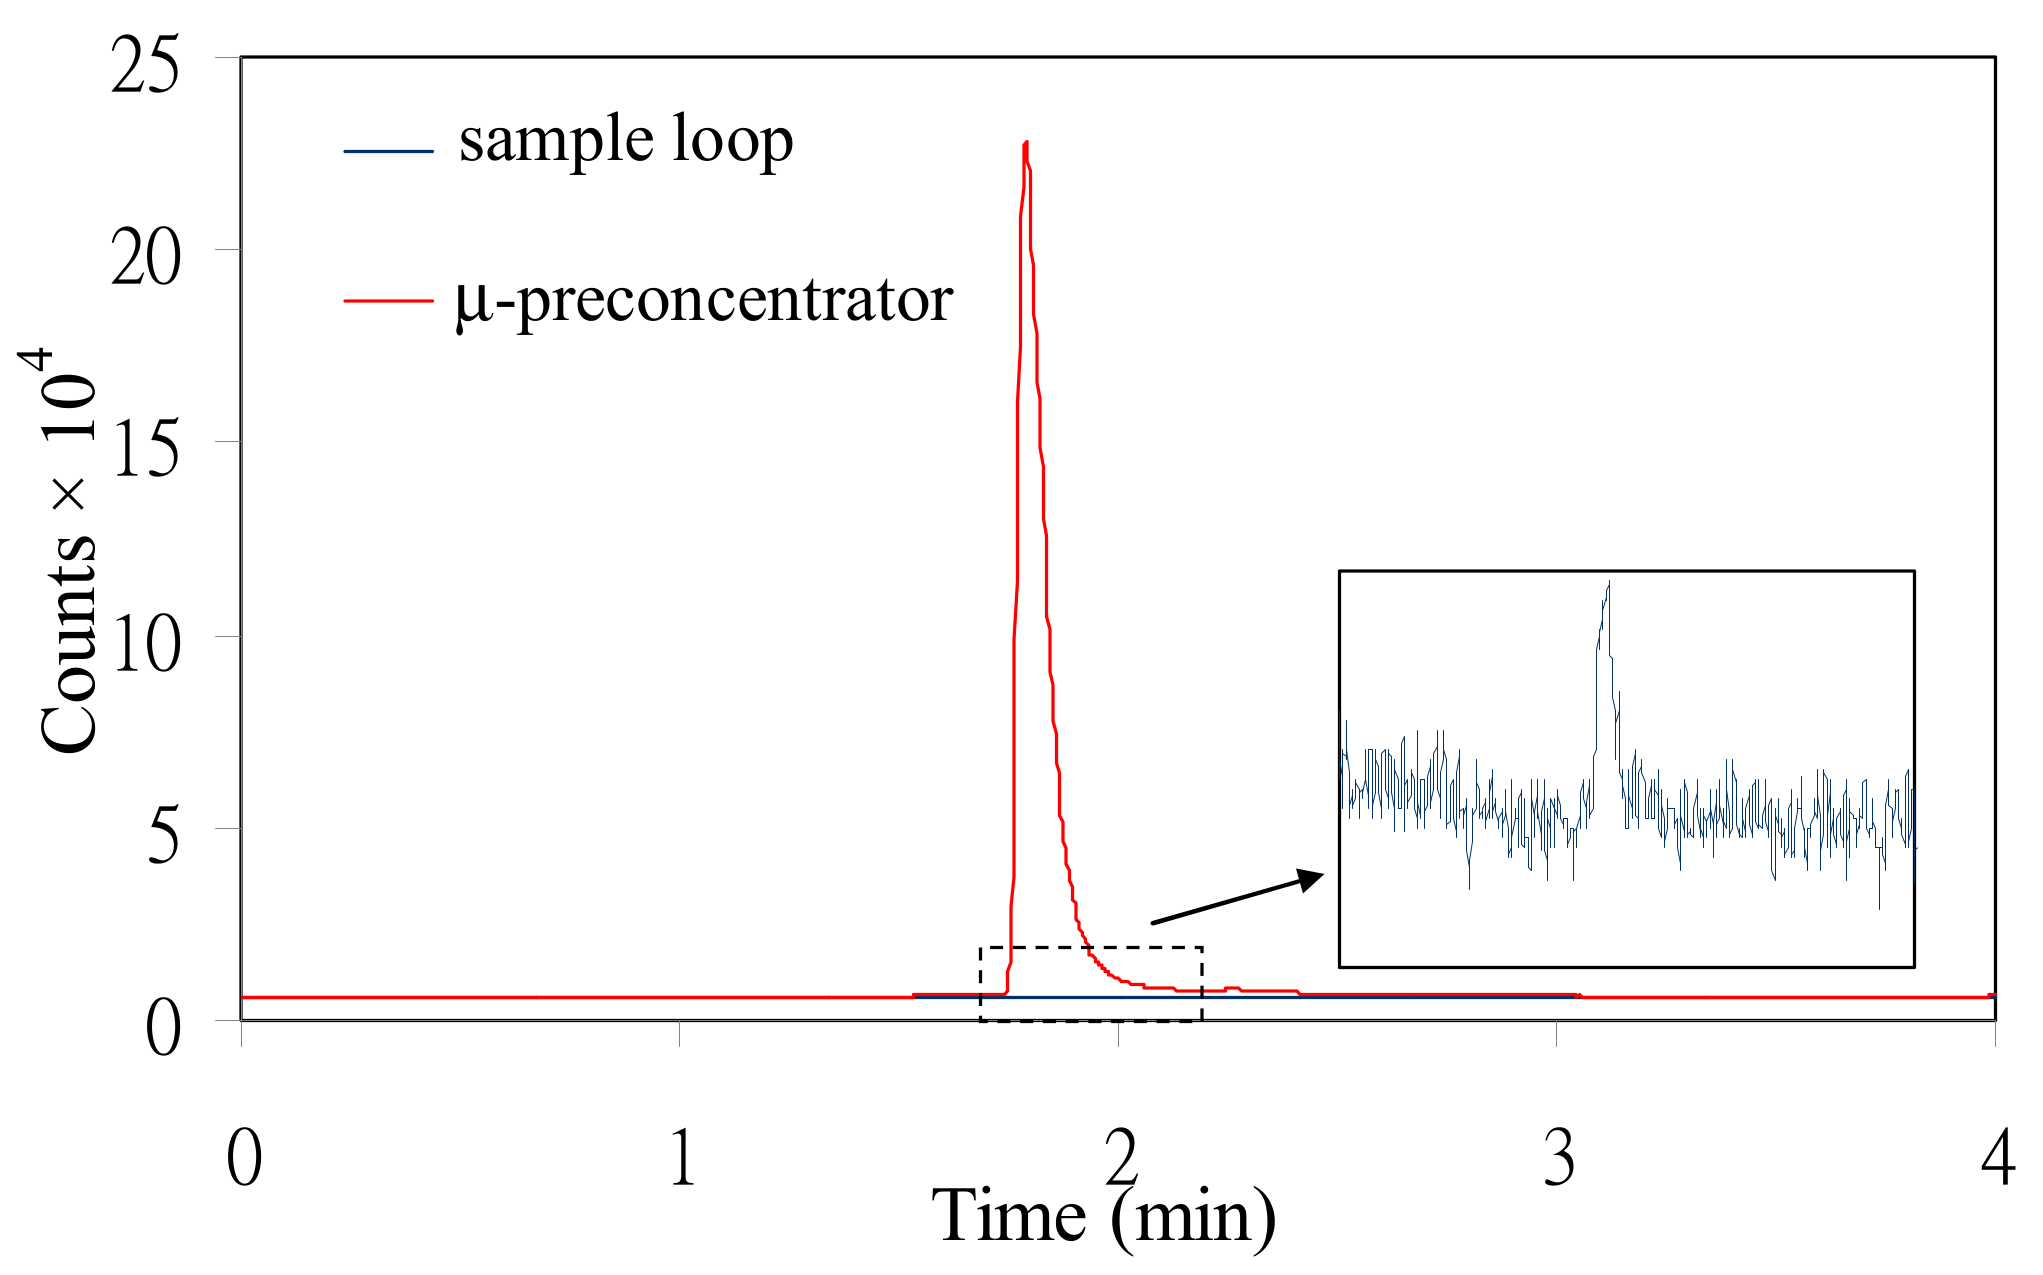
3.1. Initial Peak Amplification Test

Figure 4 compares two GC-FID signals of 200 ppb ethyl acetate with different sample/injection devices. The bottom trail used a 100 µL sampling loop to inject the original concentration sample into the GC-FID. The signal of the sampling loop injection was barely detectable. The insert is a blow-up of the sampling loop injection chromatogram with a peak area of only 56.8 (count × min). The top trail is a chromatogram of the same 200 ppb ethyl acetate after sampling for 2.4 L through the µ-preconcentrator. Thermal desorption was performed by ramping up the device temperature from room temperature to 320 °C within 4 s and maintaining this temperature for 90 s. This ultrafast heating rate is achieved due to the small thermal mass of the MEMS device and thin adsorbent film with a high surface area. The signal for ethyl acetate was significantly amplified, resulting in a peak area of 1,301,789 (count × min). A preliminary signal amplification factor can be calculated by peak area ratio 1,301,789/56.8 = 22,917. Theoretically, the peak amplification should be 24,000 and calculated by the sample volume ratio (i.e., 2.4 L/100 µL). A negative error of −4.5% could indicate a minor breakthrough (i.e., recovery = 95.5%) for ethyl acetate for such a large sampling volume at a given concentration. In a general environment, the concentrations of most VOCs rarely exceed 200 ppb. In fact, most VOCs in the atmosphere are in the low- or sub-ppb range [3,4]. Therefore, it should be safe to declare that a CMSM-coated µ-preconcentrator is applicable to sample VOCs with a similar volatility range with ethyl acetate in the general environment. The breakthrough on the preconcentrator at lower concentrations is not likely to happen.

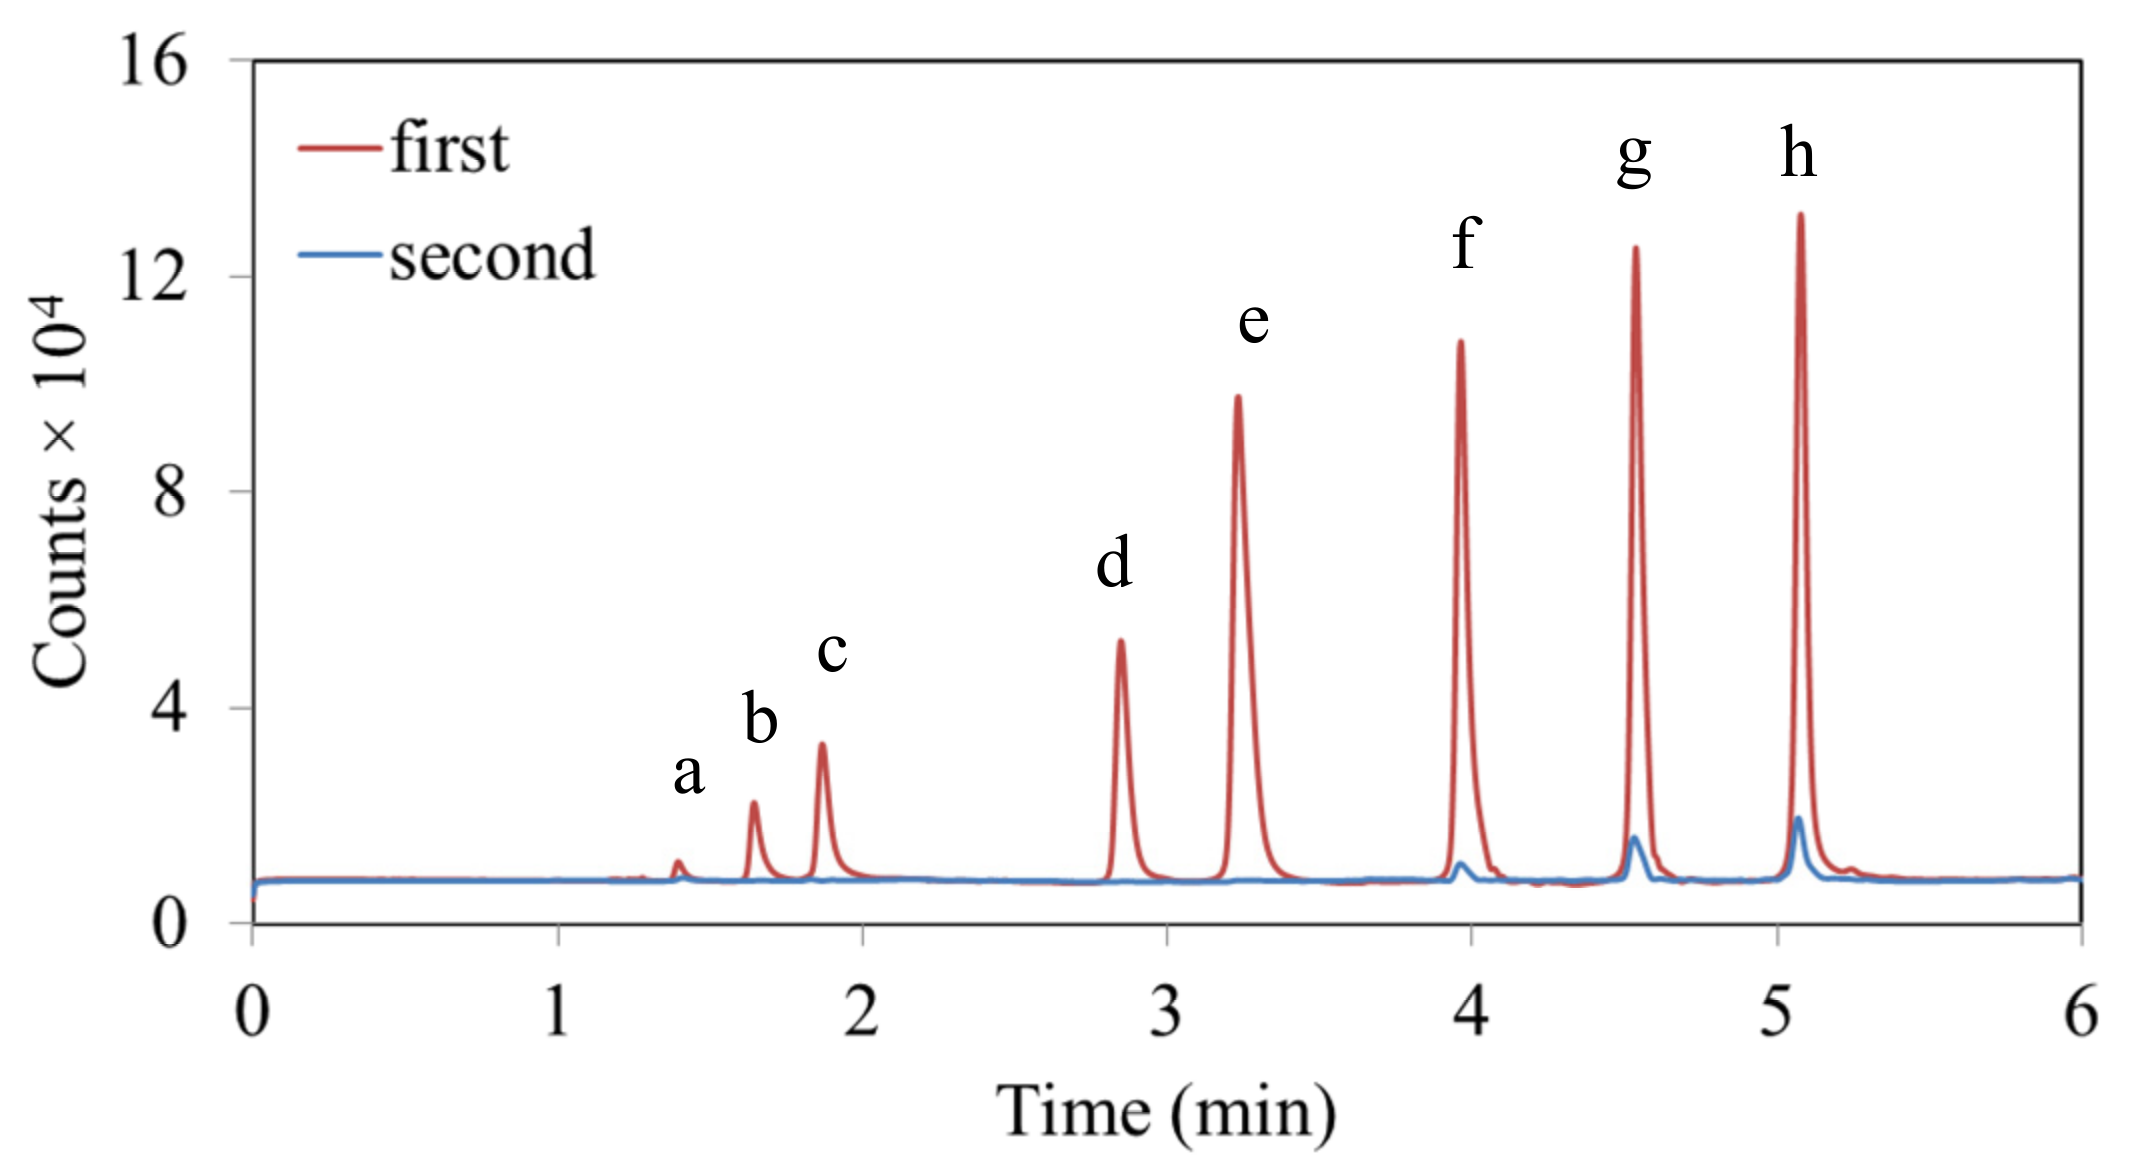
3.2. Desorption Residual Test

Although the high surface area of the CMSM can provide a high capacity for organic vapors, the incomplete desorption of low-volatile vapors is a concern. Figure 5 shows two chromatograms of mixtures with a wide range of volatilities when using the µ-preconcentrator as a sampler/injector. The most volatile compound tested was methanol (boiling point = 64.7 °C), and the least volatile compound was mesitylene (boiling point = 164.7 °C). The concentrations were 100 ppb for all tested chemicals. The first chromatogram shows the desorption of mixtures from the µ-preconcentrator after the collection of a 1 L mixture sample. The second chromatogram was generated immediately following desorption after the completion of the first injection (i.e., after cooling to room temperature without loading another sample). The peak widths at half height (PWHH) for all compounds were less than 3.0 s with the exception of benzene (3.5 s) in the first chromatogram. Compounds with high volatility desorbed rather easily, which resulted in narrow peak widths. Although the desorption peak of benzene was slightly broader, it was desorbed completely from the µ-preconcentrator in the first desorption. The sharp chromatographic peaks of less volatile compounds such as toluene, xylene, and mesitylene were a result of on-column focusing due to the column temperature program from low to high [10]. In the second chromatogram, toluene, xylene, and mesitylene all show an observable residual peak after the first desorption. Given the relatively small memory effect of toluene, it is possible to raise the desorption temperature and improve its desorption. Although prolonging the heating time or raising the desorption temperature might mitigate the residual problem, it is still at risk of cross-contamination from the previous sample. Therefore, the CMSM adsorbent developed in this study is not recommended for compounds with a volatility that is equal to or less than toluene.

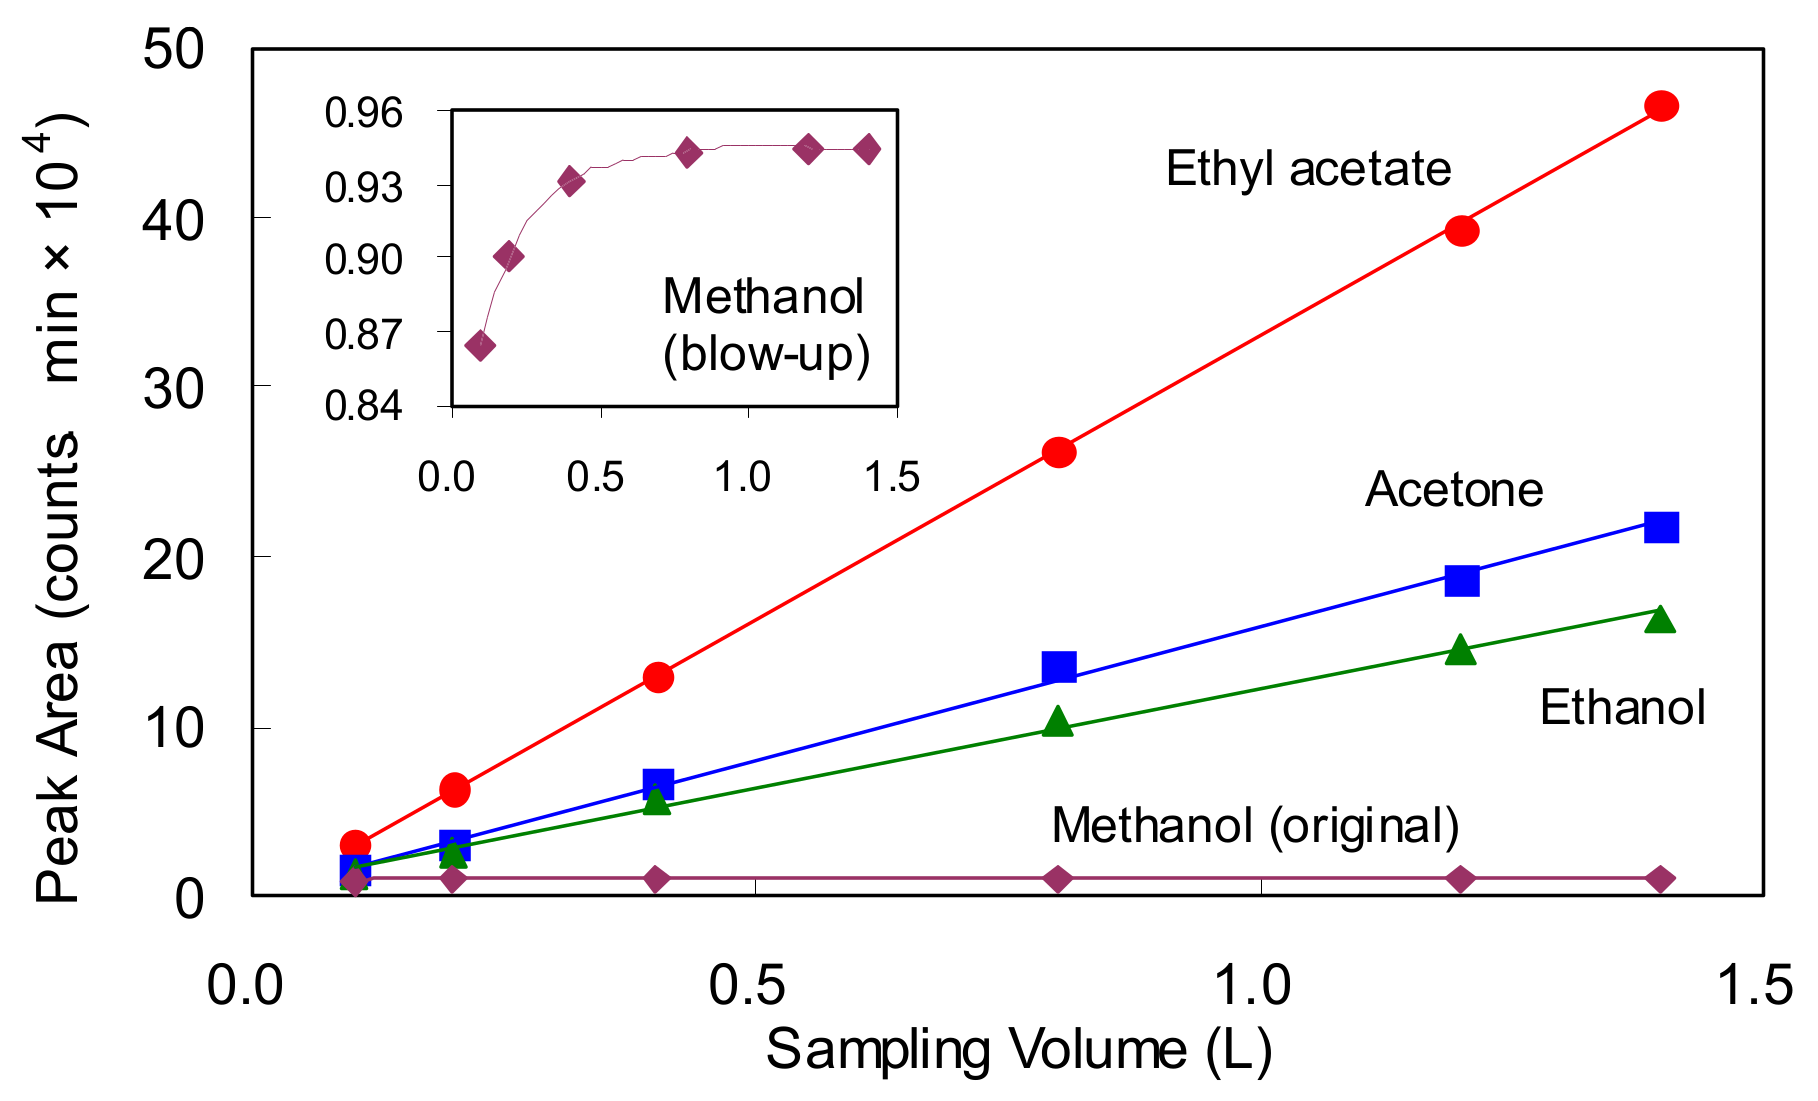
3.3. Capacity Limits for High Volatiles

Figure 6 shows the capacity limit test using the µ-preconcentrator with different sample volumes of a mixture consisting of methanol, ethanol, acetone, and ethyl acetate. The concentrations for all compounds were prepared at 100 ppb, and the sampling flow rate was fixed at 40 mL/min for this particular test. The desorption peak areas should increase proportionally with the increase in the sample volume. The linear calibrations of ethanol, acetone, and ethyl acetate suggest that they can be sampled by the µ-preconcentrator in samples of up to 1.4 L under the given sampling conditions (i.e., 100 ppb, 40 mL/min) without a measurable breakthrough. The bottom trail is the calibration line of methanol, which is difficult to observe alone with other calibration lines due to its low sensitivity with FID.
The insert plot shows a y-scale blow-up of the methanol calibration curve. As the insert plot shows, the desorption peak areas of methanol reached a plateau when the sample volume was above 0.4 L. This is a clear sign of breakthrough (i.e., reaching its maximum capacity for methanol). This result suggests that the µ-preconcentrator presented in this work can be used for methanol sampling only for concentrations below 100 ppb or when the required sample volume is less than 0.4 L. If large sample volumes are needed, the mass of the adsorbent must be increased, or the size of the chip must be increased. An additional five-replicate test with ethyl acetate at 100 ppb and 0.4 L sample volume shows that the variation of peak area is 5.8% using this CMSM µ-preconcentrator, which is slightly larger than our previous work (3.3%) with toluene vs. amorphous carbon.

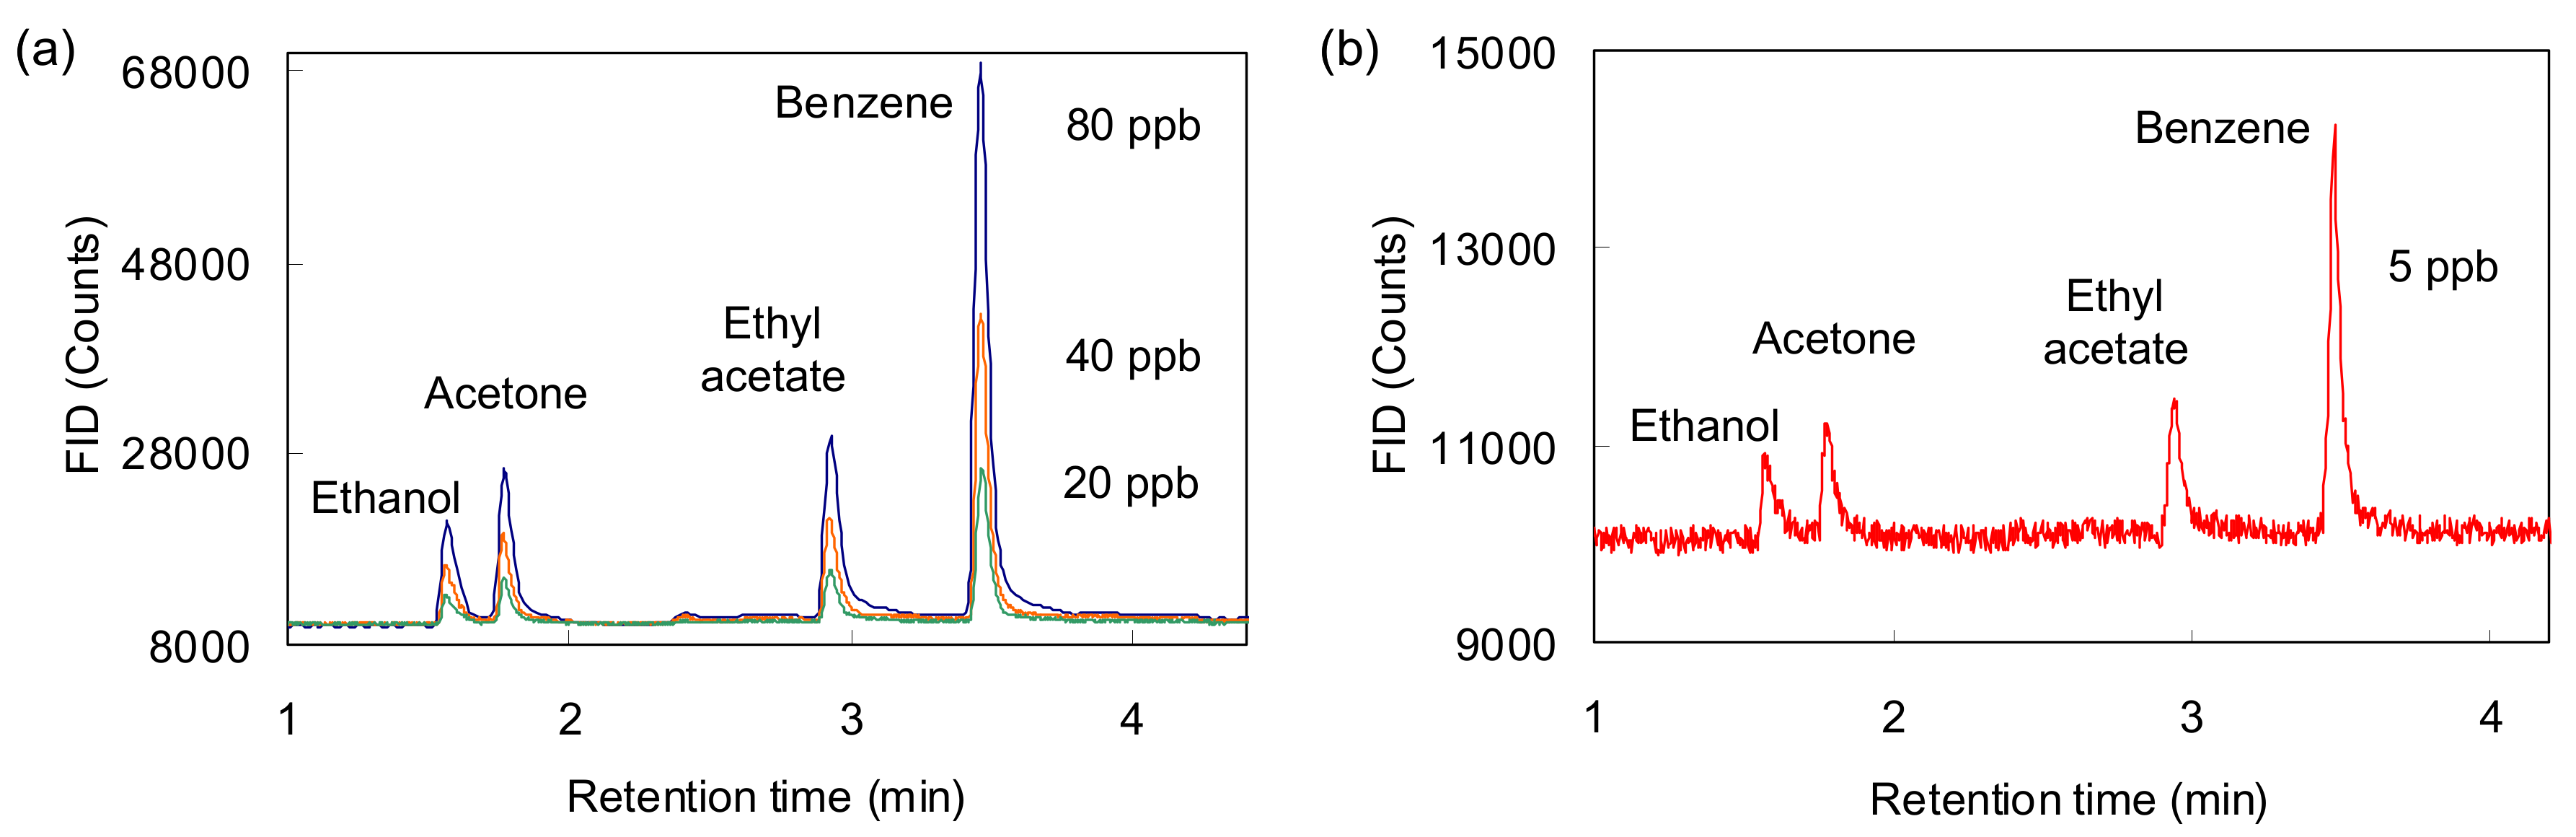
3.4. Concentration Tests with Constant Sample Volume

In most sampling situations, the sample volume of air was often pre-set at a constant value, and the results of the analytical GC peak area after preconcentration were used to calculate the corresponding concentration based on predetermined calibration lines. Figure 7 shows a series of chromatograms with different concentrations of four target compounds under a 1 L air sample volume. As can be seen in these chromatograms, the peak areas do vary with compound concentrations. This result demonstrates that one can use a constant sample volume to assess the corresponding concentration after proper calibrations. Although the 5 ppb peaks of ethanol and acetone seem barely visible in the current experiment setup, it is always possible to increase the sample volume to amplify the GC peaks, as previously shown in Figure 6. With this sampling condition, every analytical cycle needs 25 min of sampling time plus 4 min of chromatographic separation (i.e., from injection to the returning baseline after benzene peak). The time for each analytical cycle is approximately 29 min. The detection limits in terms of concentration assessed using the calibration data in Figure 7 (i.e., using 1 L as the gas sample volume) are 2.3 ppb ethanol, 2.0 ppb acetone, 1.3 ppb ethyl acetate, and 0.4 ppb benzene.

4. Discussion

Most currently available VOC sensors such as resistive sensors [32,33], optical sensors [34], or piezoelectric sensors [35,36] are often at a sensitivity level of ppm range. These sensors are practically useful for safety purposes such as monitoring chemical spills or leakages in industrial settings. It is often difficult for most chemical sensors to detect ppb-level VOCs in the field. Therefore, a conjunction system employing both preconcentration devices and sensors has become a plausible choice [27]. Although we have not yet tested this device directly with VOC sensors, similar experiments have been demonstrated with other devices [10,14].
By considering the findings of Figure 5 and Figure 6, it is clear that the thin CMSM adsorbent developed in this study is suitable for VOCs with molecular size or volatility between ethanol and benzene. There are many VOCs that fall within this category such as isopropanol, 2-butanone, diethyl ether, etc. Although none of these have been tested yet, the µ-preconcentrator should provide reasonably good sampling capacity for these chemicals without the concern of desorption residues. Some sorption-based sensors such as quartz crystal microbalance (QCM) [35] are less sensitive to highly volatile compounds due to their weak absorption nature. The high preconcentration factor for the high volatiles of this µ-preconcentrator can greatly improve the sensor detection limits.
Table 1 summarizes and compares some recent efforts in developing MEMS-based µ-preconcentrators. As seen in this table, most devices are based on photolithography and DRIE on a silicon wafer and then anodically bonded a glass wafer on top of µ-fluidics. Only a few studies in the literature provide unique, easily fabricated approaches with aluminum substrates [37,38]. It is also clear that polymer-based adsorbents such as Tenax are often designated for high-molecular-weight compounds and can only operate at a lower desorption temperature. Most carbon-based adsorbents can withstand higher desorption temperatures. The capacities of carbon adsorbents can vary in a wide range due to the differences in specific surface area (m2/g). The most commonly used amorphous carbon (e.g., Carbopack X) is suitable for mid-volatility compounds such as benzene, toluene, ethylbenzene, and xylenes (BTEX) [21,24,28,37]. If the target compounds are small molecules, it often requires a carbon molecular sieve to provide sufficient capacity [13,23,25].
Although we demonstrated the sufficient capacity of a CMSM for small molecules such as ethanol and acetone, some mid-volatility compounds are commonly seen in general environments such as benzene, toluene, ethylbenzene, and xylenes (BTEX) in the urban area. As shown in Figure 5, both toluene and xylenes show residual problems. Ethylbenzene has not yet been tested, but it is highly possible that it will also have the same problem with CMSM. In order to resolve the issue of a broad volatility range in real environmental VOCs, the use of a multistage adsorbent is inevitable [10,13]. At least one stage of the low-surface-area adsorbent bed needs to be connected in front of the CMSM adsorbent. For instance, the commercial adsorbent Carbopack X (250 m2/g) is known to be sufficient for trapping compounds with volatility lower than benzene [10], which might be an ideal candidate as the front stage for the CMSM.
In summary, the CMSM reported in this study provides a similar function in many high-surface-area commercial adsorbents such as Carboxen or Carbosieve (available from Sigma-Aldrich, St. Louis, MO, USA). All these carbon molecular sieves are synthesized via high-temperature pyrolysis (>700 °C) similar to the process in the current study. It is known that these granule adsorbents are thermally stable up to 400 °C. We used a lower operating temperature (320 °C) to protect the adsorbent. The loss of adsorption capacity was not observed over the course of this study. This work demonstrated the direct growth of a carbon molecular sieve adsorbent inside µ-fluidic channels, and hence it is more preferable for MEMS-based µ-preconcentrators.

5. Conclusions

This study presents the synthesis and evaluation of a high-surface-area carbon molecular sieve membrane as a useful adsorbent for a MEMS-based µ-preconcentrator while sampling highly volatile organic compounds. The advantage of this adsorbent is that it can be directly grown inside the MEMS device after all cleanroom fabrication steps are completed. This prevents cross-contamination from carbon dust to cleanroom facilities. Small-molecule VOCs such as ethanol or acetone can be easily preconcentrated by a few milligrams of CMSM without a measurable breakthrough. Sharp and narrow desorption peaks through the chromatographic column indicate the feasibility of directly using this device as an injector. The high surface area of thin CMSM in this study enables the high capacity of a miniaturized MEMS-based preconcentration device for highly volatile organic compound sampling.

Author Contributions

Conceptualization, H.-J.S.; methodology, C.-J.L.; software, T.-H.W.; investigation, H.-Y.K.; resources, H.-J.S.; data curation, W.-R.C.; writing—original draft preparation, C.-J.L.; writing—review and editing, C.-C.W. All authors have read and agreed to the published version of the manuscript.

Funding

The corresponding authors appreciate the funding support for this project from the Ministry of Science and Technology, Taiwan.

Institutional Review Board Statement

Not applicable.

Informed Consent Statement

Not applicable.

Data Availability Statement

Data is contained within the article.

Conflicts of Interest

The authors declare no conflict of interest.

References

  1. Valcarcel, M.; Cardenas, S.; Simonet, B.M.; Moliner-Martinez, Y.; Lucena, R. Carbon nanostructures as sorbent materials in analytical processes. Trends Anal. Chem. 2008, 27, 34–43. [Google Scholar] [CrossRef]
  2. Duran, C.; Ozdes, D.; Gundogdu, A.; Imamoglu, M.; Senturk, H.B. Tea-industry waste activated carbon, as a novel adsorbent, for separation, preconcentration and speciation of chromium. Anal. Chim. Acta 2011, 688, 75–83. [Google Scholar] [CrossRef] [PubMed]
  3. Gallego, E.; Roca, F.J.; Perales, J.F.; Guardino, X. Comparative study of the adsorption performance of a multi-sorbent bed (Carbotrap, Carbopack X, Carboxen 569) and a Tenax TA adsorbent tube for the analysis of volatile organic compounds (VOCs). Talanta 2010, 81, 916–924. [Google Scholar] [CrossRef]
  4. Liaud, C.; Nguyen, N.T.; Nasreddine, R.; Le Calvé, S. Experimental performances study of a transportable GC-PID and two thermo-desorption based methods coupled to FID and MS detection to assess BTEX exposure at sub-ppb level in air. Talanta 2014, 127, 33–42. [Google Scholar] [CrossRef] [PubMed]
  5. Ras-Mallorquí, M.R.; Marcé-Recasens, R.M.; Borrull-Ballarín, F. Determination of volatile organic compounds in urban and industrial air from Tarragona by thermal desorption and gas chromatography–mass spectrometry. Talanta 2007, 72, 941–950. [Google Scholar] [CrossRef]
  6. Lama, L.; Ferronato, C.; Fine, L.; Jaber, F.; Chovelon, J.M. Evaluation of adsorbents for volatile methyl siloxanes sampling based on the determination of their breakthrough volume. Talanta 2013, 115, 881–886. [Google Scholar] [CrossRef] [PubMed]
  7. Garbacz, M.; Malec, A.; Duda-Saternus, S.; Suchorab, Z.; Guz, L.; Łagód, G. Methods for Early Detection of Microbiological Infestation of Buildings Based on Gas Sensor Technologies. Chemosensors 2020, 8, 7. [Google Scholar] [CrossRef] [Green Version]
  8. Serrano, G.; Sukaew, T.; Zellers, E.T. Hybrid preconcentrator/focuser module for determinations of explosive marker compounds with a micro-scale gas chromatograph. J. Chromatogr. A 2013, 1279, 76–85. [Google Scholar] [CrossRef]
  9. Lu, C.-J.; Zellers, E.T. A dual-adsorbent preconcentrator for a portable indoor-VOC microsensor system. Anal. Chem. 2001, 73, 3449–3457. [Google Scholar] [CrossRef]
  10. Lu, C.-J.; Zellers, E.T. Multi-adsorbent preconcentration/focusing module for portable-GC/microsensor-array analysis of complex vapor mixtures. Analyst 2002, 127, 1061–1068. [Google Scholar]
  11. Terry, S.C.; Jerman, J.H.; Angell, J.B. A gas chromatographic air analyzer fabricated on a silicon wafer. IEEE Trans. Electron Dev. 1979, 26, 1880–1886. [Google Scholar] [CrossRef]
  12. Tian, W.-C.; Pang, S.W.; Lu, C.-J.; Zellers, E.T. Microfabricated preconcentrator-focuser for a microscale gas chromatograph. J. Microelectromech. Syst. 2003, 12, 264–272. [Google Scholar] [CrossRef]
  13. Tian, W.-C.; Chan, H.K.L.; Pang, S.W.; Lu, C.-J.; Zellers, E.T. Multiple-stage microfabricated preconcentrator-focuser for micro gas chromatography system. J. Microelectromech. Syst. 2005, 14, 498–507. [Google Scholar] [CrossRef]
  14. Lu, C.-J.; Steinecker, W.H.; Tian, W.-C.; Oborny, M.C.; Nichols, J.M.; Agah, M.; Potkay, J.A.; Chan, H.K.L.; Driscoll, J.; Sacks, R.D.; et al. First-generation hybrid MEMS gas chromatograph. Lab Chip 2005, 5, 1123–1131. [Google Scholar] [CrossRef] [PubMed]
  15. Chen, B.-X.; Hung, T.-Y.; Jian, R.-S.; Lu, C.-J. A multidimensional micro gas chromatograph employing a parallel separation multi-column chip and stop-flow μGC×μGCs configuration. Lab Chip 2013, 13, 1333–1341. [Google Scholar] [CrossRef]
  16. Voiculescu, I.; Zaghloul, M.; Narasimhan, N. Microfabricated chemical preconcentrators for gas-phase microanalytical detection systems. Trends Anal. Chem. 2008, 27, 327–345. [Google Scholar] [CrossRef]
  17. Ruiz, A.M.; Gracia, I.; Sabate, N.; Ivanov, P.; Sanchez, A.; Duch, M.; Gerboles, M.; Moreno, A.; Cane, C. Membrane-suspended microgrid as a gas preconcentrator for chromatographic applications. Sens. Actuat. A 2007, 135, 192–196. [Google Scholar] [CrossRef]
  18. Tian, W.-C.; Wu, T.H.; Lu, C.-J.; Chen, W.R.; Sheen, H.J. A novel and simple- fabricated micropreconcentrator for micro gas chromatography. J. Micromech. Microeng. 2012, 22, 065014. [Google Scholar] [CrossRef]
  19. McCartney, M.M.; Zrodnikov, Y.; Fung, A.G.; LeVasseur, M.K.; Pedersen, J.M.; Zamuruyev, K.O.; Aksenov, A.A.; Kenyon, N.J.; Davis, C.E. An Easy to Manufacture Micro Gas Preconcentrator for Chemical Sensing Applications. ACS Sens. 2017, 2, 1167–1174. [Google Scholar] [CrossRef]
  20. Mohsen, Y.; Lahlou, H.; Sanchez, J.-B.; Berger, F.; Bezverkhyy, I.; Weber, G.; Bellat, J.-P. Development of a micro-analytical prototype for selective trace detection of orthonitrotoluene. Microchem. J. 2014, 114, 48–52. [Google Scholar] [CrossRef]
  21. James, F.; Breuil, P.; Pijolat, C.; Camara, M.; Briand, D.; Bart, A.; Cozic, R. Development of a MEMS preconcentrator for micro-gas chromatography analyses. Procedia Eng. 2014, 87, 500–503. [Google Scholar] [CrossRef]
  22. Lahlou, H.; Vilanova, X.; Correig, X. Gas phase micro-preconcentrators for benzene monitoring: A review. Sens. Actuat. B 2013, 176, 198–210. [Google Scholar] [CrossRef]
  23. Janssen, S.; Tessmann, T.; Lang, W. High sensitive and selective ethylene measurement by using a large-capacity-on-chip preconcentrator device. Sens. Actuat. B 2014, 197, 405–413. [Google Scholar] [CrossRef]
  24. Ivanov, P.; Blanco, F.; Gracia, I.; Sabate, N.; Ruiz, A.M.; Vilanova, X.; Correig, X.; Fonseca, L.; Figueras, E.; Santander, J.; et al. Improvement of the gas sensor response via silicon μ-preconcentrator. Sens. Actuat. B 2007, 127, 288–294. [Google Scholar] [CrossRef]
  25. Dow, A.B.A.; Sklorz, A.; Lang, W. A microfluidic preconcentrator for enhanced monitoring of ethylene gas. Sens. Actuat. A 2011, 167, 226–230. [Google Scholar] [CrossRef]
  26. Camara, M.; Breuil, P.; Briand, D.; de Rooij, N.F.; Pijolat, C. A micro gas preconcentrator with improved performance for pollution monitoring and explosives detection. Anal. Chim. Acta 2011, 688, 175–182. [Google Scholar] [CrossRef] [Green Version]
  27. Slimani, S.; Bultel, E.; Cubizolle, T.; Herrier, C.; Rousselle, T.; Livache, T. Opto-Electronic Nose Coupled to a Silicon Micro Pre-Concentrator Device for Selective Sensing of Flavored Waters. Chemosensors 2020, 8, 60. [Google Scholar] [CrossRef]
  28. Wong, M.-Y.; Cheng, W.-R.; Liu, M.-H.; Tian, W.-C.; Lu, C.-J. A preconcentrator chip employing μ-SPME array coated with in-situ-synthesized carbon adsorbent film for VOCs analysis. Talanta 2012, 101, 307–313. [Google Scholar] [CrossRef] [PubMed]
  29. Vasilescu, A.; Fanjul-Bolado, P.; Titoiu, A.-M.; Porumb, R.; Epure, P. Progress in Electrochemical (Bio)Sensors for Monitoring Wine Production. Chemosensors 2019, 7, 66. [Google Scholar] [CrossRef] [Green Version]
  30. Jian, R.-S.; Wang, T.-Y.; Song, L.-Y.; Kuo, C.-Y.; Tian, W.-C.; Lo, E.-W.; Lu, C.-J. Field investigations and dynamic measurements of process activity induced VOCs inside a semiconductor cleanroom. Build. Environ. 2015, 94, 287–295. [Google Scholar] [CrossRef]
  31. Centeno, T.A.; Fuertes, A.B. Carbon molecular sieve gas separation membranes based on poly(vinylidene chloride-co-vinyl chloride). Carbon 2000, 38, 1067–1073. [Google Scholar] [CrossRef]
  32. Sachan, A.; Castro, M.; Choudhary, V.; Feller, J.-F. Influence of Water Molecules on the Detection of Volatile Organic Compounds (VOC) Cancer Biomarkers by Nanocomposite Quantum Resistive Vapor Sensors vQRS. Chemosensors 2018, 6, 64. [Google Scholar] [CrossRef] [Green Version]
  33. Huang, R.-X.; Lu, C.-J.; Tian, W.C. The shell structure effect on the vapor selectivity of monolayer-protected gold nanoparticle sensors. Chemosensors 2014, 2, 85–96. [Google Scholar] [CrossRef] [Green Version]
  34. Zhang, M.; Shi, J.; Liao, C.; Tian, Q.; Wang, C.; Chen, S.; Zang, L. Perylene Imide-Based Optical Chemosensors for Vapor Detection. Chemosensors 2021, 9, 1. [Google Scholar] [CrossRef]
  35. Wang, C.-C.; Lin, P.-Y.; Lu, C.-J.; Liu, M.-H. Rapid determination of volatile organics using a nanoporous zinc oxide microsphere-coated quartz crystal microbalance. Instrument. Sci. Tech. 2017, 45, 639–649. [Google Scholar] [CrossRef]
  36. Rianjanu, A.; Hasanah, S.A.; Nugroho, D.B.; Kusumaatmaja, A.; Roto, R.; Triyana, K. Polyvinyl Acetate Film-Based Quartz Crystal Microbalance for the Detection of Benzene, Toluene, and Xylene Vapors in Air. Chemosensors 2019, 7, 20. [Google Scholar] [CrossRef] [Green Version]
  37. Rodriguez-Cuevas, A.; Lara-Ibeas, I.; Leprince, A.; Wolf, M.; Le Calve, S. Easy-to-manufacture micro gas preconcentrator integrated in a portable GC for enhanced trace detection of BTEX. Sens. Actuat. B Chem. 2020, 324, 128690. [Google Scholar] [CrossRef]
  38. Lara-Ibeas, I.; Rodriguez-Cuevas, A.; Andrikopoulou, C.; Person, V.; Baldas, L.; Colin, S.; Le Calve, S. Sub-ppb Level Detection of BTEX Gaseous Mixtures with a Compact Prototype GC Equipped with a Preconcentration Unit. Micromachines 2019, 10, 187. [Google Scholar] [CrossRef] [PubMed] [Green Version]
Figure 1. (a) Front side, (b) back side, and (c) photo of the µ-preconcentrator device.
Chemosensors 09 00104 g001
Figure 2. Scanning electron microscope (SEM) images inside the µ-preconcentrator: (a) 45° view angle of a crack-opened device and (b) magnified image to show the carbon molecular sieve membrane attached to the silicon µ-pillars.
Chemosensors 09 00104 g002
Figure 3. Organic vapor sampling and injection experiment setup: (a) sample loading; (b) sample injection (i.e., thermal desorption).
Chemosensors 09 00104 g003
Figure 4. GC-FID signals of the 200 ppb ethyl acetate injection with a 100 µL sample loop and a µ-preconcentrator after sampling for 2.4 L and direct thermal desorption/injection. The sampling flow rate was 40 mL/min.
Chemosensors 09 00104 g004
Figure 5. CMSM µ-preconcentrator desorption residual test for a mixture of various compounds. Tested compounds: (a) methanol, (b) ethanol, (c) acetone, (d) ethyl acetate, (e) benzene, (f) toluene, (g) m-xylene, and (h) mesitylene. All compounds were prepared as a mixture in a Tedlar bag at 100 ppb each. The sample volume for the first GC-FID run was 1.0 L. The sampling flow rate was 40 mL/min. The second GC-FID run was the following desorption without sampling.
Chemosensors 09 00104 g005
Figure 6. The sampling capacity test of µ-preconcentrator for highly volatile compounds. All compounds are at the 100 ppb level. The sampling flow rate was 40 mL/min. The corresponding peak areas were measured after sampling for various volumes and then desorbed into GC-FID.
Chemosensors 09 00104 g006
Figure 7. µ-Preconcentrator/GC-FID chromatograms of the four target compounds at various concentrations using a 1 L air sample volume. (a) Chromatograms of 20, 40, and 80 ppb concentrations. (b) Chromatogram of a 5 ppb concentration. The sampling flow rate was 40 mL/min.
Chemosensors 09 00104 g007
Table 1. Summary of the miniaturized preconcentrator for organic vapor sampling.
Target VOCsDevice MaterialAdsorbent Material a/massOuter Dimensions l × w × h (mm3)Sample Vol. (mL)Desorp. Temp. (°C)Ref.
Ethanol, <C7 Si-GlCMSM/1.4 mg14 × 4 × 1.61400320This work
BTEXAlC-B/5.0 mg14 × 12 × 3.220330[37]
BTEXAlBasolite/5.8 mg40 × 40 × 1280150[38]
Toluene, ≥C6 Si-GlAm-CF/2.0 mg14 × 4 × 1.61000320[28]
Flavors, ≥C9Si-GlTenax/7.0 mg21 × 8 × ≤ 1.6 b80200[27]
BenzeneSi-GlSWCNTs/1.0 mg30 × 15 × ≤ 1.6 b835280[26]
EthyleneGl-Si-GlC-1000/6.6 mg30 × 15 × ≤ 2.0 b200300[23,25]
BenzeneSi-GlC-B/0.39 mg3 × 3 × ≤ 1.6 b6000250[24]
Toluene, CHCl3Si-GlC-NP/--85 × 20 × ≤ 1.6 b833230[21]
OrthonitrotolueneSi-GlZeolite/2.25 mg10 × 5 × 0.4 (cavity)500230[20]
d-Limonene, >C6Gl-GlTenax/--25.4 × 25.4 × 1.4180260[19]
Benzene, xyleneSi-GlAm-CF/0.3 mg13 × 8 × ≤ 1.6 b35300[18]
IPA → d-LimoneneSi-Gl3-stage/3.2 mg12 × 4 × ≤ 1.6 b250250[13]
a CMSM, carbon molecular sieve membrane; C-B, Carbopack B; Am-CF, amorphous carbon film; SWCNTs, single-wall carbon nanotubes; C-1000, Carboxen 1000; C-NP, carbon nanopowder; 3-stage, Carbotrap B + Carbopack X + Carboxen-1000. b Thickness was an estimated number of one standard silicon wafer and one wafer-bonded glass. The authors did not specify the thickness.
Publisher’s Note: MDPI stays neutral with regard to jurisdictional claims in published maps and institutional affiliations.

