
A Surface Acoustic Wave Sensor with a Microfluidic Channel for Detecting C-Reactive Protein

 , and
, and
Abstract
:1. Introduction
2. Materials and Methods
2.1. Design and Fabrication
2.2. Method of Immobilization
- (a)
- For a self-assembled monolayer (SAM) formation on Au surfaces, 11-mercaptoundencanoic acid (11-MUA) in absolute ethanol (4 mM) was injected into the gold sensing area and incubated for 24 h [35]. After SAM formation, careful and complete rinsing of ethanol is necessary to get rid of the multilayer 11-MUA [36], and the residual ethanol is washed out by deionized water and dried by nitrogen (N2) gas. SAMs on the Au surface with 11-MUA provide the opportunity to modify the acid end group through other functionalized groups [37].
- (b)
- This reactive SAM layer was activated in situ by immobilizing the N-hydroxysuccinimide (NHS) and 1-ethyl-3-(3-dimethylaminopropyl)-carbodiimide hydrochloride (EDC) reagents (volume ratio: 1:1 of 100 mM NHS and 400 mM EDC) for 20 min. The NHS-EDC activation approach is the most commonly used amine reactive cross-linking reagent because the main product of NHS-ester is the dominant intermediate product for immobilizing biomolecules containing free primary amino groups (e.g., anti-CRP in this study) via amide linkage [38,39]. After the activation process, the gold surface was washed with a sodium acetate buffer (10 mM, pH 5.0).
- (c)
- Immobilization of anti-CRP was performed in a sodium acetate buffer (10 mM, pH 5.0) for 24 h.
- (d)
- Blocking was done by incubating in ethanolamine-HCl (pH 8.5) solutions for 10 min, followed by washing and incubating in a phosphate-buffered saline (PBS) buffer.
- (e)
- The prepared CRP with the PBS buffer solution was injected over the sensing area and was allowed to react with anti-CRP to evaluate the interaction between them.
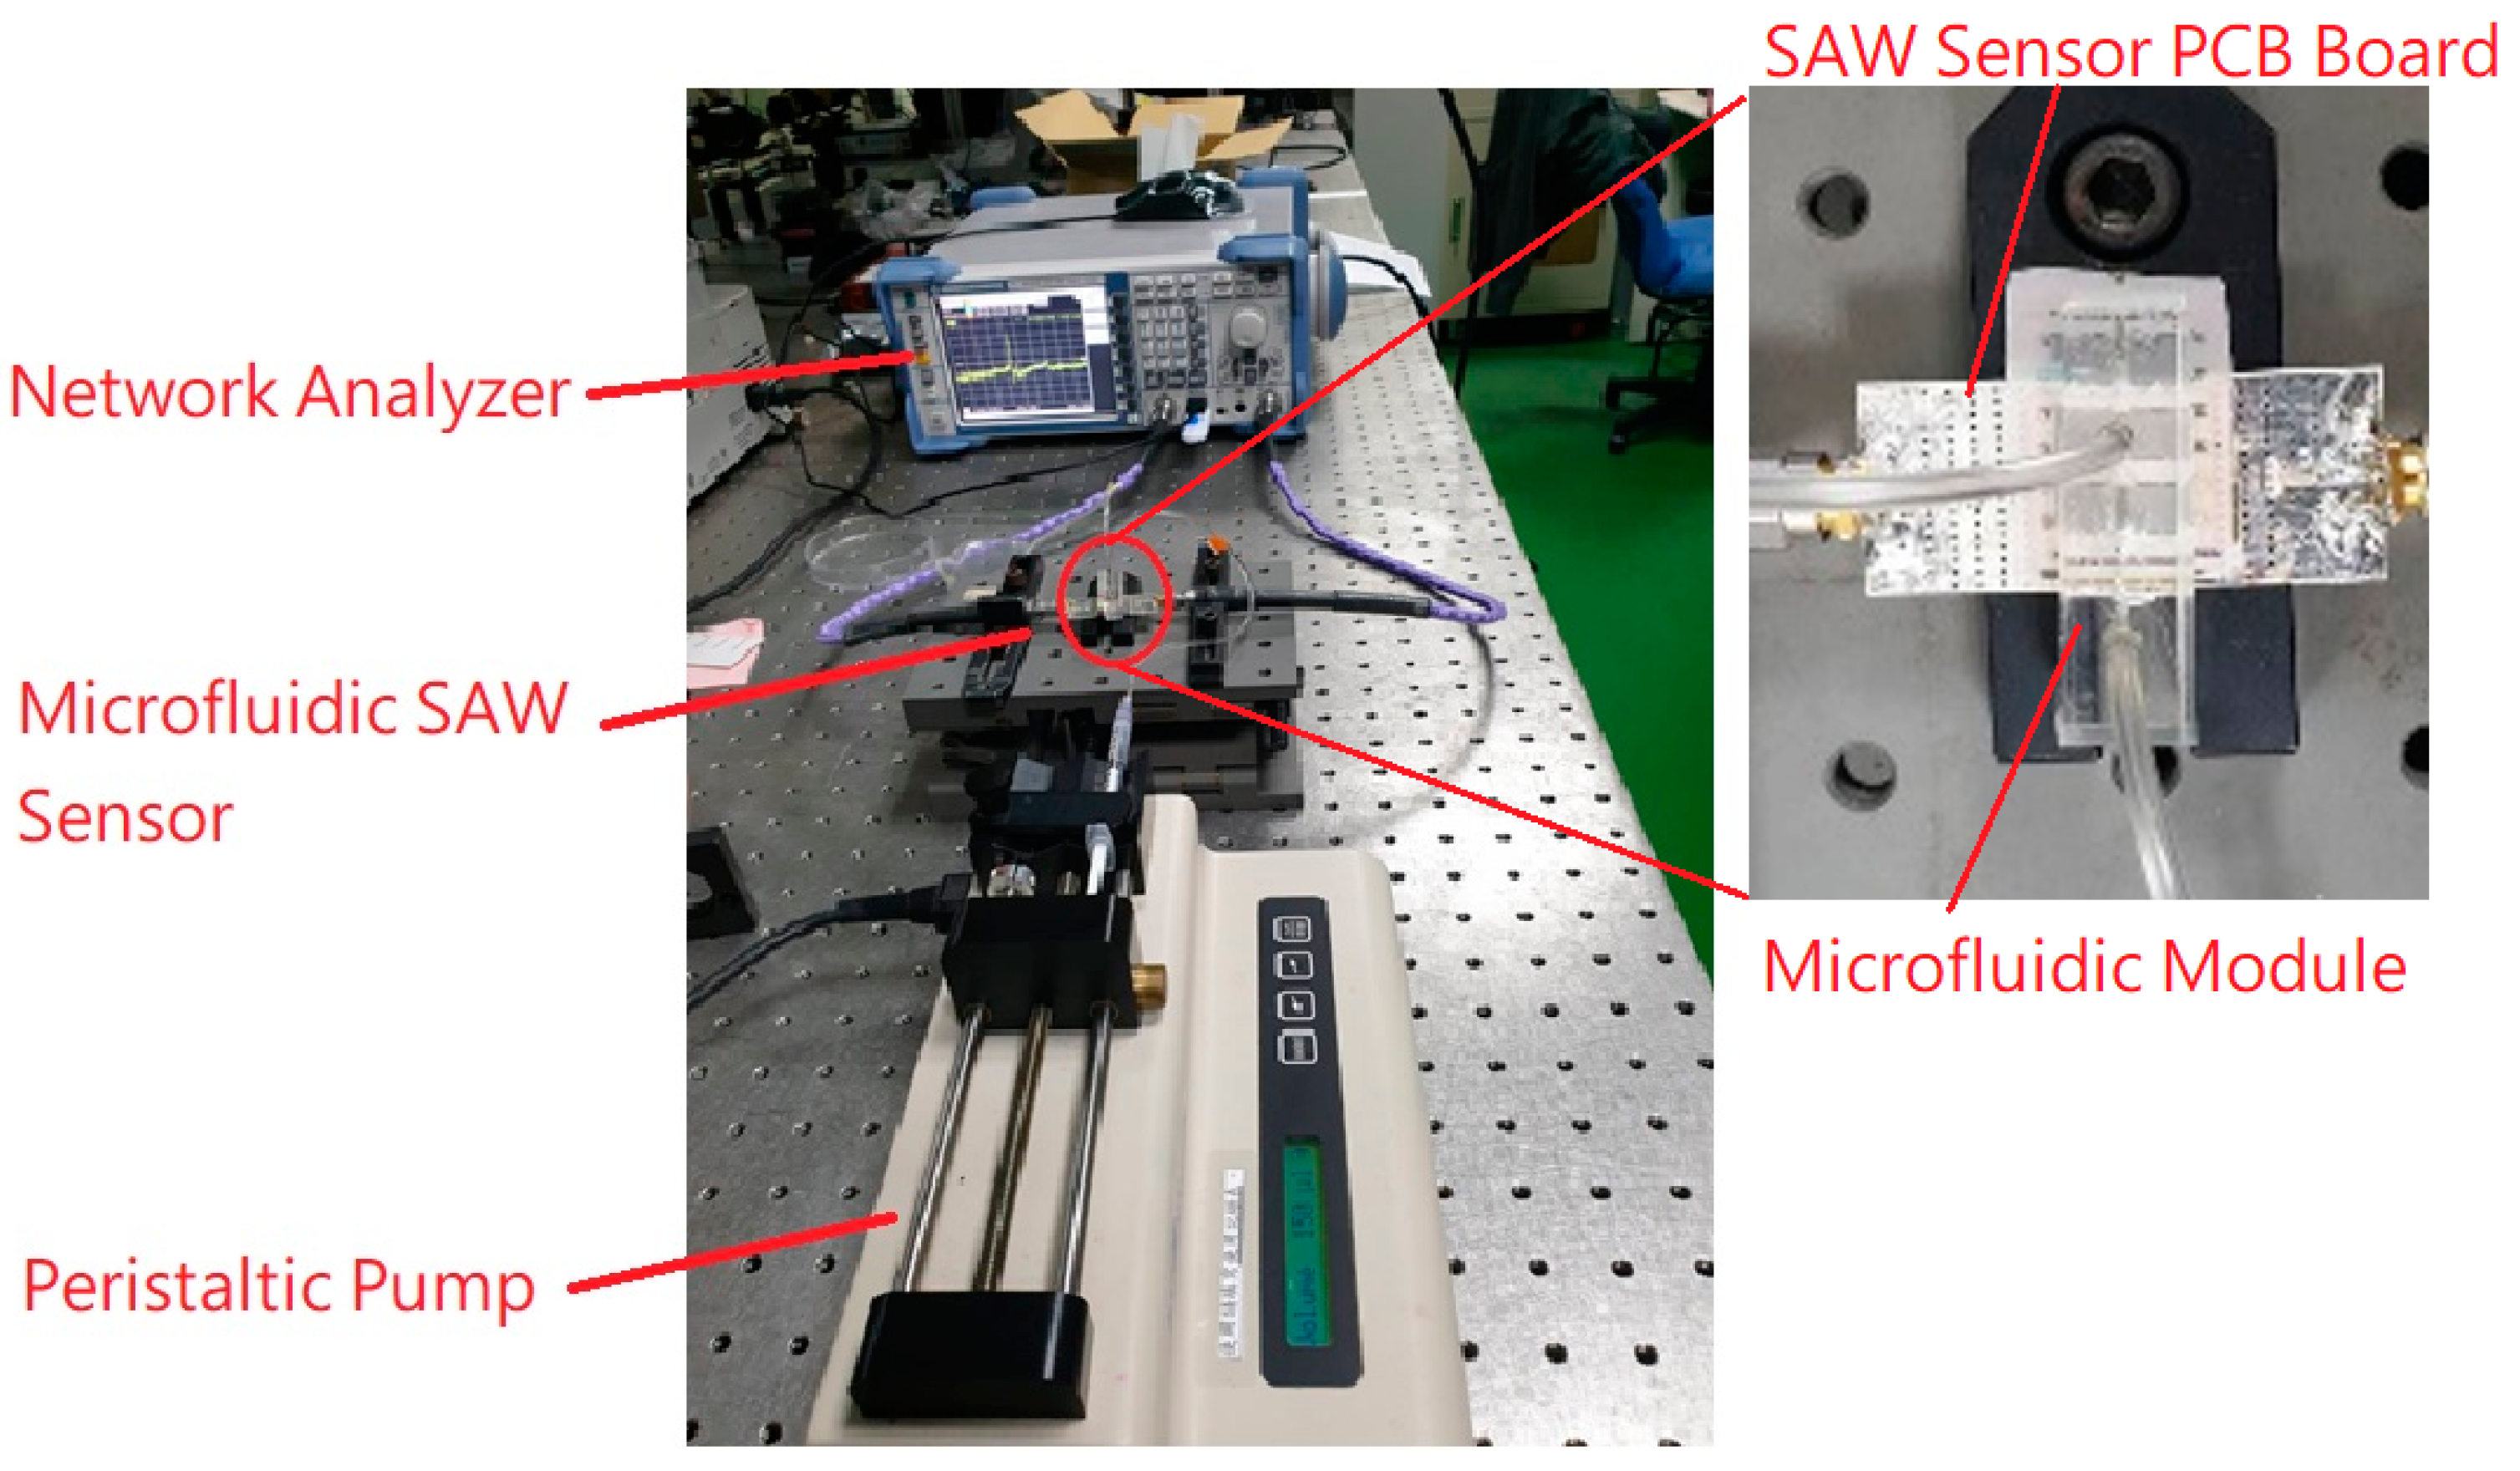
2.3. Method of Measurement
3. Results and Discussion
4. Conclusions
Author Contributions
Funding
Institutional Review Board Statement
Informed Consent Statement
Data Availability Statement
Conflicts of Interest
References
- Pepys, M.B.; Hirschfield, G.M. C-reactive protein: A critical update. J. Clin. Investig. 2003, 111, 1805–1812. [Google Scholar] [CrossRef] [PubMed]
- Myers, G.L.; Rifai, N.; Tracy, R.P.; Roberts, W.L.; Alexander, R.W.; Biasucci, L.M.; Kimberly, M.M. CDC/AHA workshop on markers of inflammation and cardiovascular disease: Application to clinical and public health practice: Report from the laboratory science discussion group. Circulation 2004, 110, e545–e549. [Google Scholar] [CrossRef] [Green Version]
- Yeh, T.H.; Willerson, J.T. Coming of age of C-reactive protein using inflammation markers in cardiology. Circulation 2003, 107, 370–372. [Google Scholar] [CrossRef] [PubMed]
- Salvo, P.; Dini, V.; Kirchhain, A.; Janowska, A.; Oranges, T.; Chiricozzi, A.; Lomonaco, T.; Di Francesco, F.; Romanelli, M. Sensors and biosensors for c-reactive protein, temperature and ph, and their applications for monitoring wound healing: A review. Sensors 2017, 17, 2952. [Google Scholar] [CrossRef] [Green Version]
- Legendre, C.; Debure, C.; Meaume, S.; Lok, C.; Golmard, J.L.; Senet, P. Impact of protein deficiency on venous ulcer healing. J. Vasc. Surg. 2008, 48, 688–693. [Google Scholar] [CrossRef] [Green Version]
- Cerveró-Ferragut, S.; López-Riquelme, N.; Martín-Tomás, E.; Massa-Domínguez, B.; Pomares-Vicente, J.; Soler-Pérez, M.; Sánchez-Hernández, J.F. Quantitative analysis of blood cells and inflammatory factors in wounds. J. Wound Care 2017, 26, 121–125. [Google Scholar] [CrossRef]
- Liu, T.; Yang, F.; Li, Z.; Yi, C.; Bai, X. A Prospective Pilot Study to EvaluateWound Outcomes and Levels of Serum C-reactive Protein and Interleukin-6 in the Wound Fluid of Patients with Trauma-related Chronic Wounds. Ostomy Wound Manag. 2014, 60, 30–37. [Google Scholar]
- Chapman, G.; Holton, J.; Chapman, A. A threshold for concern? C-reactive protein levels following operatively managed neck of femur fractures can detect infectious complications with a simple formula. Clin. Biochem. 2016, 49, 219–224. [Google Scholar] [CrossRef] [Green Version]
- Jeandrot, A.; Richard, J.L.; Combescure, C.; Jourdan, N.; Finge, S.; Rodier, M.; Corbeau, P.; Sotto, A.; Lavigne, J.P. Serum procalcitonin and C-reactive protein concentrations to distinguish mildly infected from non-infected diabetic foot ulcers: A pilot study. Diabetologia 2008, 51, 347–352. [Google Scholar] [CrossRef] [Green Version]
- Van Asten, S.A.; Jupiter, D.C.; Mithani, M.; La Fontaine, J.; Davis, K.E.; Lavery, L.A. Erythrocyte sedimentation rate and C-reactive protein to monitor treatment outcomes in diabetic foot osteomyelitis. Int. Wound J. 2017, 14, 142–148. [Google Scholar] [CrossRef]
- Magliulo, M.; De Tullio, D.; Vikholm-Lundin, I.; Albers, W.M.; Munter, T.; Manoli, K.; Palazzo, G.; Torsi, L. Label-free C-reactive protein electronic detection with an electrolyte-gated organic field-effect transistor-based immunosensor. Anal. Bioanal. Chem. 2016, 408, 3943–3952. [Google Scholar] [CrossRef]
- Yen, Y.-K.; Lai, Y.-C.; Hong, W.-T.; Pheanpanitporn, Y.; Chen, C.-S.; Huang, L.-S. Electrical detection of c-reactive protein using a single freestanding, thermally controlled piezoresistive microcantilever for highly reproducible and accurate measurements. Sensors 2013, 13, 9653–9668. [Google Scholar] [CrossRef]
- Yang, S.F.; Gao, B.Z.; Tsai, H.Y.; Fuh, C.B. Detection of c-reactive protein based on a magnetic immunoassay by using functional magnetic and fluorescent nanoparticles in microplates. Analyst 2014, 139, 5576–5581. [Google Scholar] [CrossRef] [PubMed]
- Luo, Y.; Zhang, B.; Chen, M.; Jiang, T.; Zhou, D.; Huang, J.; Fu, W. Sensitive and rapid quantification of C-reactive protein using quantum dot-labeled microplate immunoassay. J. Trans. Med. 2012, 10, 24. [Google Scholar] [CrossRef] [PubMed] [Green Version]
- Mitsakakis, K.; Gizeli, E. Detection of multiple cardiac markers with an integrated acoustic platform for cardiovascular risk assessment. Anal. Chim. Acta 2011, 699, 1–5. [Google Scholar] [CrossRef] [PubMed]
- Bing, X.; Wang, G. Label free c-reactive protein detection based on an electrochemical sensor for clinical application. Int. J. Electrochem. Sci. 2017, 12, 6304–6314. [Google Scholar] [CrossRef]
- Thangamuthu, M.; Santschi, C.; J.F. Martin, O. Label-free electrochemical immunoassay for c-reactive protein. Biosensors 2018, 8, 34. [Google Scholar] [CrossRef] [Green Version]
- Vance, S.A.; Sandros, M.G. Zeptomole detection of c-reactive protein in serum by a nanoparticle amplified surface plasmon resonance imaging aptasensor. Sci. Rep. 2014, 4, 5129. [Google Scholar] [CrossRef] [Green Version]
- Vashist, S.K.; Schneider, E.; Luong, J.H. Surface plasmon resonance-based immunoassay for human c-reactive protein. Analyst 2015, 140, 4445–4452. [Google Scholar] [CrossRef]
- Wang, W.; Mai, Z.; Chen, Y.; Wang, J.; Li, L.; Su, Q.; Li, X.; Hong, X. A labelfree fiber optic spr biosensor for specific detection of c-reactive protein. Sci. Rep. 2017, 7, 16904. [Google Scholar]
- Kim, N.; Kim, D.-K.; Cho, Y.-J. Development of indirect-competitive quartz crystal microbalance immunosensor for c-reactive protein. Sens. Actuat. B Chem. 2009, 143, 143,444–448. [Google Scholar] [CrossRef]
- Gao, K.; Cui, S.; Liu, S. Development of an electrochemical quartz crystal microbalance-based immunosensor for c-reactive protein determination. Int. J. Electrochem. Sci. 2018, 13, 812–821. [Google Scholar] [CrossRef]
- Reyes, D.R.; Iossifidis, D.; Auroux, P.A.; Manz, A. Micro total analysis systems. 1. Introduction, theory, and technology. Anal. Chem. 2002, 74, 2623–2636. [Google Scholar] [CrossRef]
- Luo, J.K.; Fu, Y.Q.; Milne, W.I. Acoustic Wave Based Microfluidics and Lab-on-a-Chip. In Modeling and Measurement Methods for Acoustic Waves and for Acoustic Microdevices; Beghi, M.G., Ed.; IntechOpen: London, UK, 2013; Available online: https://www.intechopen.com/books/modeling-and-measurement-methods-for-acoustic-waves-and-for-acoustic-microdevices/acoustic-wave-based-microfluidics-and-lab-on-a-chip (accessed on 28 August 2013). [CrossRef] [Green Version]
- Laser, D.J.; Santiago, J.G. A review of micropumps. J. Micromech. Microengi. 2004, 14, R35. [Google Scholar] [CrossRef]
- Länge, K.; Blaess, G.; Voigt, A.; Götzen, R.; Rapp, M. Integration of a surface acoustic wave biosensor in a microfluidic polymer chip. Biosens. Bioelectron. 2006, 22, 227–232. [Google Scholar] [CrossRef] [PubMed]
- Ding, X.; Li, P.; Lin, S.C.S.; Stratton, Z.S.; Nama, N.; Guo, F.; Slotcavage, D.; Mao, X.; Shi, J.; Costanzo, F.; et al. Surface acoustic wave microfluidics. Lab Chip 2013, 13, 3626–3649. [Google Scholar] [CrossRef]
- Go, D.B.; Atashbar, M.Z.; Ramshani, Z.; Chang, H.C. Surface acoustic wave devices for chemical sensing and microfluidics: A review and perspective. Anal. Methods 2017, 9, 4112–4134. [Google Scholar] [CrossRef]
- Yang, Y.N.; Lin, H.I.; Wang, J.H.; Shiesh, S.C.; Lee, G.B. An integrated microfluidic system for C-reactive protein measurement. Biosens. Bioelectron. 2009, 24, 3091–3096. [Google Scholar] [CrossRef] [PubMed]
- Lee, W.B.; Chen, Y.H.; Lin, H.I.; Shiesh, S.C.; Lee, G.B. An integrated microfluidic system for fast, automatic detection of C-reactive protein. Sens. Actuat. B Chem. 2011, 157, 710–721. [Google Scholar] [CrossRef]
- Tsai, M.Z.; Hsiung, C.T.; Chen, Y.; Huang, C.S.; Hsu, H.Y.; Hsieh, P.Y. Real-time CRP detection from whole blood using micropost-embedded microfluidic chip incorporated with label-free biosensor. Analyst 2018, 143, 503–510. [Google Scholar] [CrossRef]
- Länge, K.; Rapp, B.E.; Rapp, M. Surface acoustic wave biosensors: A review. Anal. Bioanal. Chem. 2008, 391, 1509–1519. [Google Scholar] [CrossRef] [PubMed]
- Pomowski, A.; Baricham, C.; Rapp, B.E.; Matern, A.; Länge, K. Acoustic biosensors coated with phosphorylcholine groups for label-free detection of human C-reactive protein in serum. IEEE Sens. J. 2015, 15, 4388–4392. [Google Scholar] [CrossRef]
- Jeng, M.-J.; Sharma, M.; Li, Y.-C.; Lu, Y.-C.; Yu, C.-Y.; Tsai, C.-L.; Huang, S.-F.; Chang, L.-B.; Lai, C.-S. Surface Acoustic Wave Sensor for C-Reactive Protein Detection. Sensors 2020, 20, 6640. [Google Scholar]
- Stettner, J.; Frank, P.; Griesser, T.; Trimmel, G.; Schennach, R.; Gilli, E.; Winkler, A. A Study on the Formation and Thermal Stability of 11-MUA SAMs on Au(111)/Mica and on Polycrystalline Gold Foils. Langmuir 2009, 25, 1427–1433. [Google Scholar] [CrossRef]
- Daniel, K.; Gregor, W.; Piotr, C.; Andreas, T.; Christof, W. A comprehensive study of self-assembled monolayers of anthracenethiol on gold: Solvent effects, structure, and stability. J. Am. Chem. Soc. 2006, 128, 1723–1732. [Google Scholar]
- Frey, B.L.; Corn, R.M. Covalent Attachment and Derivatization of Poly(L-lysine) Monolayers on Gold Surfaces As Characterized by Polarization-Modulation FT-IR Spectroscopy. Anal. Chem. 1996, 68, 3187–3193. [Google Scholar] [CrossRef]
- Wang, C.; Yan, Q.; Liu, H.-B.; Zhou, X.H.; Xiao, S.J. Different EDC/NHS Activation Mechanisms between PAA and PMAA Brushes and the Following Amidation Reactions. Langmuir 2011, 27, 12058–12068. [Google Scholar] [CrossRef] [PubMed]
- Yan, Q.; Zheng, H.N.; Jiang, C.; Lia, K.; Xiao, S.J. EDC/NHS activation mechanism of polymethacrylic acid: Anhydride versus NHS-ester. RSC Adv. 2015, 5, 69939–69947. [Google Scholar] [CrossRef]
- Wang, T. Optimization and Characterization of Integrated Microfluidic Surface Acoustic Wave Sensors and Transducers. 2016 Graduate Theses and Dissertations. Available online: http://scholarcommons.usf.edu/etd/6153 (accessed on 10 November 2020).
- Physical Properties of Glycerine and its Solutions; Glycerine Producers’ Association: New York, NY, USA, 1963; Available online: https://www.aciscience.org/docs/Physical_properties_of_glycerine_and_its_solutions.pdf (accessed on 10 November 2020).
- Sengul, U. Comparing determination methods of detection and quantification limits for aflatoxin analysis in hazelnut. J. Food Drug Anal. 2016, 24, 56–62. [Google Scholar] [CrossRef] [PubMed] [Green Version]
- Shrivastava, A.; Gupta, V.B. Methods for the determination of limit of detection and limit of quantitation of the analytical methods. Chron. Young Sci. 2011, 2, 21–25. [Google Scholar] [CrossRef]


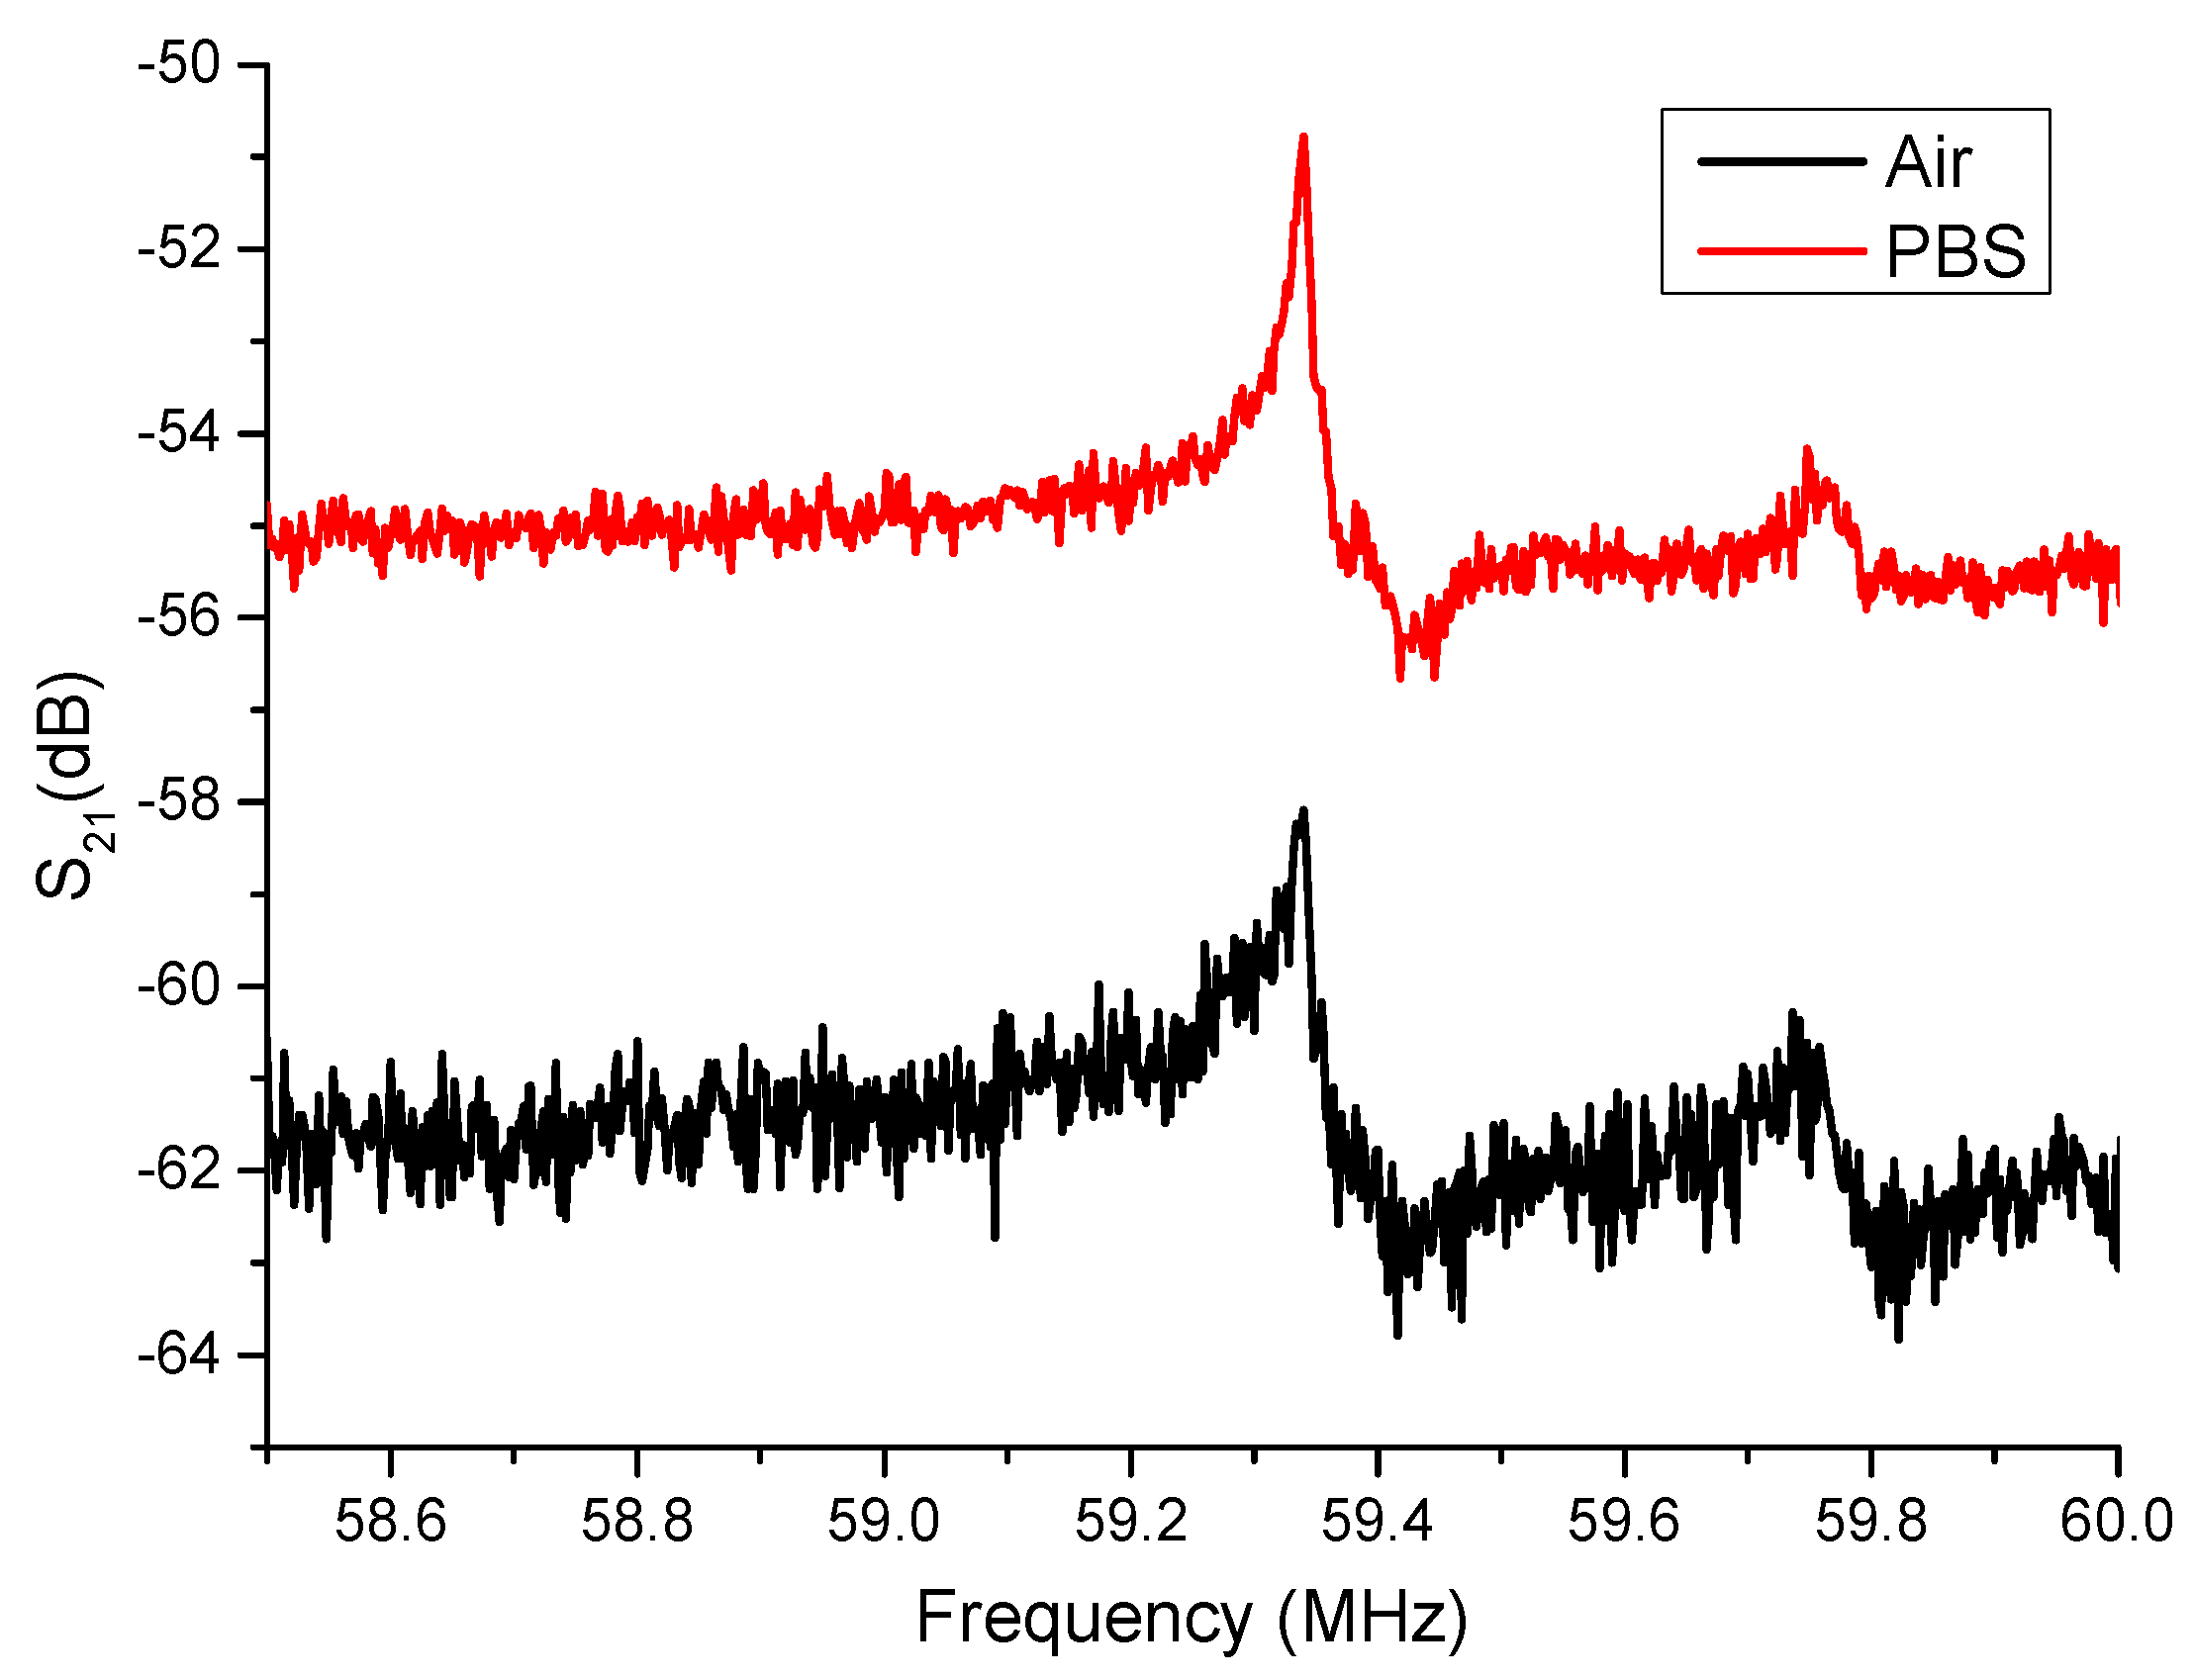
| Fill Materials | Air (dB) | PBS (dB) |
|---|---|---|
| Averaged resonance peak | −58.02 | −50.76 |
| Standard deviation of resonance peak | 0.0643 | 0.0228 |
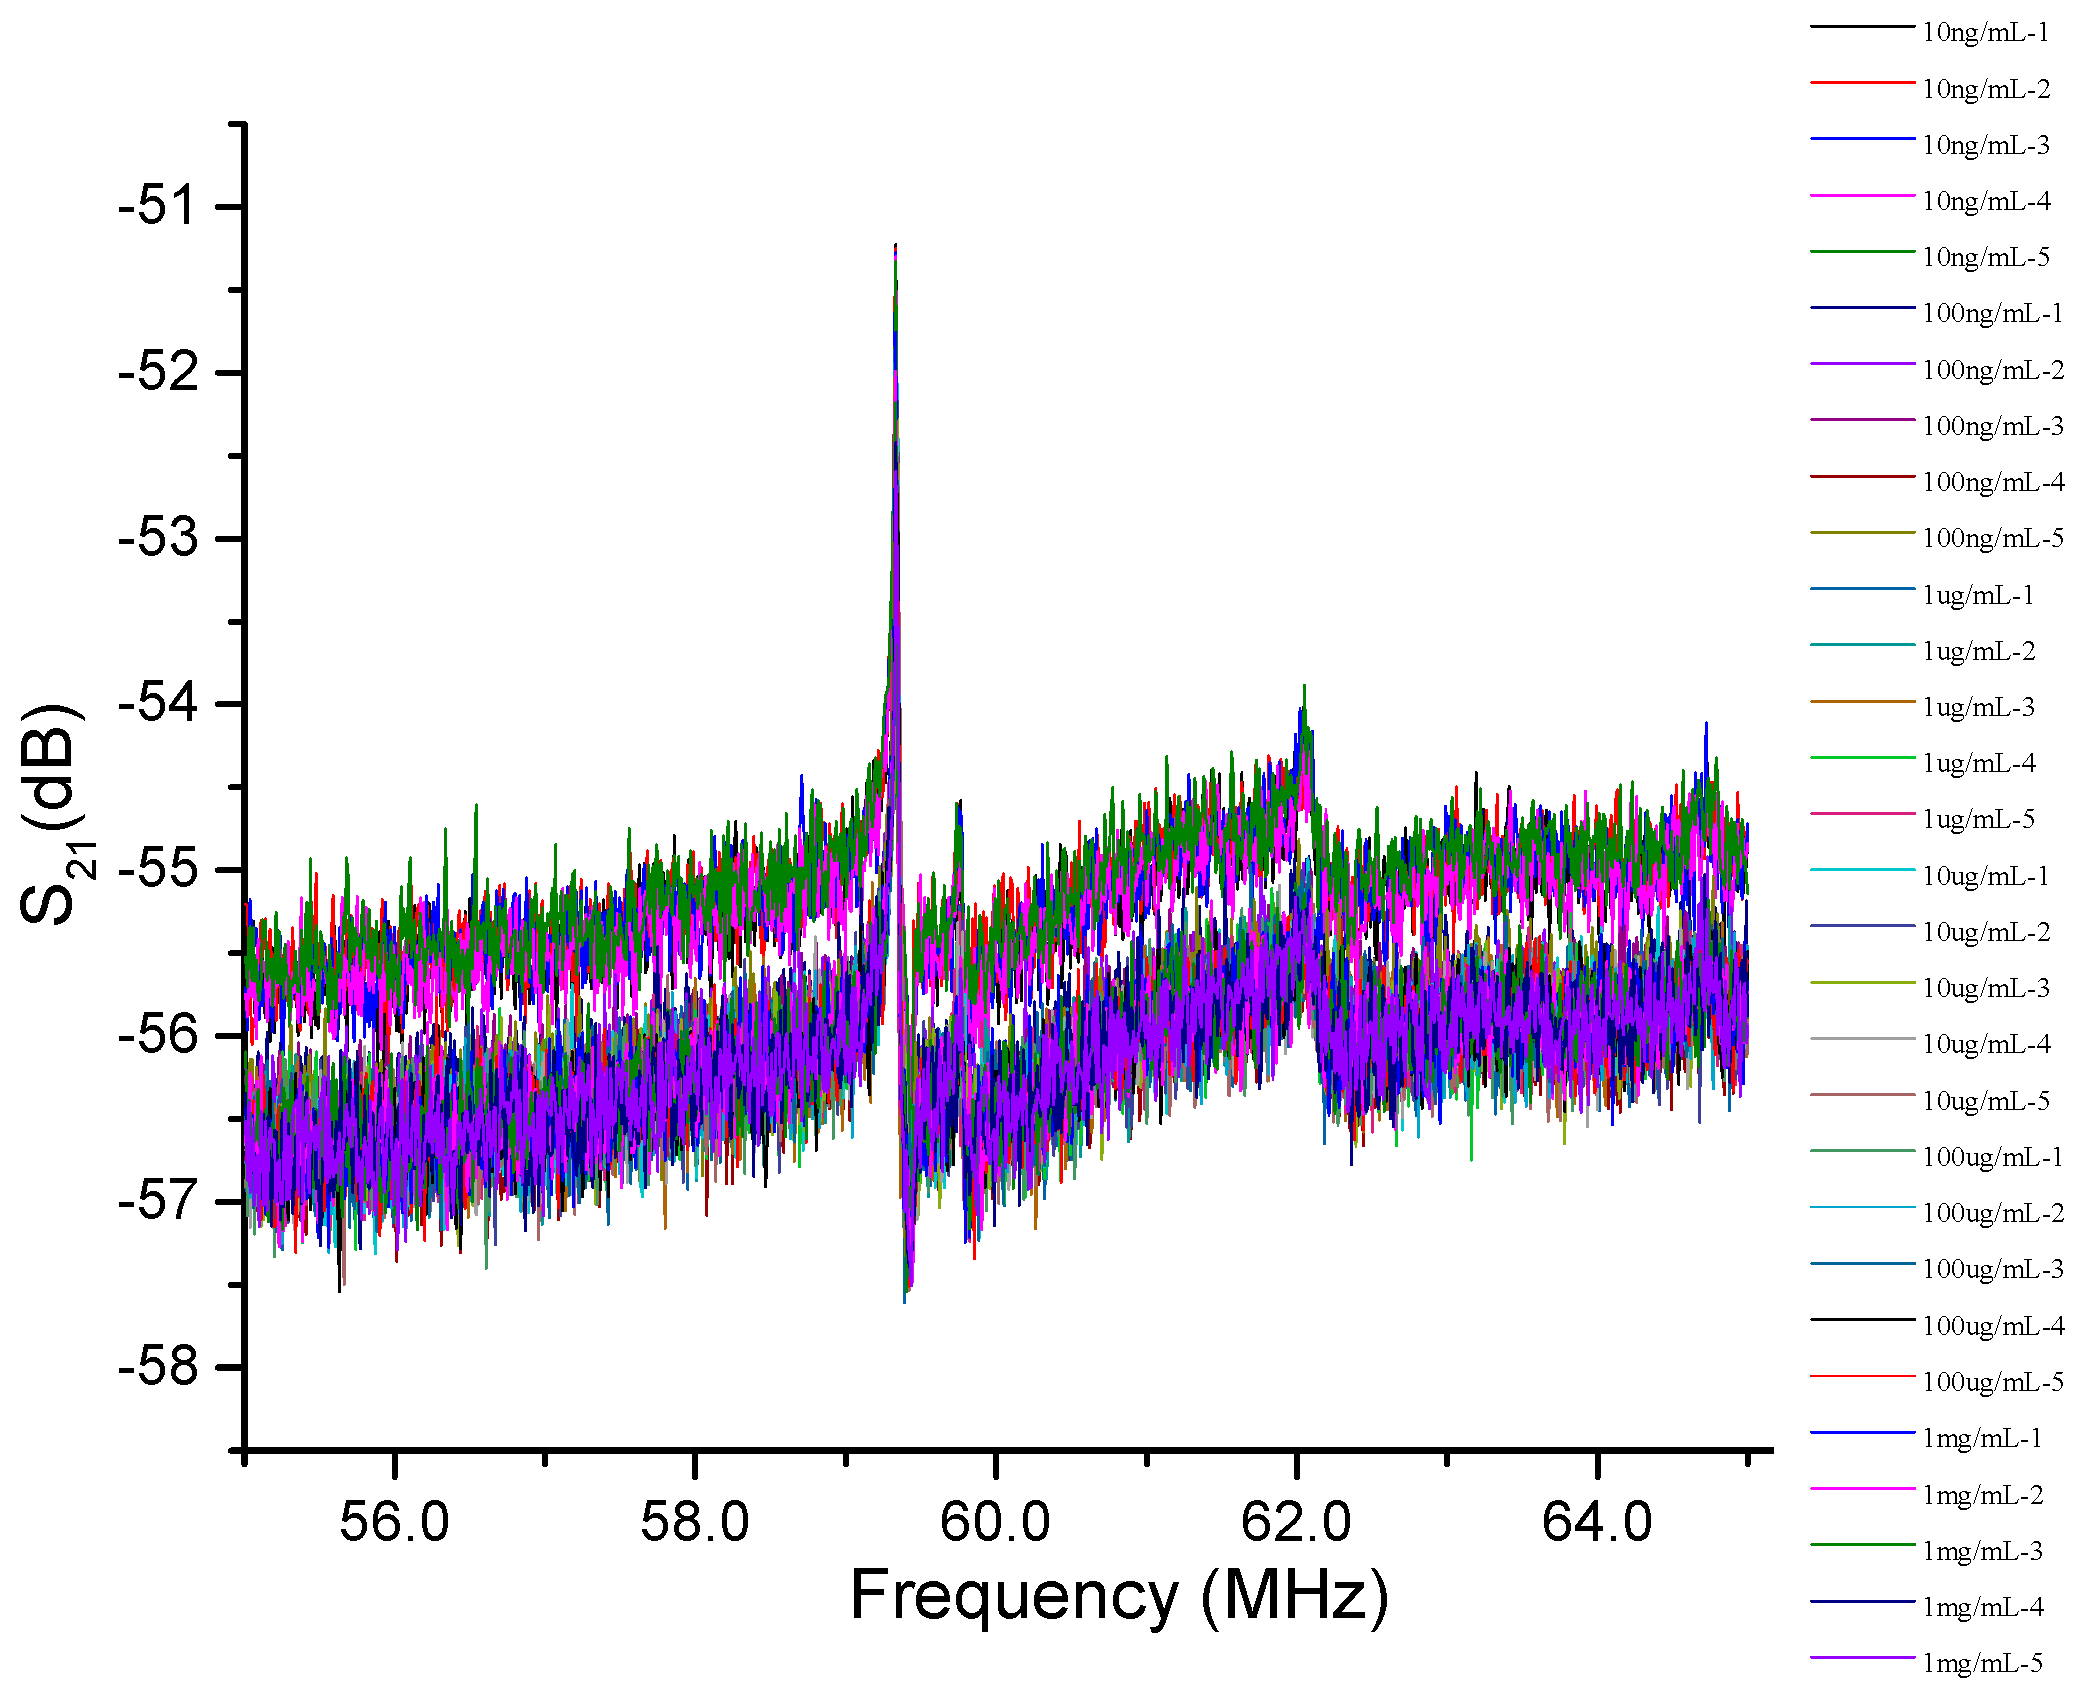
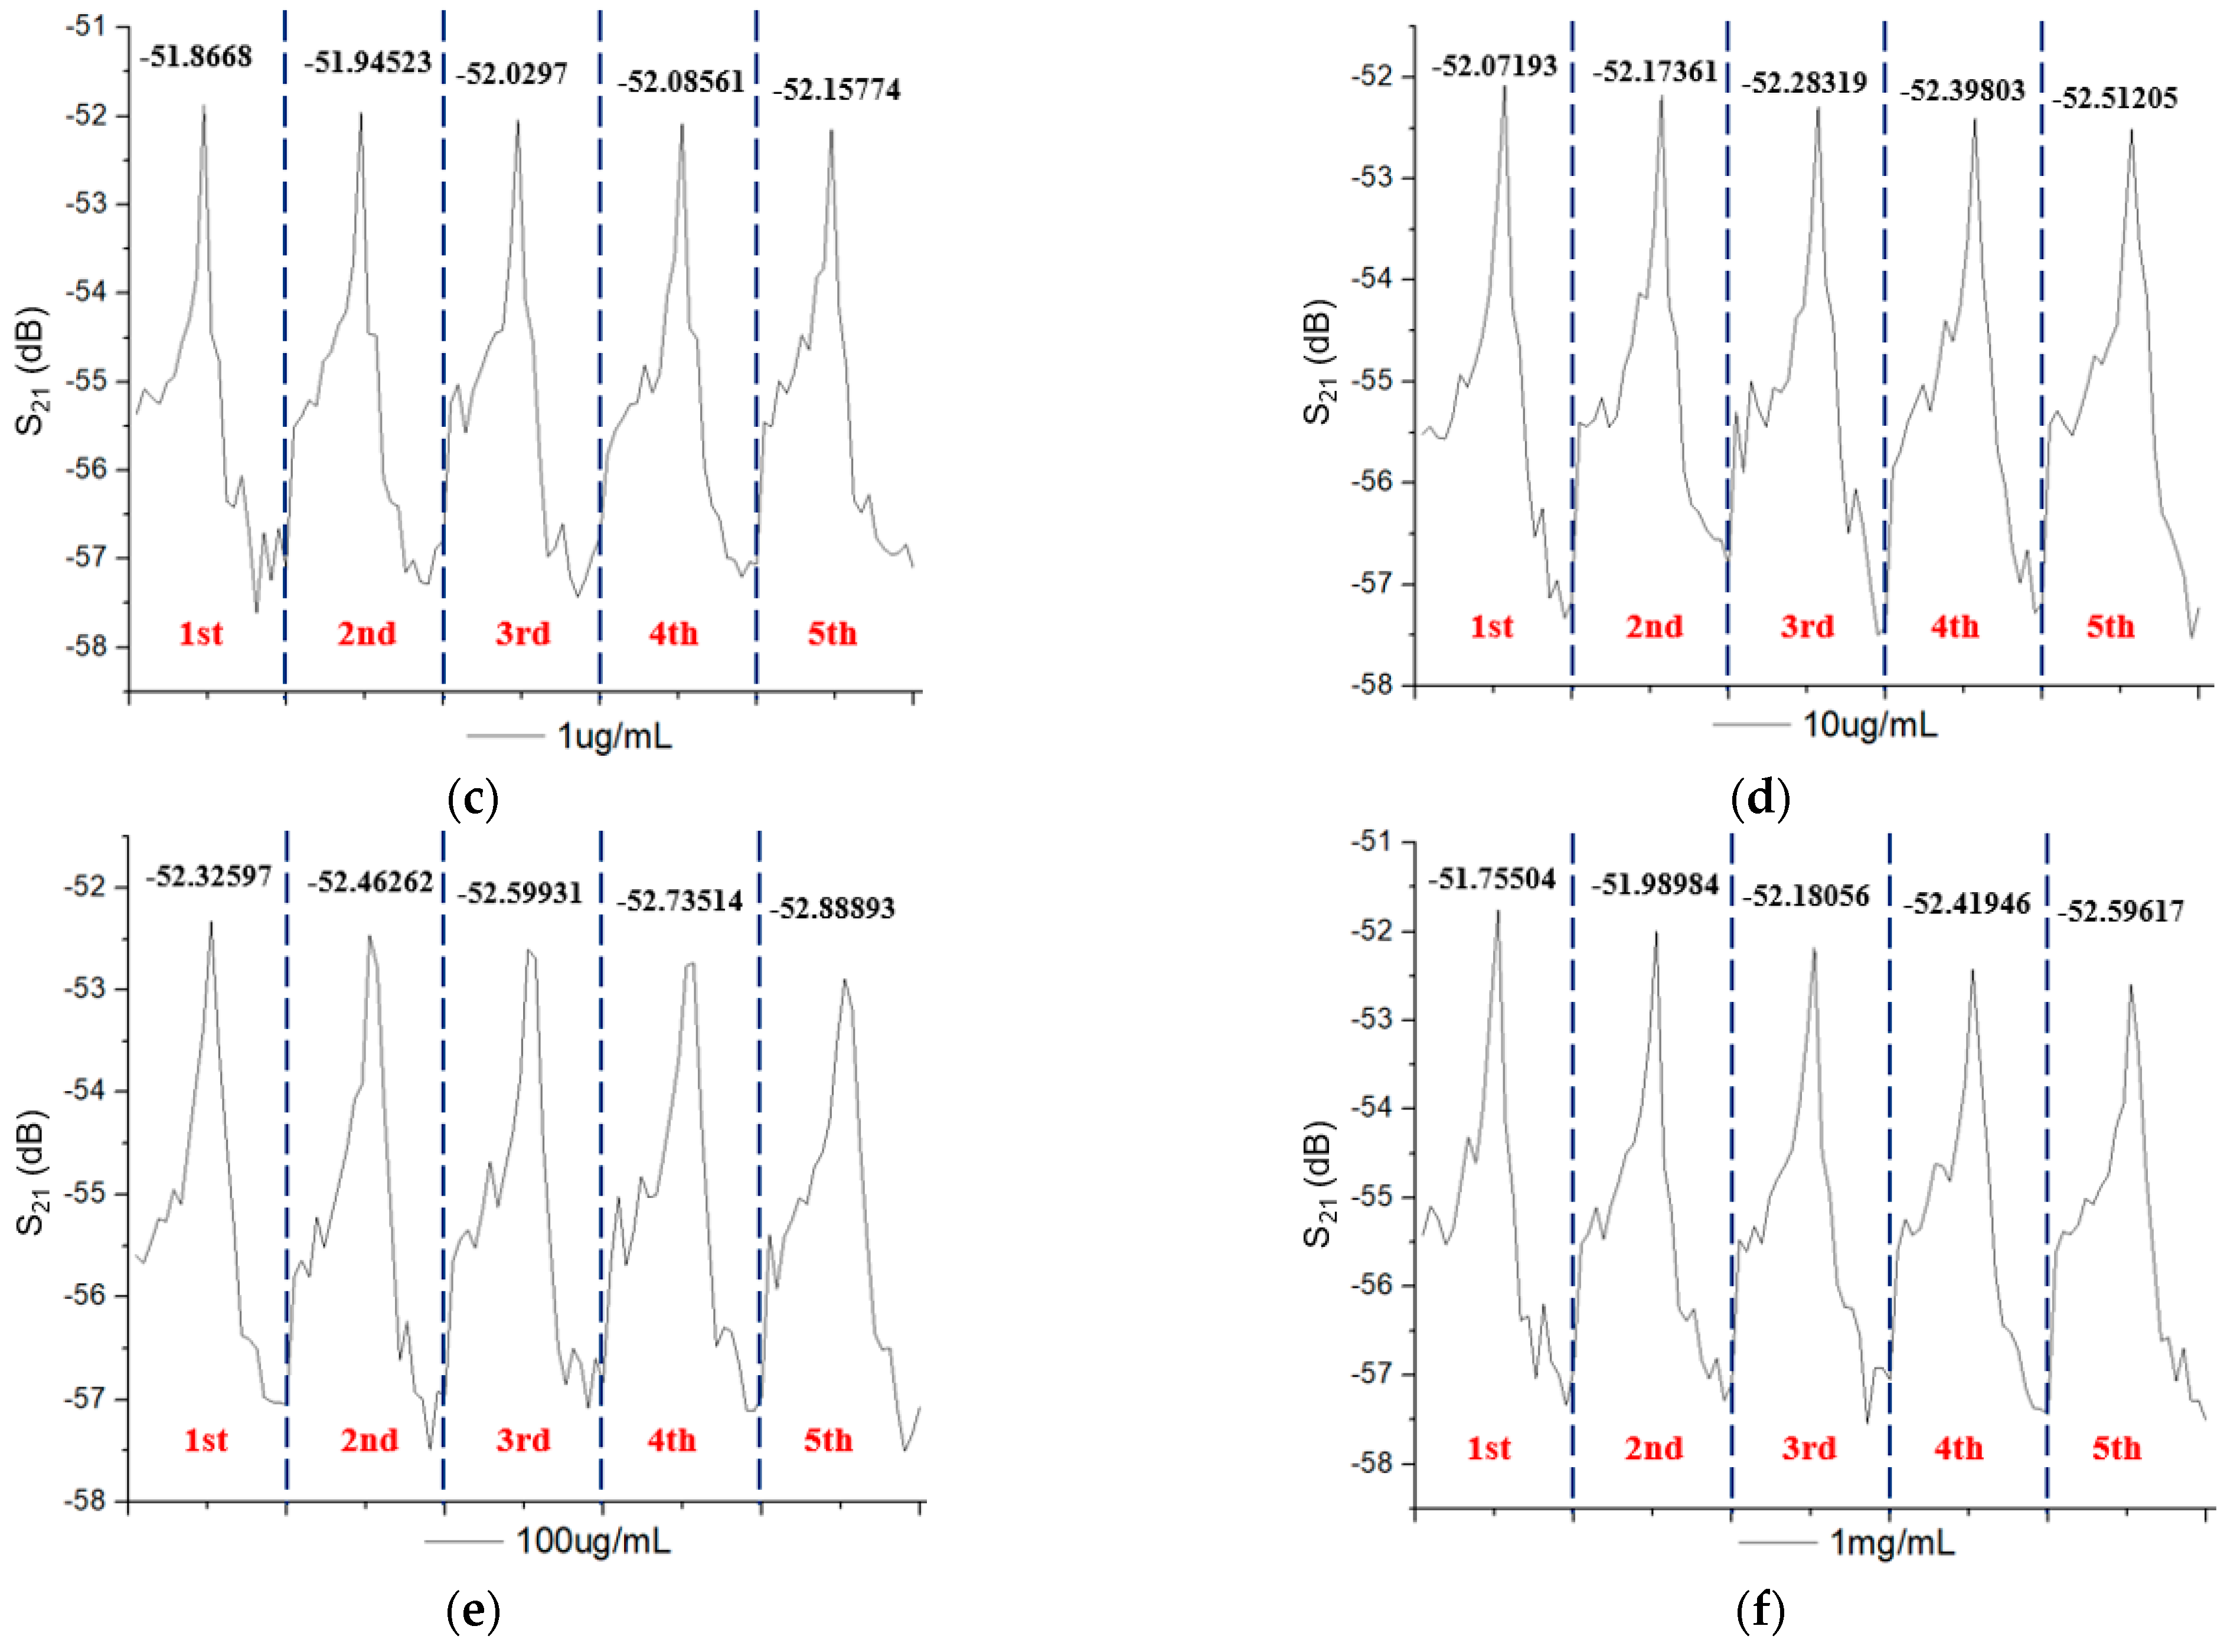
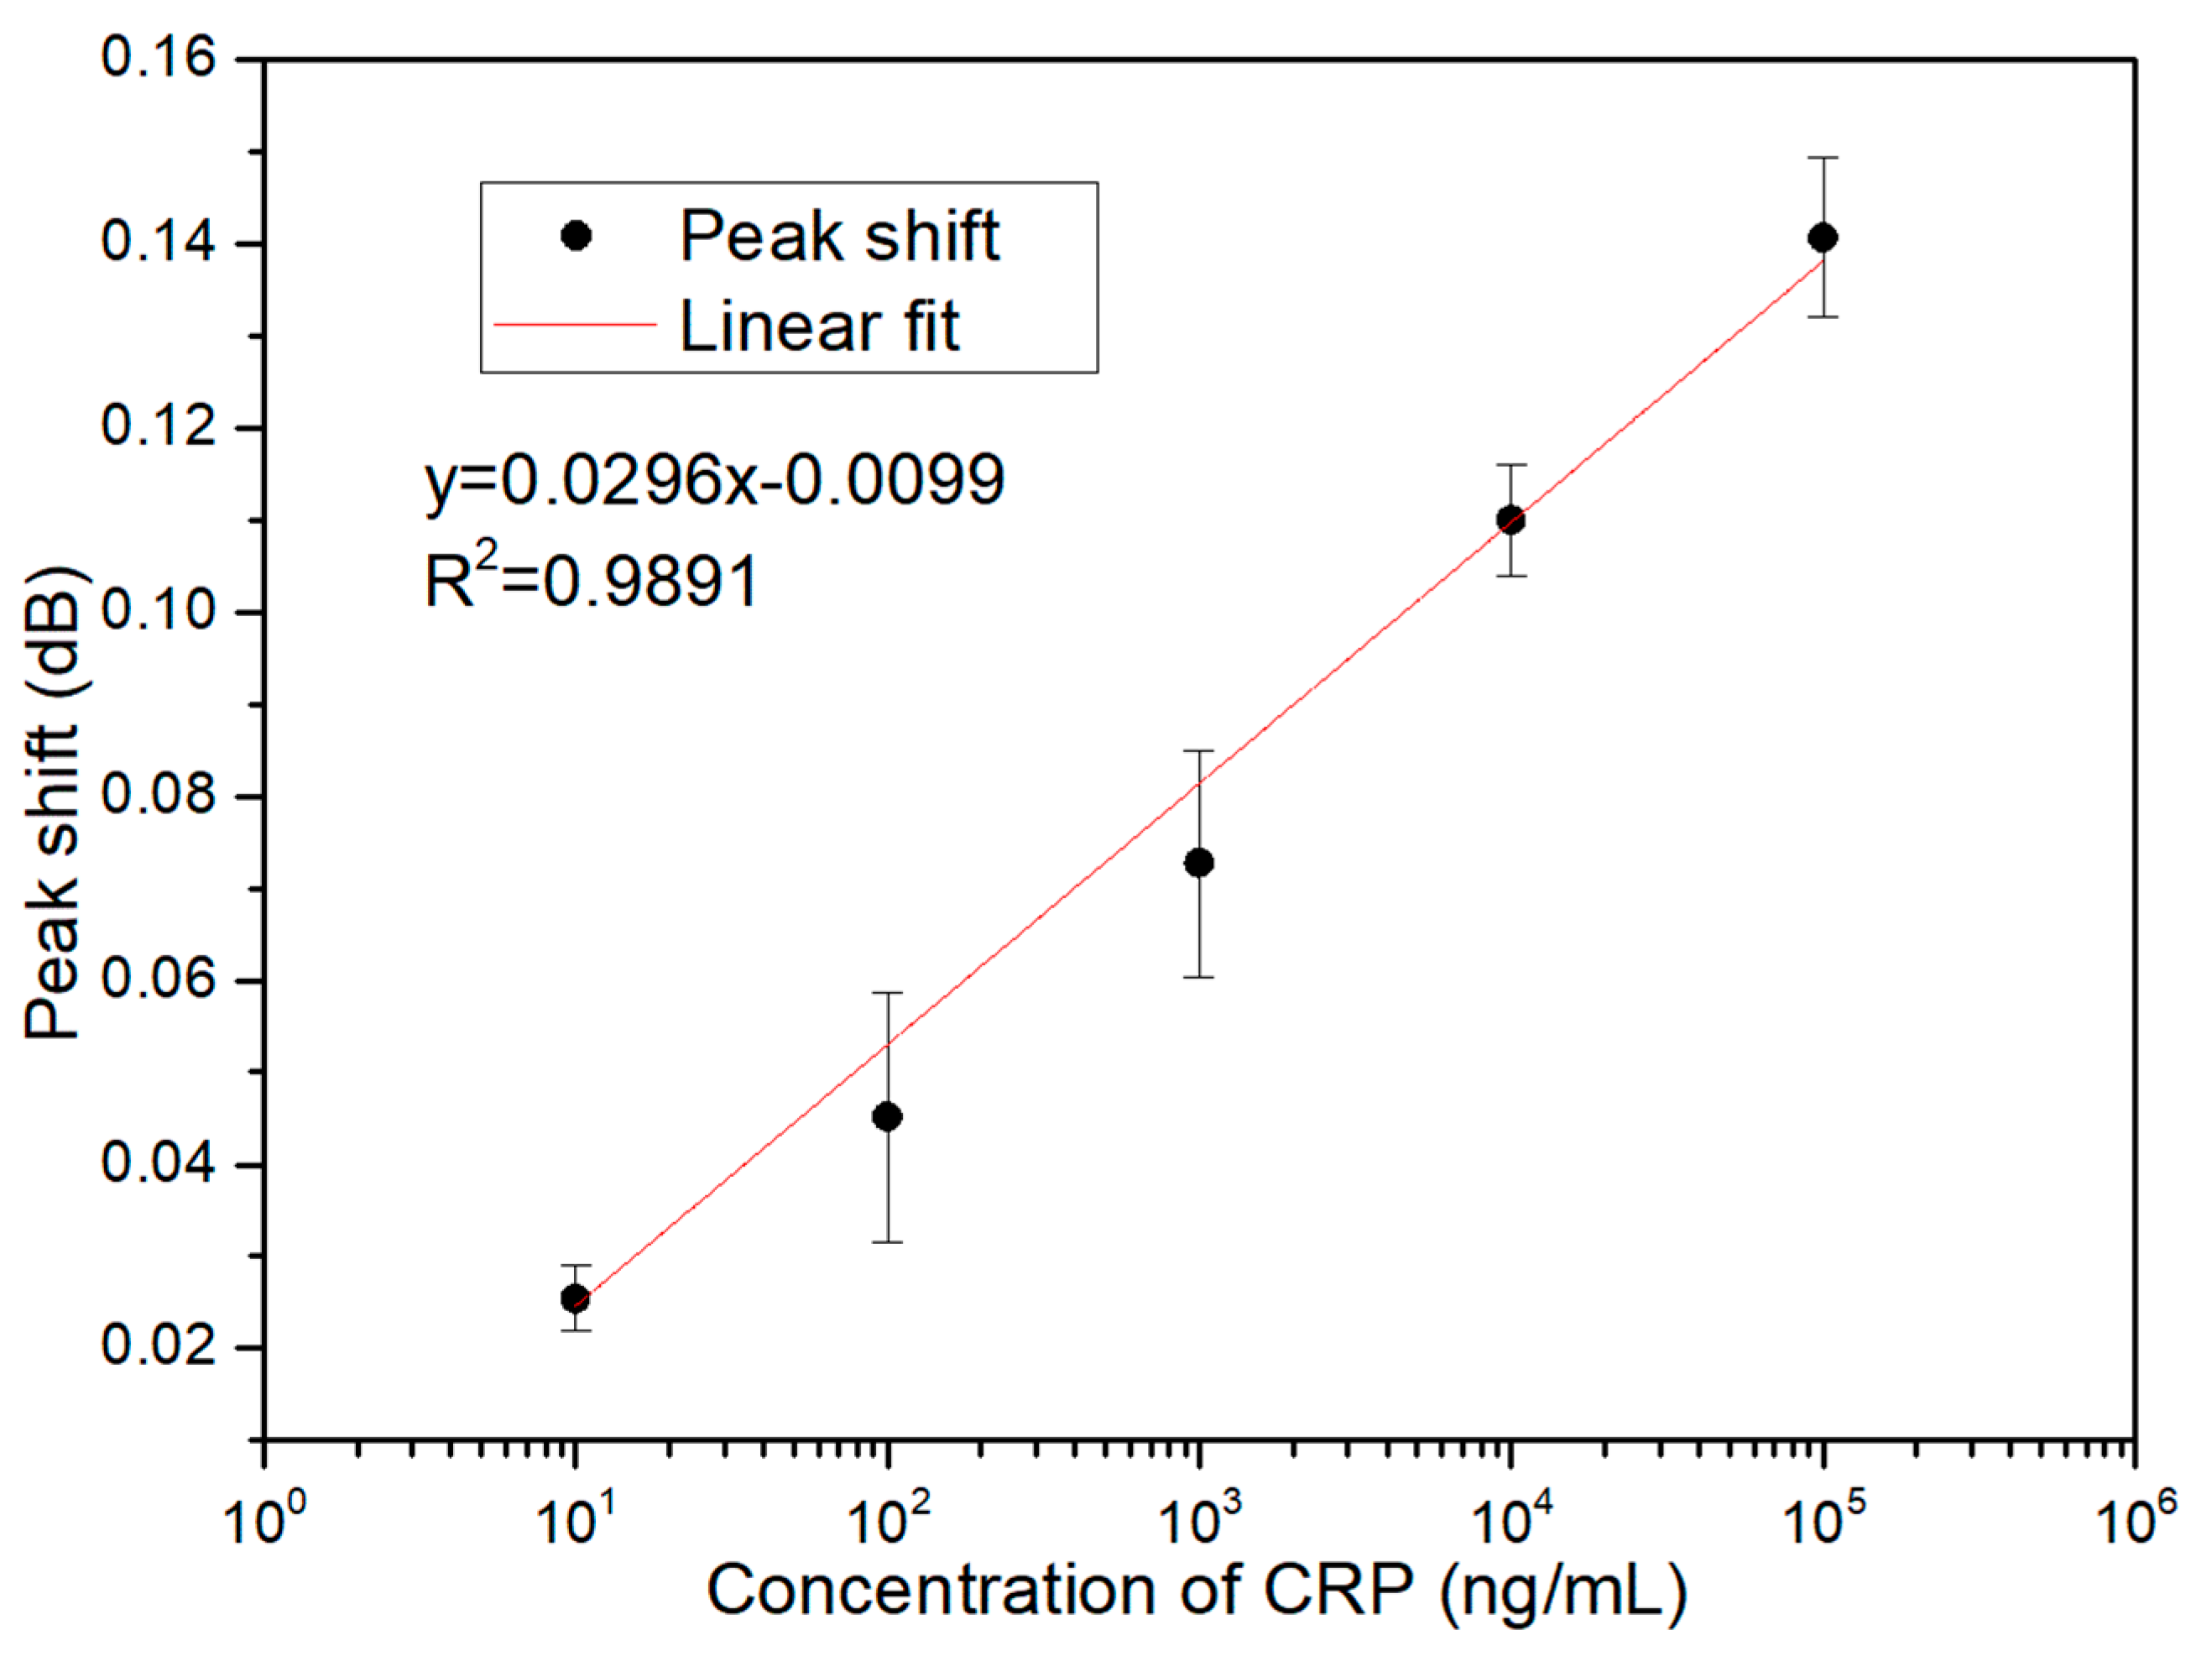
| Concentration of CRP (ng/mL) | Peak Shift (dB) | Standard Deviation |
|---|---|---|
| 10 | 0.02537 | 0.00356 |
| 100 | 0.04514 | 0.01363 |
| 1000 | 0.07274 | 0.01230 |
| 10,000 | 0.11003 | 0.00603 |
| 100,000 | 0.14074 | 0.00871 |
| 1,000,000 | 0.22570 | 0.02339 |
| Residuals | Intercepts | ||
|---|---|---|---|
| Standard Deviation | LOD (ng/mL) | Standard Deviation | LOD (ng/mL) |
| 0.00568 | 3.76 | 0.00595 | 4.01 |
Publisher’s Note: MDPI stays neutral with regard to jurisdictional claims in published maps and institutional affiliations. |
© 2021 by the authors. Licensee MDPI, Basel, Switzerland. This article is an open access article distributed under the terms and conditions of the Creative Commons Attribution (CC BY) license (https://creativecommons.org/licenses/by/4.0/).
Share and Cite
Jeng, M.-J.; Li, Y.-C.; Sharma, M.; Chen, C.-W.; Tsai, C.-L.; Lin, Y.-H.; Huang, S.-F.; Chang, L.-B.; Lai, C.-S. A Surface Acoustic Wave Sensor with a Microfluidic Channel for Detecting C-Reactive Protein. Chemosensors 2021, 9, 106. https://0-doi-org.brum.beds.ac.uk/10.3390/chemosensors9050106
Jeng M-J, Li Y-C, Sharma M, Chen C-W, Tsai C-L, Lin Y-H, Huang S-F, Chang L-B, Lai C-S. A Surface Acoustic Wave Sensor with a Microfluidic Channel for Detecting C-Reactive Protein. Chemosensors. 2021; 9(5):106. https://0-doi-org.brum.beds.ac.uk/10.3390/chemosensors9050106
Chicago/Turabian StyleJeng, Ming-Jer, Ying-Chang Li, Mukta Sharma, Chia-Wei Chen, Chia-Lung Tsai, Yen-Heng Lin, Shiang-Fu Huang, Liann-Be Chang, and Chao-Sung Lai. 2021. "A Surface Acoustic Wave Sensor with a Microfluidic Channel for Detecting C-Reactive Protein" Chemosensors 9, no. 5: 106. https://0-doi-org.brum.beds.ac.uk/10.3390/chemosensors9050106